Embed Size (px)
Citation preview
1
Class 10
Creating Scores and Change Scores, Presenting Measurement Data,
Selecting Standard Survey Items
November 29, 2007
Anita L. Stewart Institute for Health & Aging
University of California, San Francisco

2
Overview of Class 10
Creating summated scales and presenting measurement information
Creating and presenting change scores “The rest of the survey”
– Locating standard survey questions

3
Creating Likert Scale Scores
Translate codebook scoring rules into program code (SAS, SPSS):– Reverse all items that are not already in
desired direction (e.g., higher = better)– Average all items
»Allows score if 1 item is answered
– Apply missing data rule if different »e.g., if more than 50% items missing

4
Program Statements: Creating Summated Scale Scores
From last week (SAS statements)

5
Review Summated Scores
Review scores for out-of-range values, outliers, expected mean
For scores with problems, review programming statements, locate errors and correct
Repeat process until computer algorithm is producing accurate scores– To test programming accuracy, calculate scores by
hand from 2 questionnaires» Check that they match computer generated scores

6
Testing Scaling Properties in Your Sample for Multi-Item Scales
Obtain item-scale correlations– Part of reliability program
– Each item correlates at least .30 with the total scale (corrected for overlap)
7
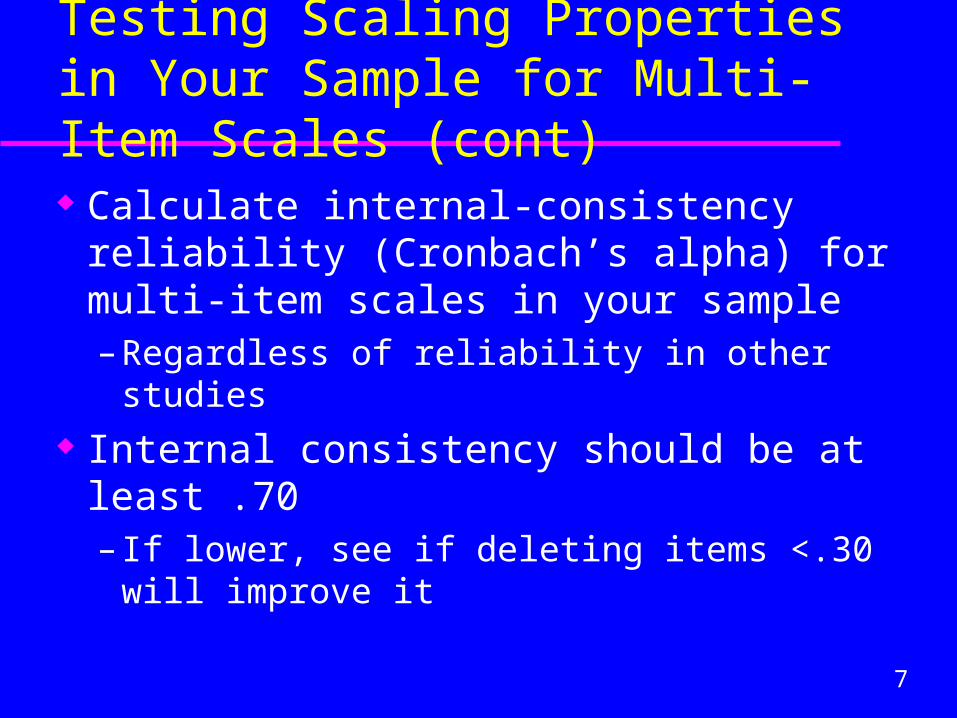
Testing Scaling Properties in Your Sample for Multi-Item Scales (cont)
Calculate internal-consistency reliability (Cronbach’s alpha) for multi-item scales in your sample – Regardless of reliability in other studies
Internal consistency should be at least .70– If lower, see if deleting items <.30 will
improve it
8
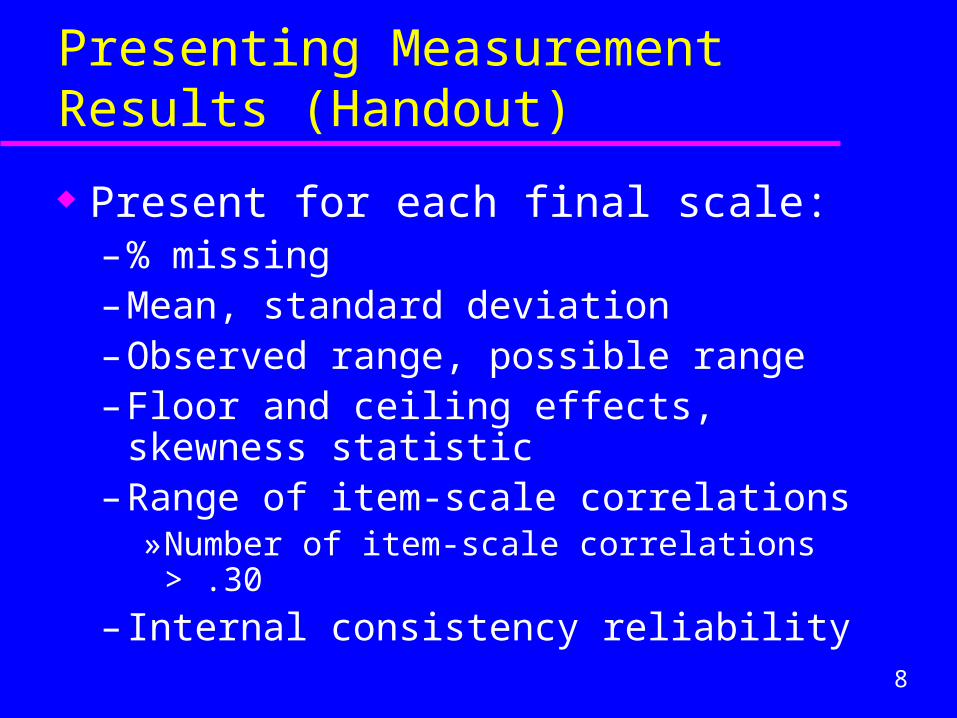
Presenting Measurement Results (Handout)
Present for each final scale:– % missing– Mean, standard deviation– Observed range, possible range– Floor and ceiling effects, skewness statistic– Range of item-scale correlations
» Number of item-scale correlations > .30
– Internal consistency reliability
9
Overview of Class 10
Creating summated scales and presenting measurement information
Creating and presenting change scores “The rest of the survey”
– Locating standard survey questions
10
Change Scores are Important Variables!
Creating change score variables is complex– Requires thought ahead of time
Don’t rely on your programmer Include specification of change scores in
your codebook
11
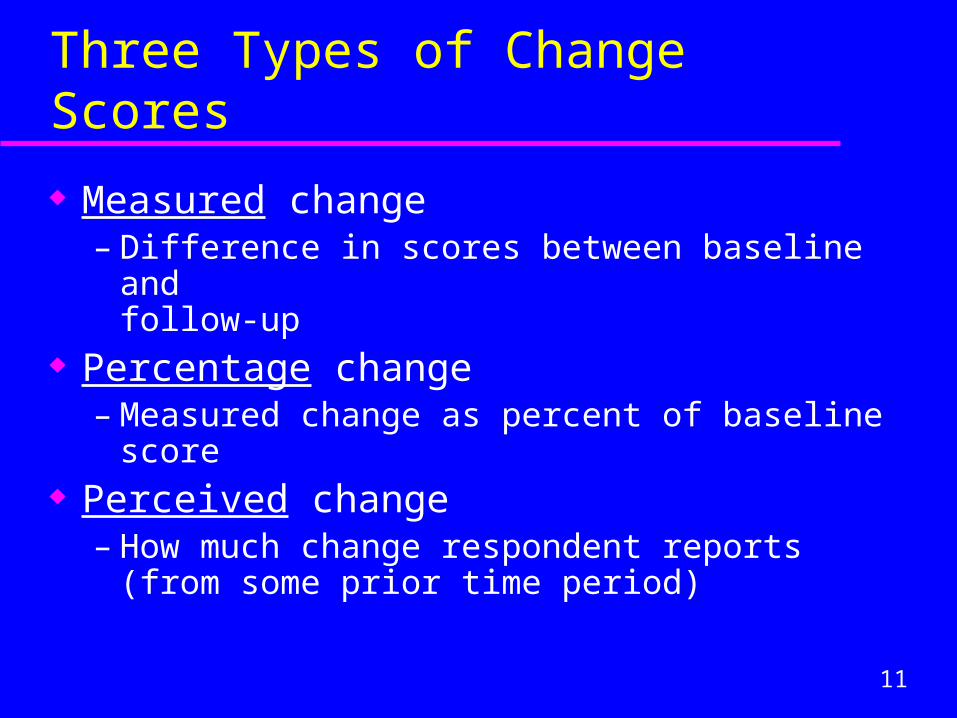
Three Types of Change Scores
Measured change– Difference in scores between baseline and
follow-up Percentage change
– Measured change as percent of baseline score Perceived change
– How much change respondent reports (from some prior time period)
12
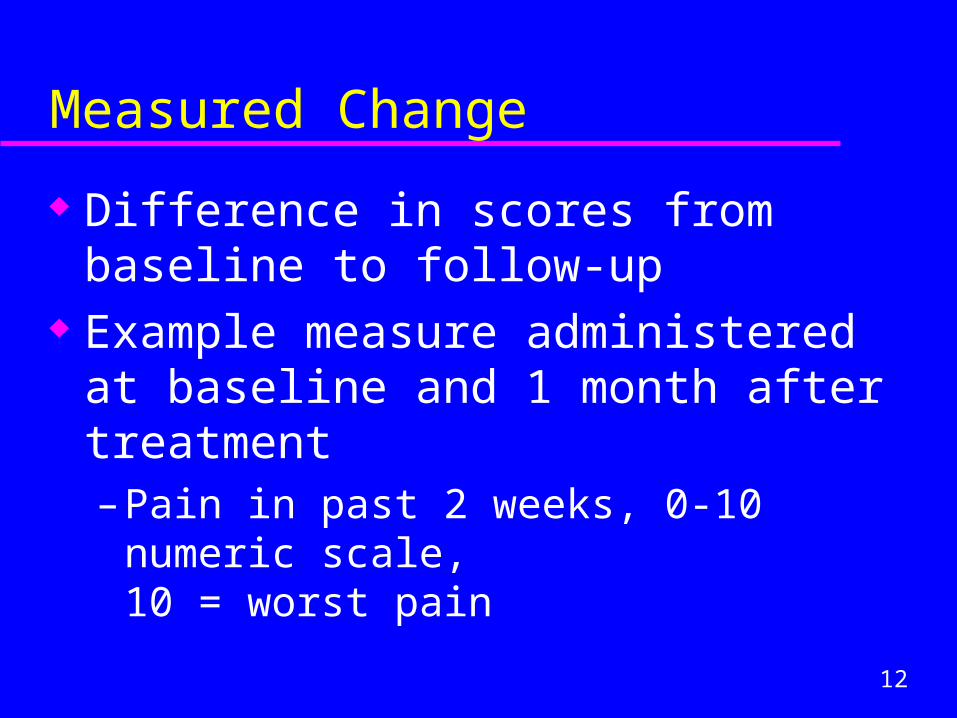
Measured Change
Difference in scores from baseline to follow-up
Example measure administered at baseline and 1 month after treatment– Pain in past 2 weeks, 0-10 numeric scale,
10 = worst pain
13
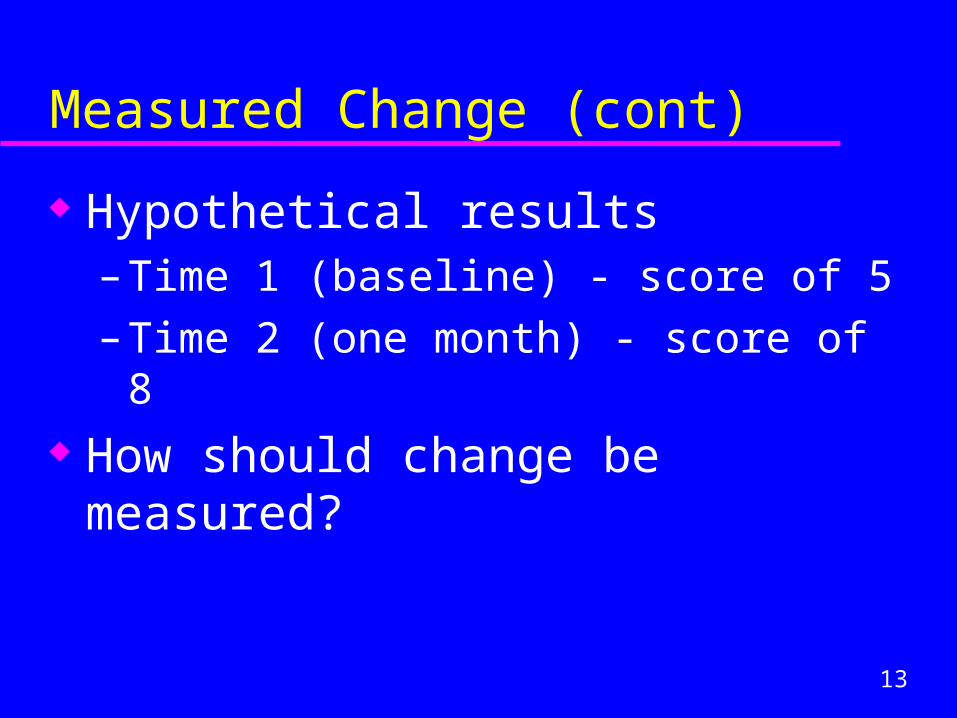
Measured Change (cont)
Hypothetical results– Time 1 (baseline) - score of 5
– Time 2 (one month) - score of 8 How should change be measured?

14
Measured Change (cont)
Time 1 (baseline) - score of 5Time 2 (one month) - score of 8
How should change be measured? Two options:
– Time 2 minus time 1
– Time 1 minus time 2

15
Measured Change (cont)
Time 1 (baseline) - score of 5Time 2 (one month) - score of 8
Option one: time 2 minus time 1= +3 Option two: time 1 minus time 2 = -3 Interpretation of change score?
16
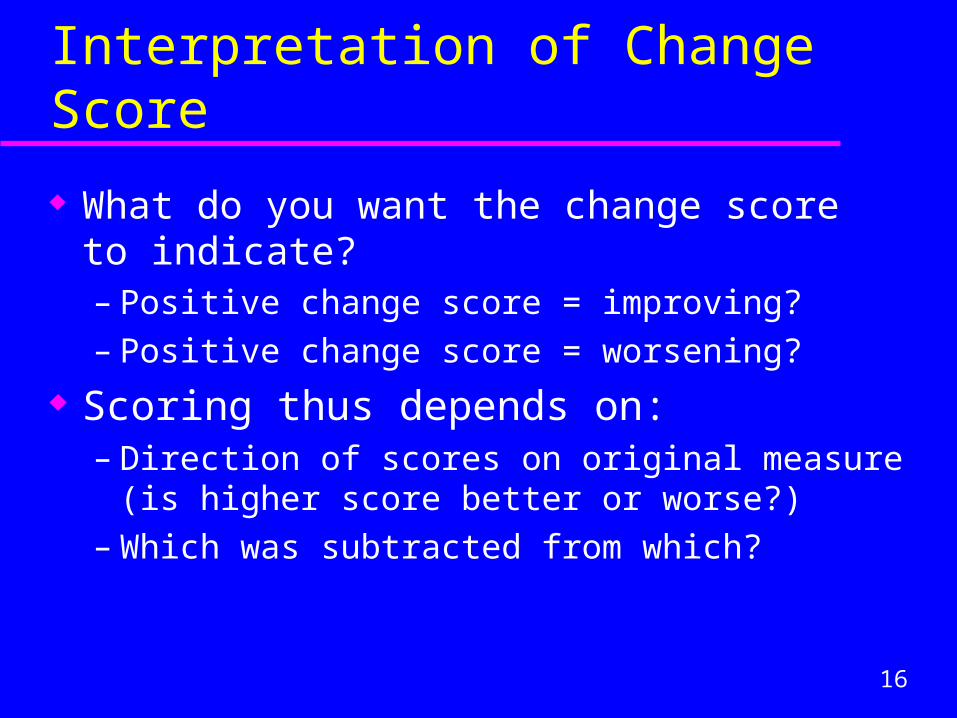
Interpretation of Change Score
What do you want the change score to indicate? – Positive change score = improving?– Positive change score = worsening?
Scoring thus depends on:– Direction of scores on original measure (is higher
score better or worse?)– Which was subtracted from which?
17
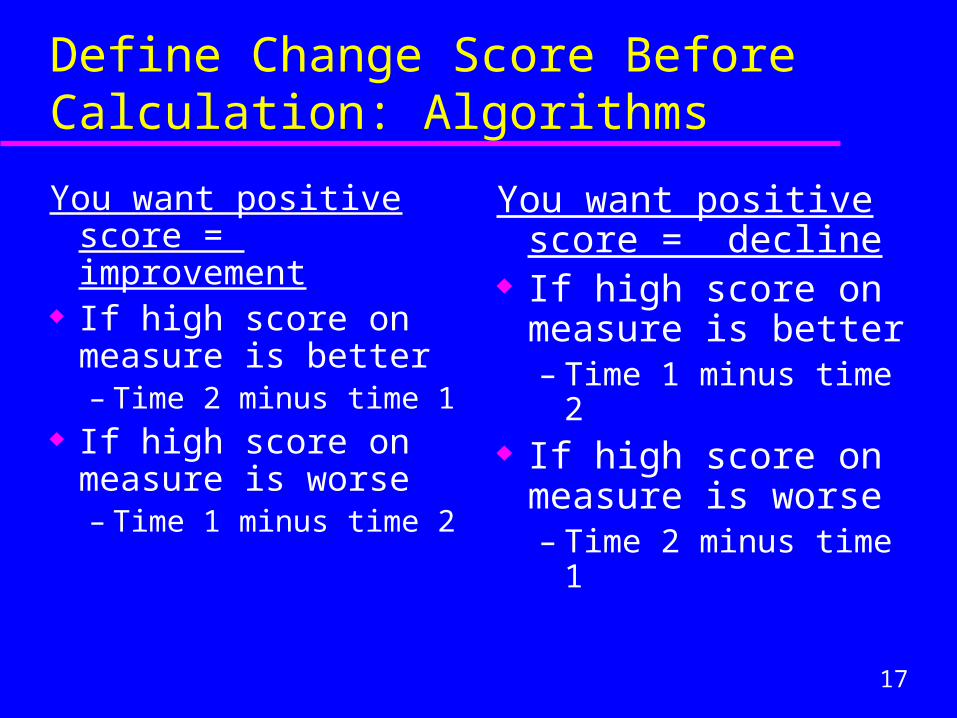
Define Change Score Before Calculation: Algorithms
You want positive score = improvement
If high score on measure is better– Time 2 minus time 1
If high score on measure is worse– Time 1 minus time 2
You want positive score = decline
If high score on measure is better– Time 1 minus time 2
If high score on measure is worse– Time 2 minus time 1
18
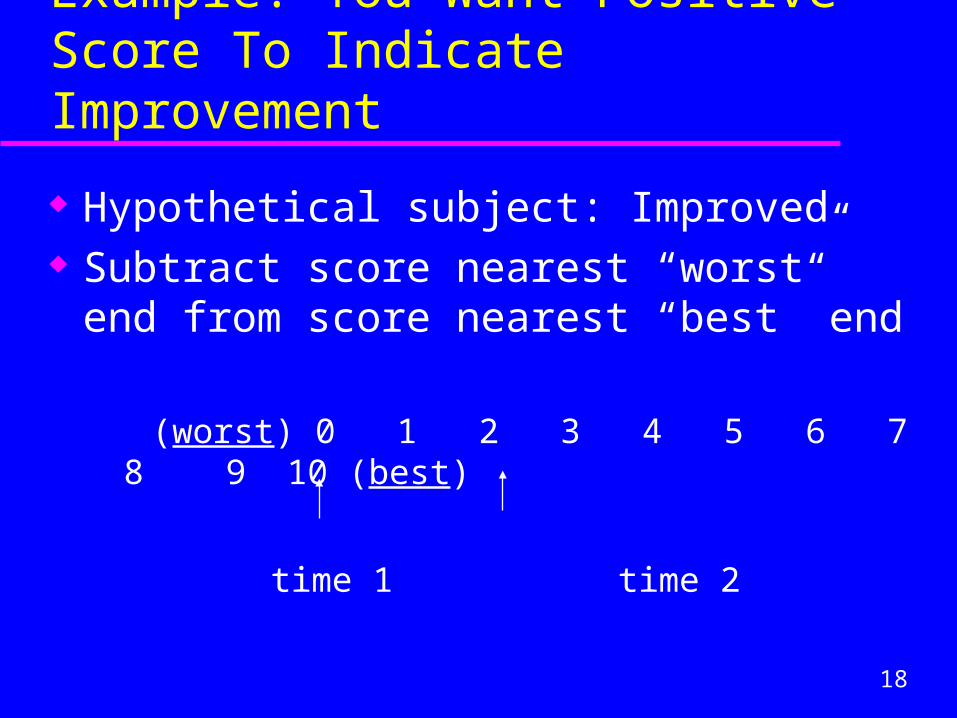
Example: You Want Positive Score To Indicate Improvement
Hypothetical subject: Improved Subtract score nearest “worst” end from
score nearest “best” end
(worst) 0 1 2 3 4 5 6 7 8 9 10 (best)
time 1 time 2
19
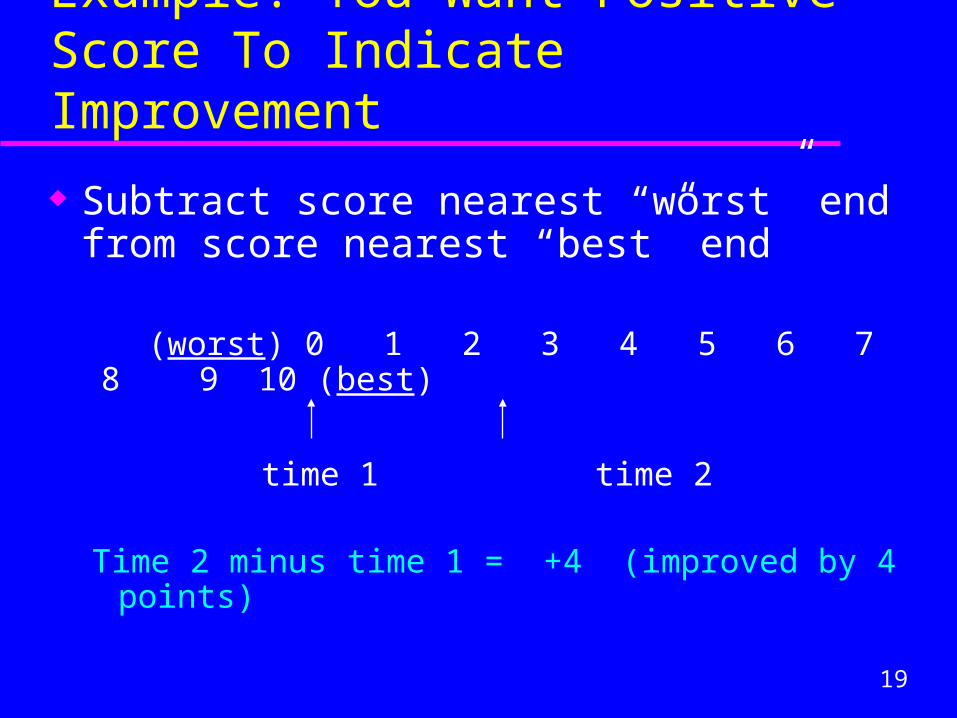
Example: You Want Positive Score To Indicate Improvement
Subtract score nearest “worst” end from score nearest “best” end
(worst) 0 1 2 3 4 5 6 7 8 9 10 (best)
time 1 time 2
Time 2 minus time 1 = +4 (improved by 4 points)
20
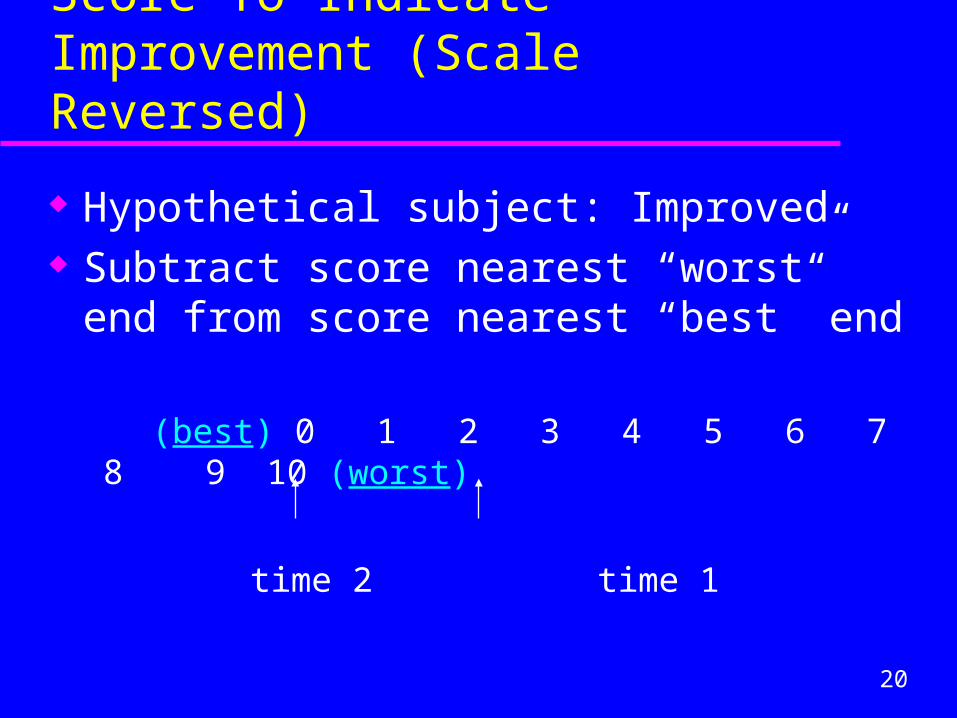
Example: You Want Positive Score To Indicate Improvement (Scale Reversed)
Hypothetical subject: Improved Subtract score nearest “worst” end from
score nearest “best” end
(best) 0 1 2 3 4 5 6 7 8 9 10 (worst)
time 2 time 1
21
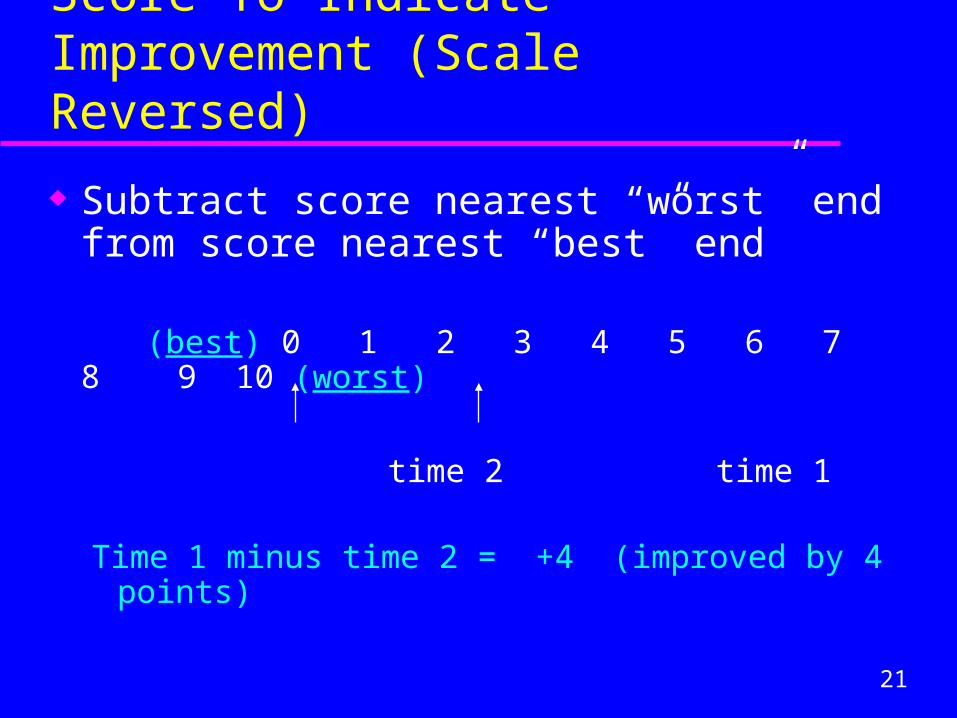
Example: You Want Positive Score To Indicate Improvement (Scale Reversed)
Subtract score nearest “worst” end from score nearest “best” end
(best) 0 1 2 3 4 5 6 7 8 9 10 (worst)
time 2 time 1
Time 1 minus time 2 = +4 (improved by 4 points)
22
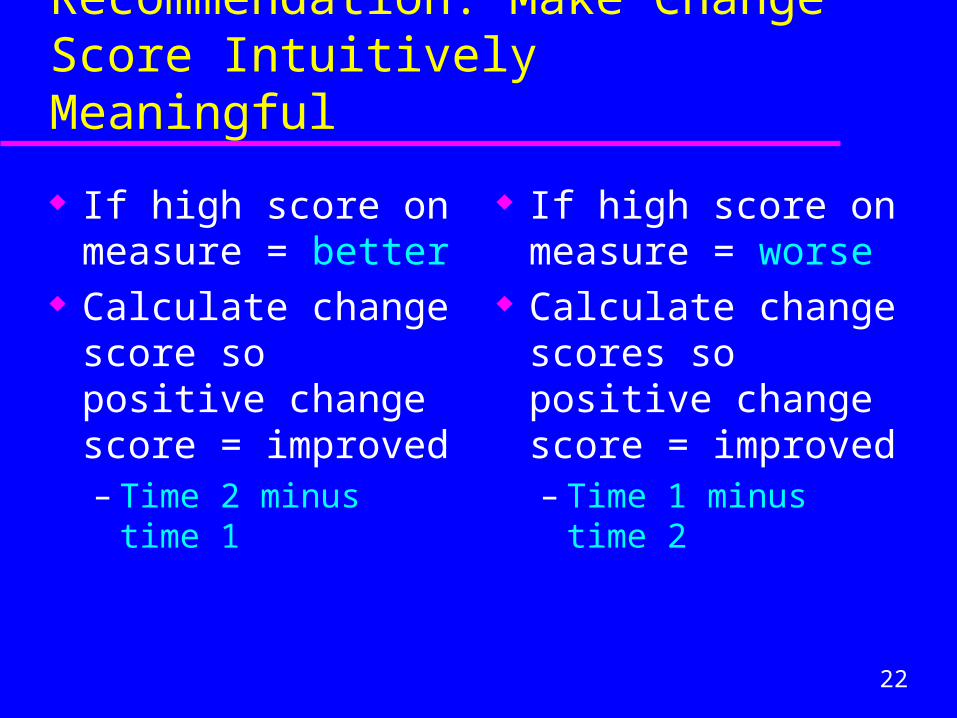
Recommendation: Make Change Score Intuitively Meaningful
If high score on measure = better
Calculate change score so positive change score = improved– Time 2 minus time 1
If high score on measure = worse
Calculate change scores so positive change score = improved– Time 1 minus time 2

23
Interpreting “Measured Change” Scores: What is Wrong?
In a study predicting utilization of health care (outpatient visits) over a 1-year period as a function of self-efficacy…
A results sentence:– “Reduced utilization at one year was associated
with level of self efficacy at baseline (p < .01) and with 6-month changes in self efficacy (p < .05).”

24
Interpreting “Measured Change” Scores: Making it Clearer
“Reduced outpatient visits at one year were associated with lower levels of self efficacy at baseline (p < .01) and with 6-month improvements in self efficacy.”
Old way:– “Reduced utilization at one year was associated
with level of self efficacy at baseline (p < .01) and with 6-month changes in self-efficacy.”
25
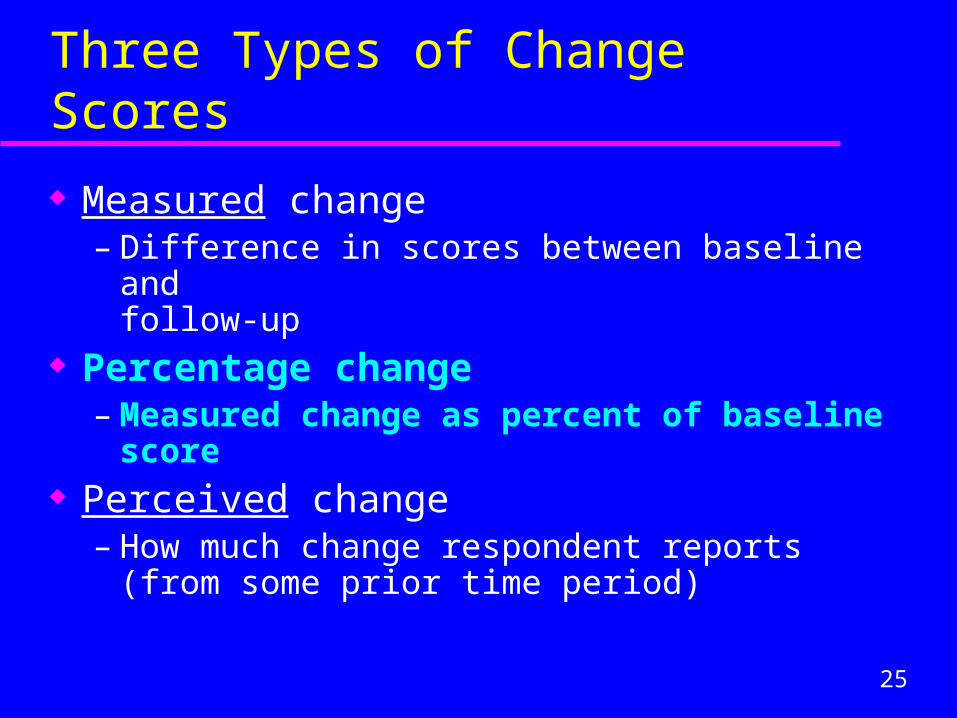
Three Types of Change Scores
Measured change– Difference in scores between baseline and
follow-up Percentage change
– Measured change as percent of baseline score Perceived change
– How much change respondent reports (from some prior time period)
26
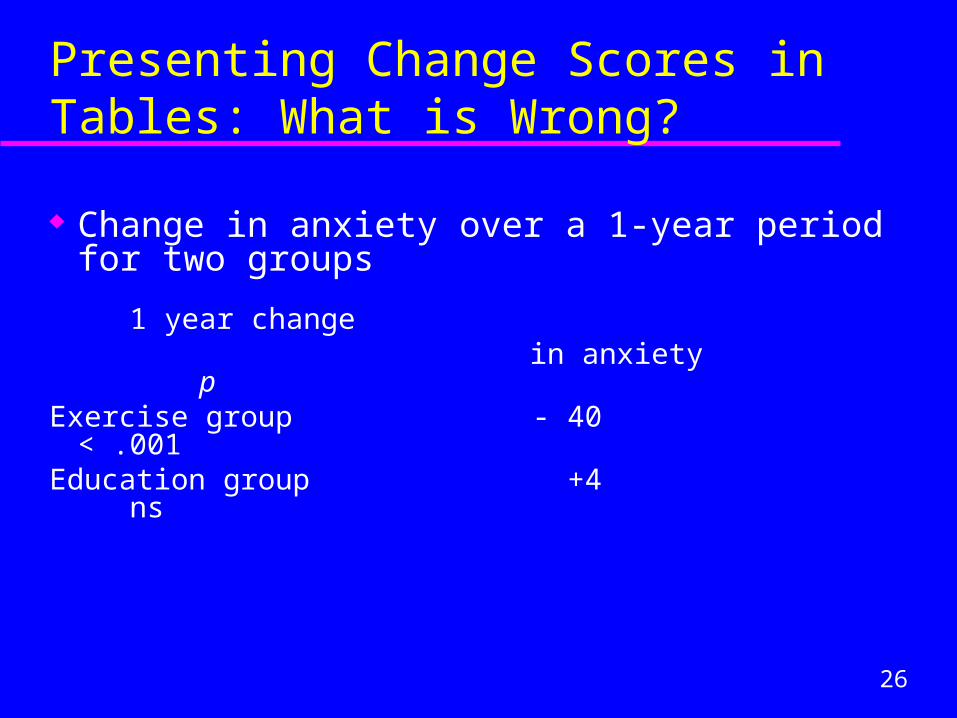
Presenting Change Scores in Tables: What is Wrong?
Change in anxiety over a 1-year period for two groups
1 year change in anxiety p
Exercise group - 40 < .001Education group +4 ns
27
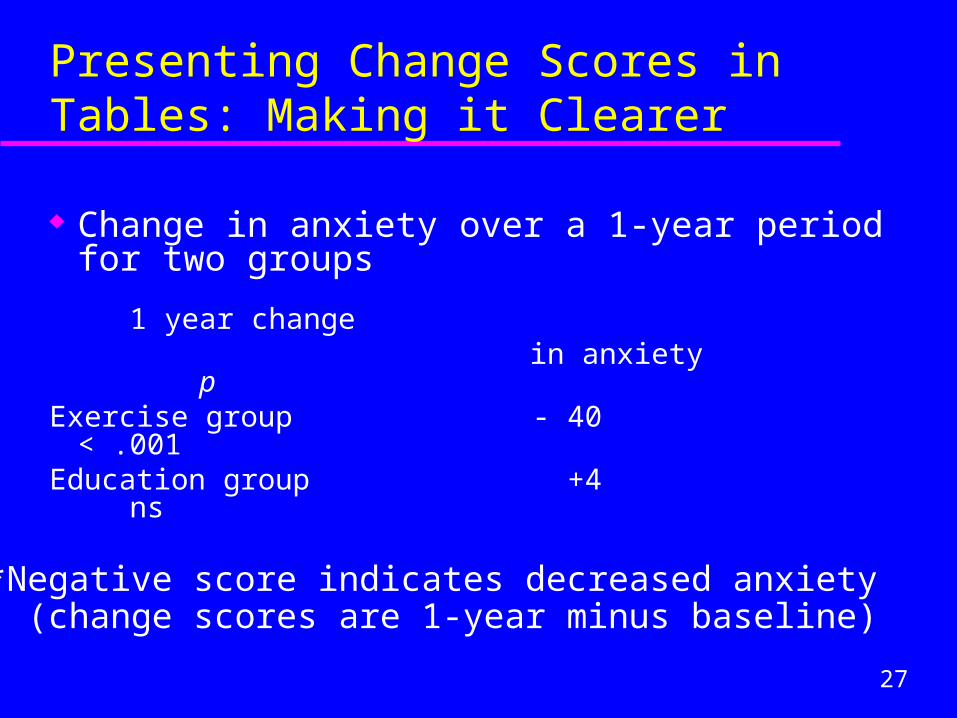
Presenting Change Scores in Tables: Making it Clearer
Change in anxiety over a 1-year period for two groups
1 year change in anxiety p
Exercise group - 40 < .001Education group +4 ns
*Negative score indicates decreased anxiety (change scores are 1-year minus baseline)
28
Reliability of Change Score
Difference scores have been criticized as having low reliability
Nunnally (1994) considers alternatives and suggests this may not be as large a problem as previously thought (p. 247)
Nunnally JC and Bernstein IH. Psychometric Theory, Third Edition, McGraw-Hill, New York, 1994.
29
Percentage Change
Measured change divided by baseline score
Example: pain measure, higher is more pain– change score of -2, baseline score of 6
– 2/6 = 33% reduction in pain
30
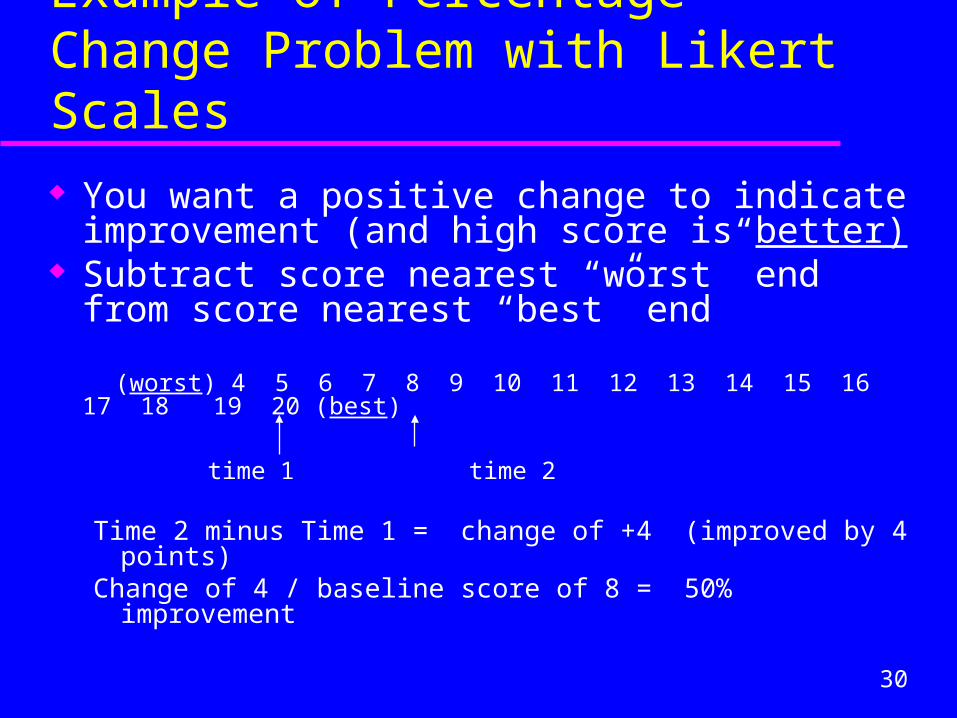
Example of Percentage Change Problem with Likert Scales
You want a positive change to indicate improvement (and high score is better)
Subtract score nearest “worst” end from score nearest “best” end
(worst) 4 5 6 7 8 9 10 11 12 13 14 15 16 17 18 19 20 (best)
time 1 time 2
Time 2 minus Time 1 = change of +4 (improved by 4 points)Change of 4 / baseline score of 8 = 50% improvement
31
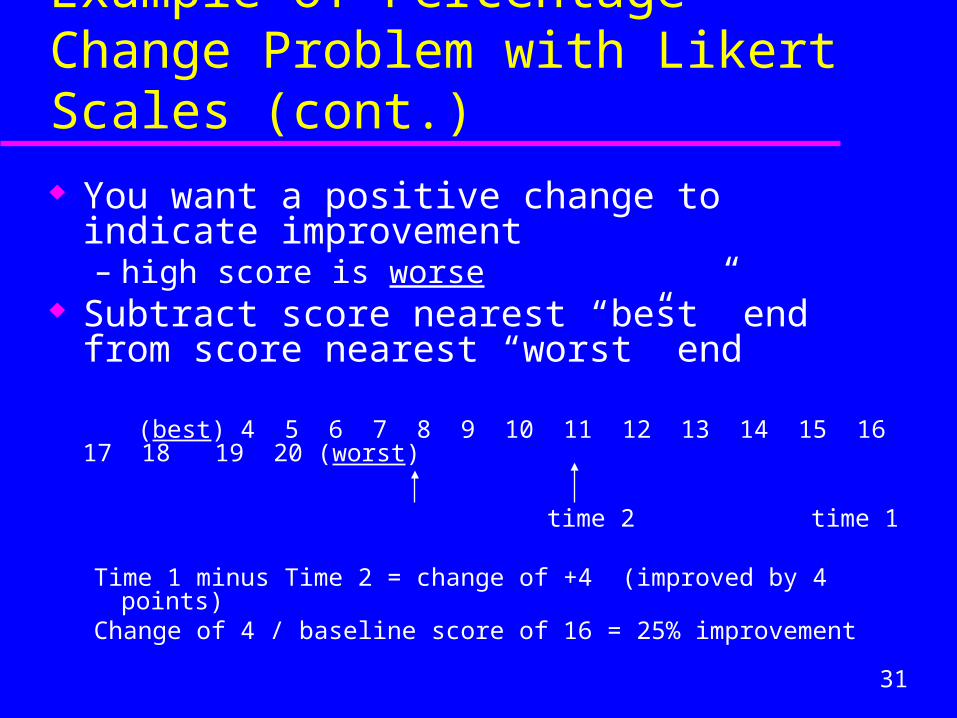
Example of Percentage Change Problem with Likert Scales (cont.)
You want a positive change to indicate improvement– high score is worse
Subtract score nearest “best” end from score nearest “worst” end
(best) 4 5 6 7 8 9 10 11 12 13 14 15 16 17 18 19 20 (worst)
time 2 time 1
Time 1 minus Time 2 = change of +4 (improved by 4 points)Change of 4 / baseline score of 16 = 25% improvement
32
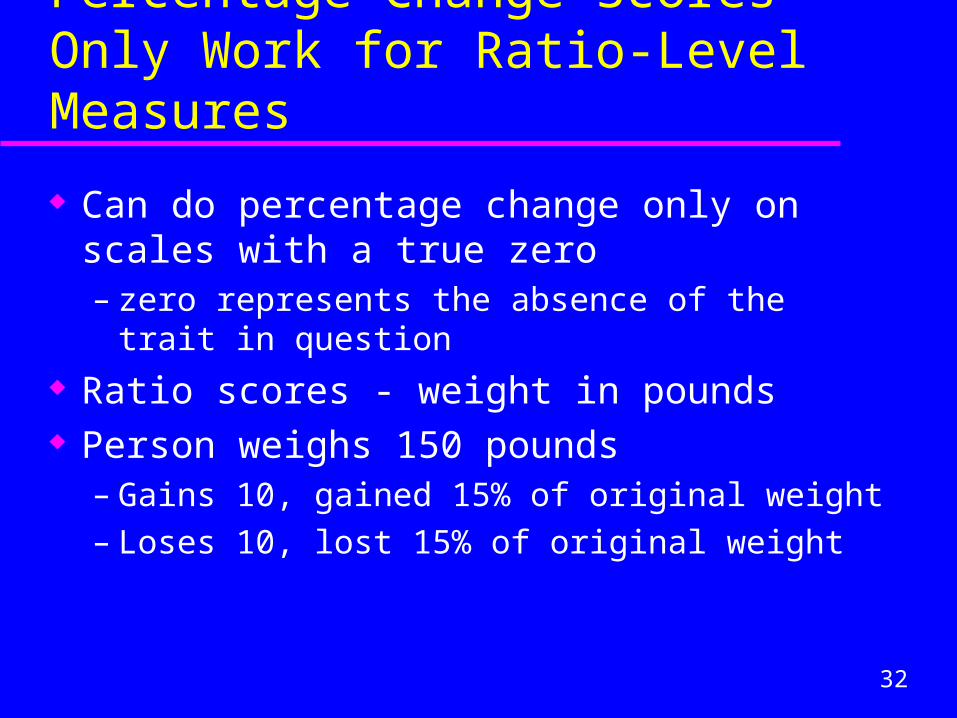
Percentage Change Scores Only Work for Ratio-Level Measures
Can do percentage change only on scales with a true zero– zero represents the absence of the trait in question
Ratio scores - weight in pounds Person weighs 150 pounds
– Gains 10, gained 15% of original weight– Loses 10, lost 15% of original weight
33
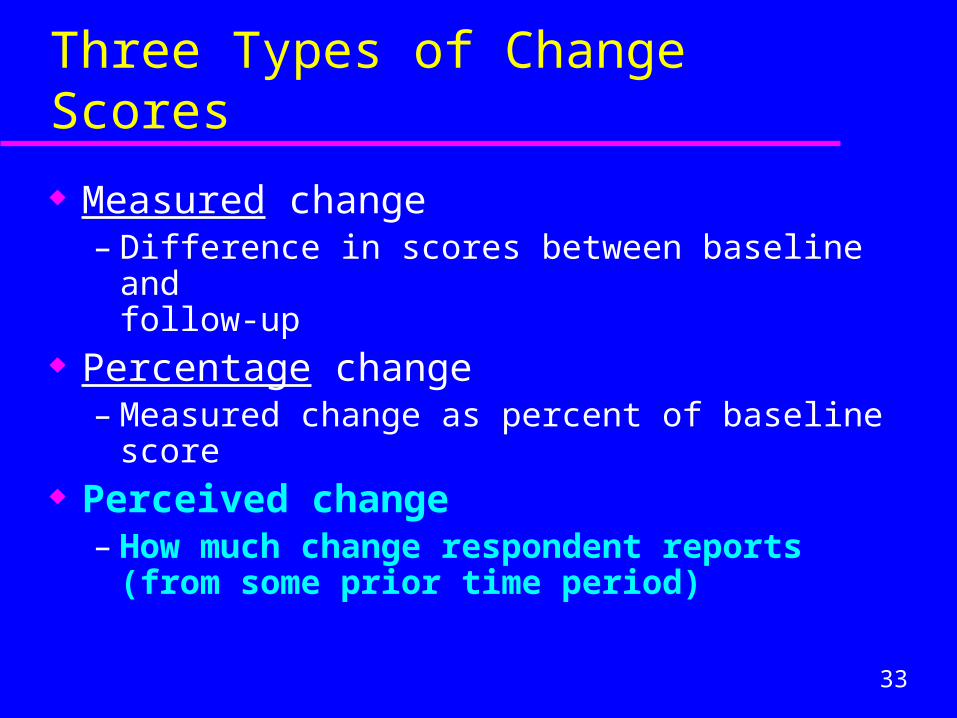
Three Types of Change Scores
Measured change– Difference in scores between baseline and
follow-up Percentage change
– Measured change as percent of baseline score Perceived change
– How much change respondent reports (from some prior time period)
34
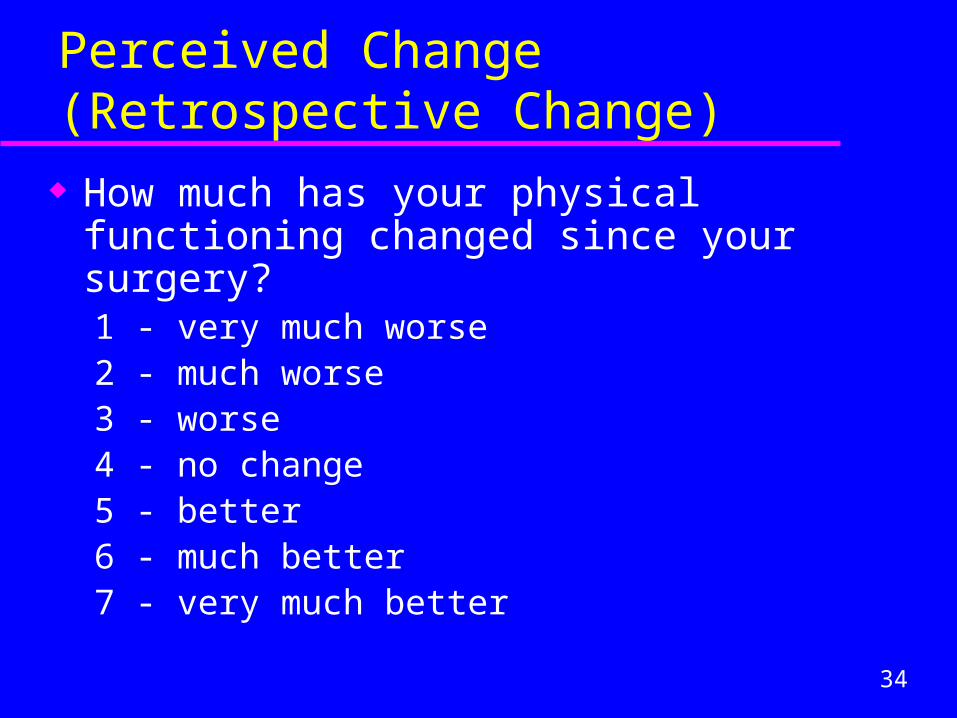
Perceived Change (Retrospective Change)
How much has your physical functioning changed since your surgery?1 - very much worse2 - much worse3 - worse4 - no change5 - better6 - much better7 - very much better
35
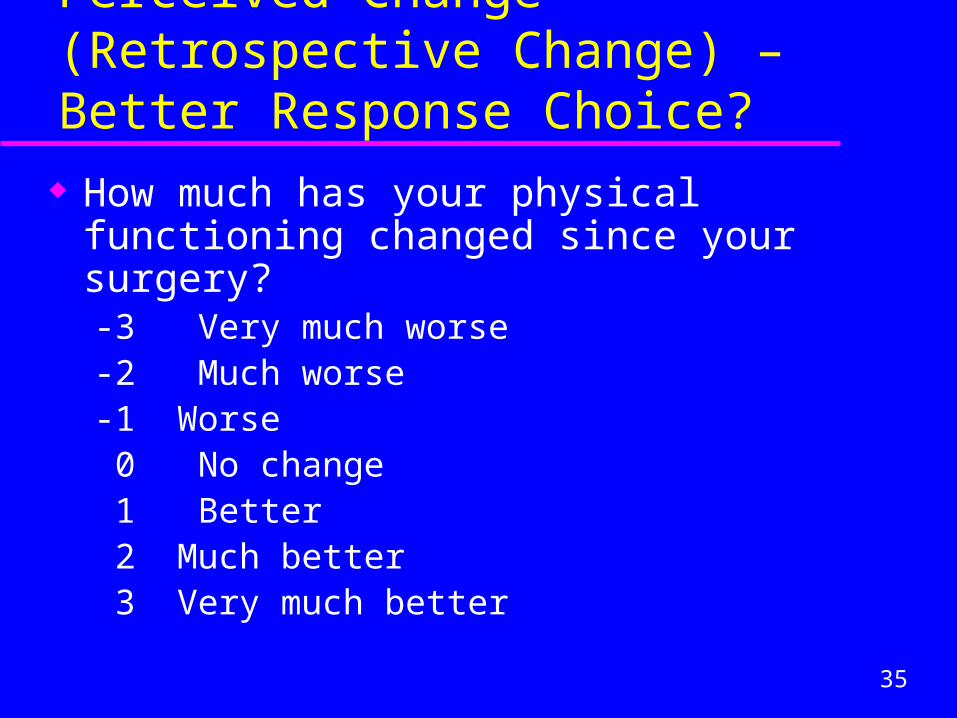
Perceived Change (Retrospective Change) – Better Response Choice?
How much has your physical functioning changed since your surgery?-3 Very much worse-2 Much worse-1 Worse 0 No change 1 Better 2 Much better 3 Very much better

36
Perceived/Retrospective Change
Perceived change enables respondent to define physical functioning in terms of what it means to them
Measured change is a change on specific questions that were contained in the particular measure
37
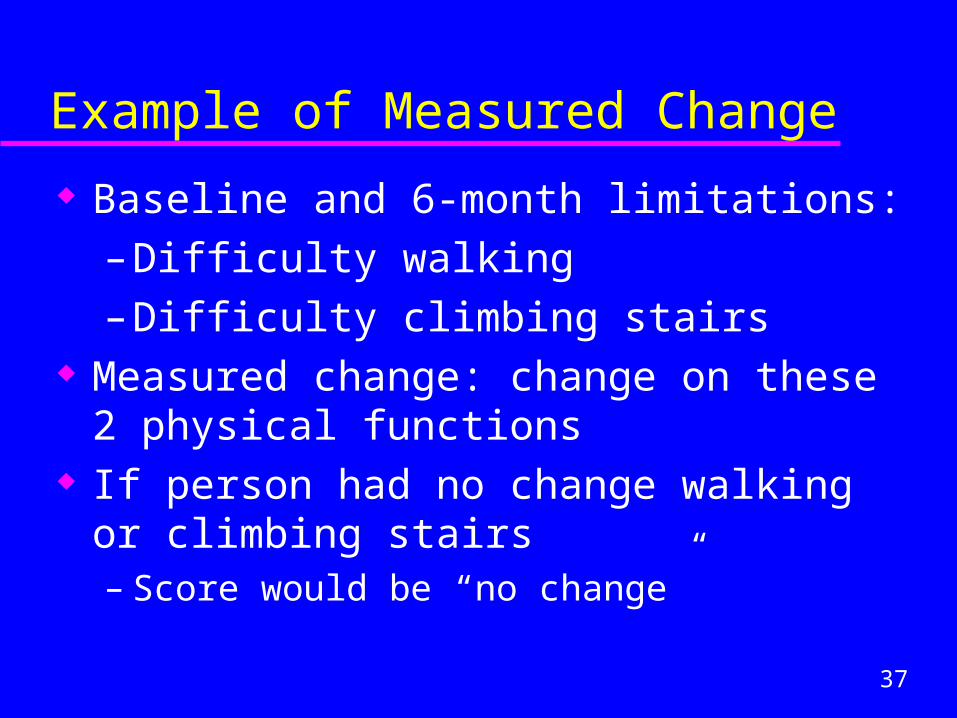
Example of Measured Change
Baseline and 6-month limitations:
– Difficulty walking
– Difficulty climbing stairs Measured change: change on these 2 physical
functions If person had no change walking or climbing
stairs– Score would be “no change”
38
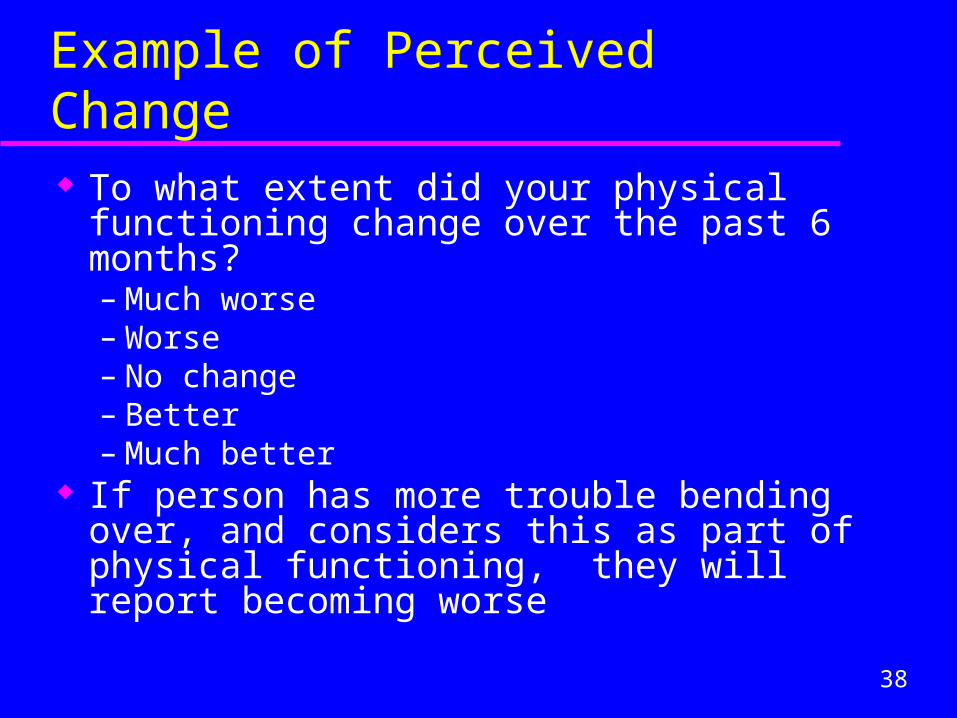
Example of Perceived Change To what extent did your physical functioning
change over the past 6 months? – Much worse– Worse– No change– Better– Much better
If person has more trouble bending over, and considers this as part of physical functioning, they will report becoming worse
39
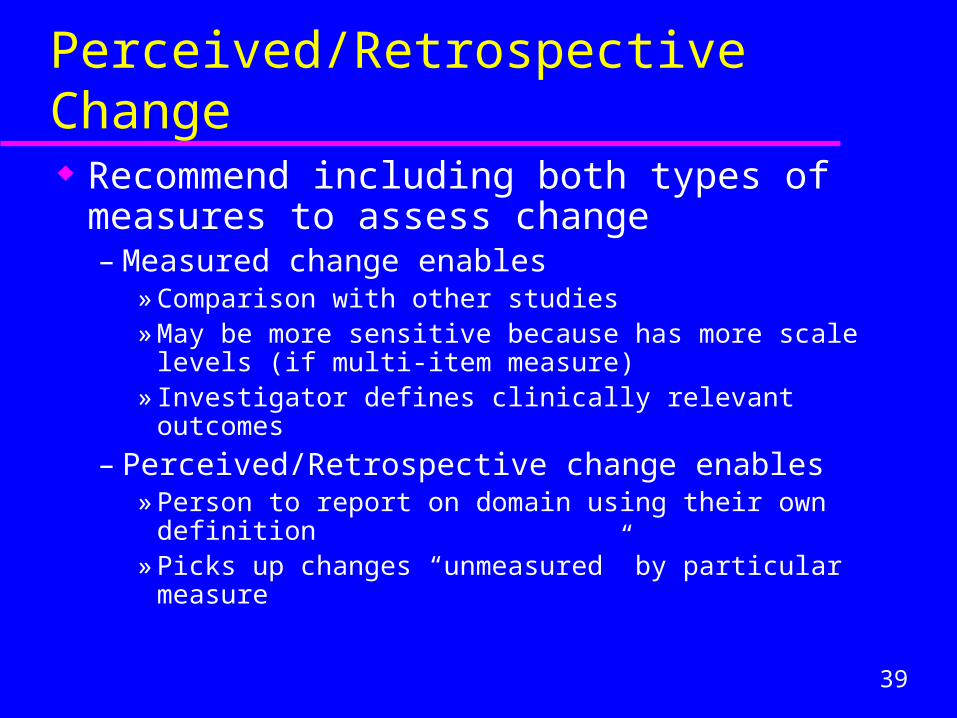
Perceived/Retrospective Change Recommend including both types of
measures to assess change– Measured change enables
» Comparison with other studies» May be more sensitive because has more scale levels (if
multi-item measure)» Investigator defines clinically relevant outcomes
– Perceived/Retrospective change enables» Person to report on domain using their own definition» Picks up changes “unmeasured” by particular measure
40
Overview of Class 10
Creating summated scales and presenting measurement information
Creating and presenting change scores “The rest of the survey”
– Locating standard survey questions

41
Locating “Standard” Survey Questions
MD characteristics Comorbidity, chronic conditions Medical history, family history Health behaviors
42
Demographics – Just About Everywhere
Basic demographics Socioeconomic status Financial information (assets, income,
wealth) Employment, occupation Retirement Health insurance

43
Take Away Point:
Don’t write these yourself Use standard questions from appropriate
existing surveys
44
National and State Surveys
Population surveys Tend to have single-item measures rather
than multi-item scales– Good for “standardized” survey items
45
State Surveys
http://www.chis.ucla.edu/ California Health Interview Survey
(CHIS) “Questionnaires”
See contents of 2006 CHIS: adults and adolescents

46
National Surveys
Behavioral Risk Factor Surveillance System Questionnaires
http://www.cdc.gov/brfss/questionnaires/questionnaires.htm
See contents of 2006 BRFSS – English and Spanish

47
MacArthur Research Network on Socioeconomic Status and Health
Measures of economic status, occupational status, education, and perceived social status– Includes rationale
http://www.macses.ucsf.edu/Research/Social%20Environment/notebook/economic.html
Also basic demographics

48
Center for Aging in Diverse Communities (CADC)
Recommends items measuring socioeconomic status– Education, income, race/ethnicity, place of
birth/generation, English language proficiency, financial hardship
Main website: http://medicine.ucsf.edu/cadc/cores/measurement/index.html

49
Cancer Research Measures
The Division of Cancer Epidemiology and Genetics
Demographics, medical history, family history, other risk factors
http://dceg.cancer.gov/QMOD/
50
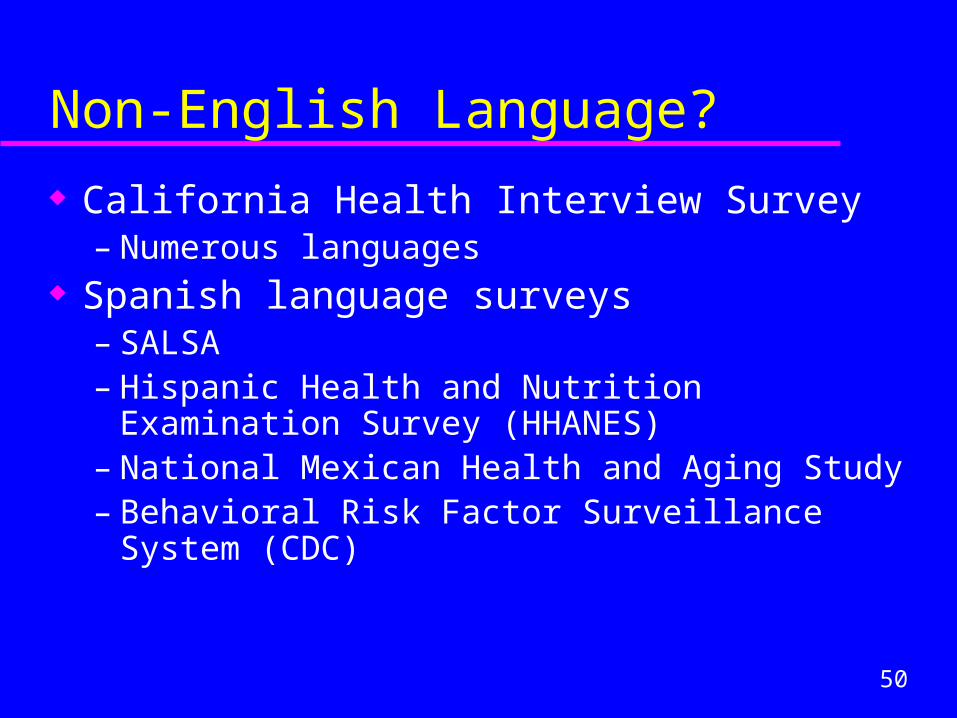
Non-English Language?
California Health Interview Survey– Numerous languages
Spanish language surveys– SALSA– Hispanic Health and Nutrition Examination Survey
(HHANES)– National Mexican Health and Aging Study – Behavioral Risk Factor Surveillance System (CDC)
51
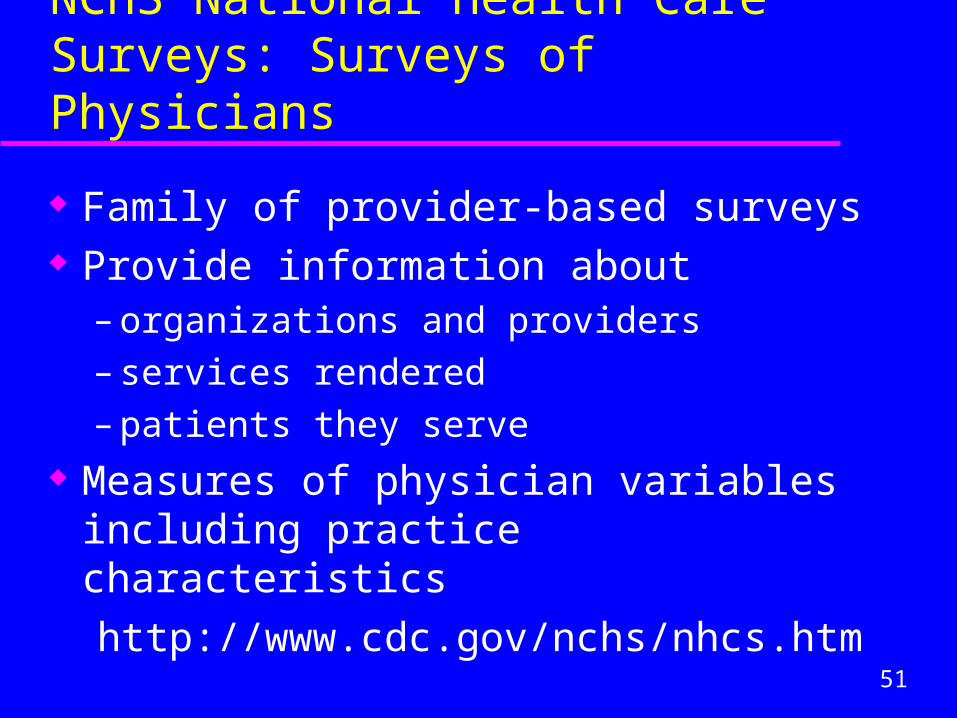
NCHS National Health Care Surveys: Surveys of Physicians
Family of provider-based surveys Provide information about
– organizations and providers
– services rendered
– patients they serve Measures of physician variables including
practice characteristics
http://www.cdc.gov/nchs/nhcs.htm

52
Basic Measures About Children?
Commonwealth Fund Survey of Parents with Young Children– Parent administered
CHIS for adolescents (self-administered) and children (parent-administered)

53
End of Class!
Thank you


![winnifred-eaton-reeve-fonds · holograph annotation “Anita Stewart Hem 1564" [19--] 38 5.6 In the castle of Hikone: [short story] - typescript, with holograph revisions [19--] 38](https://img.pdfslide.us/doc/110x75/6003aa15f1808e23886b40ee/winnifred-eaton-reeve-fonds-holograph-annotation-aoeanita-stewart-hem-1564.jpg)