Embed Size (px)
Citation preview

CITY OF ANN ARBORWATER & SEWER
COST OF SERVICE STUDY
12.20.2017
1
Revenue Requirements
Cost Allocation Rate Design Analysis

Overview
1. Revenue Sufficiency Analysis2. Rate Classification3. Cost to Serve4. Rate Structures5. Customer Impacts6. Affordability Program
Revenue Requirements
Cost Allocation Rate Design Analysis

Foundation of the Rate Study 1. Adequate revenue to meet identified requirements
• Capital, Operating, Debt Service, and Asset Management
2. Fair and equitable distribution of cost• Last cost of service was performed in 2003• Based upon industry best practices and legal
requirements• Utilizing detailed AMI data – unique and better
analysis
3. Evaluate and address community objectives• Affordability through rate and non-rate programs
3
Revenue Requirements
Cost Allocation Rate Design Analysis

Revenue Sufficiency Analysis
6% Annual Revenue Requirement increase “Smooth” rate increases
Increased debt service for future WTP Project
Operating Budget
Asset management
Multi-Year capital plans
7% Annual Revenue Requirement increase “Smooth” rate increases
Increased debt service for recent WWTP Project
Operating budget
Asset management
Multi-Year capital plans
Water Sewer
Revenue Requirements
Cost Allocation Rate Design Analysis

5
New Rate Classifications
Residential Commercial Water Only
Residential Multifamily (> 2 Units)
Non-Residential Water Only
Revenue Requirements
Cost Allocation Rate Design Analysis
AMI Data was used for FY16 on a daily or hourly basis (where available)

6
Cost to Serve Variance
Revenue Requirements
Cost Allocation Rate Design Analysis
*Water and sewer revenue based on FY 2016 billing data and current rates
Test Year (FY 2018)

7
Proposed Water Rate Design
Fixed Charge Volumetric Rate*
Inclining block 4 Tiers based on data
analysis Tier 1 & 2 - Indoor use Tier 3 & 4 - Outdoor use
Fixed Charge Volumetric Rate*
Uniform (flat) rate based on consumption
Water Only does not receive sewer charges
Residential Non-Residential, Multi-Family & Water Only
Revenue Requirements
Cost Allocation Rate Design Analysis
* Billed based on Units 1 Unit = 1 CCF; 1 CCF = 748 Gallons

8 Higher fixed charges provide stability…. However, reduces cost allocation and level of conservation rates Impacts affordability for low volume users
Critical to understand and evaluate: Use of reserve policies to mitigate risk of volatility Current recovery of fixed costs and practices of other systems
Rating agencies focus on fixed charges Industry-wide demand reductions & increasing fixed cost awareness Fitch: strong system will recover >=30% of revenue in fixed charges Ann Arbor current collection & proposed = 12.4%
8
Key Issue: Level of Fixed Charges
Water Fixed Sewer Fixed Total Ann Arbor 21% 13% 15%Maximum 64% 100% 65%Minimum 16% 13% 15%Average 36% 35% 35%
Fixed Charge as a % of 18 CCF Quarterly Bill
Revenue Requirements
Cost Allocation Rate Design Analysis

Proposed Quarterly Water Fixed Charge Cost Components
9
Customer Service
Meter Program
Fire Protection
Revenue Requirements
Cost Allocation Rate Design Analysis

Residential Water Pricing & Structure 10
*Rates shown before 10% on time payment discount
Current Proposed
Revenue Requirements
Cost Allocation Rate Design Analysis
Proposed rates include revenue increase of $1.9M to conform with cost to serve
Tier 1 Tier 2 Tier 3 Tier 1 Tier 2 Tier 3 Tier 4
* Rates are per Unit. 1 Unit = 1 CCF; 1 CCF = 748 Gallons

Residential Water Use Analysis11
-
1,000,000
2,000,000
3,000,000
4,000,000
5,000,000
6,000,000
7,000,000
8,000,000
JAN FEB MAR APR MAY JUN JUL AUG SEP OCT NOV DEC
Change in Res Volume by Tier
Tier 4
Tier 3
Tier 2 Tier 1
Revenue Requirements
Cost Allocation Rate Design Analysis
Cubic Feet

Water Residential Revenue Recovery Sources
12
CurrentRevenue Sources
ProposedRevenue Sources
Increased to reflect the full cost to serve residential customers
Revenue Requirements
Cost Allocation Rate Design Analysis

Non-Residential, Multifamily and Water Only Volumetric
13
Uniform rates per unit
Revenue Requirements
Cost Allocation Rate Design Analysis*Rates shown before 10% on time payment discount
* Billed in Units. 1 Unit = 1 CCF; 1 CCF = 748 Gallons
14
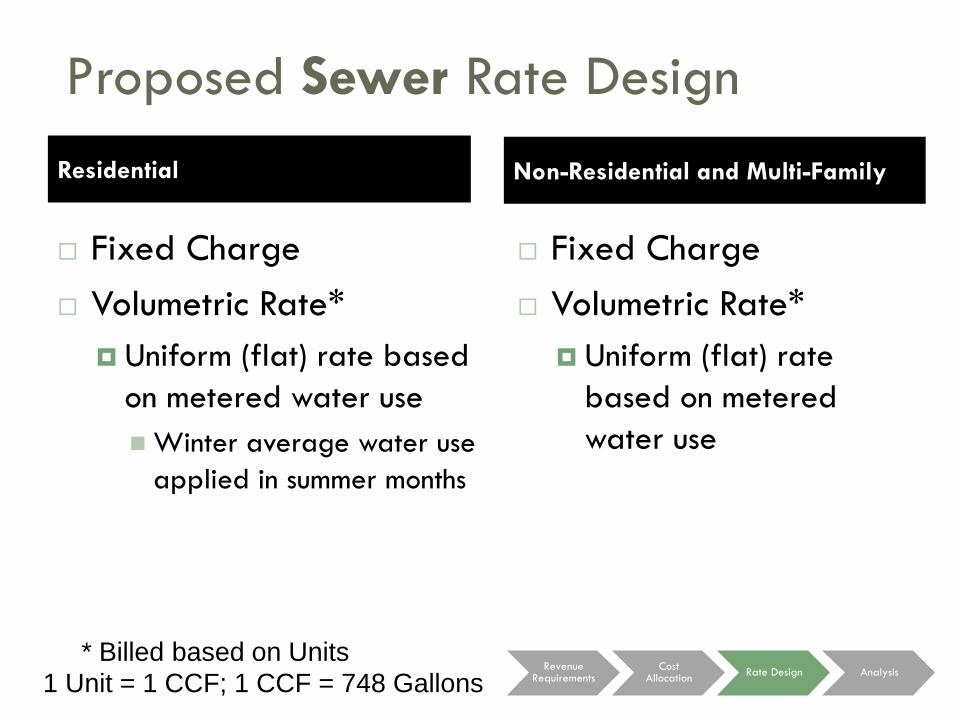
Proposed Sewer Rate Design
Fixed Charge Volumetric Rate*
Uniform (flat) rate based on metered water useWinter average water use
applied in summer months
Fixed Charge Volumetric Rate*
Uniform (flat) rate based on metered water use
Residential Non-Residential and Multi-Family
Revenue Requirements
Cost Allocation Rate Design Analysis
* Billed based on Units 1 Unit = 1 CCF; 1 CCF = 748 Gallons

15
Footing Drain Disconnection (FDD)15
Revenue Requirements
Cost Allocation Rate Design Analysis
1. From 2002 to 2012 the FDD Program resulted in the about 1,800 properties disconnecting their of footing drain discharges from the City’s sanitary sewer system
2. The SSWWE Citizens Advisory Committee asked that a credit or other benefit for FDD Program participants be considered and evaluation was to be done in the rate study
3. Alternatively, a surcharge for properties connected to the City’s sanitary sewer system could be evaluated
4. Challenges: A. Equity: No different than properties that were never connected to the City’s
sanitary sewer system, or that disconnected for another reasonB. Data: Depending on choice of credit or surcharge, would require
audit/database of all homes to determine whether connected or not, the reason not connected, ability to disconnect if connected, etc.
C. Precedent: Not aware of any credits/surcharges related to footing drain discharges

16
Proposed Quarterly Sewer Fixed Charge Cost Components 16
Customer Related
Meter Program
Revenue Requirements
Cost Allocation Rate Design Analysis

18
Residential Revenue Recovery Sources
18
CurrentRevenue Sources
ProposedRevenue Sources
Revenue Requirements
Cost Allocation Rate Design Analysis

Sewer Volumetric Rate17
Revenue Requirements
Cost Allocation Rate Design Analysis*Rates shown before 10% on time payment discount
* Billed in Units. 1 Unit = 1 CCF; 1 CCF = 748 Gallons

Water & Sewer Quarterly Residential Bill Impact
19Scenario: • 5/8’ Meter • Two person household with minimal
irrigation• Bill is increasing to conform with the cost to
serve and fixed cost recovery goals
Revenue Requirements
Cost Allocation Rate Design Analysis
*Bills shown net 10% on time payment discount
Variance$14.6722.2%
*Bill shown net 10% on time payment discount 8 CCF = 5,984 Gallons

Water & Sewer Quarterly Residential Bill Impact
20Scenario: • 5/8’ Meter • Four person household with
minimal irrigation• Bill is increasing to conform with
the cost to serve
Revenue Requirements
Cost Allocation Rate Design Analysis
Variance $14.3510.4%
*Bill shown net 10% on time payment discount 18 CCF = 13,464 Gallons

Water & Sewer Quarterly Residential Bill Impacts
21
Variance$55.6619.4%
Scenario: • 5/8’ Meter • Four person household with efficient
irrigation • Bill is increasing to conform with the cost
to serve
Revenue Requirements
Cost Allocation Rate Design Analysis
*Bill shown net 10% on time payment discount
36 CCF = 26,928 Gallons

22
Comparison of Residential Water & Sewer Bills
Revenue Requirements
Cost Allocation Rate Design Analysis
*Bill shown net 10% on time payment discount
Port Huron $243.06East Lansing $203.49
Bloomington, IN $202.10State College, PA $192.24
Champaign, IL $179.43Grand Rapids $177.87
Iowa City $169.59Columbus, OH $163.50
Minneapolis $153.84Ann Arbor (Proposed)* $151.92
West Lafayette, IN $146.41Madison, WI $144.90
Ann Arbor* $137.57Ypsilanti $128.34
Evanston, IL $120.72
Combined Water & Sewer Bill Survey at 18 CCF Quarterly

Select Water & Sewer Quarterly Non-Residential Bill Impacts
23
Revenue Requirements
Cost Allocation Rate Design Analysis
*Bill shown net 10% on time payment discount
Type Current Proposed Change $ Change %Grocery Store 8,002$ 7,573$ (429)$ -5%Deli 4,747$ 4,434$ (313)$ -7%Pub 3,883$ 3,667$ (216)$ -6%Brewery 2,660$ 2,550$ (110)$ -4%Teen Center 166$ 171$ 5$ 3%Specialty Store 288$ 288$ -$ 0%Hotel 24,319$ 23,031$ (1,288)$ -5%Professional Office 1,613$ 1,436$ (178)$ -11%Dry Cleaners 430$ 441$ 11$ 3%Hospital 29,143$ 27,672$ (1,471)$ -5%

Water & Sewer Quarterly Multifamily Bill Impacts
Variance $(67.37)-15.6%
Variance $(163.67)
-13.8%
Variance$(259.97)
-13.4%
Revenue Requirements
Cost Allocation Rate Design Analysis
*1” Bill shown net 10% on time payment discount
Bills are decreasing to conform with the cost to serve

Water Only Quarterly Bill Impacts
25
Variance$46.0833.8%
Variance$122.7641.6%
Variance$250.5644.7%
Revenue Requirements
Cost Allocation Rate Design Analysis
*Bills shown net 10% on time payment discount *1” Bill shown net 10% on time payment discount
Bills are increasing to conform with the cost to serve

26
Affordability Next Steps Rate study affordability: All rates reflect the cost to serve
Affordability beyond rates: Pilot initiative to improve customer engagement Improve ease of access to existing services Water affordability advisory group
Revenue Requirements Cost Allocation Rate Design Analysis Implementation

27
27
Current Affordability Program Summary
Revenue Requirements Cost Allocation Rate Design Analysis Implementation
Barrier Busters – Ann Arbor Assistance Fund Crisis intervention
Leak credit Payment plan option Identification of total needs & piloting and
evaluation of programs

28
28
Project Next Steps
Presentation to Administrator & City Leadership Presentation to City Council Continue Communication Efforts
Revenue Requirements Cost Allocation Rate Design Analysis Implementation


![Sewer Processes and Design - SKYSCRAPERS · 2018-09-02 · SANITARY SEWER SYSTEM [Foul Sewer] I. Storm Sewer System STORM SEWER is designed to drain excess rainfall and groundwater](https://img.pdfslide.us/doc/110x75/5e9b180035942256b30ec806/sewer-processes-and-design-skyscrapers-2018-09-02-sanitary-sewer-system-foul.jpg)
![Report Master Template[1] - wsscwater.com · 2017-05-06 · Sewer System Revenue Requirements ... Table 28 Allocation of Net Plant Investment to Functional Cost Components (Sewer](https://img.pdfslide.us/doc/110x75/5e93a53e3120593e7a602f0b/report-master-template1-2017-05-06-sewer-system-revenue-requirements-table.jpg)