Embed Size (px)
Citation preview

1
ChemistryChapter 1
Scientific method and Data management
Chemistry-Matter and ChangeGlencoe

2
The Scientific Method
Is a systematic way of gathering evidence to support ideas and theories that help explain the natural world around us.
Steps to the scientific method
1. ____________________2. Do some research and form a
___________ A Hypothesis is a _________________based on research and observations. It is what you think the answer to the problem is.
A good way of writing a hypothesis is: If…(a cause (independent variable))…then…(an effect (dependent variable)).

3
An experiment should have these three things to be a proper experiment
I. ____________ are things that change. There are always two;
The independent variable. Sometimes called the manipulated variable. The experimenter chooses one thing to do differently in the experiment.
The dependent variable. Sometimes called the measured or responding variable. This is the data that is being gathered or recorded.
3. Design and conduct an experiment.

4
II. ___________ are all other things in the experiment that are kept the same all the time.
III. ____________ is a standard for comparison. It is like a base line or the data at time zero. You will ___________
__________________.

5
4. Analyze the Data This includes making graphs and/or
calculations. Look for _______ in the data.
Parts of a proper graph: (more info to come)
• Use graph paper and a ruler• __________: Dependent vs. Independent• Labels ___________: independent – x axis,
dependent – y axis• _______________: Data range/number of lines, round
up to a counting number• Smooth line or curve

6
5. Draw a conclusionA conclusion is a 5 sentence
paragraph that summarizes your investigation.
1) __________________________2) Briefly ____________ your experiment.3) What was the ___________. Give examples
of your data as ____________.4) What was the _________ you found in the
data or what does the data _________.5) Did the data trend ______________your
hypothesis.

7
A ______ is an _________ that has been supported by many, many experiments. It is the most logical explanation of why things work they way they do based on evidence gathered by experimentation.
_____________ is a relationship in nature that is supported by many experiments. It is a rule that ________, but doesn’t explain, a pattern in nature and predicts what will happen under special conditions. It is often described with a _________________.
Theory & Law

8
Report your results
You will want to put your research out for peer review and/or publish your findings for your peers to evaluate.

9
Data Table Format The proper format for a data
table is: Label your independent variable
and unit in the first/left-most column
Label your dependent variable and unit in the next/right-most column
REVIEW: Independent Variable
____________________________ Dependent Variable
____________________________
Organizing and Graphing Data

10
Titling a Graph A title for a graph should describe what the
experiment was _____________ For pie graphs:
Titles should name the quantity or thing being divided Student Hair Color
For line and bar graphs: Titles should list the
dependent variable vs. the independent variable Temperature vs. Time
All titles are placed at the ______ of the graph

11
Creating Line & Bar Graphs
Line and bar graphs must:• use __________if not constructed on a
computer• use _______ graduations or scale with even
increasing or decreasing increments along the axis
- to determine scale for x and y axis, divide range of data (data range is highest
value – lowest value) by the number of lines on the axis.
Then round the number up to a good counting number like .1, .2, .5, 1, 2, 5, 10, 20, 50…
• Start your scale near the lowest number.

12
Calculating the Scale on a Graph
For example: The left hand column
is the independent variable. The data range should subtract the high data point from the low data point. Data range:
Then count the number of lines on the axis you will be putting the scale on.
For example:
Speed (m/s)
Water Temperatur
e (°C)
17 25
14 28
11 31
8 34
5 37
Then divide the range by the number of lines
You need to round that number up to one that is easy to count by like 0.1, 0.2, 0.5, 1.0, 2.0, 5.0, 10.0Start your scale near the lowest number.
17-5=12
22
= 0.
= 1.0

13
The Metric System This system is based on powers of 10. It consists of a base unit which is
changed by powers of ten when a prefix is added
Metric Conversion scaleGreat Mighty King Henry Died By drinking chocolate milk maybe no one paid attention
Giga __ __ Mega__ __ Kilo Hecto Deka base unit deci centi milli__ __micro__ __nano__ __pico (meter)
G- M- K- H- D- or dk- m,g,L,s d- c- m- µ- n- p-
109 106 1000 100 10 1 0.1 0.01 0.001 10 -6 10-9 10-12

14
SI System Because units are combined all the time in
math equations they often become very large and complex. They are called _________and consist of multiple _______. Scientists tend to abbreviate them.Example: The equation for potential energy is EP= mgh
The unit for this using all base units is Kg m2/s2
The abbreviated version of this unit is J for Joule
Without standardizing the base units, scientists would never know which mass, distance and time unit was imbedded in the abbreviated unit Joule.
15
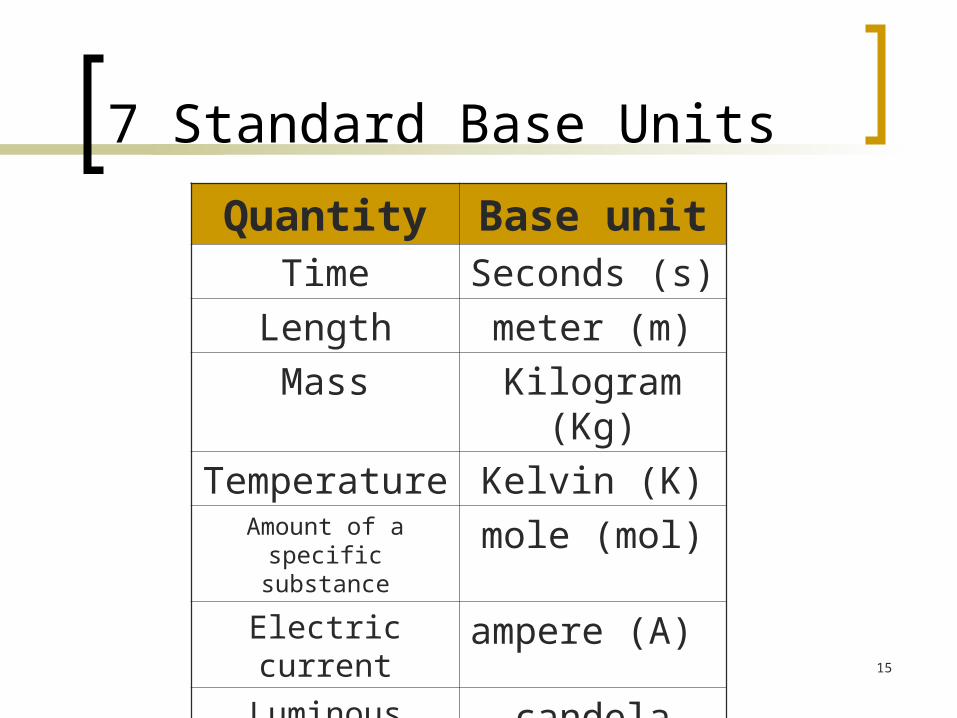
7 Standard Base Units
Quantity Base unitTime Seconds (s)
Length meter (m)
Mass Kilogram (Kg)
Temperature Kelvin (K)Amount of a specific
substancemole (mol)
Electric current ampere (A) Luminous intensity
candela (cd)

16
Mass: The amount of matter (atoms) an object has. Unit: grams or kilograms
Volume: The amount of space an object takes up. Unit: milliliters or cm3
Density: A relationship between the mass and volume of an object.
“the amount of matter per volume.”

Density Demo
Which is more dense? Why? How could we tell?
17