Embed Size (px)
Citation preview

1Chapter Three
A PowerPointTutorialto Accompany macroeconomics, 5th ed.
N. Gregory Mankiw
Mannig J. Simidian
®
CHAPTER THREENational Income:
Where It Comes From and Where It Goes

2Chapter Three
Copyright 1997 Dead Economists Society
A quite simple but powerful analytical model built aroundbuyers and sellers pursuing their own self-interest (within
rules set by government). It’s emphasis is on the consequencesof competition and flexible wages/prices for total employment
and real output. Its roots go back to 1776 in Adam Smith’sWealth of Nations. The Wealth of Nations suggested that the economy was controlled by the “invisible hand” whereby the
market system, instead of government would be the best mechanism for a healthy economy.
3Chapter Three
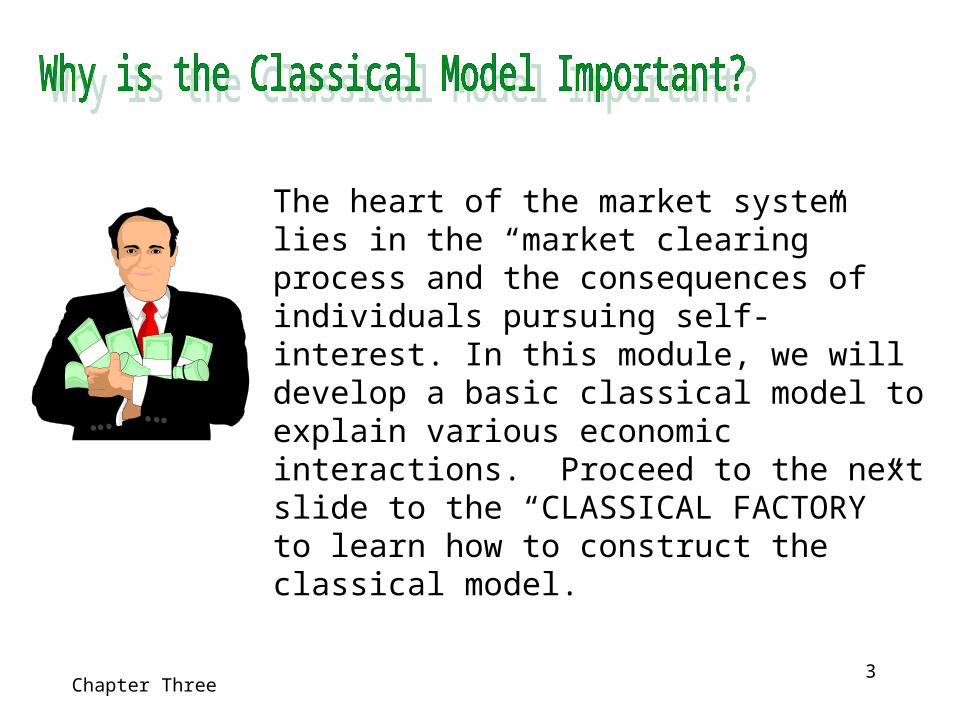
The heart of the market system lies in the “market clearing” process and the consequences of individuals pursuing self-interest. In this module, we will develop a basic classical model to explain various economic interactions. Proceed to the next slide to the “CLASSICAL FACTORY” to learn how to construct the classical model.

4Chapter Three
PP
P*P*
Q*Q*
SS
DD
The place where classical model
mechanics are made easy!
The place where classical model
mechanics are made easy!
Welcome to...Welcome to...Welcome to...Welcome to...

5Chapter Three
We begin with firms and see what determines their level of production (and thus, the level of national income).
Then, we examine how the markets for the factors of production distribute this income to households.
Next, we consider how much of this income households consume and how much they save.
We will also discuss the demand arising from investment and government purchases.
Finally, we discuss how the demand and supply for goods and services are brought into balance.
6Chapter Three
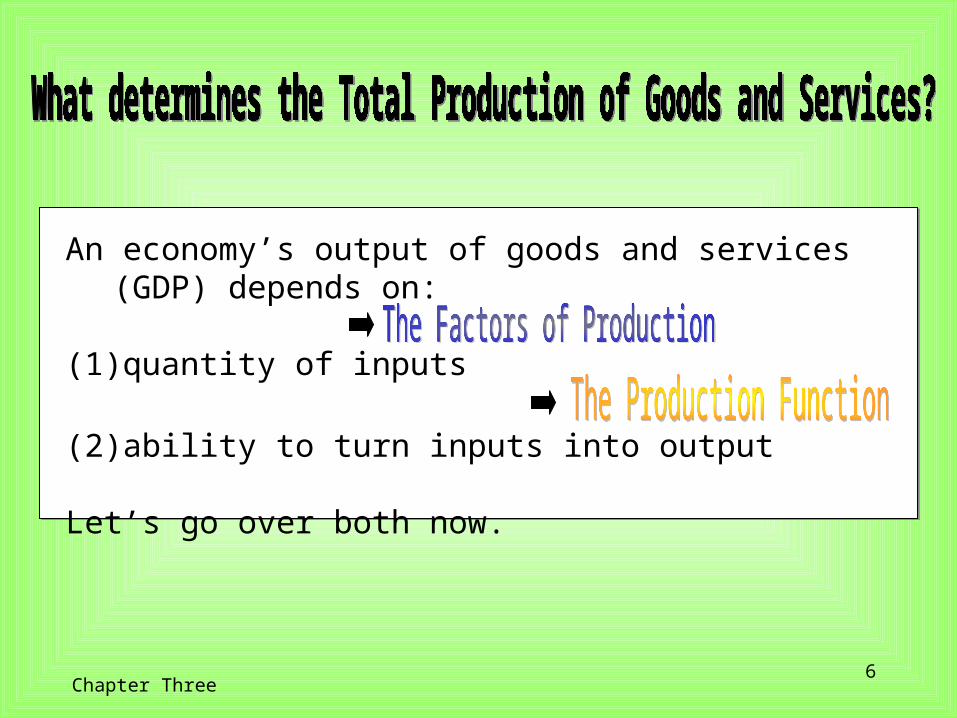
An economy’s output of goods and services (GDP) depends on:
(1) quantity of inputs
(2) ability to turn inputs into output
Let’s go over both now.
7Chapter Three
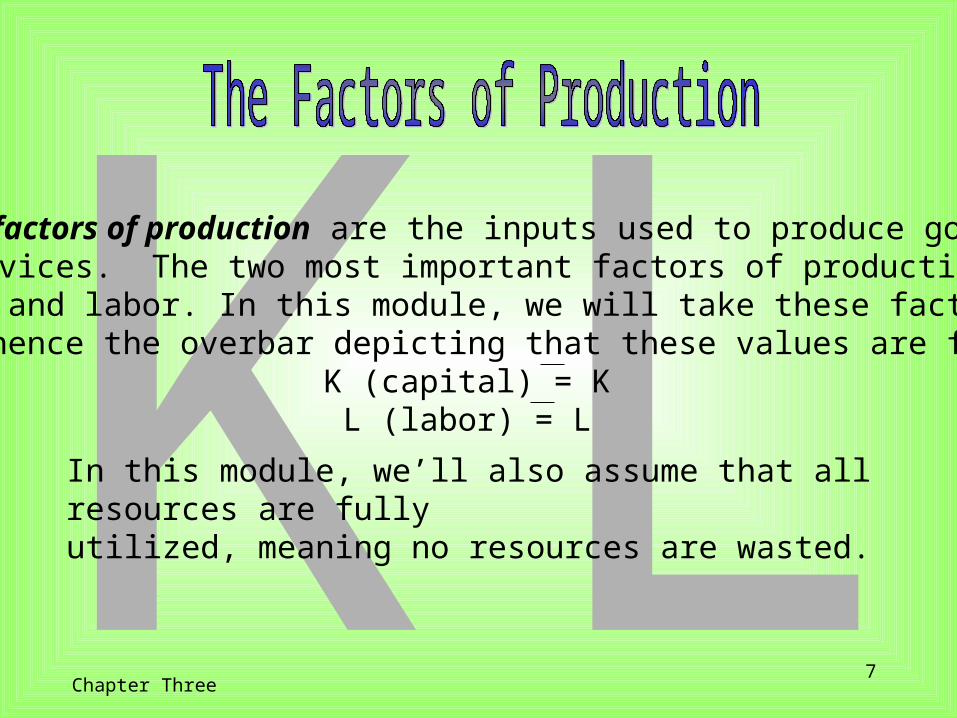
LKThe factors of production are the inputs used to produce goodsand services. The two most important factors of production arecapital and labor. In this module, we will take these factors asgiven (hence the overbar depicting that these values are fixed).
K (capital) = KL (labor) = L
In this module, we’ll also assume that all resources are fullyutilized, meaning no resources are wasted.
8Chapter Three
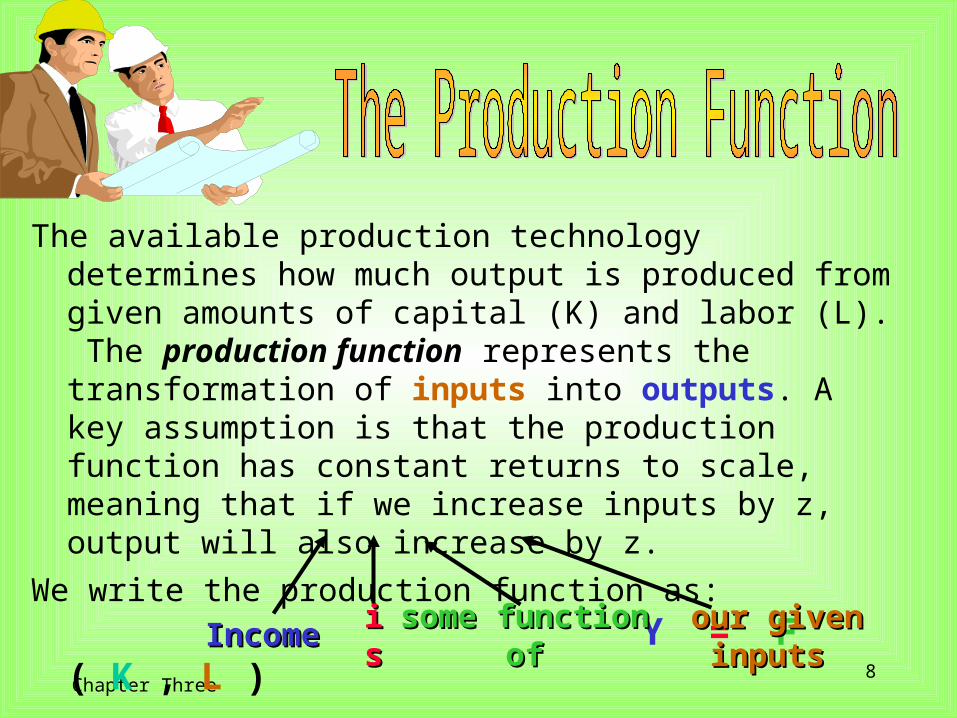
The available production technology determines how much output is produced from given amounts of capital (K) and labor (L). The production function represents the transformation of inputs into outputs. A key assumption is that the production function has constant returns to scale, meaning that if we increase inputs by z, output will also increase by z.
We write the production function as: Y = F ( K , L )
IncomeIncome isis some function ofsome function of our given inputsour given inputs
9Chapter Three
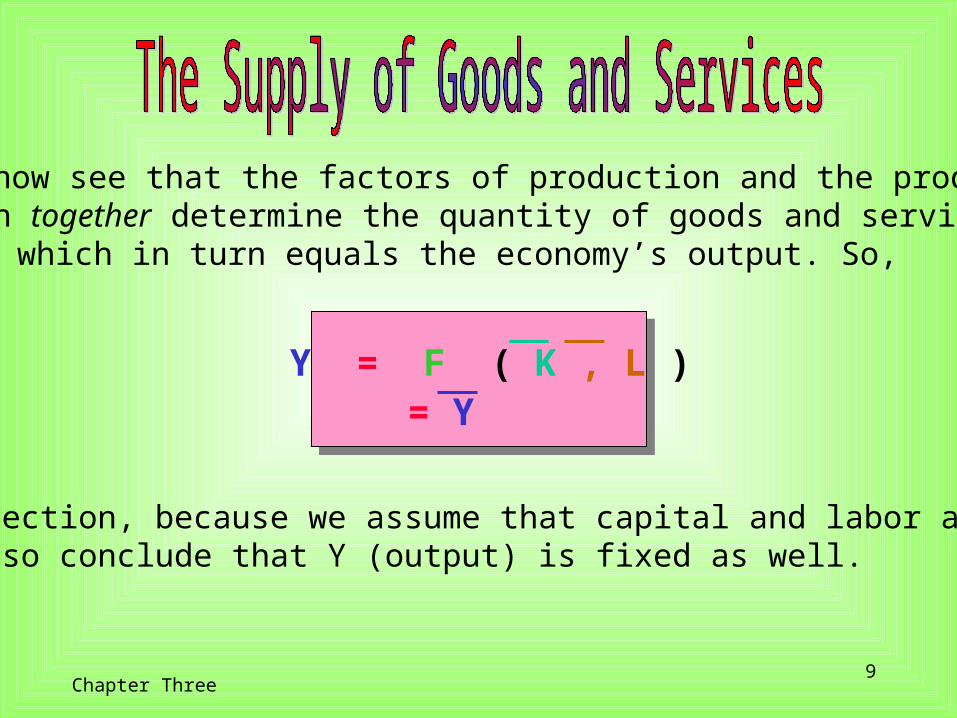
We can now see that the factors of production and the productionfunction together determine the quantity of goods and servicessupplied, which in turn equals the economy’s output. So,
Y = F ( K , L )= Y
In this section, because we assume that capital and labor are fixed,we can also conclude that Y (output) is fixed as well.
10Chapter Three
The distribution of national income is determined by factor prices.Factor prices are the amounts paid to the factors of production– thewages workers earn and the rent the owners of capital collect.Because we have assumed a fixed amount of capital and labor,the factor supply curve is a vertical line.
The next slide will illustrate.
Recall that the total output of an economy equals total income. Because the factors of production and the production functiontogether determine the total output of goods and services, they alsodetermine national income.
11Chapter Three
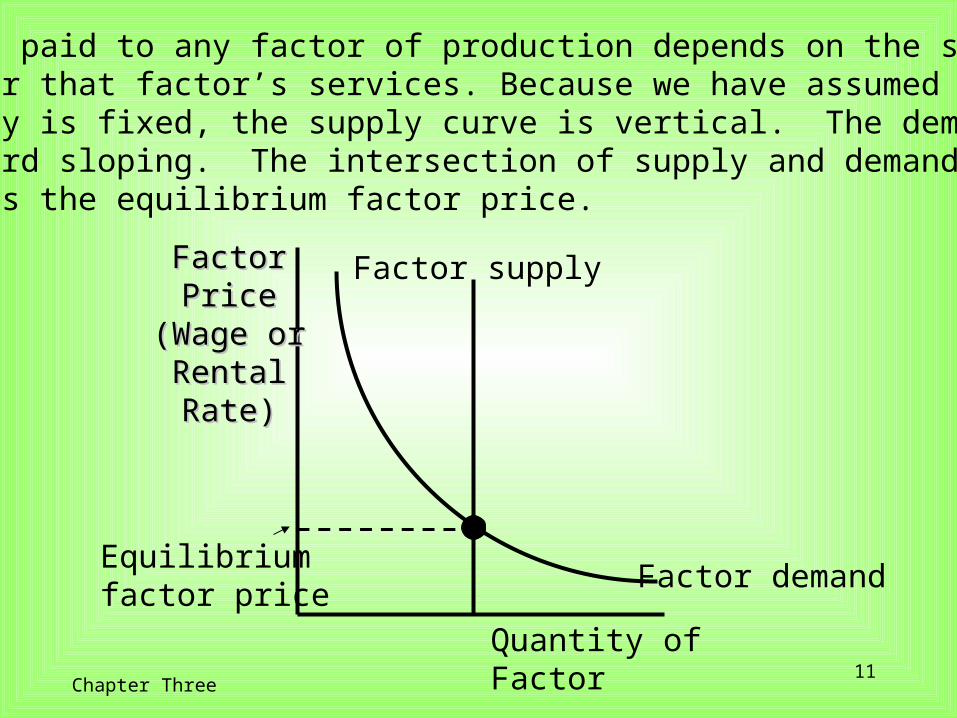
The price paid to any factor of production depends on the supply anddemand for that factor’s services. Because we have assumed thatthe supply is fixed, the supply curve is vertical. The demand curveis downward sloping. The intersection of supply and demanddetermines the equilibrium factor price.
FactorFactorPricePrice
(Wage or(Wage orRentalRentalRate)Rate)
Quantity of Factor
Factor demand
Factor supply
Equilibriumfactor price
12Chapter Three
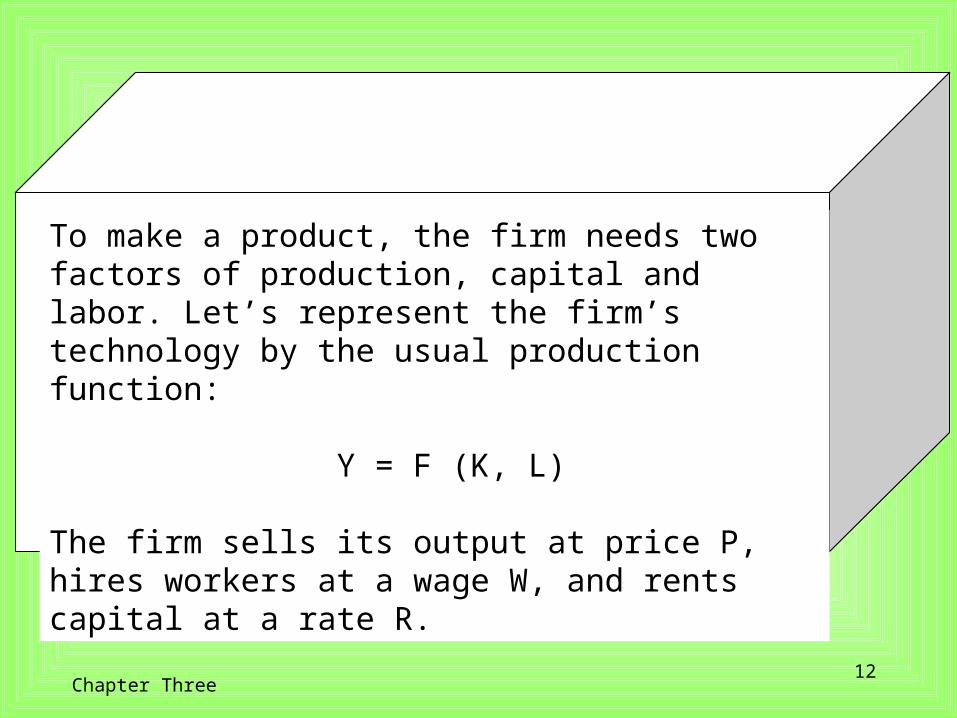
To make a product, the firm needs two factors of production, capital and labor. Let’s represent the firm’s technology by the usual production function:
Y = F (K, L)
The firm sells its output at price P, hires workers at a wage W, and rents capital at a rate R.
13Chapter Three
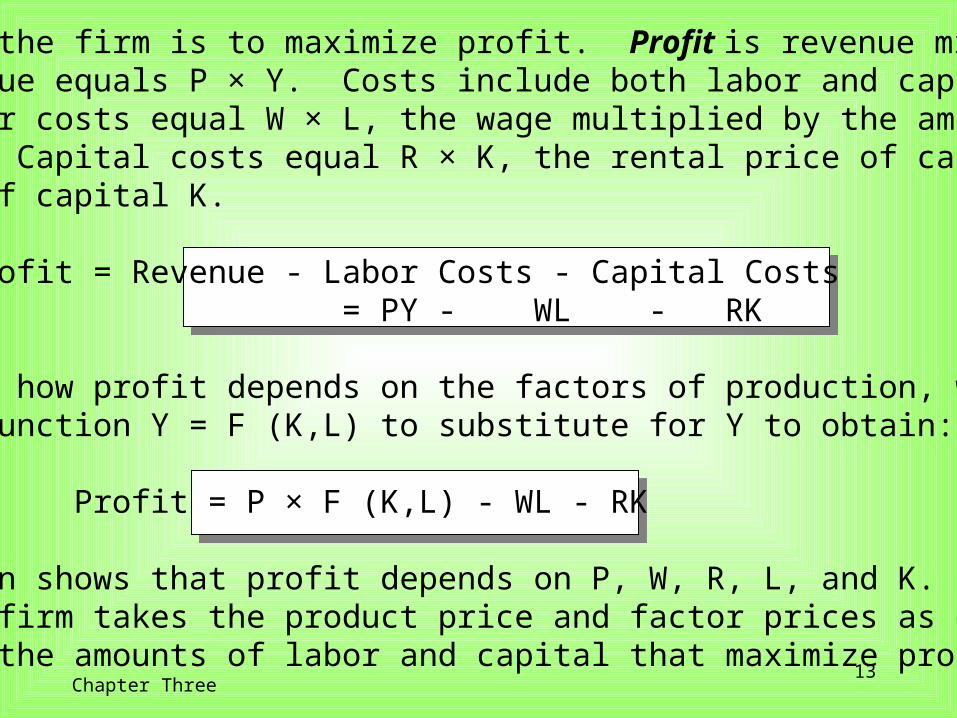
The goal of the firm is to maximize profit. Profit is revenue minuscost. Revenue equals P × Y. Costs include both labor and capitalcosts. Labor costs equal W × L, the wage multiplied by the amountof labor L. Capital costs equal R × K, the rental price of capital R timesthe amount of capital K.
Profit = Revenue - Labor Costs - Capital Costs = PY - WL - RK
Then, to see how profit depends on the factors of production, we use production function Y = F (K,L) to substitute for Y to obtain:
Profit = P × F (K,L) - WL - RK
This equation shows that profit depends on P, W, R, L, and K. The competitive firm takes the product price and factor prices as givenand chooses the amounts of labor and capital that maximize profit.
14Chapter Three
We know that the firm will hire labor and rent capital in the quantities that maximize profit. But, what are those maximizing quantities? To answer this, we must consider the quantity of laborand then the quantity of capital.
15Chapter Three
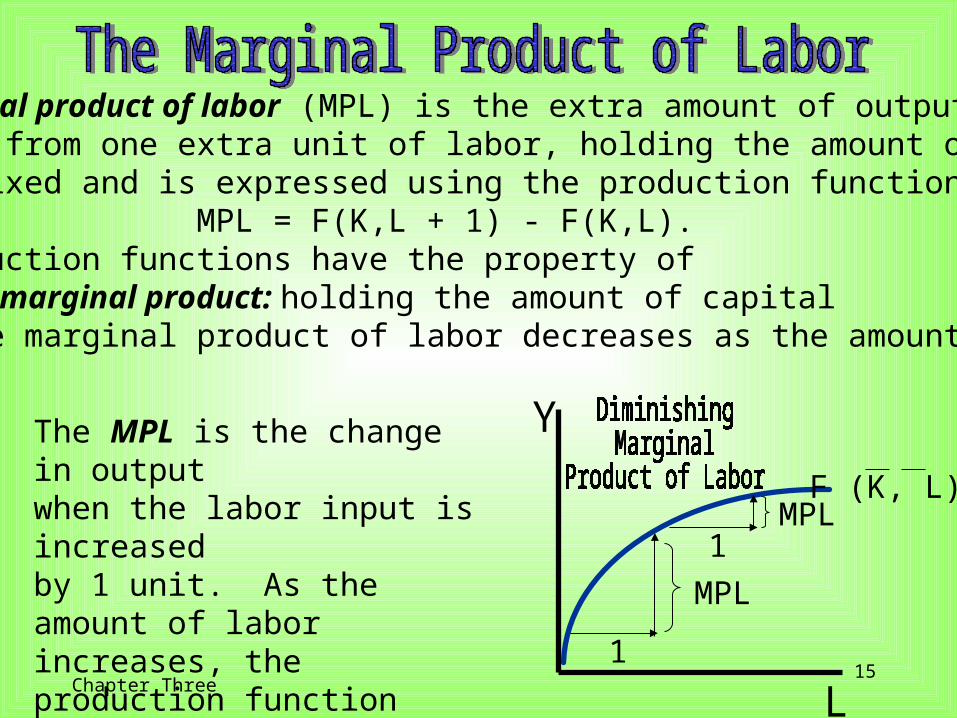
The marginal product of labor (MPL) is the extra amount of output thefirm gets from one extra unit of labor, holding the amount ofcapital fixed and is expressed using the production function:
MPL = F(K,L + 1) - F(K,L).Most production functions have the property of diminishing marginal product: holding the amount of capital fixed, the marginal product of labor decreases as the amount of labor increases.
F (K, L)
Y
L1
MPL
1MPL
The MPL is the change in output when the labor input is increased by 1 unit. As the amount of labor increases, the production function becomes flatter indicating diminishing marginal product.
16Chapter Three
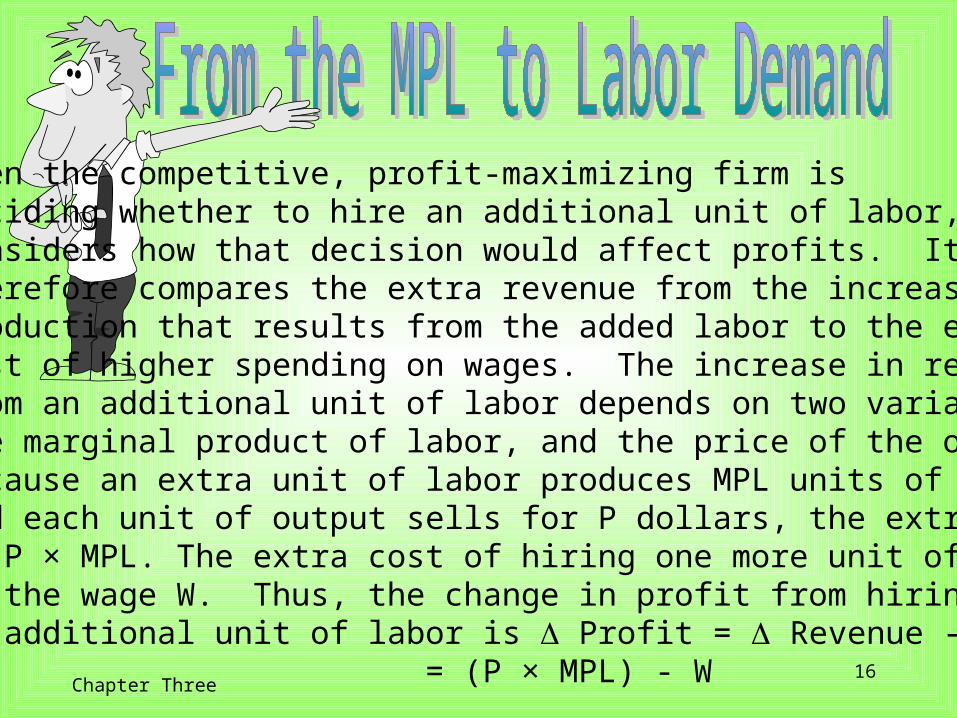
When the competitive, profit-maximizing firm isdeciding whether to hire an additional unit of labor, itconsiders how that decision would affect profits. Ittherefore compares the extra revenue from the increasedproduction that results from the added labor to the extracost of higher spending on wages. The increase in revenuefrom an additional unit of labor depends on two variables:the marginal product of labor, and the price of the output.Because an extra unit of labor produces MPL units of outputand each unit of output sells for P dollars, the extra revenueis P × MPL. The extra cost of hiring one more unit of laboris the wage W. Thus, the change in profit from hiringan additional unit of labor is Profit = Revenue - Cost
= (P × MPL) - W
17Chapter Three
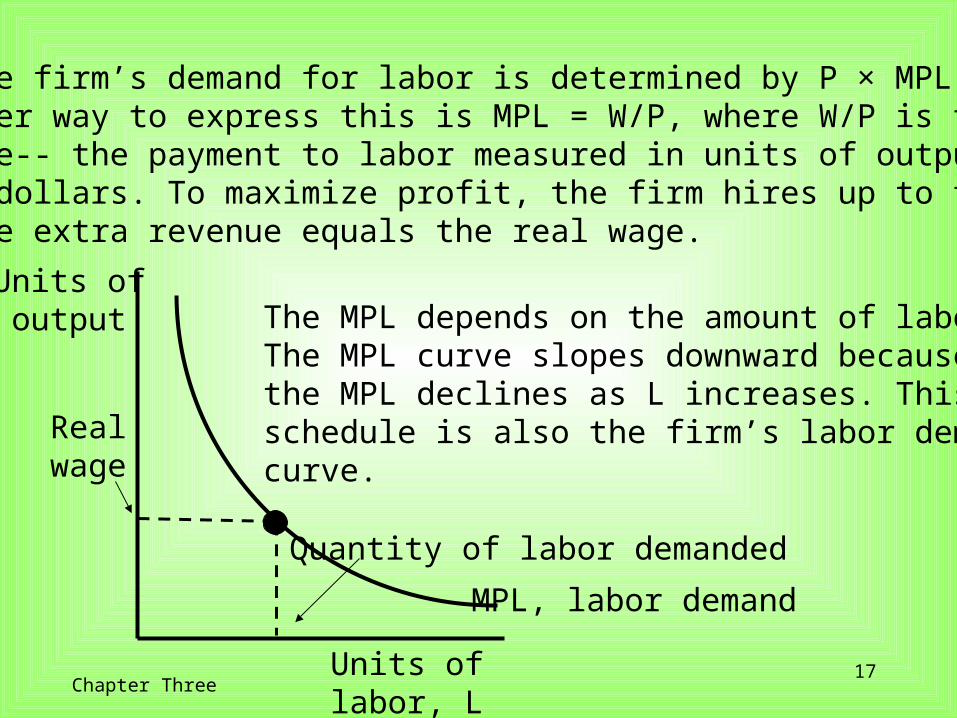
Thus, the firm’s demand for labor is determined by P × MPL = W,or another way to express this is MPL = W/P, where W/P is thereal wage-- the payment to labor measured in units of output ratherthan in dollars. To maximize profit, the firm hires up to the pointwhere the extra revenue equals the real wage.
The MPL depends on the amount of labor.The MPL curve slopes downward becausethe MPL declines as L increases. Thisschedule is also the firm’s labor demandcurve.
Units ofoutput
Units of labor, L
MPL, labor demand
Quantity of labor demanded
Realwage
18Chapter Three
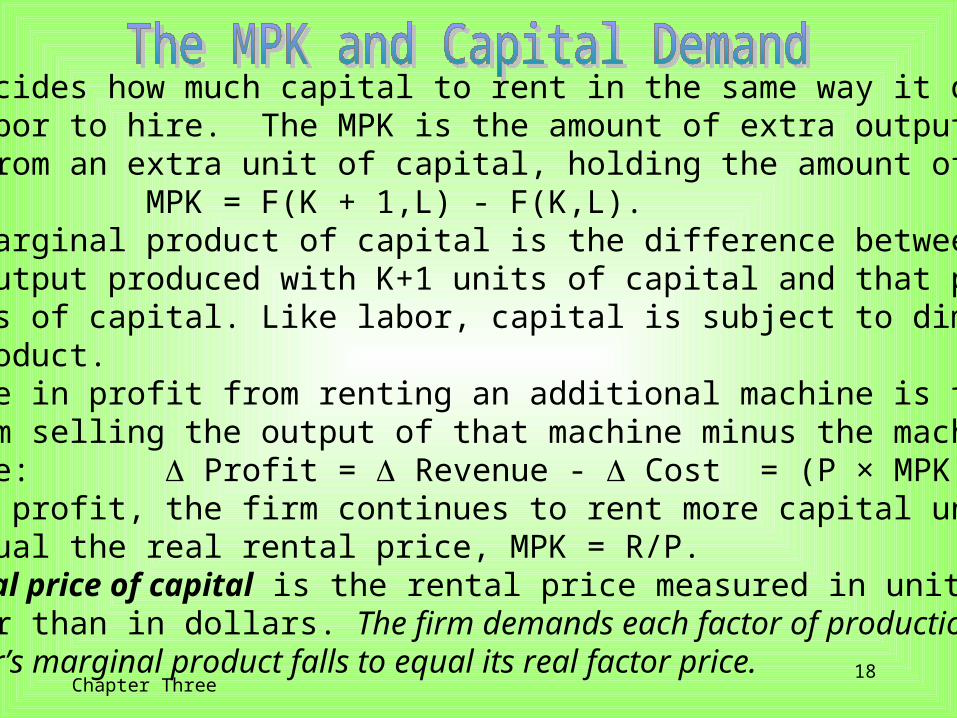
The firm decides how much capital to rent in the same way it decideshow much labor to hire. The MPK is the amount of extra output thefirm gets from an extra unit of capital, holding the amount of laborconstant: MPK = F(K + 1,L) - F(K,L).Thus, the marginal product of capital is the difference between theamount of output produced with K+1 units of capital and that producedwith K units of capital. Like labor, capital is subject to diminishingmarginal product.The increase in profit from renting an additional machine is the extrarevenue from selling the output of that machine minus the machine’srental price: Profit = Revenue - Cost = (P × MPK) - RTo maximize profit, the firm continues to rent more capital until the MPKfalls to equal the real rental price, MPK = R/P.The real rental price of capital is the rental price measured in units of goods rather than in dollars. The firm demands each factor of productionuntil that factor’s marginal product falls to equal its real factor price.
19Chapter Three
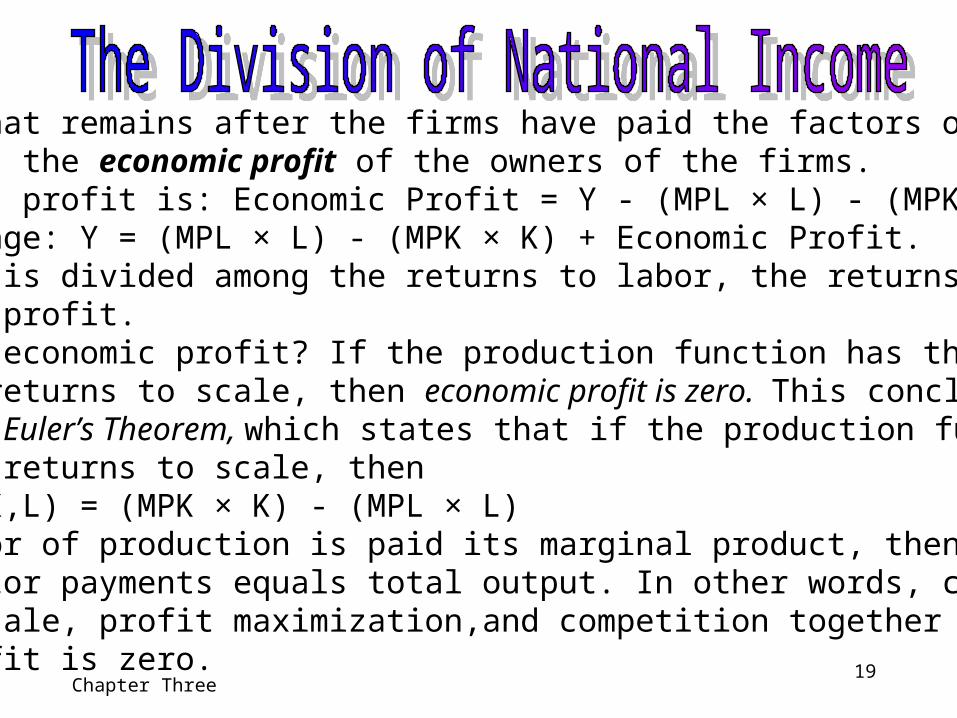
The income that remains after the firms have paid the factors ofproduction is the economic profit of the owners of the firms.Real economic profit is: Economic Profit = Y - (MPL × L) - (MPK × K) or to rearrange: Y = (MPL × L) - (MPK × K) + Economic Profit.Total income is divided among the returns to labor, the returns to capital, and economic profit.How large is economic profit? If the production function has the propertyof constant returns to scale, then economic profit is zero. This conclusionfollows from Euler’s Theorem, which states that if the production functionhas constant returns to scale, then
F(K,L) = (MPK × K) - (MPL × L) If each factor of production is paid its marginal product, then the sumof these factor payments equals total output. In other words, constantreturns to scale, profit maximization,and competition together imply thateconomic profit is zero.
20Chapter Three
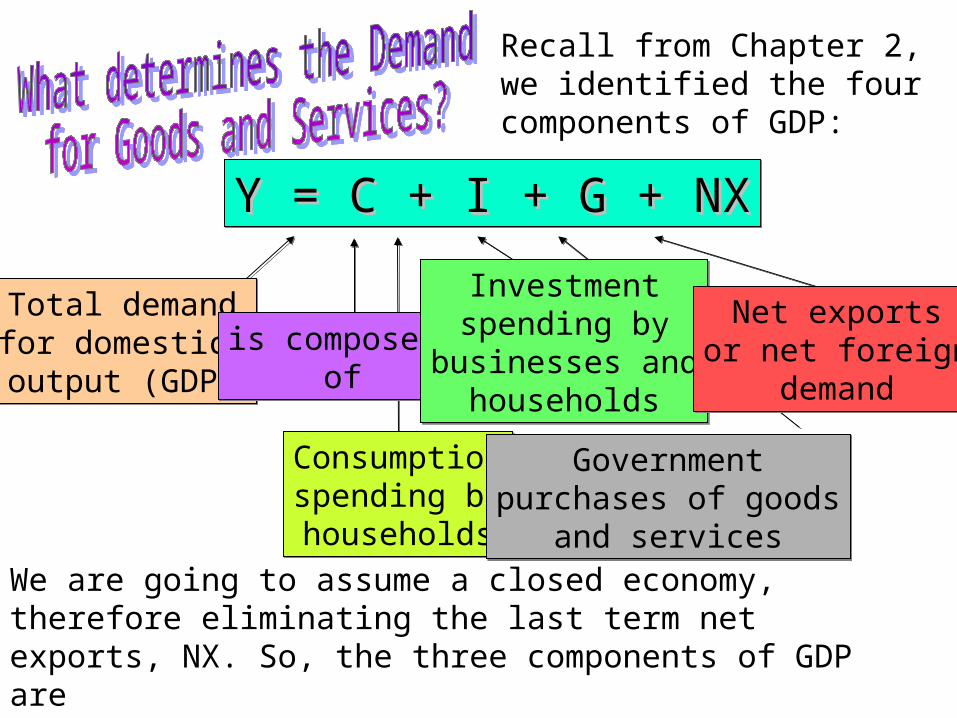
Y = C + I + G + NXY = C + I + G + NXY = C + I + G + NXY = C + I + G + NX
Total demandfor domestic output (GDP)
Total demandfor domestic output (GDP)
Recall from Chapter 2, we identified the four components of GDP:
We are going to assume a closed economy, therefore eliminating the last term net exports, NX. So, the three components of GDP areConsumption (C), Investment (I) and Government purchases (G). Let’s see how GDP is allocated among these three uses.
Consumptionspending byhouseholds
Consumptionspending byhouseholds
is composed of
is composed of
Governmentpurchases of goods
and services
Governmentpurchases of goods
and services
Investmentspending by
businesses andhouseholds
Investmentspending by
businesses andhouseholds
Net exportsor net foreign
demand
Net exportsor net foreign
demand
21Chapter Three
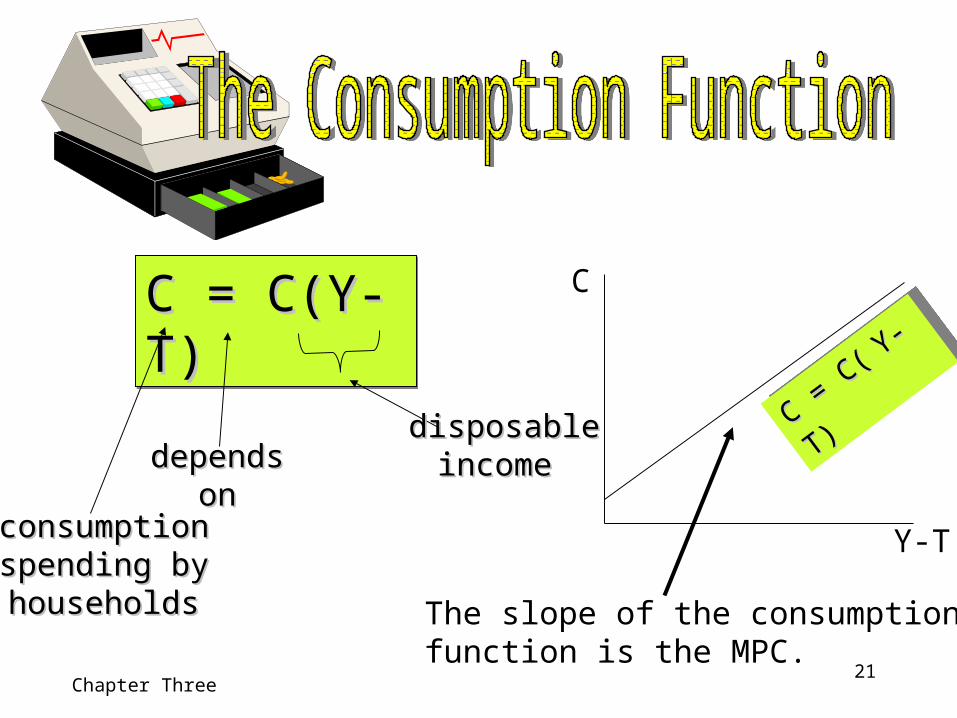
C = C(Y- T) C = C(Y- T) C = C(Y- T) C = C(Y- T)
consumptionconsumptionspending byspending byhouseholdshouseholds
dependsdependsonon
disposabledisposableincome income
C
Y-T
The slope of the consumption function is the MPC.
C = C(
C = C( Y-T
) Y-T
)
C = C(
C = C( Y-T
) Y-T
)
22Chapter Three
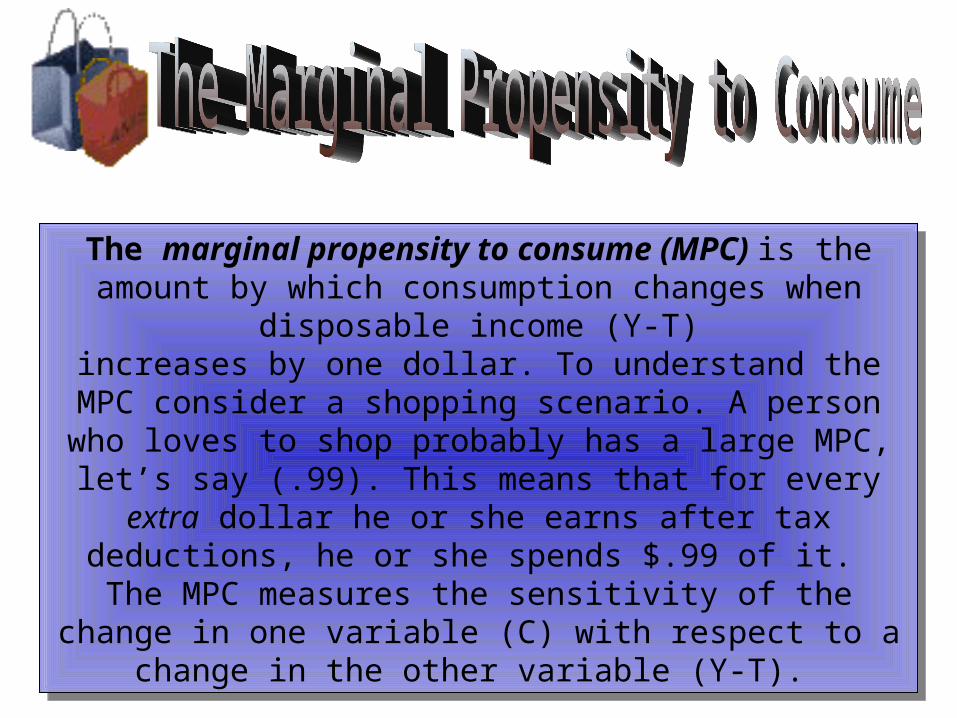
The marginal propensity to consume (MPC) is the amount by which consumption changes when disposable income (Y-T)increases by one dollar. To understand the MPC consider a
shopping scenario. A person who loves to shop probably has a large MPC, let’s say (.99). This means that for every extra dollar he or she earns after tax deductions, he or she spends $.99 of it. The MPC measures the sensitivity of the change in one variable
(C) with respect to a change in the other variable (Y-T).
23Chapter Three
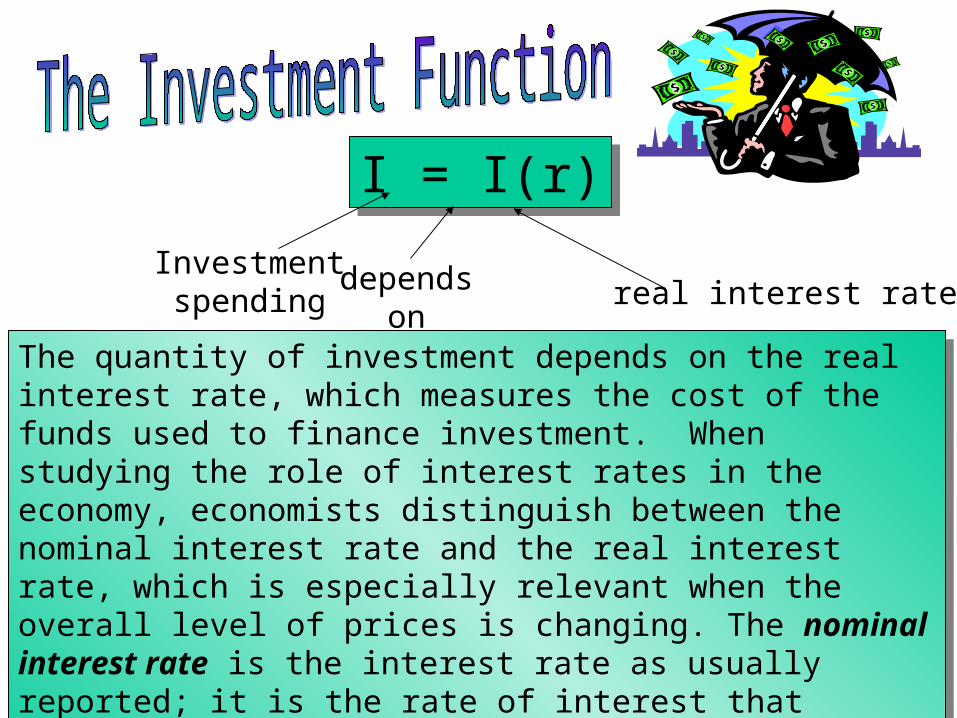
I = I(r)I = I(r)
Investmentspending
dependson
real interest rate
The quantity of investment depends on the real interest rate, which measures the cost of the funds used to finance investment. When studying the role of interest rates in the economy, economists distinguish between the nominal interest rate and the real interest rate, which is especially relevant when the overall level of prices is changing. The nominal interest rate is the interest rate as usually reported; it is the rate of interest that investors pay to borrow money. The real interest rate is the nominal interest rate corrected for the effects of inflation.
The quantity of investment depends on the real interest rate, which measures the cost of the funds used to finance investment. When studying the role of interest rates in the economy, economists distinguish between the nominal interest rate and the real interest rate, which is especially relevant when the overall level of prices is changing. The nominal interest rate is the interest rate as usually reported; it is the rate of interest that investors pay to borrow money. The real interest rate is the nominal interest rate corrected for the effects of inflation.
24Chapter Three
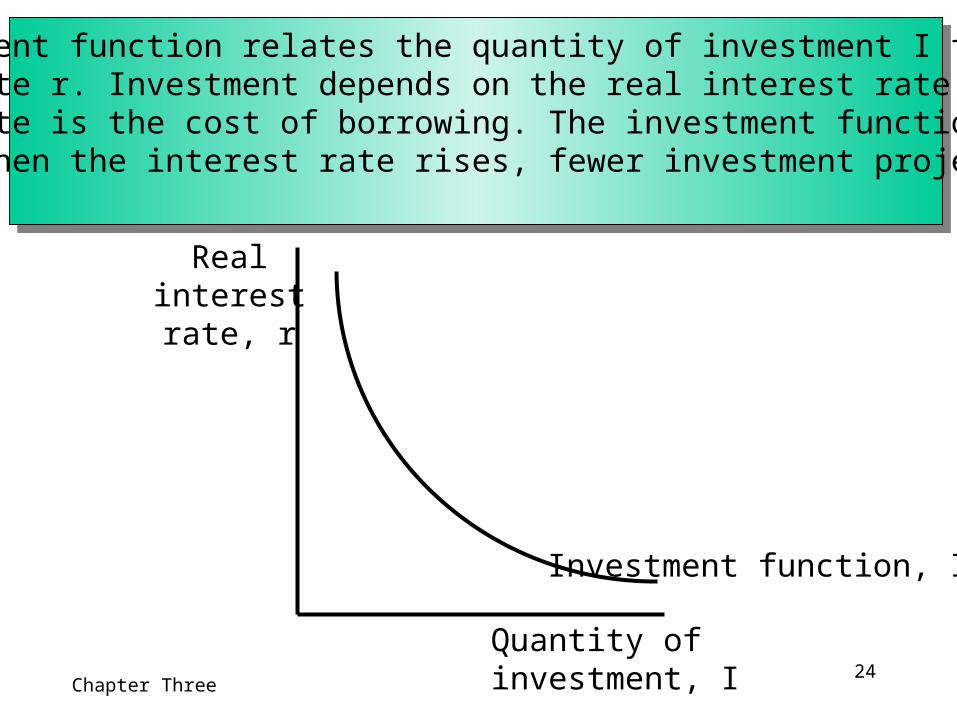
Realinterestrate, r
Quantity of investment, I
Investment function, I(r)
The investment function relates the quantity of investment I to the realinterest rate r. Investment depends on the real interest rate because theinterest rate is the cost of borrowing. The investment function slopesdownward; when the interest rate rises, fewer investment projects are profitable.
25Chapter Three
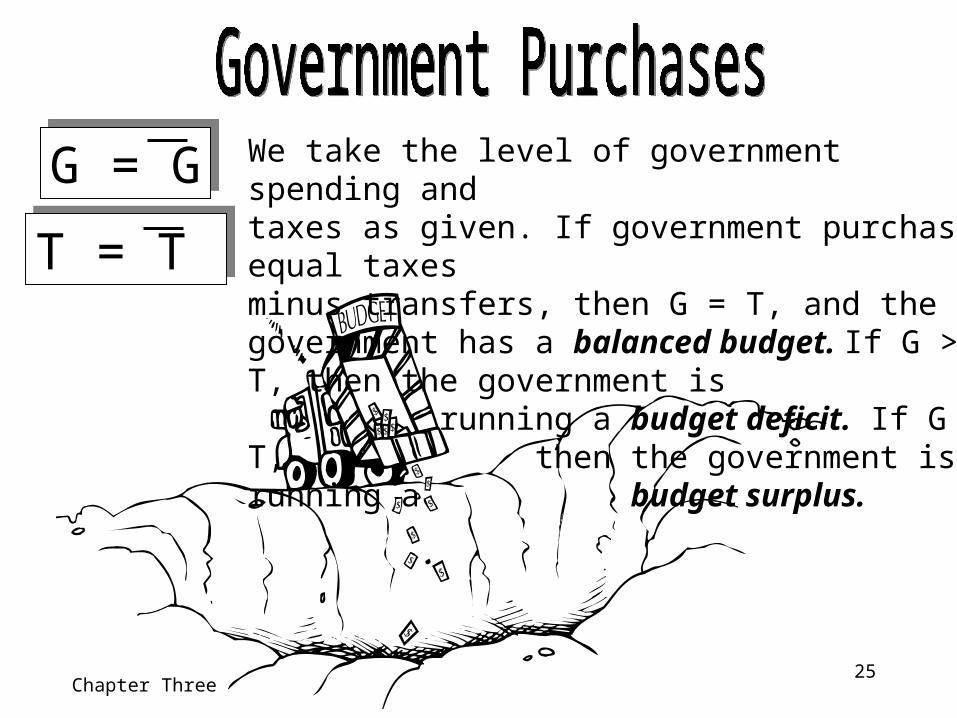
We take the level of government spending andtaxes as given. If government purchases equal taxes minus transfers, then G = T, and the government has a balanced budget. If G > T, then the government is
running a budget deficit. If G < T, then the government is running abudget surplus.
G = GG = G
T = T T = T
26Chapter Three
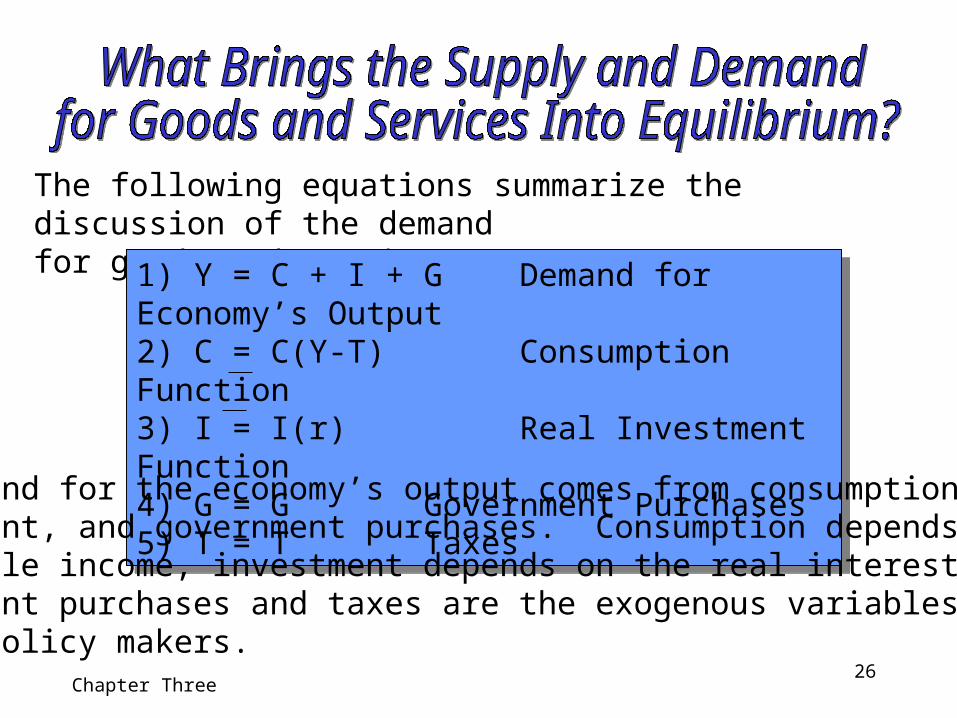
The following equations summarize the discussion of the demandfor goods and services:
1) Y = C + I + G Demand for Economy’s Output2) C = C(Y-T) Consumption Function3) I = I(r) Real Investment Function4) G = G Government Purchases5) T = T Taxes
1) Y = C + I + G Demand for Economy’s Output2) C = C(Y-T) Consumption Function3) I = I(r) Real Investment Function4) G = G Government Purchases5) T = T Taxes
The demand for the economy’s output comes from consumption,investment, and government purchases. Consumption depends ondisposable income, investment depends on the real interest rate; government purchases and taxes are the exogenous variables set byfiscal policy makers.
27Chapter Three
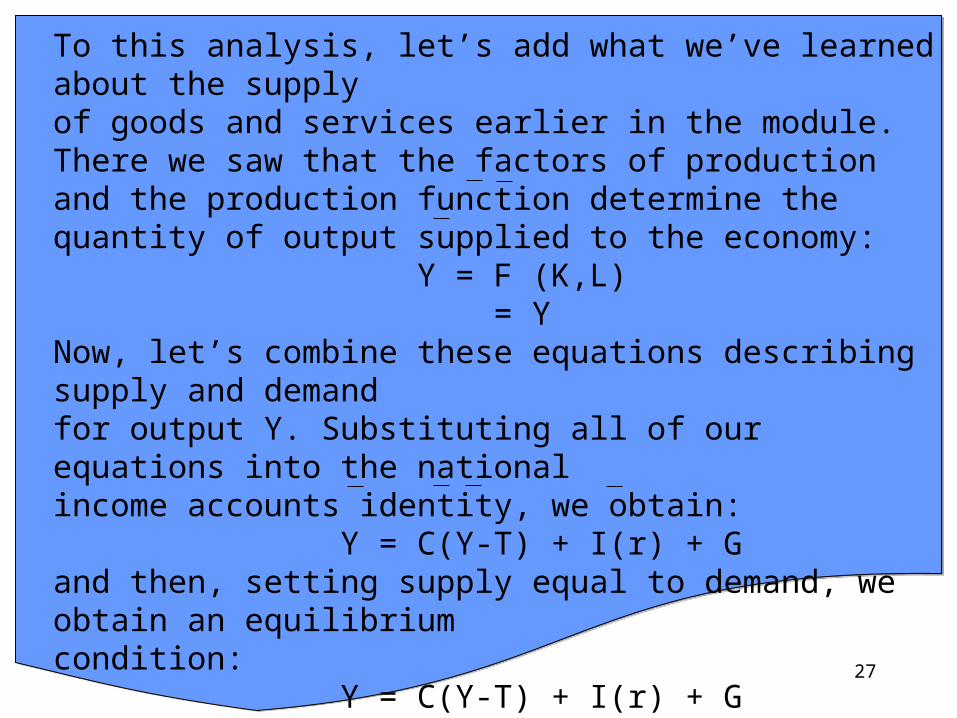
To this analysis, let’s add what we’ve learned about the supplyof goods and services earlier in the module. There we saw that the factors of production and the production function determine the quantity of output supplied to the economy:
Y = F (K,L) = Y
Now, let’s combine these equations describing supply and demandfor output Y. Substituting all of our equations into the nationalincome accounts identity, we obtain:
Y = C(Y-T) + I(r) + Gand then, setting supply equal to demand, we obtain an equilibriumcondition:
Y = C(Y-T) + I(r) + GThis equation states that the supply of output equals its demand, which is the sum of consumption, investment,and government purchases.
28Chapter Three
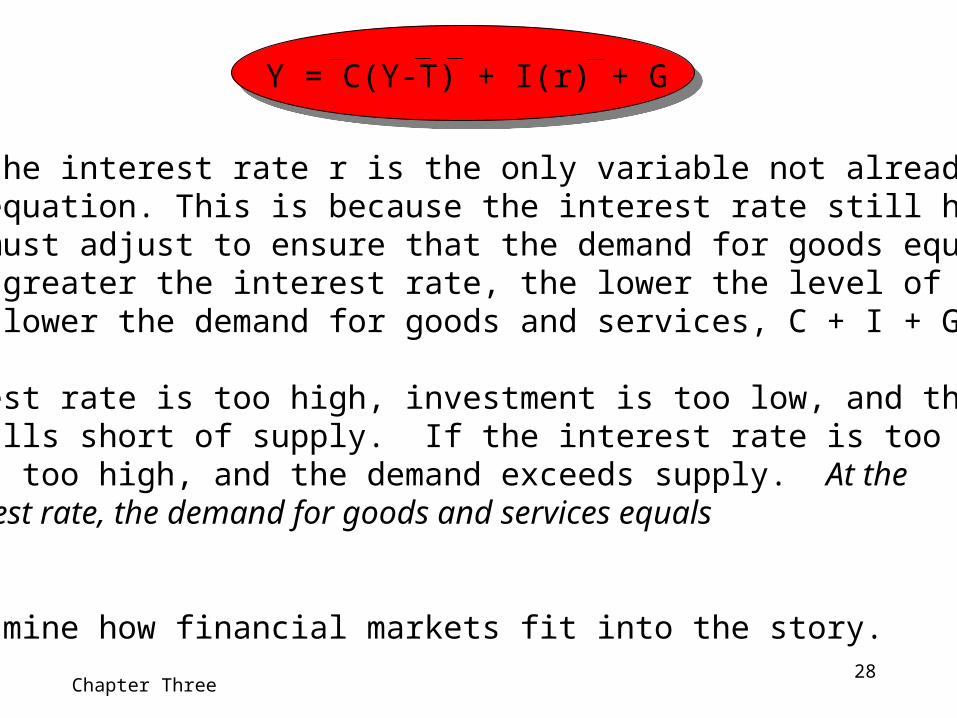
Y = C(Y-T) + I(r) + G
Notice that the interest rate r is the only variable not already determinedin the last equation. This is because the interest rate still has a key roleto play: it must adjust to ensure that the demand for goods equals thesupply. The greater the interest rate, the lower the level of investment.and thus the lower the demand for goods and services, C + I + G.
If the interest rate is too high, investment is too low, and the demandfor output falls short of supply. If the interest rate is too low, investment is too high, and the demand exceeds supply. At the equilibrium interest rate, the demand for goods and services equalsthe supply.
Let’s now examine how financial markets fit into the story.
29Chapter Three
First, rewrite the national income accounts identity as Y - C - G = I.The term Y-C-G is the output that remains after the demands ofconsumers and the government have been satisfied; it is called nationalsaving or simply, saving (S). In this form, the national income accountsidentity shows that saving equals investment.To understand this better, let’s split national saving into two parts-- oneexamining the saving of the private sector and the other representingthe saving of the government.
(Y-T-C) + (T-G) = IThe term (Y-T-C) is disposable income minus consumption, which is private saving. The term (T-G) is government revenue minus government spending, which is public saving. National saving is the sum of private and public saving.
30Chapter Three
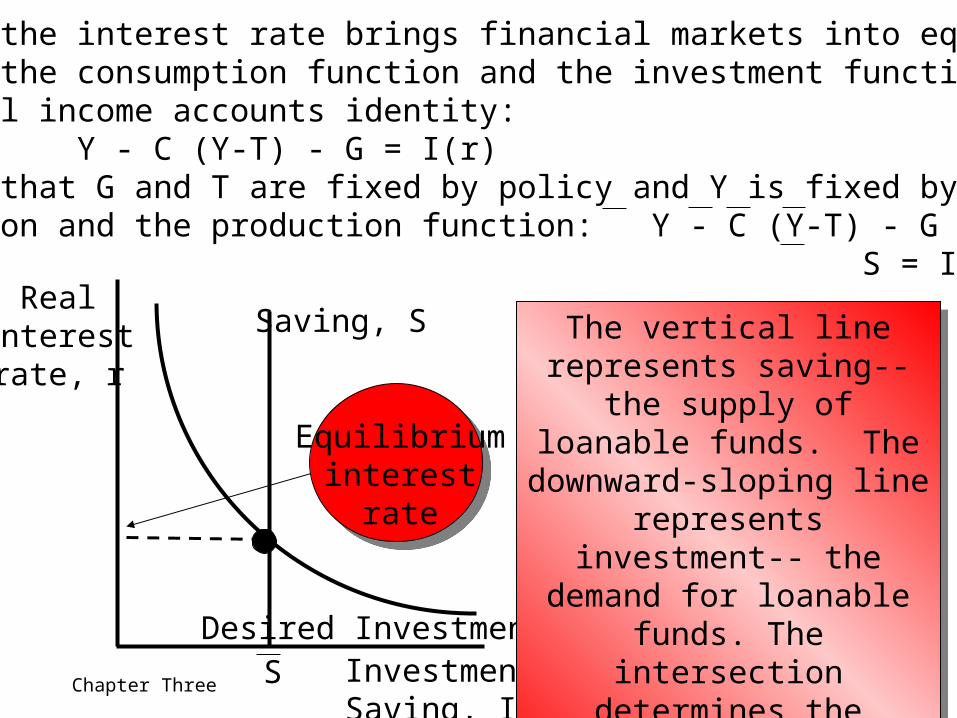
To see how the interest rate brings financial markets into equilibrium,substitute the consumption function and the investment function intothe national income accounts identity:
Y - C (Y-T) - G = I(r)Next, note that G and T are fixed by policy and Y is fixed by the factorsof production and the production function: Y - C (Y-T) - G = I(r)
S = I(r)
Investment, Saving, I, SDesired Investment, I(r)
Realinterestrate, r
Saving, S
S
Equilibriuminterest
rate
The vertical line represents saving-- the supply of loanable funds. The downward-sloping line represents investment-- the
demand for loanable funds. The intersection determines the
equilibrium interest rate.
The vertical line represents saving-- the supply of loanable funds. The downward-sloping line represents investment-- the
demand for loanable funds. The intersection determines the
equilibrium interest rate.
31Chapter Three
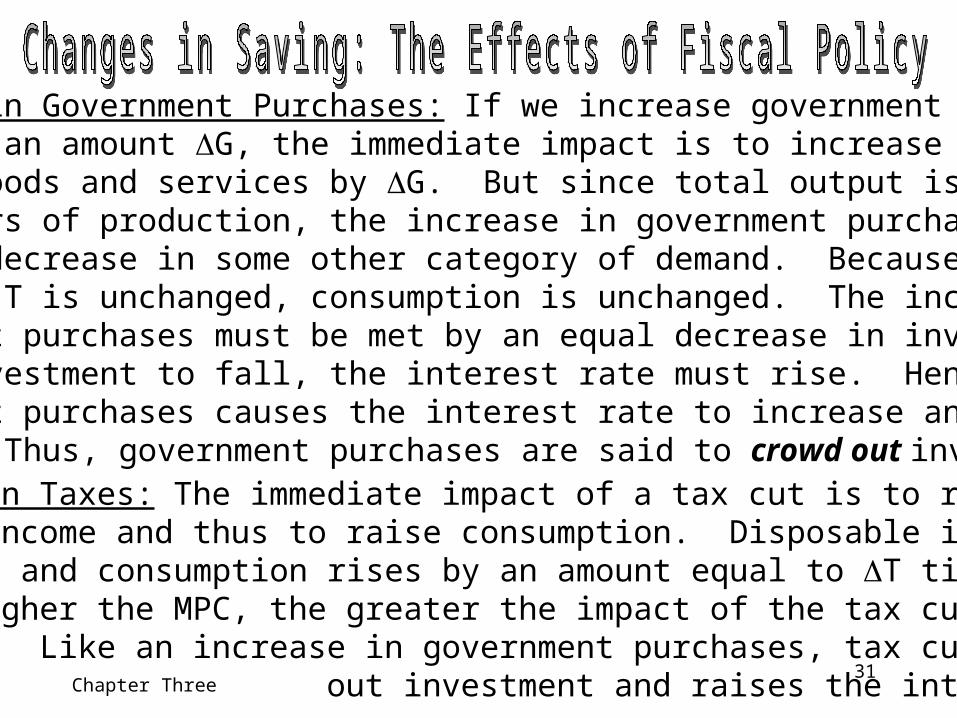
An Increase in Government Purchases: If we increase governmentpurchases by an amount G, the immediate impact is to increase thedemand for goods and services by G. But since total output is fixedby the factors of production, the increase in government purchases mustbe met by a decrease in some other category of demand. Becausedisposable Y-T is unchanged, consumption is unchanged. The increasein government purchases must be met by an equal decrease in investment.To induce investment to fall, the interest rate must rise. Hence, the rise in government purchases causes the interest rate to increase and investmentto decrease. Thus, government purchases are said to crowd out investment.A Decrease in Taxes: The immediate impact of a tax cut is to raise disposable income and thus to raise consumption. Disposable incomerises by T, and consumption rises by an amount equal to T times theMPC. The higher the MPC, the greater the impact of the tax cut onconsumption. Like an increase in government purchases, tax cuts crowd out investment and raises the interest rate.
32Chapter Three
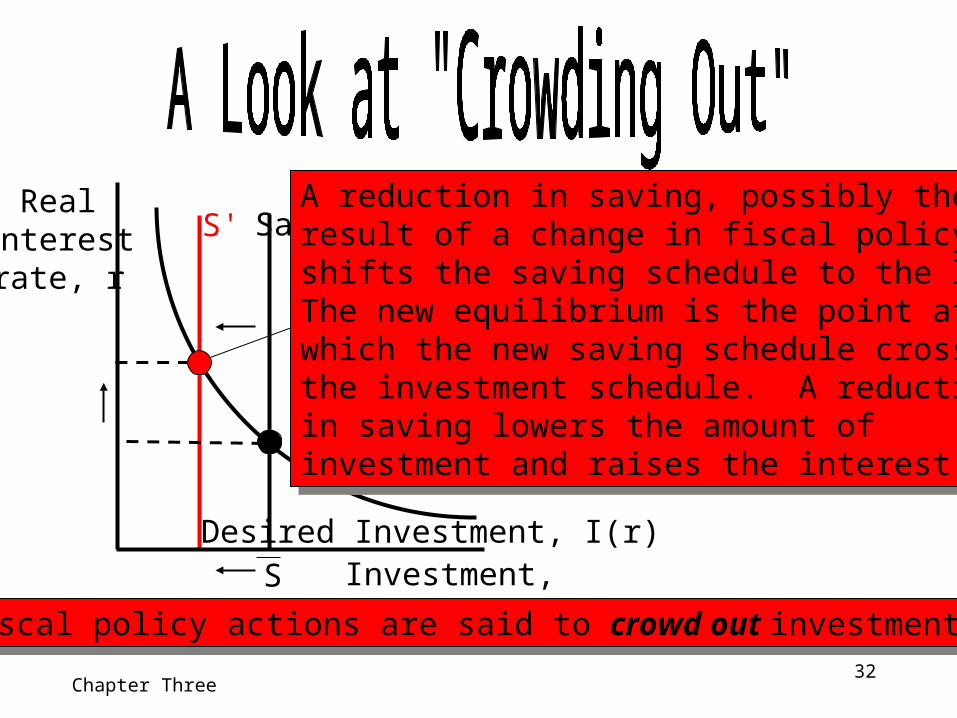
S'
Investment, Saving, I, SDesired Investment, I(r)
Realinterestrate, r
Saving, S
S
A reduction in saving, possibly the result of a change in fiscal policy,shifts the saving schedule to the left.The new equilibrium is the point at which the new saving schedule crossesthe investment schedule. A reductionin saving lowers the amount of investment and raises the interest rate.
A reduction in saving, possibly the result of a change in fiscal policy,shifts the saving schedule to the left.The new equilibrium is the point at which the new saving schedule crossesthe investment schedule. A reductionin saving lowers the amount of investment and raises the interest rate.
Fiscal policy actions are said to crowd out investment.Fiscal policy actions are said to crowd out investment.
33Chapter Three
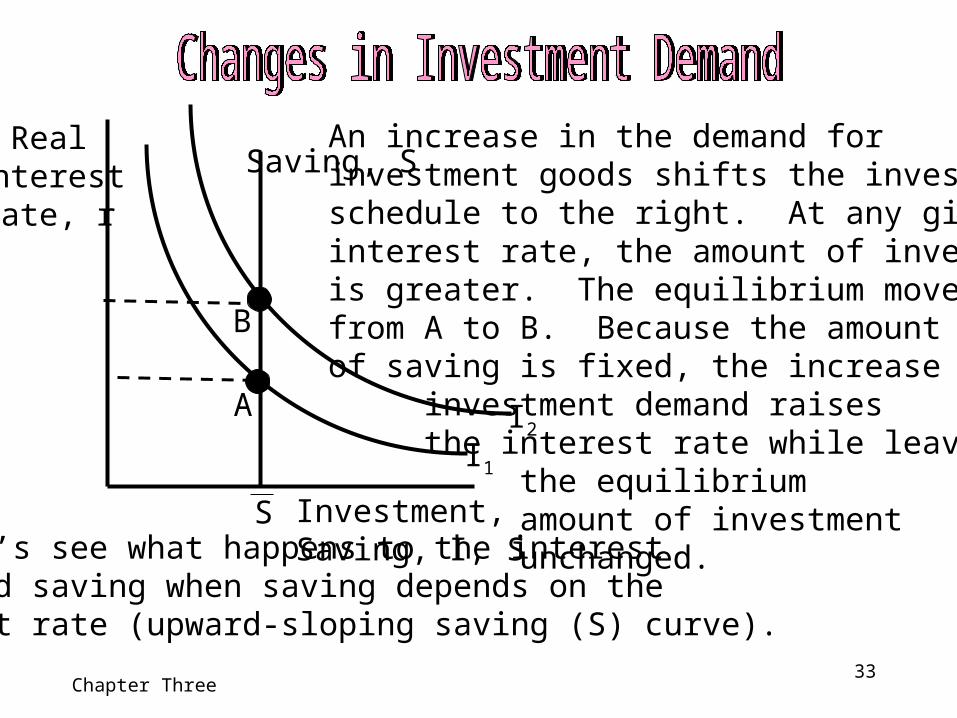
An increase in the demand for investment goods shifts the investmentschedule to the right. At any giveninterest rate, the amount of investmentis greater. The equilibrium movesfrom A to B. Because the amountof saving is fixed, the increase in
investment demand raisesthe interest rate while leaving
the equilibriumamount of investmentunchanged.Now let’s see what happens to the interest
rate and saving when saving depends on the interest rate (upward-sloping saving (S) curve).
Investment, Saving, I, S
I1
Realinterestrate, r
Saving, S
S
I2A
B
34Chapter Three
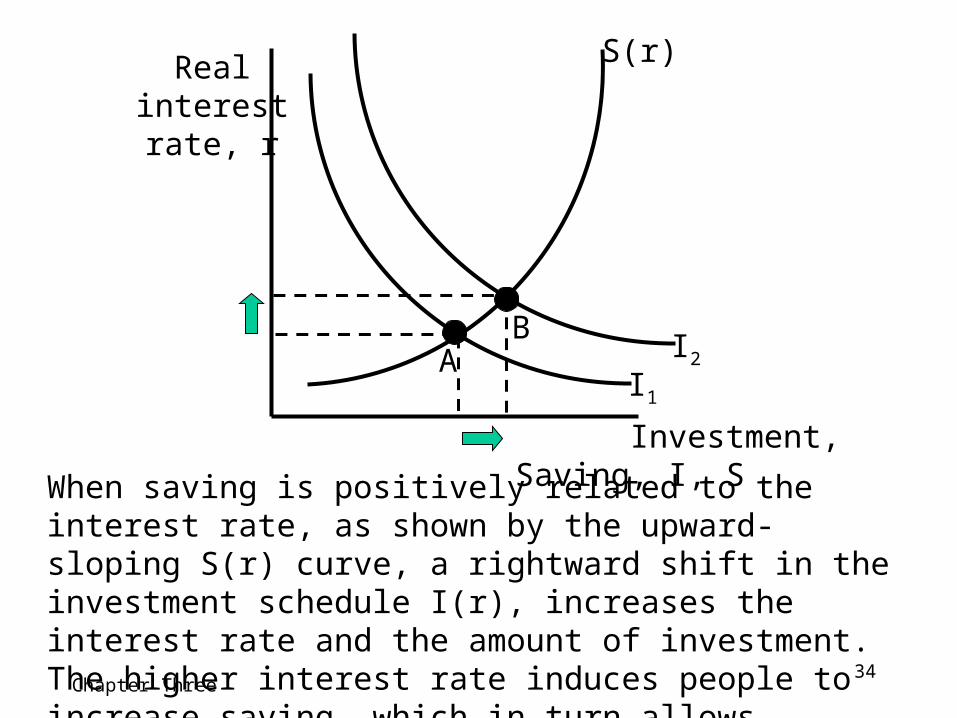
When saving is positively related to the interest rate, as shown by the upward-sloping S(r) curve, a rightward shift in the investment schedule I(r), increases the interest rate and the amount of investment. The higher interest rate induces people to increase saving, which in turn allows investment to increase.
Investment, Saving, I, S
I1
Realinterestrate, r
S(r)
I2AB
35Chapter Three
Factors of production Production functionConstant returns to scaleFactor pricesCompetitionMarginal product of labor (MPL)Diminishing marginal productReal wageMarginal product of capital (MPK)Real rental price of capitalEconomic profit vs. accounting profitDisposable incomeConsumption functionMarginal propensity to consume
Nominal interest rateReal interest rateNational saving (saving)Private savingPublic savingLoanable fundsCrowding out