Embed Size (px)
Citation preview
1Chapter 9. Section 9-1 and 9-2. Triola, Elementary Statistics, Eighth Edition. Copyright 2001. Addison Wesley Longman
C.M. PascualC.M. Pascual
ELEMENTARY
STATISTICS
Chapter 9 Correlation and Regression
2Chapter 9. Section 9-1 and 9-2. Triola, Elementary Statistics, Eighth Edition. Copyright 2001. Addison Wesley Longman
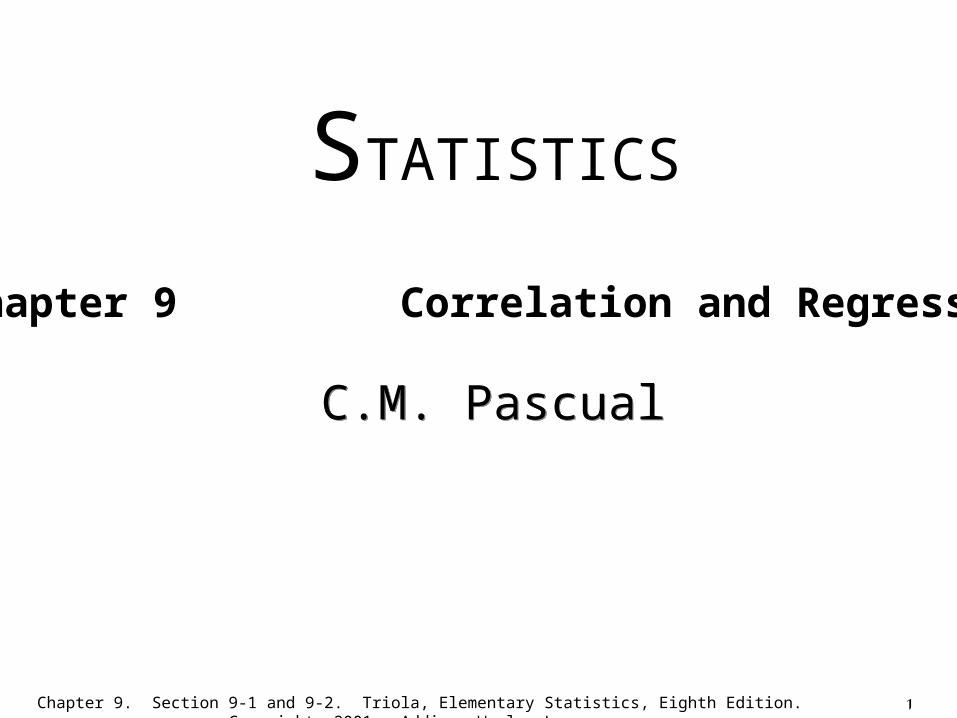
Chapter 9Correlation and Regression
9-1 Overview
9-2 Correlation
9-3 Regression
9-4 Variation and Prediction Intervals
9-5 Multiple Regression
9-6 Modeling
3Chapter 9. Section 9-1 and 9-2. Triola, Elementary Statistics, Eighth Edition. Copyright 2001. Addison Wesley Longman
9-1 Overview
Paired Data
is there a relationship
if so, what is the equation
use the equation for prediction
4Chapter 9. Section 9-1 and 9-2. Triola, Elementary Statistics, Eighth Edition. Copyright 2001. Addison Wesley Longman
9-2
Correlation
5Chapter 9. Section 9-1 and 9-2. Triola, Elementary Statistics, Eighth Edition. Copyright 2001. Addison Wesley Longman
Definition
Correlation
exists between two variables when one of them is related to the other in some way
6Chapter 9. Section 9-1 and 9-2. Triola, Elementary Statistics, Eighth Edition. Copyright 2001. Addison Wesley Longman
Assumptions
1. The sample of paired data (x,y) is a random sample.
2. The pairs of (x,y) data have a bivariate normal distribution.
7Chapter 9. Section 9-1 and 9-2. Triola, Elementary Statistics, Eighth Edition. Copyright 2001. Addison Wesley Longman
Definition
Scatterplot (or scatter diagram)
is a graph in which the paired (x,y) sample data are plotted with a horizontal x axis and a vertical y axis. Each individual (x,y) pair is plotted as a single point.
8Chapter 9. Section 9-1 and 9-2. Triola, Elementary Statistics, Eighth Edition. Copyright 2001. Addison Wesley Longman
Scatter Diagram of Paired Data
9Chapter 9. Section 9-1 and 9-2. Triola, Elementary Statistics, Eighth Edition. Copyright 2001. Addison Wesley Longman
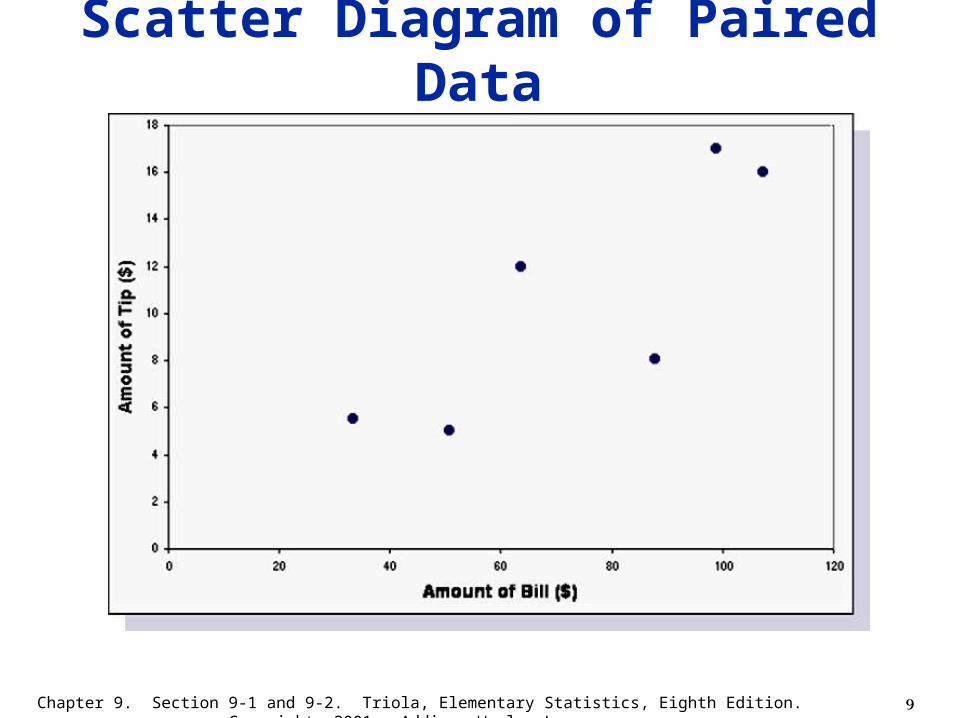
Scatter Diagram of Paired Data
10Chapter 9. Section 9-1 and 9-2. Triola, Elementary Statistics, Eighth Edition. Copyright 2001. Addison Wesley Longman
Positive Linear Correlation
x x
yy y
x
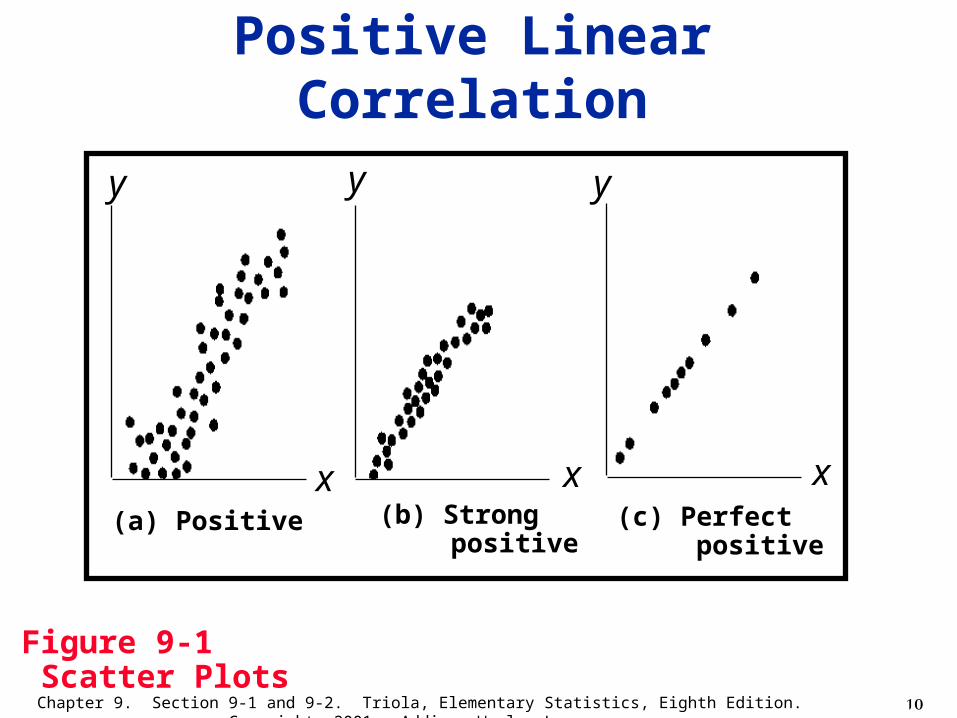
Figure 9-1 Scatter Plots
(a) Positive (b) Strong positive
(c) Perfect positive
11Chapter 9. Section 9-1 and 9-2. Triola, Elementary Statistics, Eighth Edition. Copyright 2001. Addison Wesley Longman
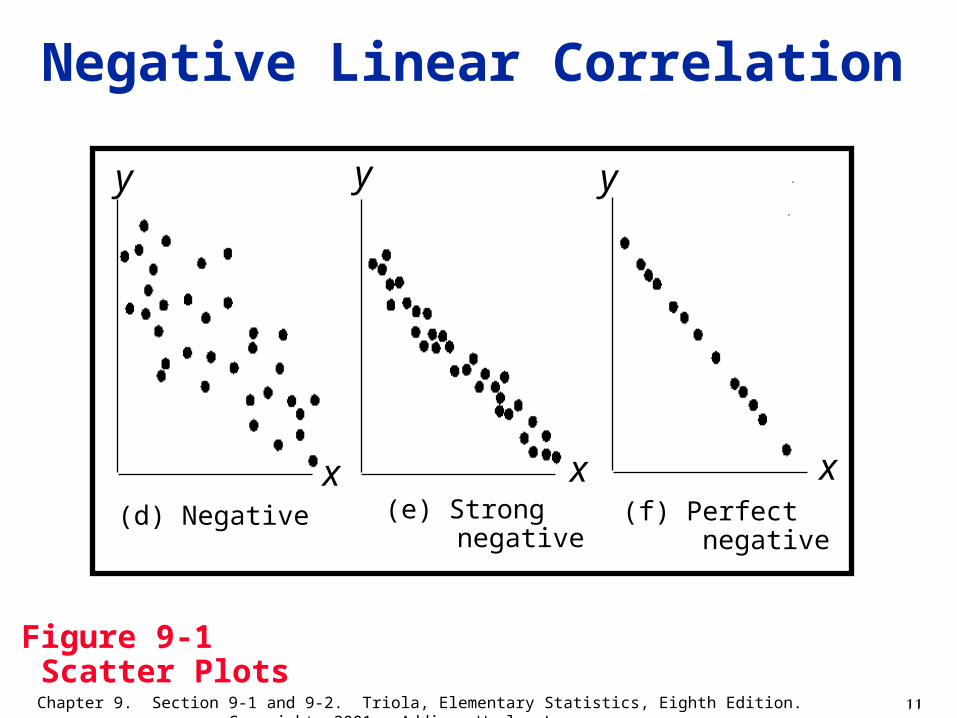
Negative Linear Correlation
x x
yy y
x(d) Negative (e) Strong
negative(f) Perfect
negative
Figure 9-1 Scatter Plots
12Chapter 9. Section 9-1 and 9-2. Triola, Elementary Statistics, Eighth Edition. Copyright 2001. Addison Wesley Longman
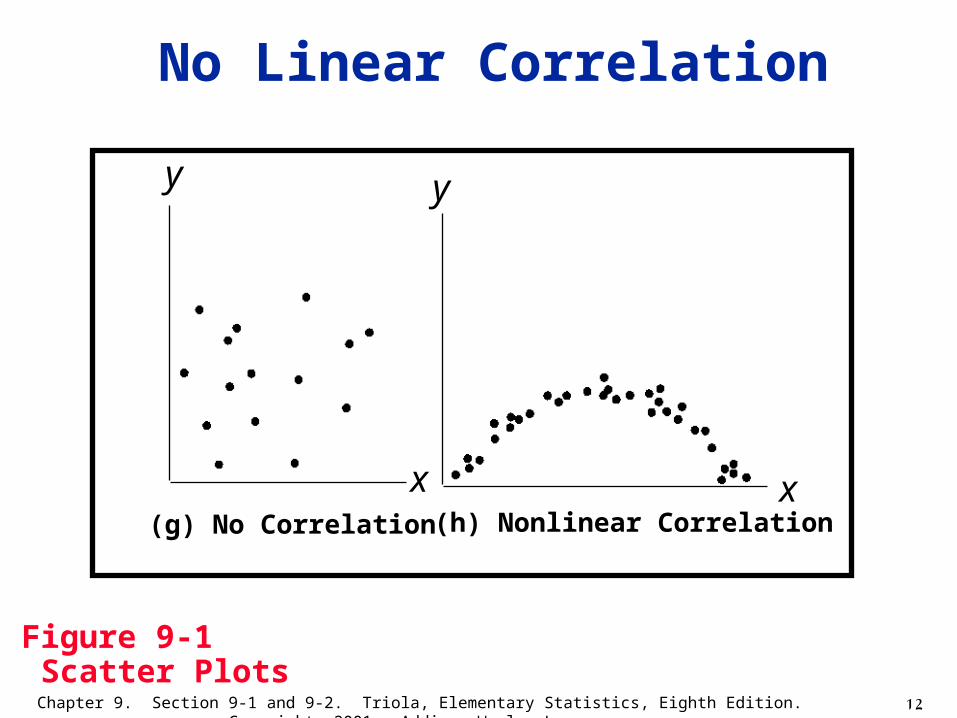
No Linear Correlation
x x
yy
(g) No Correlation (h) Nonlinear Correlation
Figure 9-1 Scatter Plots
13Chapter 9. Section 9-1 and 9-2. Triola, Elementary Statistics, Eighth Edition. Copyright 2001. Addison Wesley Longman
DefinitionLinear Correlation Coefficient r
measures strength of the linear relationship between paired x and y values in a sample
14Chapter 9. Section 9-1 and 9-2. Triola, Elementary Statistics, Eighth Edition. Copyright 2001. Addison Wesley Longman
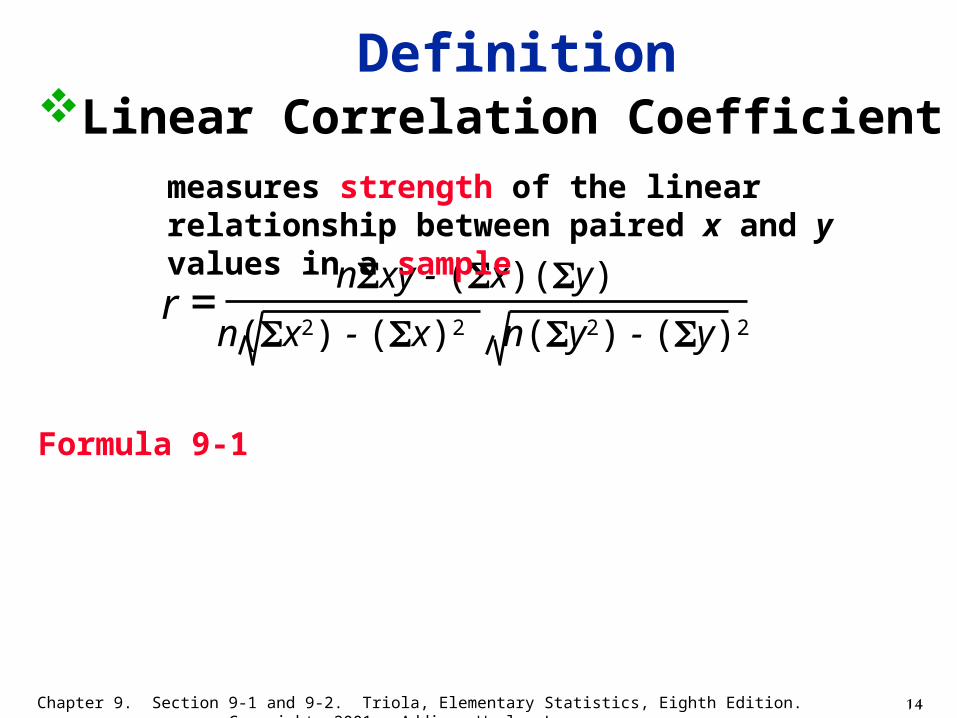
nxy - (x)(y)
n(x2) - (x)2 n(y2) - (y)2r =
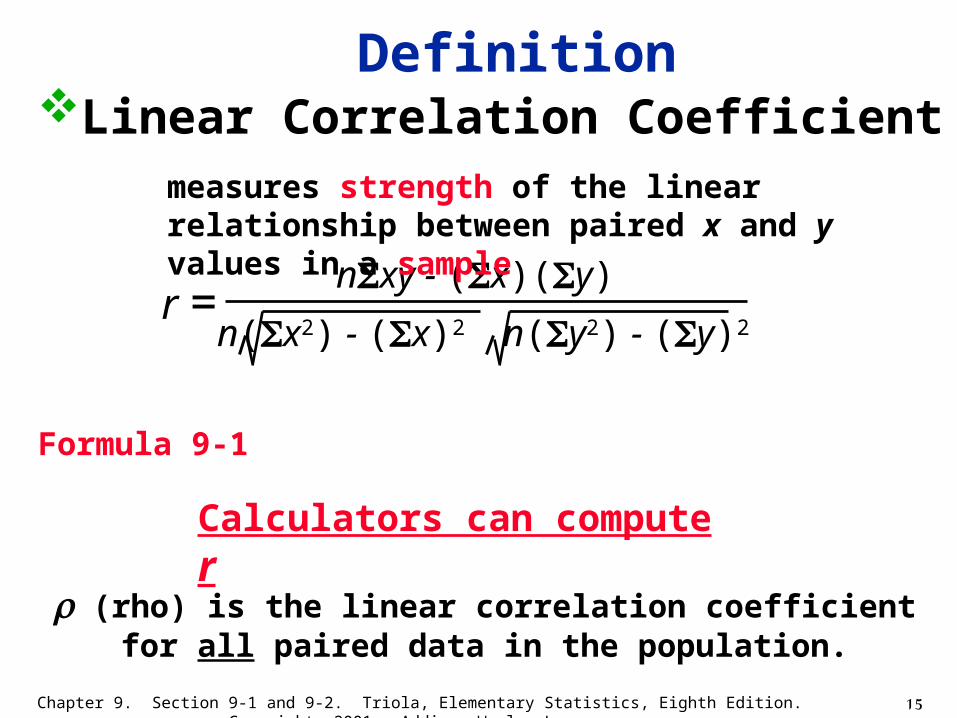
DefinitionLinear Correlation Coefficient r
Formula 9-1
measures strength of the linear relationship between paired x and y values in a sample
15Chapter 9. Section 9-1 and 9-2. Triola, Elementary Statistics, Eighth Edition. Copyright 2001. Addison Wesley Longman
nxy - (x)(y)
n(x2) - (x)2 n(y2) - (y)2r =
DefinitionLinear Correlation Coefficient r
Formula 9-1
measures strength of the linear relationship between paired x and y values in a sample
Calculators can compute r
(rho) is the linear correlation coefficient for all paired data in the population.
16Chapter 9. Section 9-1 and 9-2. Triola, Elementary Statistics, Eighth Edition. Copyright 2001. Addison Wesley Longman
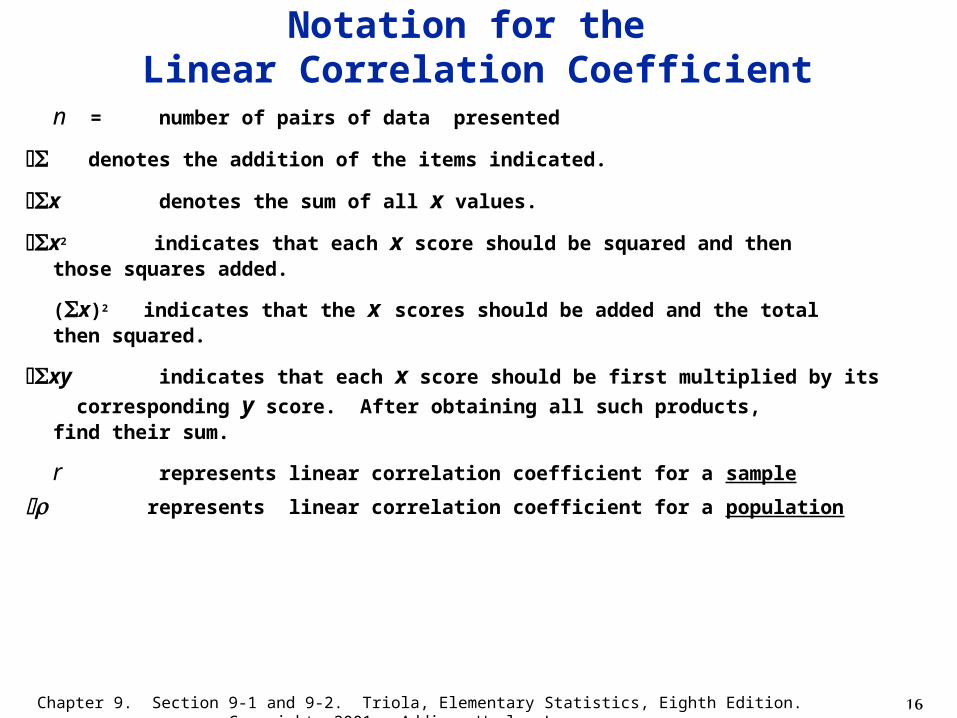
Notation for the Linear Correlation Coefficient
n = number of pairs of data presented
denotes the addition of the items indicated.
x denotes the sum of all x values.
x2 indicates that each x score should be squared and then those squares added.
(x)2 indicates that the x scores should be added and the total then squared.
xy indicates that each x score should be first multiplied by its
corresponding y score. After obtaining all such products, find their sum.
r represents linear correlation coefficient for a sample
represents linear correlation coefficient for a population
17Chapter 9. Section 9-1 and 9-2. Triola, Elementary Statistics, Eighth Edition. Copyright 2001. Addison Wesley Longman
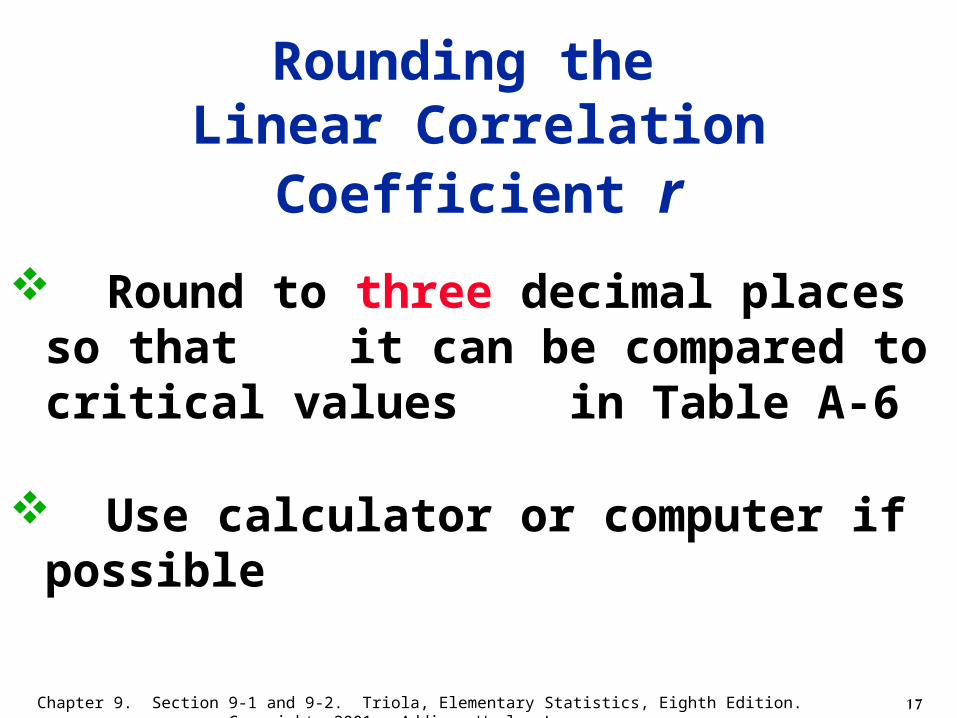
Round to three decimal places so that it can be compared to critical values in Table A-6
Use calculator or computer if possible
Rounding the Linear Correlation Coefficient r
18Chapter 9. Section 9-1 and 9-2. Triola, Elementary Statistics, Eighth Edition. Copyright 2001. Addison Wesley Longman
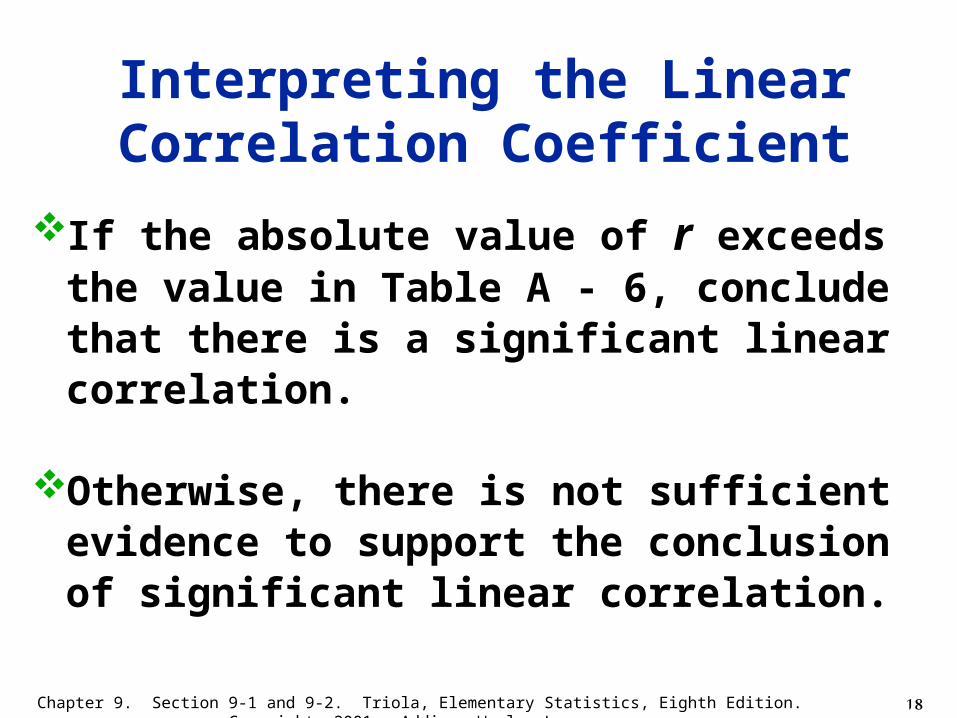
Interpreting the Linear Correlation Coefficient
If the absolute value of r exceeds the value in Table A - 6, conclude that there is a significant linear correlation.
Otherwise, there is not sufficient evidence to support the conclusion of significant linear correlation.
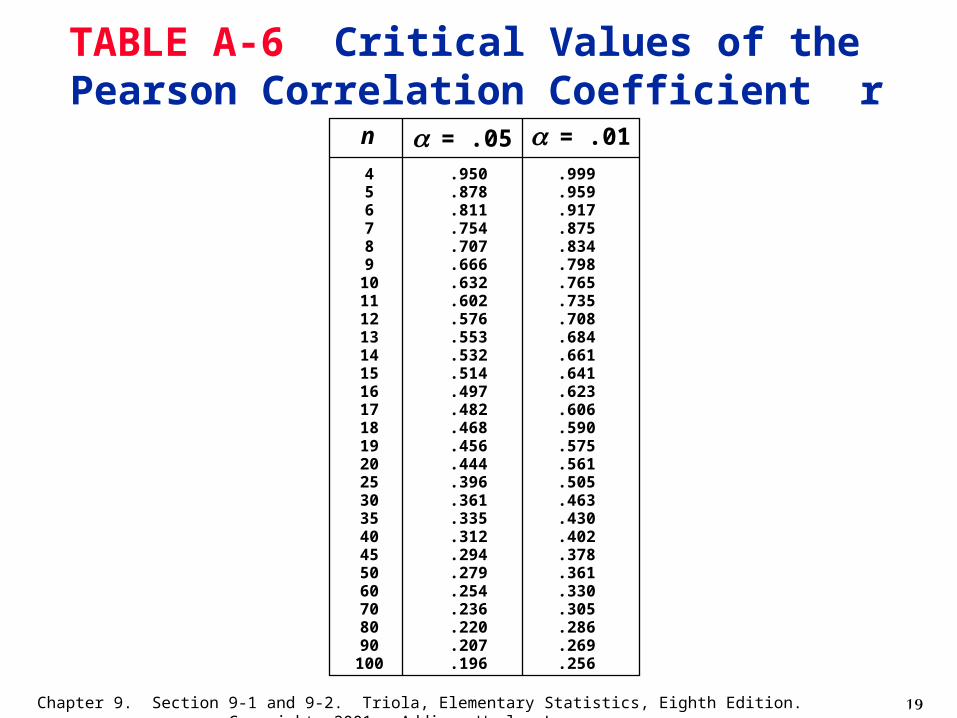
19Chapter 9. Section 9-1 and 9-2. Triola, Elementary Statistics, Eighth Edition. Copyright 2001. Addison Wesley Longman
TABLE A-6 Critical Values of the Pearson Correlation Coefficient r
456789
101112131415161718192025303540455060708090
100
n
.999
.959
.917
.875
.834
.798
.765
.735
.708
.684
.661
.641
.623
.606
.590
.575
.561
.505
.463
.430
.402
.378
.361
.330
.305
.286
.269
.256
.950
.878
.811
.754
.707
.666
.632
.602
.576
.553
.532
.514
.497
.482
.468
.456
.444
.396
.361
.335
.312
.294
.279
.254
.236
.220
.207
.196
= .05 = .01
20Chapter 9. Section 9-1 and 9-2. Triola, Elementary Statistics, Eighth Edition. Copyright 2001. Addison Wesley Longman
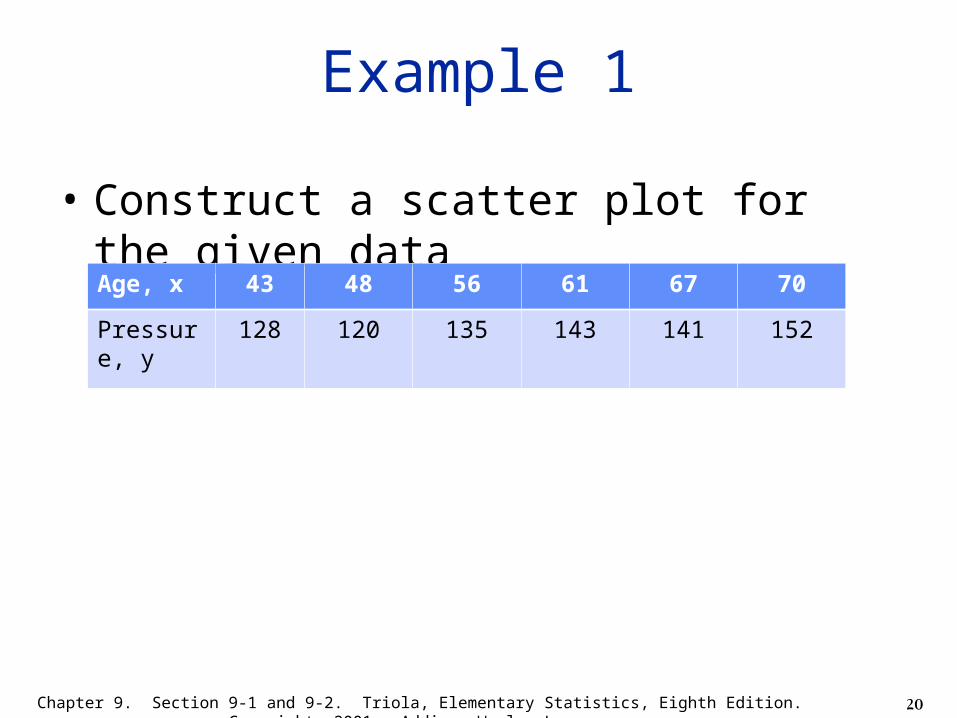
Example 1
• Construct a scatter plot for the given data
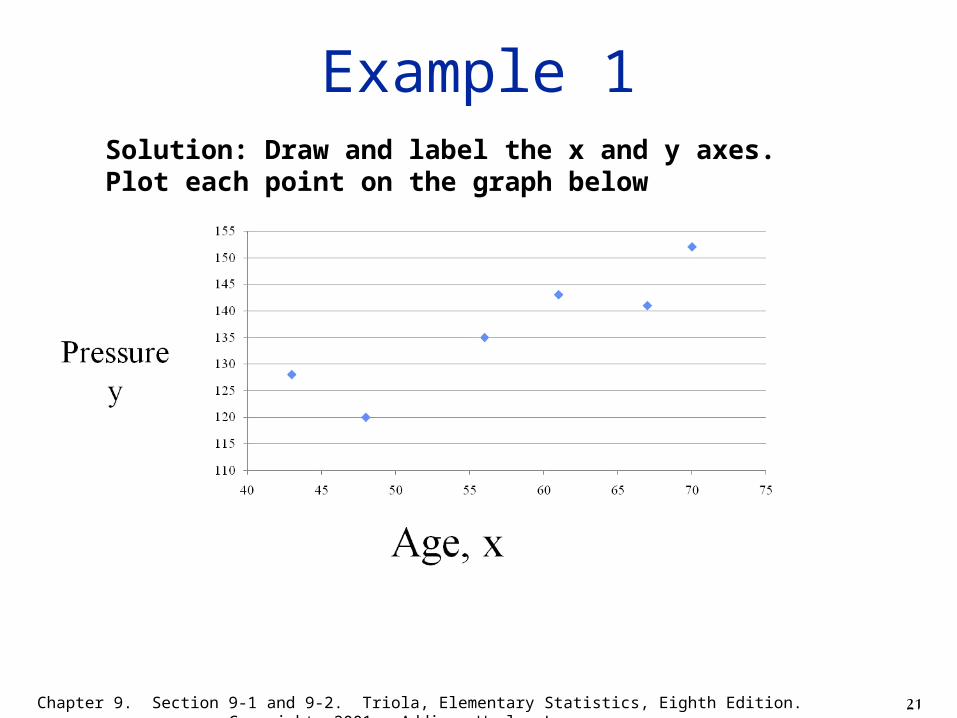
Age, x 43 48 56 61 67 70
Pressure, y 128 120 135 143 141 152
21Chapter 9. Section 9-1 and 9-2. Triola, Elementary Statistics, Eighth Edition. Copyright 2001. Addison Wesley Longman
Example 1Solution: Draw and label the x and y axes. Plot each point on the graph below
22Chapter 9. Section 9-1 and 9-2. Triola, Elementary Statistics, Eighth Edition. Copyright 2001. Addison Wesley Longman
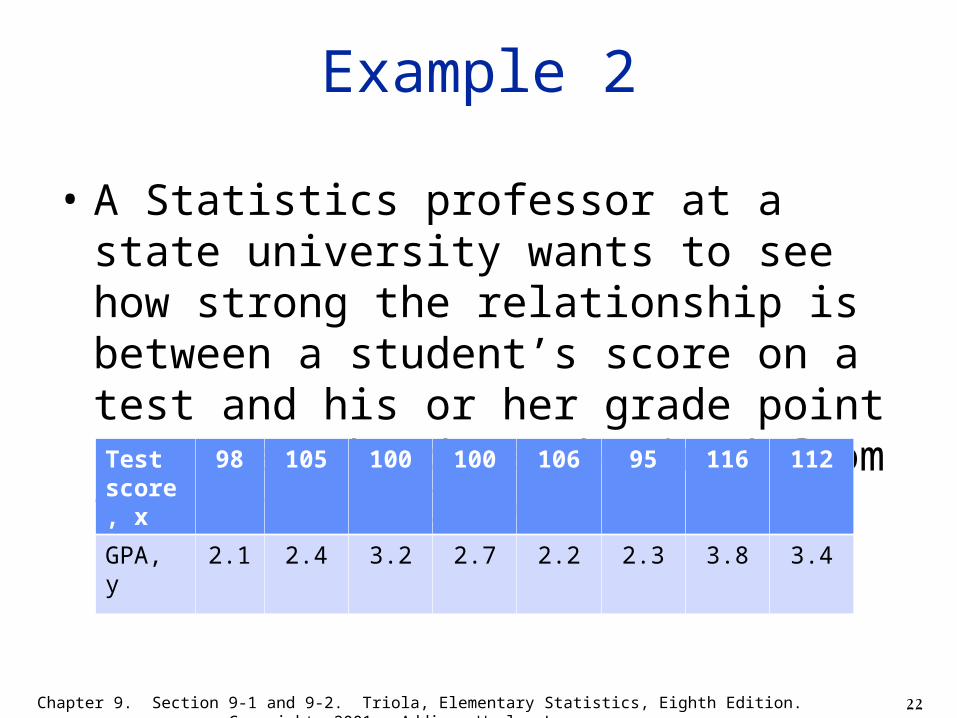
Example 2
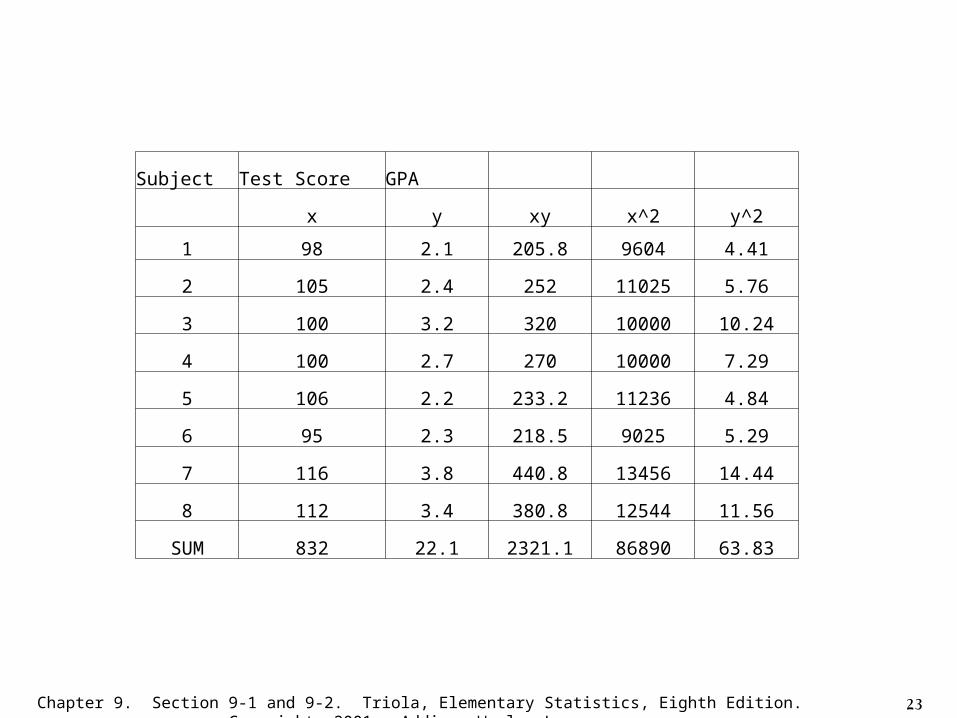
• A Statistics professor at a state university wants to see how strong the relationship is between a student’s score on a test and his or her grade point average. The data obtained from the sample follow:Test score, x
98 105 100 100 106 95 116 112
GPA, y 2.1 2.4 3.2 2.7 2.2 2.3 3.8 3.4
23Chapter 9. Section 9-1 and 9-2. Triola, Elementary Statistics, Eighth Edition. Copyright 2001. Addison Wesley Longman
Subject Test Score GPA
x y xy x^2 y^2
1 98 2.1 205.8 9604 4.41
2 105 2.4 252 11025 5.76
3 100 3.2 320 10000 10.24
4 100 2.7 270 10000 7.29
5 106 2.2 233.2 11236 4.84
6 95 2.3 218.5 9025 5.29
7 116 3.8 440.8 13456 14.44
8 112 3.4 380.8 12544 11.56
SUM 832 22.1 2321.1 86890 63.83
24Chapter 9. Section 9-1 and 9-2. Triola, Elementary Statistics, Eighth Edition. Copyright 2001. Addison Wesley Longman
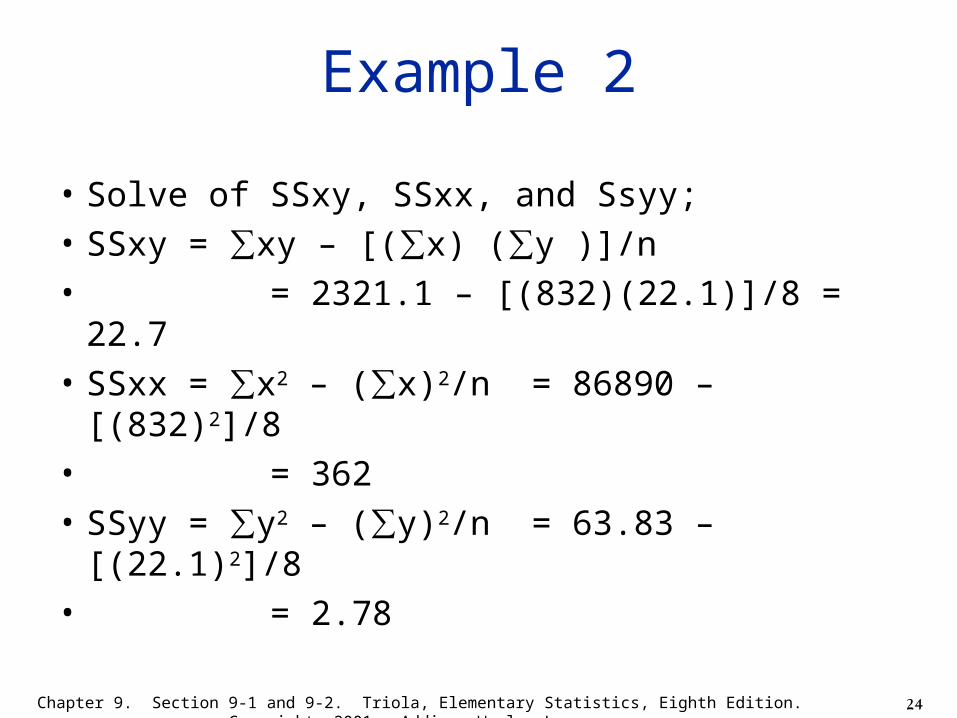
Example 2
• Solve of SSxy, SSxx, and Ssyy;
• SSxy = ∑xy – [(∑x) (∑y )]/n
• = 2321.1 – [(832)(22.1)]/8 = 22.7
• SSxx = ∑x2 – (∑x)2/n = 86890 – [(832)2]/8
• = 362
• SSyy = ∑y2 – (∑y)2/n = 63.83 – [(22.1)2]/8
• = 2.78
25Chapter 9. Section 9-1 and 9-2. Triola, Elementary Statistics, Eighth Edition. Copyright 2001. Addison Wesley Longman
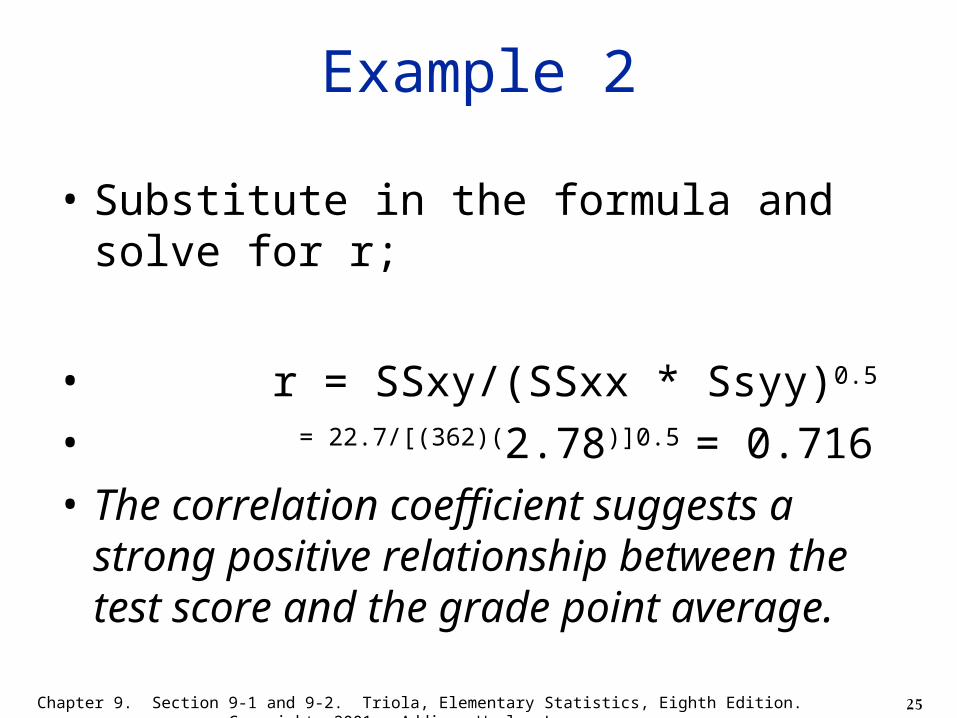
Example 2
• Substitute in the formula and solve for r;
• r = SSxy/(SSxx * Ssyy)0.5
• = 22.7/[(362)(2.78)]0.5 = 0.716
• The correlation coefficient suggests a strong positive relationship between the test score and the grade point average.
26Chapter 9. Section 9-1 and 9-2. Triola, Elementary Statistics, Eighth Edition. Copyright 2001. Addison Wesley Longman
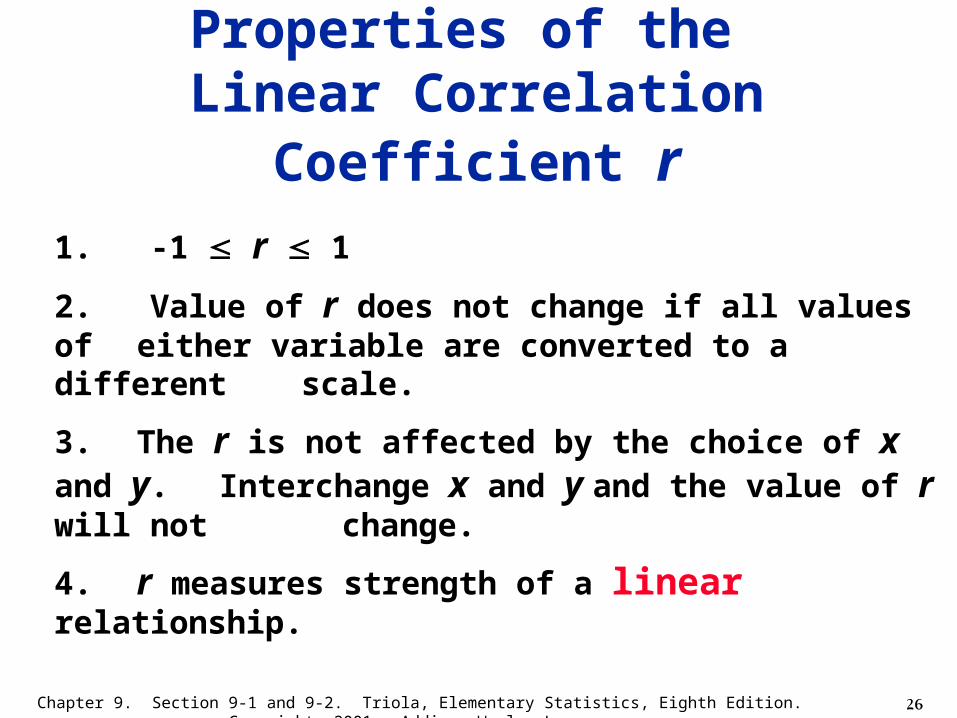
Properties of the Linear Correlation Coefficient r
1. -1 r 1
2. Value of r does not change if all values of either variable are converted to a different scale.
3. The r is not affected by the choice of x and y. Interchange x and y and the value of r will not
change.
4. r measures strength of a linear relationship.
27Chapter 9. Section 9-1 and 9-2. Triola, Elementary Statistics, Eighth Edition. Copyright 2001. Addison Wesley Longman
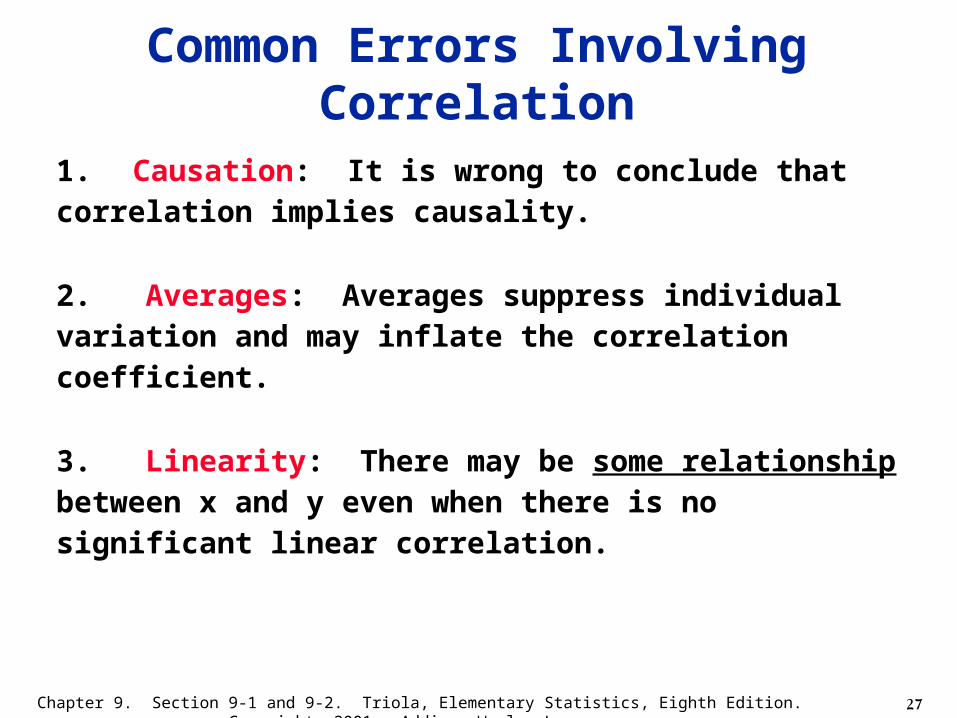
Common Errors Involving Correlation
1. Causation: It is wrong to conclude that correlation implies causality.
2. Averages: Averages suppress individual variation and may inflate the correlation coefficient.
3. Linearity: There may be some relationship between x and y even when there is no significant linear correlation.
28Chapter 9. Section 9-1 and 9-2. Triola, Elementary Statistics, Eighth Edition. Copyright 2001. Addison Wesley Longman
0
50
100
150
200
250
0 1 2 3 4 5 6 7 8
Dis
tan
ce(f
eet)
Time (seconds)
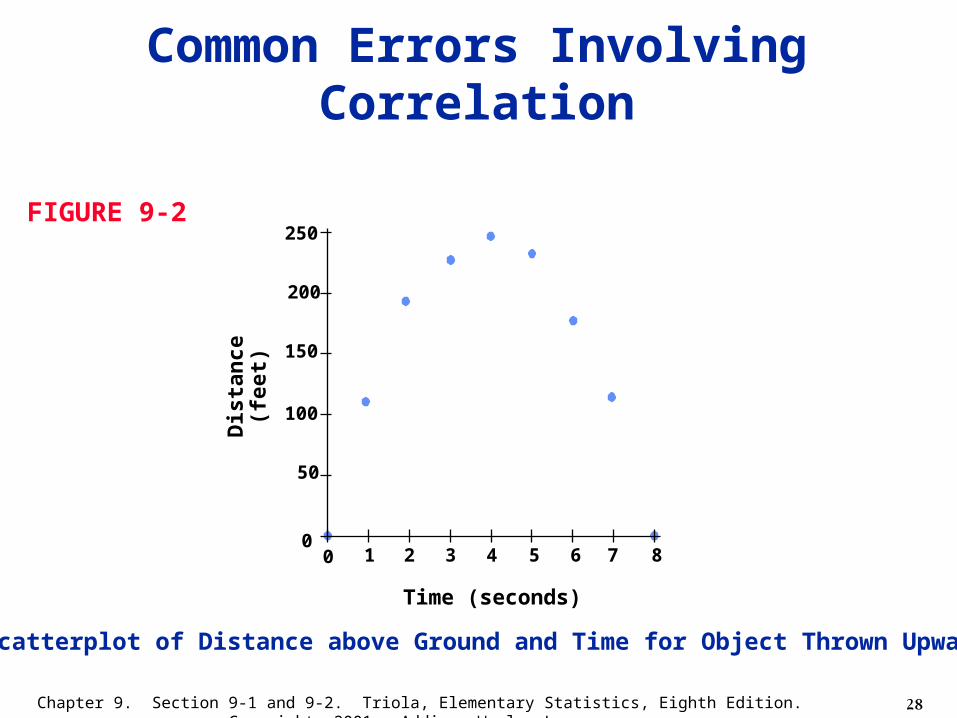
FIGURE 9-2
Common Errors Involving Correlation
Scatterplot of Distance above Ground and Time for Object Thrown Upward
29Chapter 9. Section 9-1 and 9-2. Triola, Elementary Statistics, Eighth Edition. Copyright 2001. Addison Wesley Longman
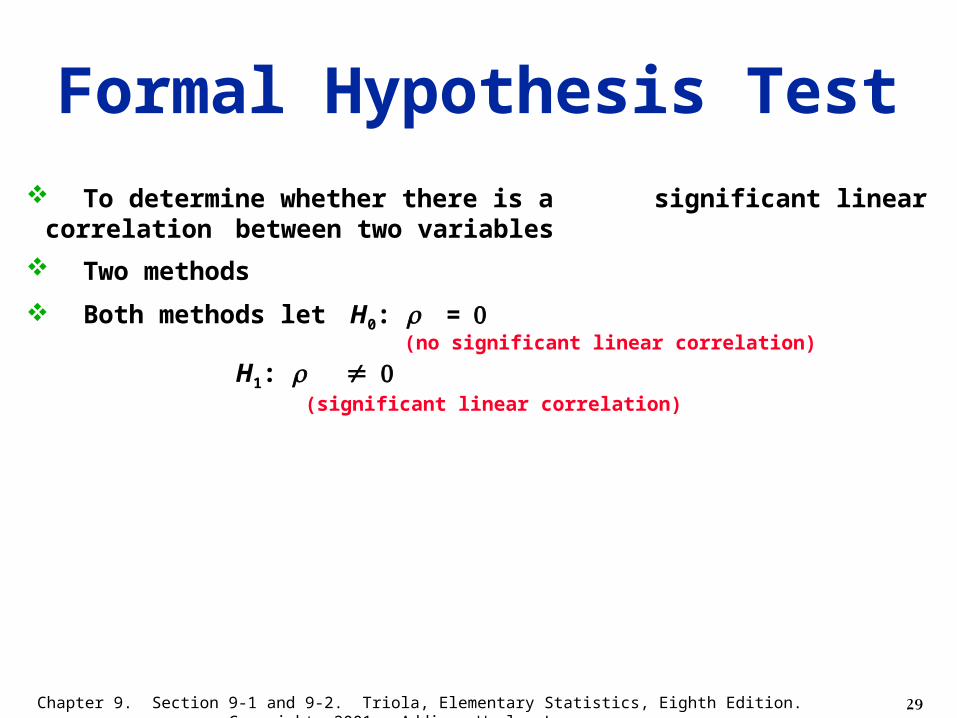
Formal Hypothesis Test
To determine whether there is a significant linear correlation between two variables
Two methods
Both methods let H0: = (no significant linear correlation)
H1: (significant linear correlation)
30Chapter 9. Section 9-1 and 9-2. Triola, Elementary Statistics, Eighth Edition. Copyright 2001. Addison Wesley Longman
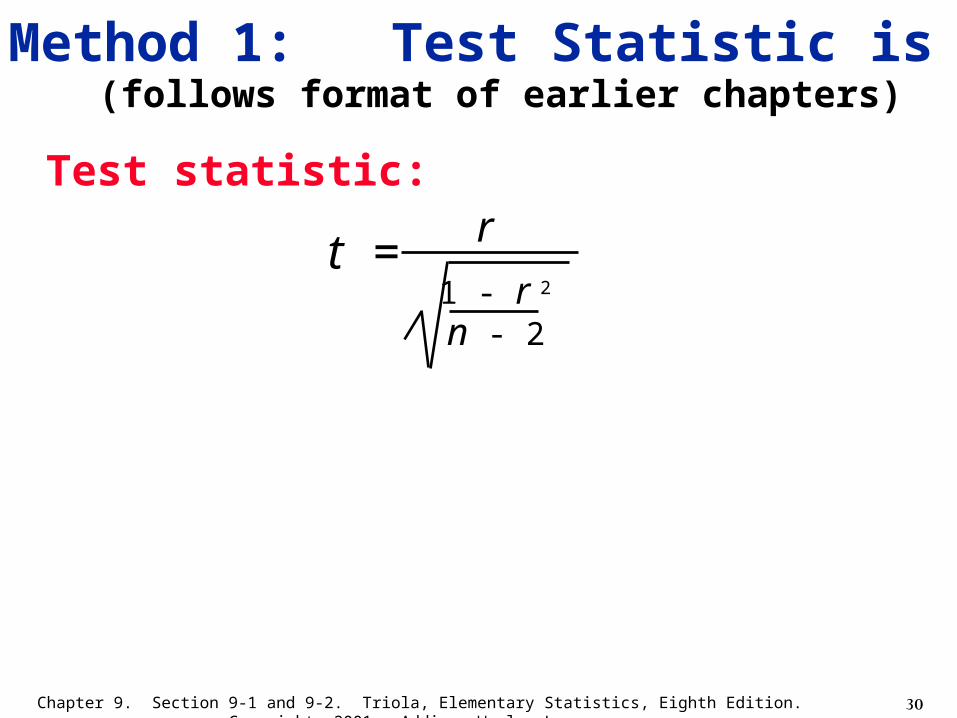
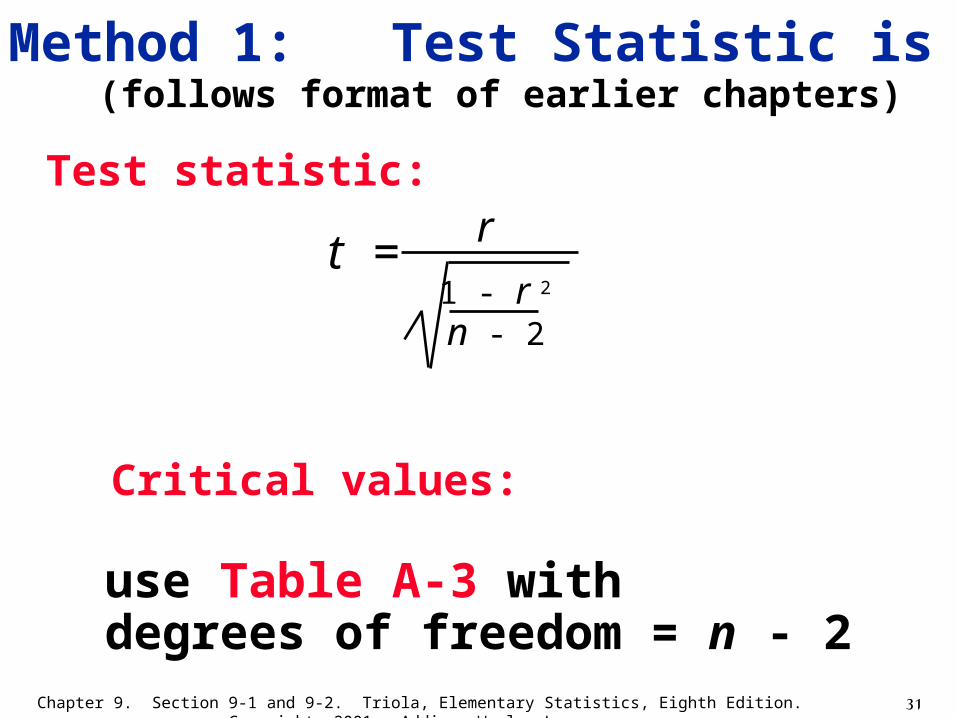
Method 1: Test Statistic is t(follows format of earlier chapters)
Test statistic:
1 - r 2
n - 2
r
t =
31Chapter 9. Section 9-1 and 9-2. Triola, Elementary Statistics, Eighth Edition. Copyright 2001. Addison Wesley Longman
Method 1: Test Statistic is t(follows format of earlier chapters)
Test statistic:
1 - r 2
n - 2
r
Critical values:
use Table A-3 with degrees of freedom = n - 2
t =
32Chapter 9. Section 9-1 and 9-2. Triola, Elementary Statistics, Eighth Edition. Copyright 2001. Addison Wesley Longman
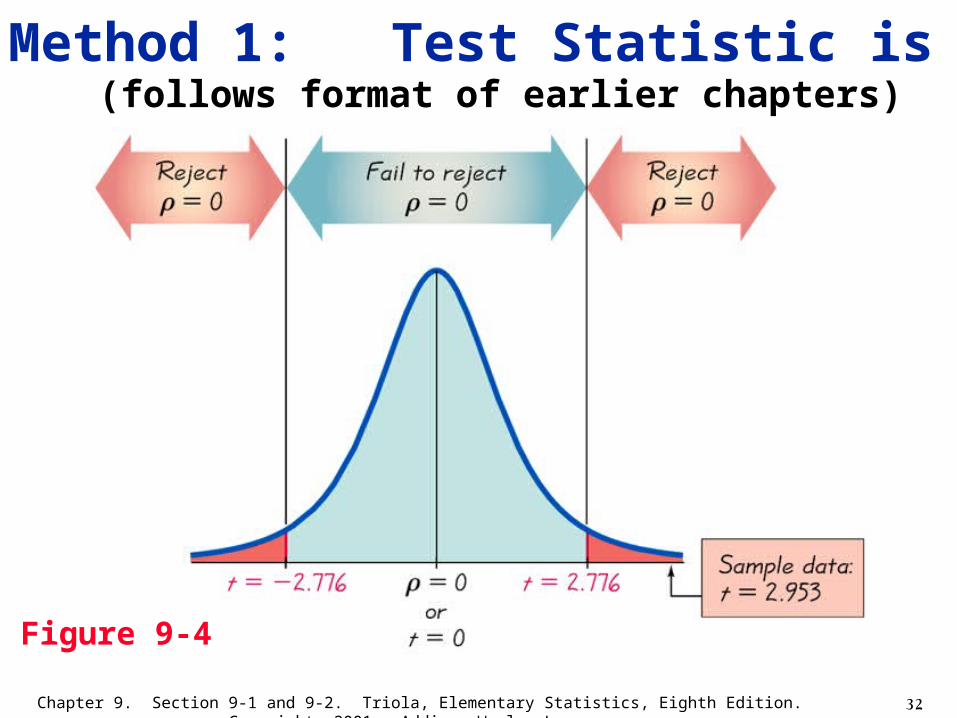
Figure 9-4
Method 1: Test Statistic is t(follows format of earlier chapters)
33Chapter 9. Section 9-1 and 9-2. Triola, Elementary Statistics, Eighth Edition. Copyright 2001. Addison Wesley Longman
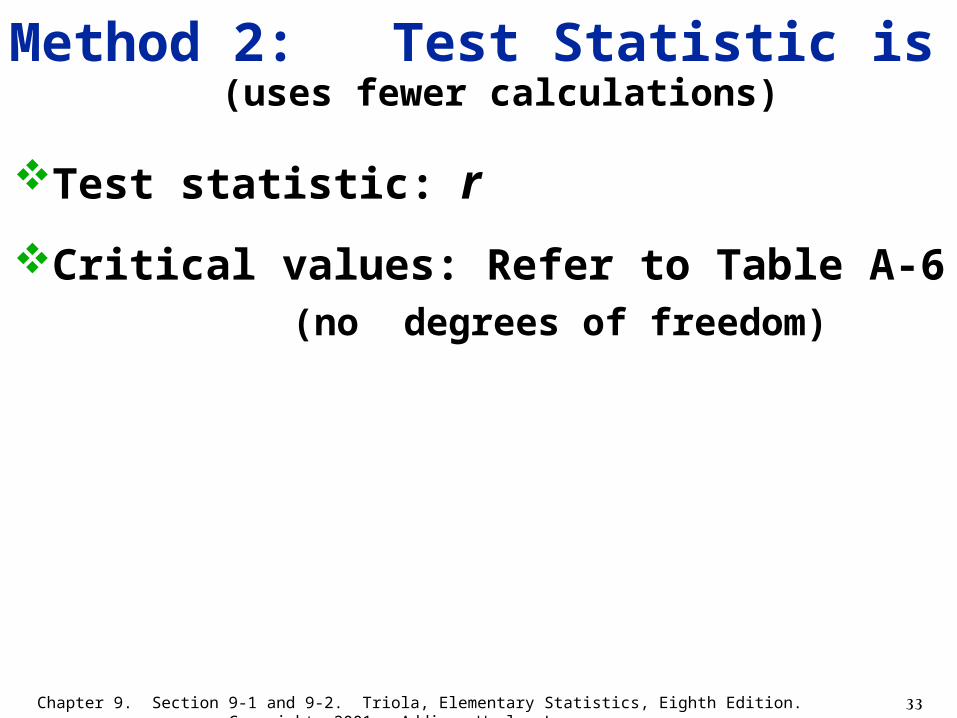
Test statistic: r
Critical values: Refer to Table A-6 (no degrees of freedom)
Method 2: Test Statistic is r(uses fewer calculations)
34Chapter 9. Section 9-1 and 9-2. Triola, Elementary Statistics, Eighth Edition. Copyright 2001. Addison Wesley Longman
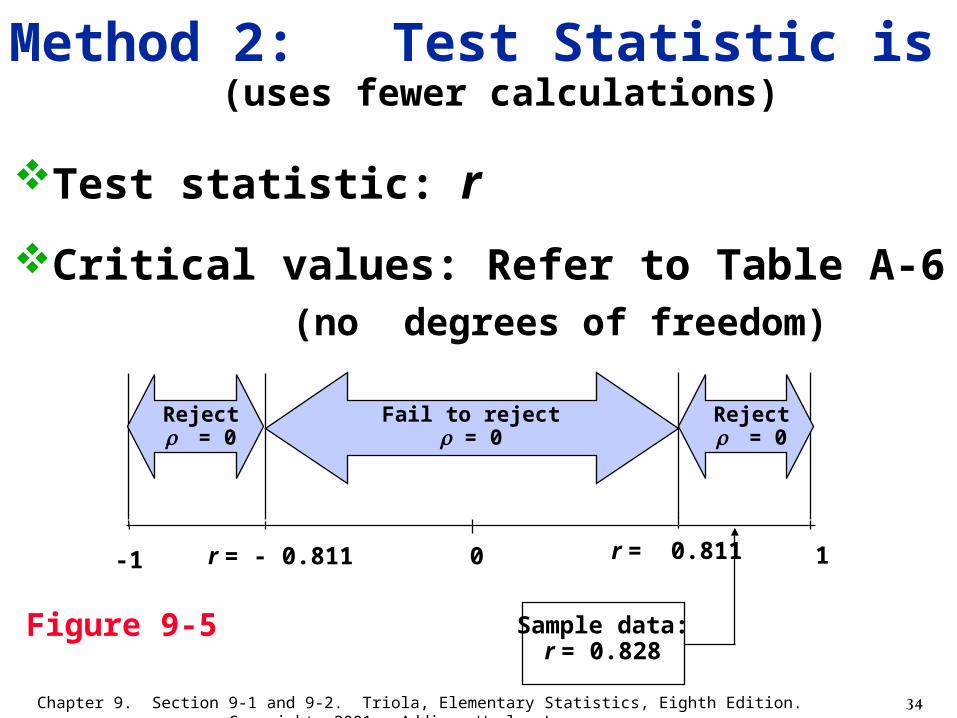
Test statistic: r
Critical values: Refer to Table A-6 (no degrees of freedom)
Method 2: Test Statistic is r(uses fewer calculations)
Fail to reject = 0
0r = - 0.811 r = 0.811 1
Sample data:r = 0.828
-1
Figure 9-5
Reject= 0
Reject= 0
35Chapter 9. Section 9-1 and 9-2. Triola, Elementary Statistics, Eighth Edition. Copyright 2001. Addison Wesley Longman
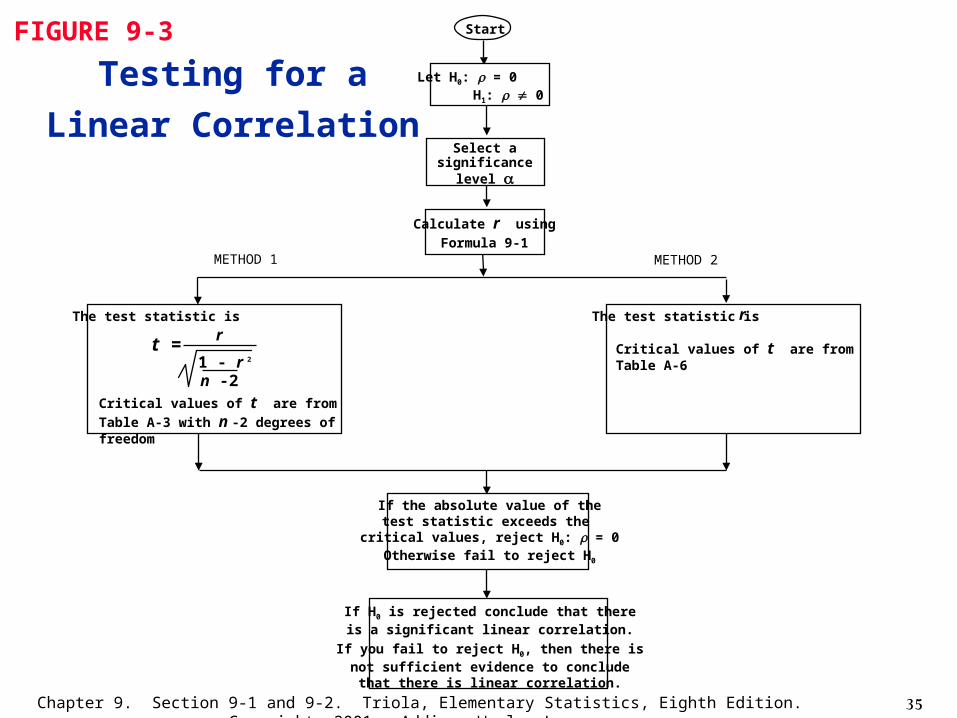
FIGURE 9-3
Testing for a
Linear Correlation
If H0 is rejected conclude that thereis a significant linear correlation.
If you fail to reject H0, then there isnot sufficient evidence to conclude
that there is linear correlation.
If the absolute value of thetest statistic exceeds the
critical values, reject H0: = 0Otherwise fail to reject H0
The test statistic is
t =1 - r 2
n -2
r
Critical values of t are from Table A-3
with n -2 degrees of freedom
The test statistic is
Critical values of t are from Table A-6
r
Calculate r using
Formula 9-1
Select asignificance
level
Let H0: = 0 H1: 0
Start
METHOD 1 METHOD 2
36Chapter 9. Section 9-1 and 9-2. Triola, Elementary Statistics, Eighth Edition. Copyright 2001. Addison Wesley Longman
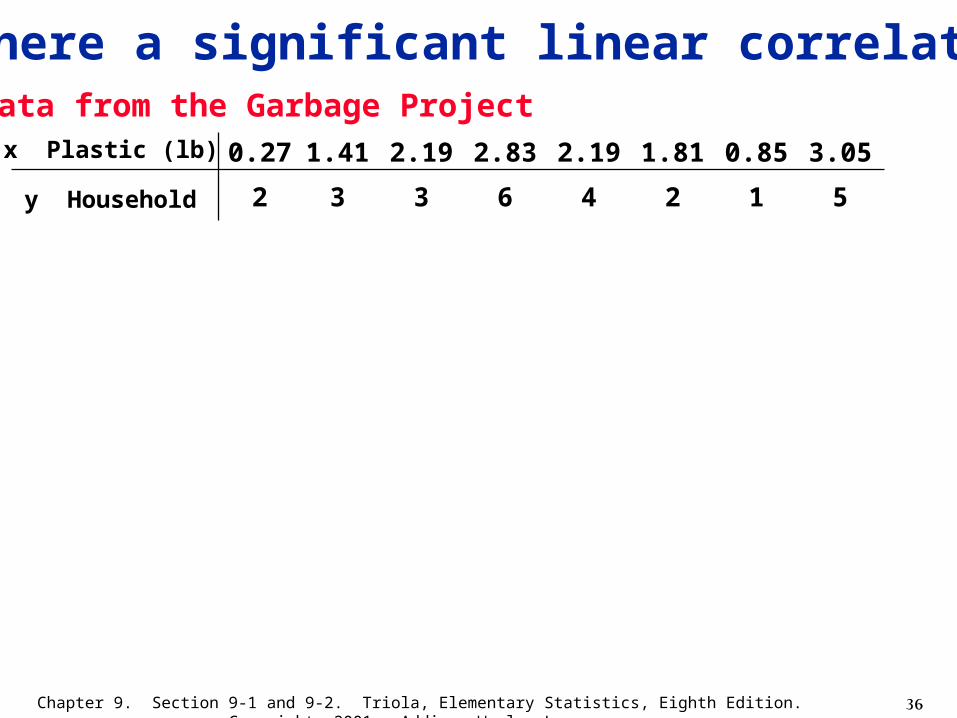
0.27
2
1.41
3
2.19
3
2.83
6
2.19
4
1.81
2
0.85
1
3.05
5
Data from the Garbage Projectx Plastic (lb)
y Household
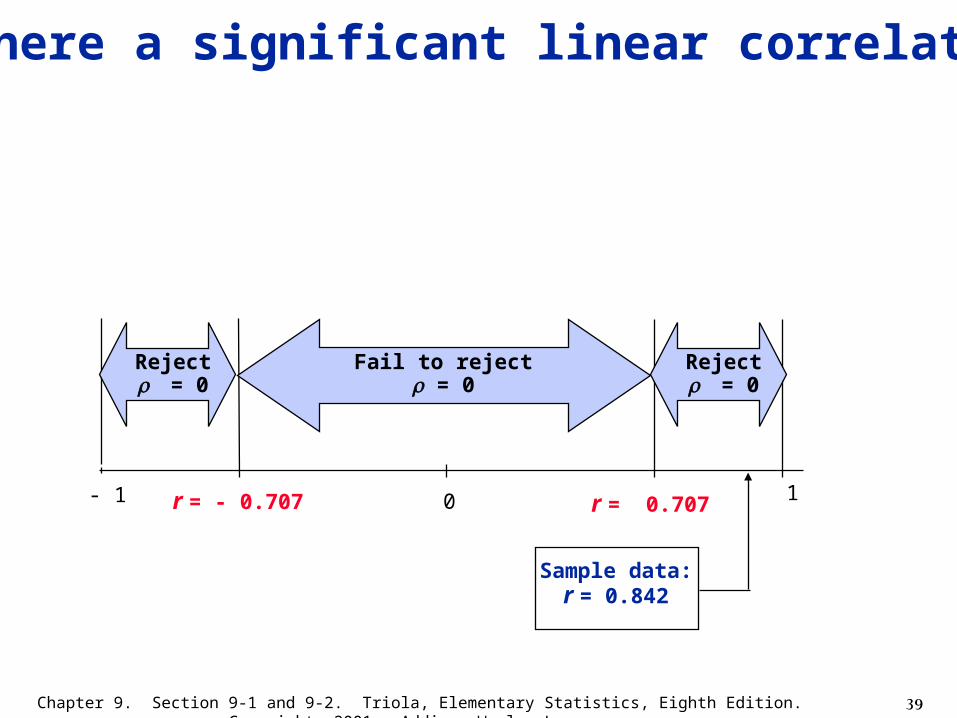
Is there a significant linear correlation?
37Chapter 9. Section 9-1 and 9-2. Triola, Elementary Statistics, Eighth Edition. Copyright 2001. Addison Wesley Longman
0.27
2
1.41
3
2.19
3
2.83
6
2.19
4
1.81
2
0.85
1
3.05
5
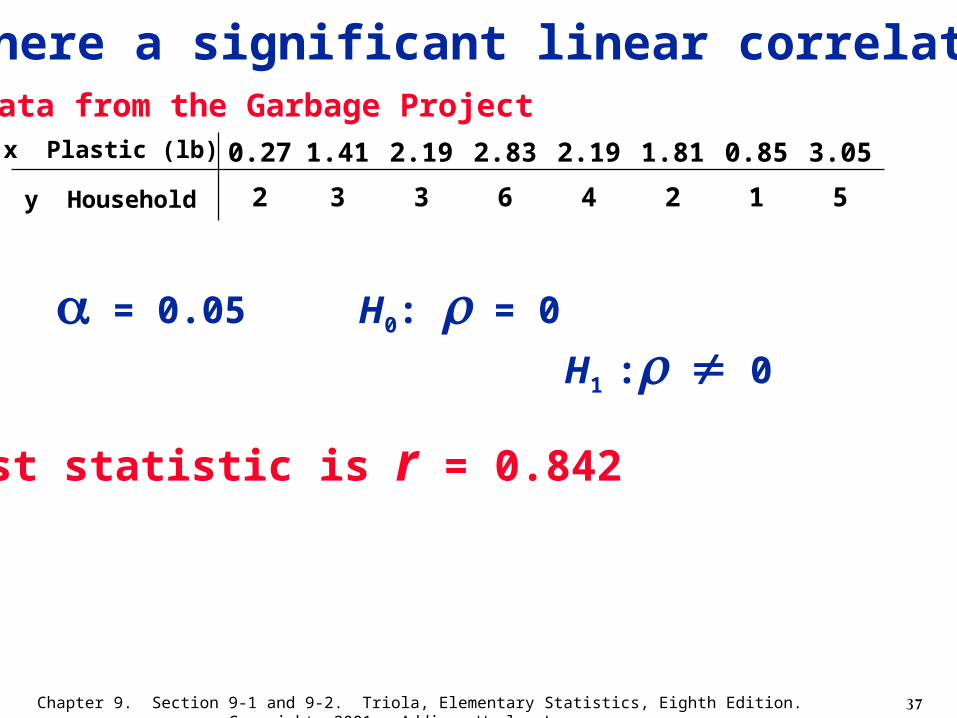
Data from the Garbage Projectx Plastic (lb)
y Household
n = 8 = 0.05 H0: = 0
H1 : 0
Test statistic is r = 0.842
Is there a significant linear correlation?
38Chapter 9. Section 9-1 and 9-2. Triola, Elementary Statistics, Eighth Edition. Copyright 2001. Addison Wesley Longman
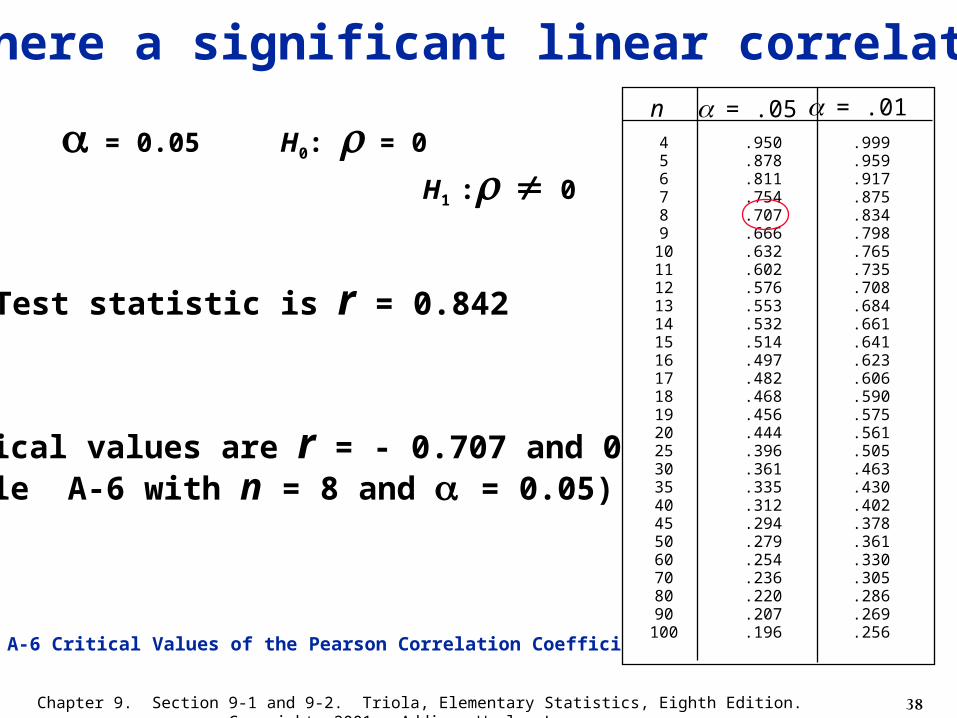
n = 8 = 0.05 H0: = 0
H1 : 0
Test statistic is r = 0.842
Critical values are r = - 0.707 and 0.707(Table A-6 with n = 8 and = 0.05)
TABLE A-6 Critical Values of the Pearson Correlation Coefficient r
456789
101112131415161718192025303540455060708090
100
n.999.959.917.875.834.798.765.735.708.684.661.641.623.606.590.575.561.505.463.430.402.378.361.330.305.286.269.256
.950
.878
.811
.754
.707
.666
.632
.602
.576
.553
.532
.514
.497
.482
.468
.456
.444
.396
.361
.335
.312
.294
.279
.254
.236
.220
.207
.196
= .05 = .01
Is there a significant linear correlation?
39Chapter 9. Section 9-1 and 9-2. Triola, Elementary Statistics, Eighth Edition. Copyright 2001. Addison Wesley Longman
0r = - 0.707 r = 0.707 1
Sample data:r = 0.842
- 1
Is there a significant linear correlation?
Fail to reject = 0
Reject= 0
Reject= 0
40Chapter 9. Section 9-1 and 9-2. Triola, Elementary Statistics, Eighth Edition. Copyright 2001. Addison Wesley Longman
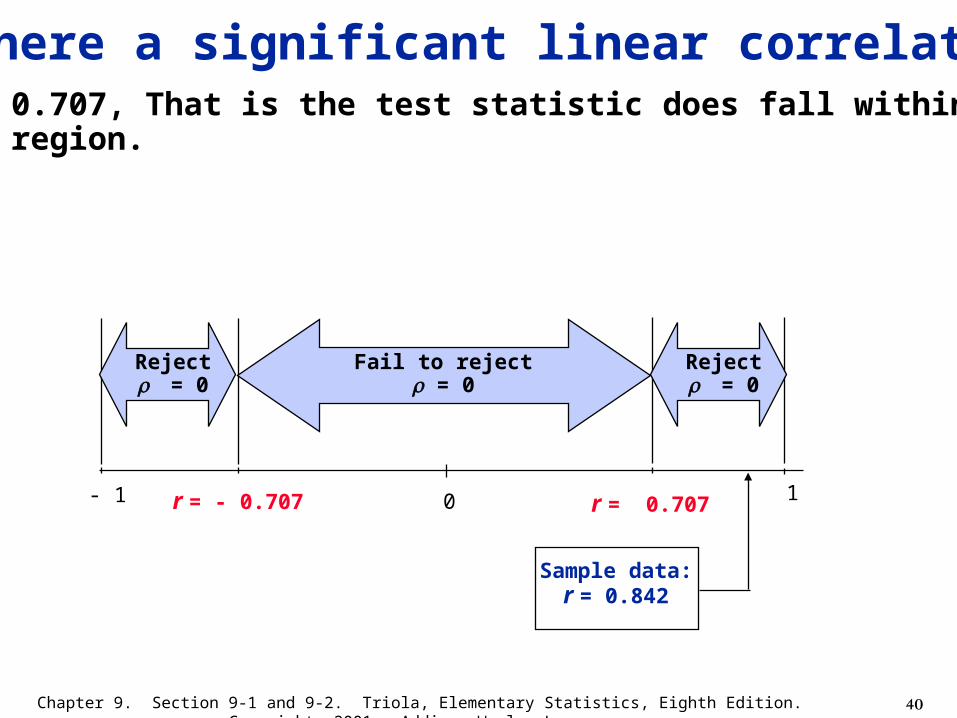
0r = - 0.707 r = 0.707 1
Sample data:r = 0.842
- 1
0.842 > 0.707, That is the test statistic does fall within the critical region.
Is there a significant linear correlation?
Fail to reject = 0
Reject= 0
Reject= 0
41Chapter 9. Section 9-1 and 9-2. Triola, Elementary Statistics, Eighth Edition. Copyright 2001. Addison Wesley Longman
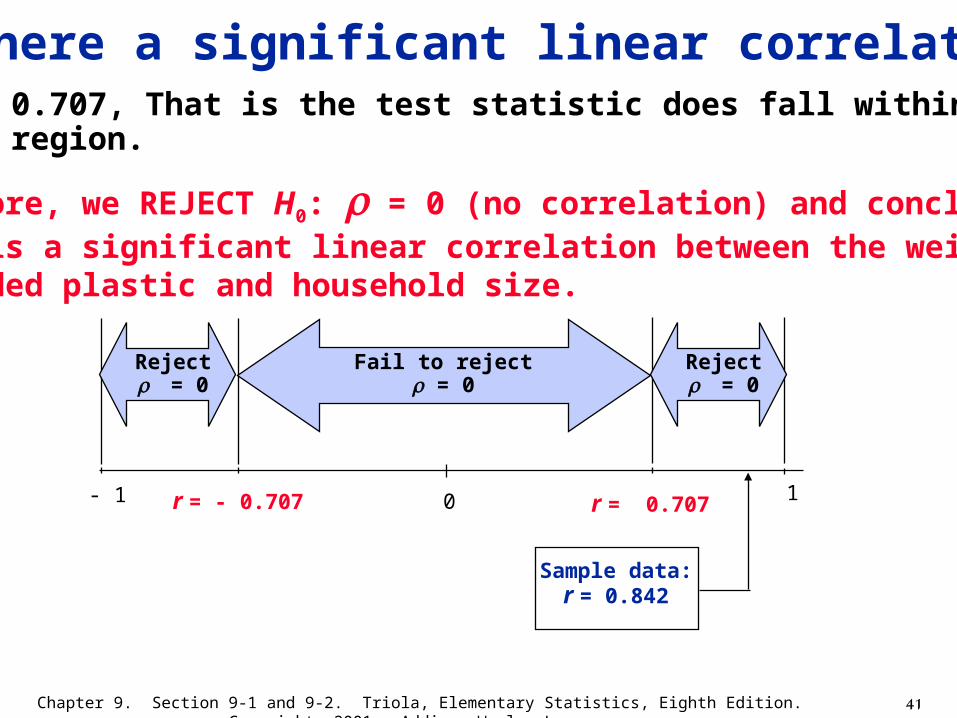
0r = - 0.707 r = 0.707 1
Sample data:r = 0.842
- 1
0.842 > 0.707, That is the test statistic does fall within the critical region.
Therefore, we REJECT H0: = 0 (no correlation) and concludethere is a significant linear correlation between the weights ofdiscarded plastic and household size.
Is there a significant linear correlation?
Fail to reject = 0
Reject= 0
Reject= 0
42Chapter 9. Section 9-1 and 9-2. Triola, Elementary Statistics, Eighth Edition. Copyright 2001. Addison Wesley Longman
Justification for r Formula
43Chapter 9. Section 9-1 and 9-2. Triola, Elementary Statistics, Eighth Edition. Copyright 2001. Addison Wesley Longman
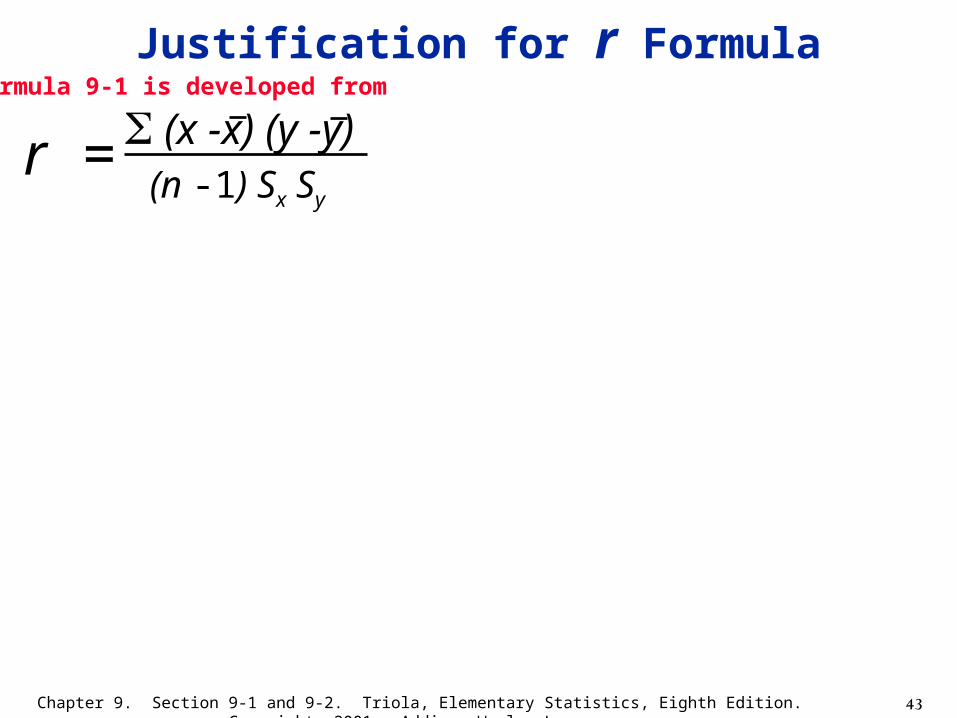
r = (x -x) (y -y)(n -1) Sx Sy
Justification for r FormulaFormula 9-1 is developed from
44Chapter 9. Section 9-1 and 9-2. Triola, Elementary Statistics, Eighth Edition. Copyright 2001. Addison Wesley Longman
Justification for r Formula
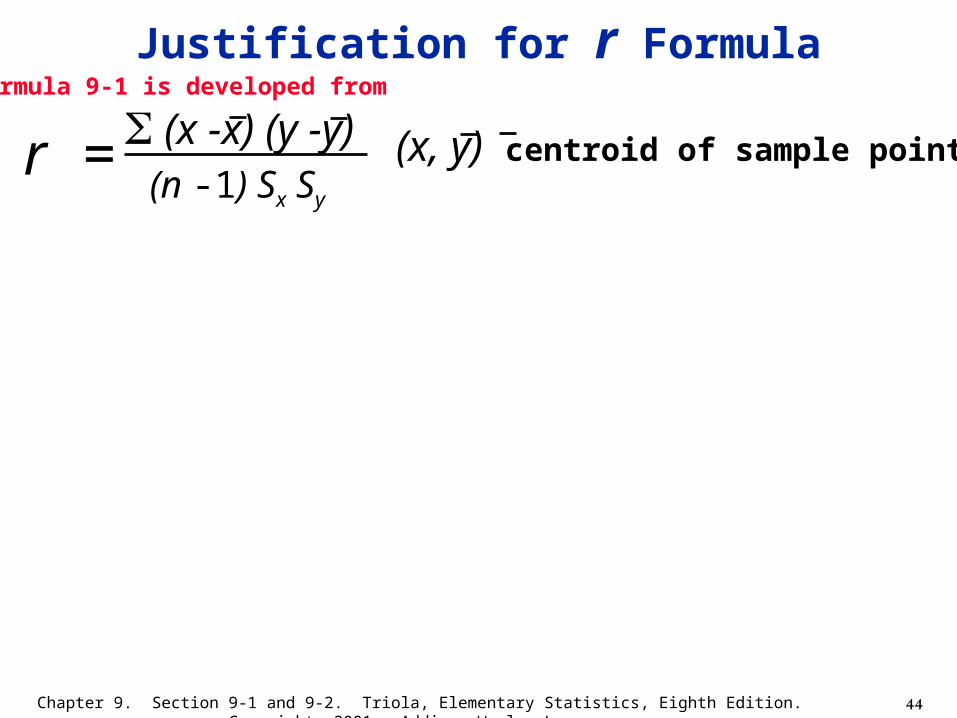
r = (x -x) (y -y)(n -1) Sx Sy
(x, y) centroid of sample points
Formula 9-1 is developed from
45Chapter 9. Section 9-1 and 9-2. Triola, Elementary Statistics, Eighth Edition. Copyright 2001. Addison Wesley Longman
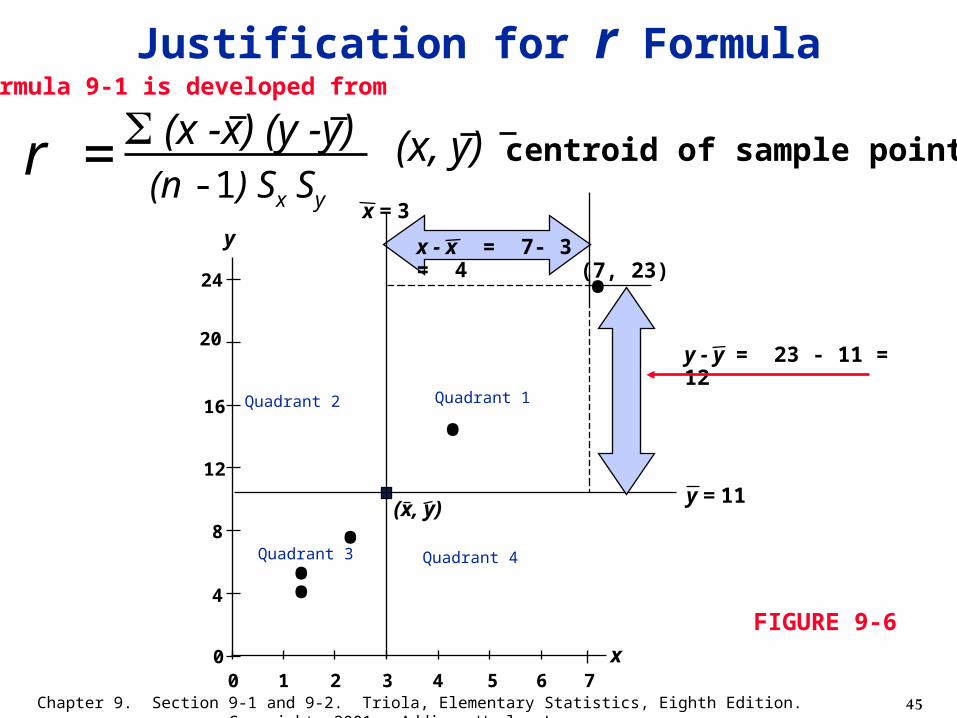
x = 3
•••Quadrant 3
Quadrant 2 Quadrant 1
Quadrant 4
•
x
y
y = 11(x, y)
x - x = 7- 3 = 4
y - y = 23 - 11 = 12
0 1 2 3 4 5 6 70
4
8
12
16
20
24
r = (x -x) (y -y)(n -1) Sx Sy
(x, y) centroid of sample points
•(7, 23)
FIGURE 9-6
Formula 9-1 is developed from
Justification for r Formula