Embed Size (px)
Citation preview
1
Chapter 8: Nonresponse Reading
8.1-8.3 8.4 (read for concepts) 8.5 (intro, 8.5.2 are focus) 8.6 8.8 (no 8.7)
2
Outline What is nonresponse (NR)? Why should we do something about NR? Strategies to reduce NR
Design phase After data collection
Callbacks to gain info on nonrespondents (double sampling)
Weighting adjustments – post-stratification only Imputation of missing values (item NR), a little
from mechanisms for NR Response rate calculations
3
What is nonresponse? Failure to obtain data through some part
of the data collection process Nonresponse occurs during data
collection process, after sample is selected Separate from ineligible cases Can not locate (may not know if eligible) Locate but refuse to participate (may or may
not know eligibility) Participate but don’t answer all questions
(eligibility known) …
4
Types of nonresponse Unit nonresponse
Missing data for entire observation unit
All variables have missing data Item nonresponse
Missing data for one or more variables for the observation unit
Failure to obtain a response to an individual item = question
5
Example: random digit dialing (RDD) phone calls Some case (= phone number)
dispositions Non-working Rings, but get no answer Get answer, determine it’s not a household Get a household, refuse survey participation Get a household, answer all but a few
questions Get a household and answer all questions
Eligible, unit NR, item NR?
6
Example: soil survey Can not reach sample unit (in
canyon) Can reach, but can’t collect data
(denied permission by land owner) Collect data, data sheet destroyed Forget to collect data for an item
7
Ignoring nonresponse (is bad) Impacts are related to differences between
nonresponding and responding subpopulations in relation to analysis variables If population mean is different for responding
and nonresponding subpopulations, will get a biased estimate when analyzing data from only the responding subpopulation
Bias depends on Nonresponse rate Difference between population means for responding
and nonresponding subpopulations p. 258 subpopulation table and equations
8
Ignoring nonresponse – 2 Hard to determine if distributions
(parameters) for responding and nonresponding subpopulations are different Often no information on nonrespondents
Examine causes of NR Is mechanism generating NR related to
analysis variables? Figure 8.2 – framework for factors
Data collectors (interviewers, field observers) Survey content (questionnaire, field protocols) Respondent or field site characteristics
9
Ignoring nonresponse – 3 Sample size reductions affect
precision Low response rate low sample size
higher variances Increasing sample size will NOT
mitigate bias problems Literary Digest Survey
Less of a concern because often you can anticipate and design for NR sample size attrition
10
Example: Norwegian voting behavior survey (Table 8.1) Survey with good follow-up methodology Examined differences between
nonrespondents and full sample Age-specific voting rates lower for NR portion,
especially for younger voters Low nonresponse, but high bias potential
90% response rate, but differences are large with respect to main analysis variables
Mechanisms causing NR Absence or illness less likely to respond, lower
voting rates Impact: overestimate prevalence of positive
voting behaviors
11
Strategies Best: design survey to prevent NR Post-data collection
Perform nonresponse study (call-backs)
Use weights to adjust for NR units Use a model to impute (fill in) values
for missing items
12
Strategy 1: Design to prevent Consider likely mechanisms for NR when
designing survey Reduce respondent burden to extent possible
Two main areas Data collection methodology
Burden for individual, population Sample design
Burden for population
Remedies for avoiding NR also tend to improve data quality
13
Factors to consider Survey content
Salience of topic to respondent Sensitive topics (socially undesirable behaviors,
medical issues) Timing
Farm surveys avoid peak work times Holidays associated with higher NR
Interviewers Training to improve technique Refusal conversion staff Observer variation for bird counts
14
Factors to consider – 2 Data collection method
Mail/fax/web has highest NR, then phone, then in-person
Interviewer assists in locating process, gaining cooperation to participate, avoiding item NR
Computer-assisted data collection instruments prevent item NR due to data collector error
Guides data collection, checks for completeness
15
Factors to consider – 3 Questionnaire design
Key: reduce respondent burden (effort to respond, frustration in responding)
Cognitive psych principles used to simplify, clarify, test questions and questionnaire flow
Examples of factors follow …
Wording of individual questions Can respondent answer the question? Does s/he understand the question? Single concept, simple wording, transition
16
Factors to consider – 4 Questionnaire flow/design
Content: is flow logical, assist in cognitive process?
Mail, web, fax: visual interface is very important to helping respondent accurately complete questionnaire
Length of questionnaire Shorten to extent possible Allowable length depends on how vested
the respondent is likely to be
17
Factors to consider – 5 Survey introduction
First contact between respondent and data collector
Want to motivate respondent to participate
Positive: contributions to knowledge base Negative: confidentiality concersn
Methods (use both if possible) Advance letter to respondent or land owner
(need address) Phone or written introduction to questionnaire
18
Factors to consider – 6 Incentives
Money, gifts, coupons, lottery; penalties Hard to determine what is appropriate
Generally has a positive effect Worry: incentive creep, increases cost of survey Respondents get used to it increases difficulty and
cost in gaining response Follow-up to obtain response
Mail: repeated notifications after initial mailing Postcard reminder, 2nd questionnaire mailing
Phone: protocols for repeated attempts to get an answer, refusal conversion
19
Factors to consider – 7 Sample design
Use design and estimation principles that increase precision for a given sample size
Stratification, ratio/regression estimation Less burden on population by using
smaller sample size to achieve a given precision level
20
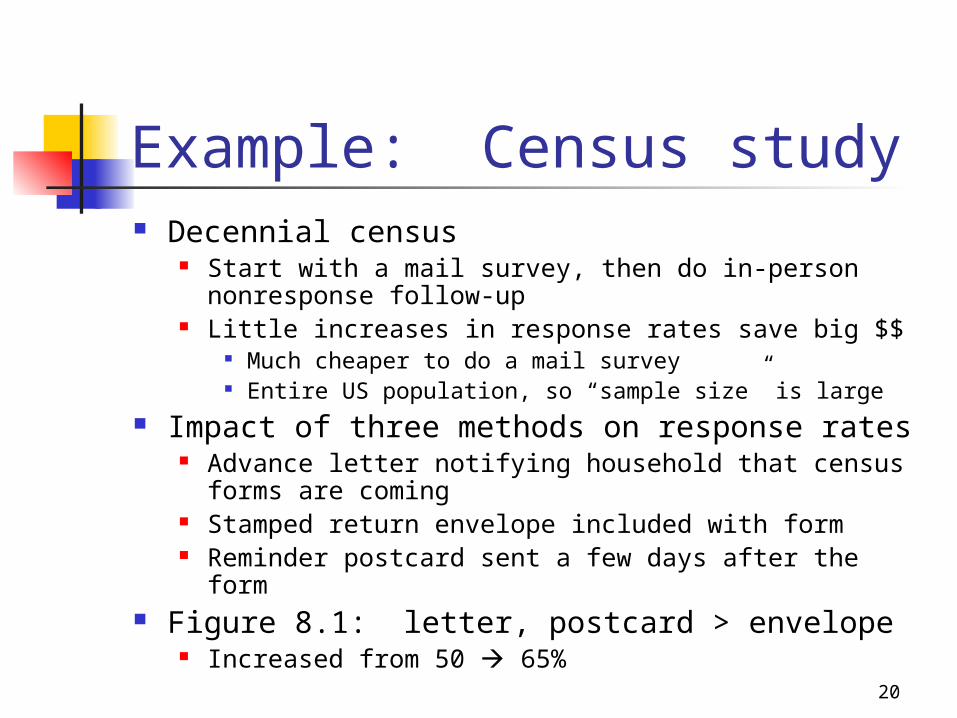
Example: Census study Decennial census
Start with a mail survey, then do in-person nonresponse follow-up
Little increases in response rates save big $$ Much cheaper to do a mail survey Entire US population, so “sample size” is large
Impact of three methods on response rates Advance letter notifying household that census forms
are coming Stamped return envelope included with form Reminder postcard sent a few days after the form
Figure 8.1: letter, postcard > envelope Increased from 50 65%
21
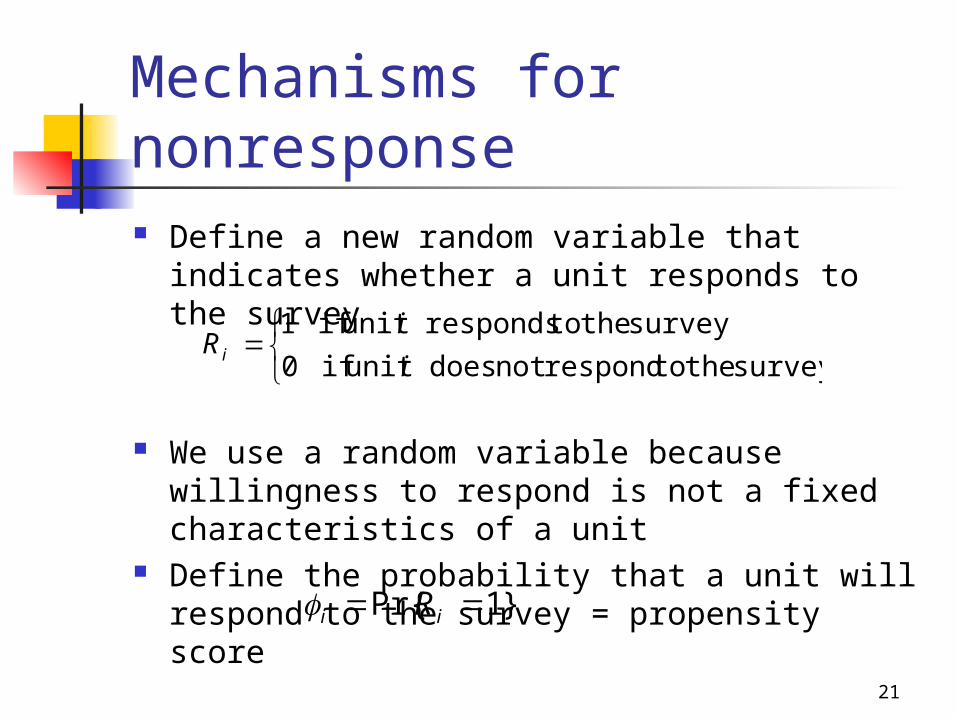
Mechanisms for nonresponse Define a new random variable that indicates
whether a unit responds to the survey
We use a random variable because willingness to respond is not a fixed characteristics of a unit
Define the probability that a unit will respond to the survey = propensity score
survey the to respondnot does unit if 0
survey the to responds unit if 1
i
iRi
}1Pr{ ii R
22
Types of nonresponse MCAR: missing completely at
random MAR: missing at random given
covariates Also called ignorable nonresponse
Nonignorable nonresponse
23
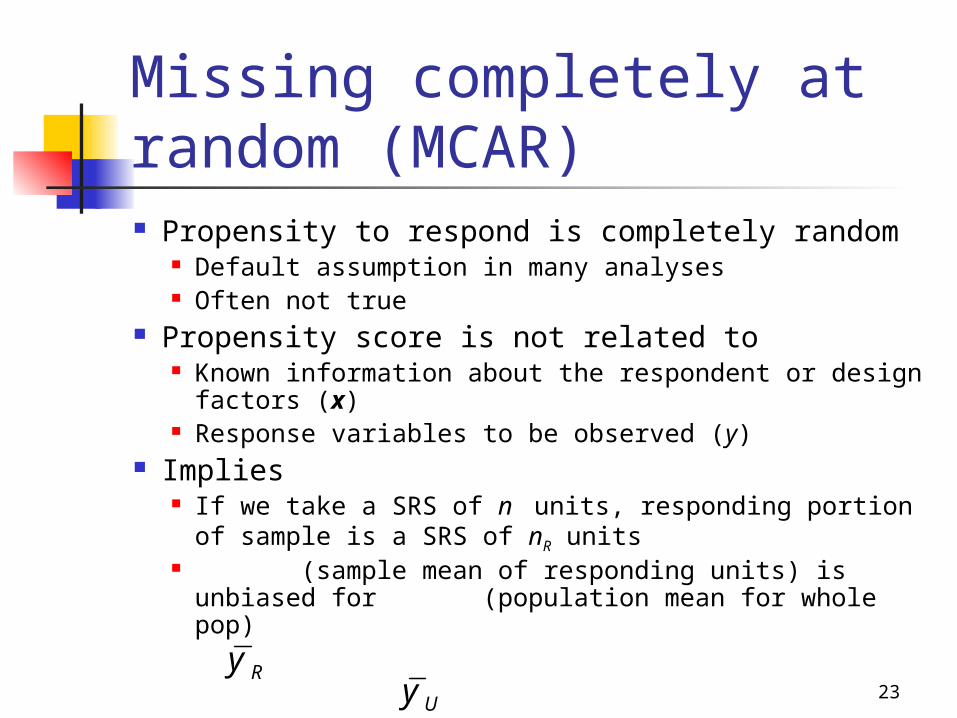
Missing completely at random (MCAR) Propensity to respond is completely random
Default assumption in many analyses Often not true
Propensity score is not related to Known information about the respondent or
design factors (x) Response variables to be observed (y)
Implies If we take a SRS of n units, responding portion of
sample is a SRS of nR units (sample mean of responding units) is
unbiased for (population mean for whole pop)
UyRy
24
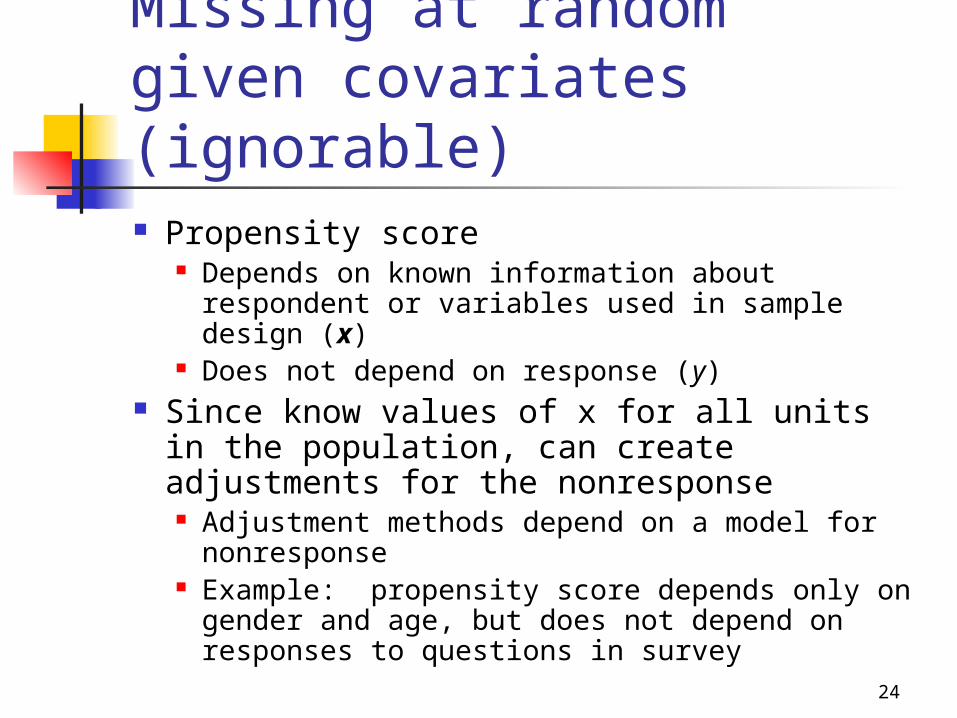
Missing at random given covariates (ignorable) Propensity score
Depends on known information about respondent or variables used in sample design (x)
Does not depend on response (y) Since know values of x for all units in the
population, can create adjustments for the nonresponse Adjustment methods depend on a model for
nonresponse Example: propensity score depends only on
gender and age, but does not depend on responses to questions in survey
25
Nonignorable nonresponse Propensity score depends on response
(y) and can not be completely explained by other factors (x) Example: crime victims less likely to
respond to victimization questions (y) on a survey
Models will not fully adjust for potential nonresponse bias
Very difficult to verify if nonresponse mechanism is nonignorable
26
Strategy 2: Call-backs and double sampling Basic idea
Select a subsample of nonrepsondents Collect data from contacted nonrespondents Use these data to estimate population mean for
nonrespondents, This subsample is referred to by Lohr as the “call-
back” sample It is a telephone follow-up to a mail survey Method is more general than that
The sampling design is an example of “double” or “2-phase” sampling (we won’t cover this in general)
We will make the (very unrealistic) assumption that all of the “call-back” sample provides responses to the survey
MUy
27
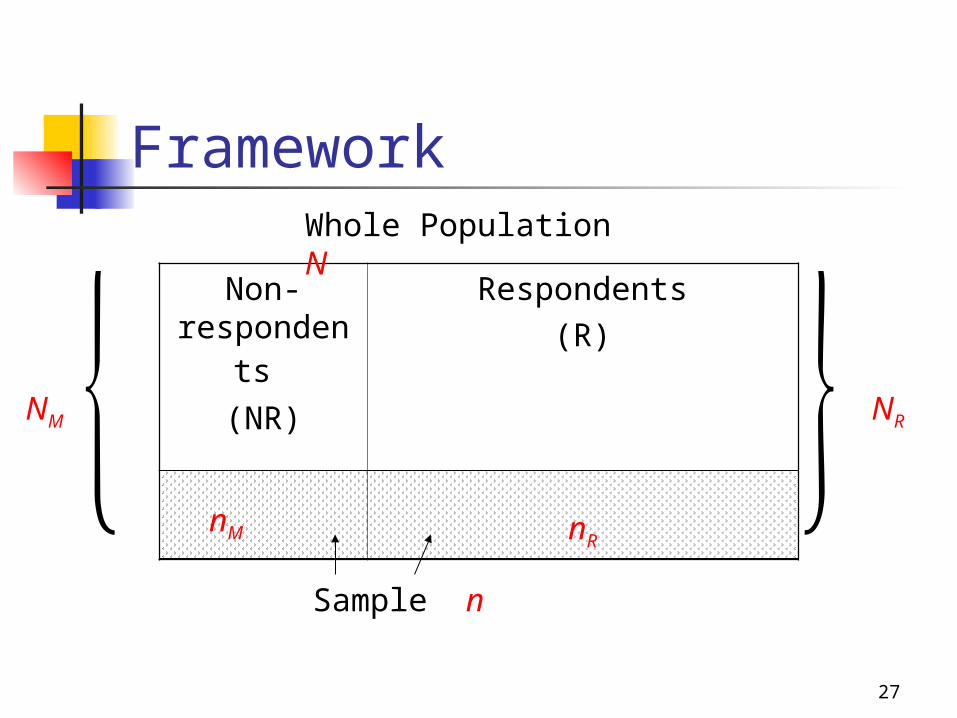
Framework
Non-respondent
s (NR)
Respondents(R)
Whole Population N
NM NR
nM nR
Sample n
28
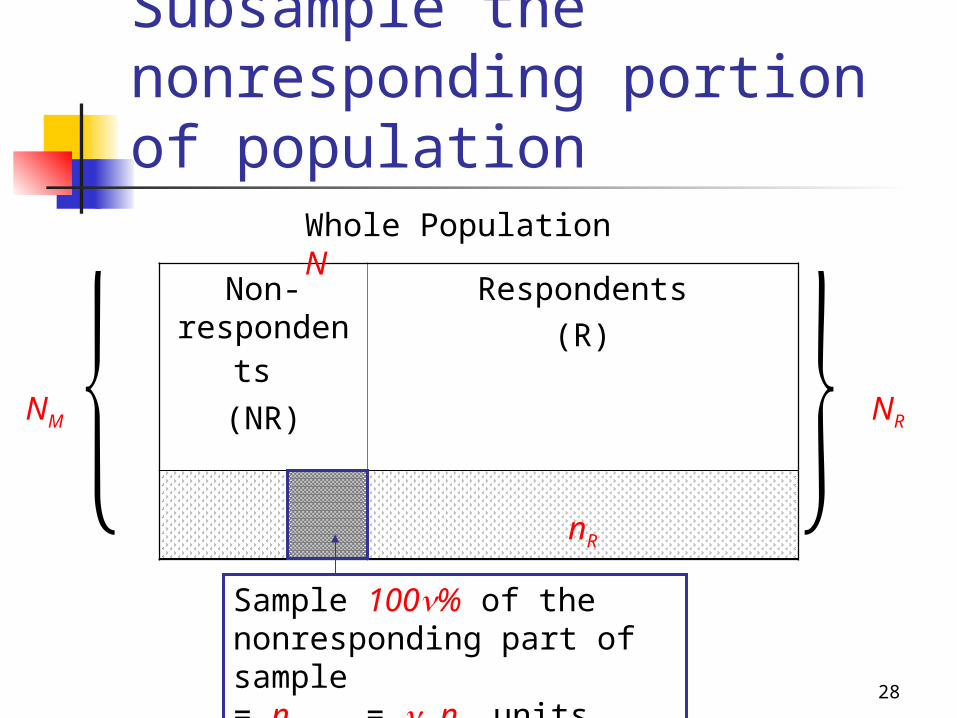
Subsample the nonresponding portion of population
Non-respondent
s (NR)
Respondents(R)
Whole Population N
NM NR
nR
Sample 100% of the nonresponding part of sample= nMCB = nM units
29
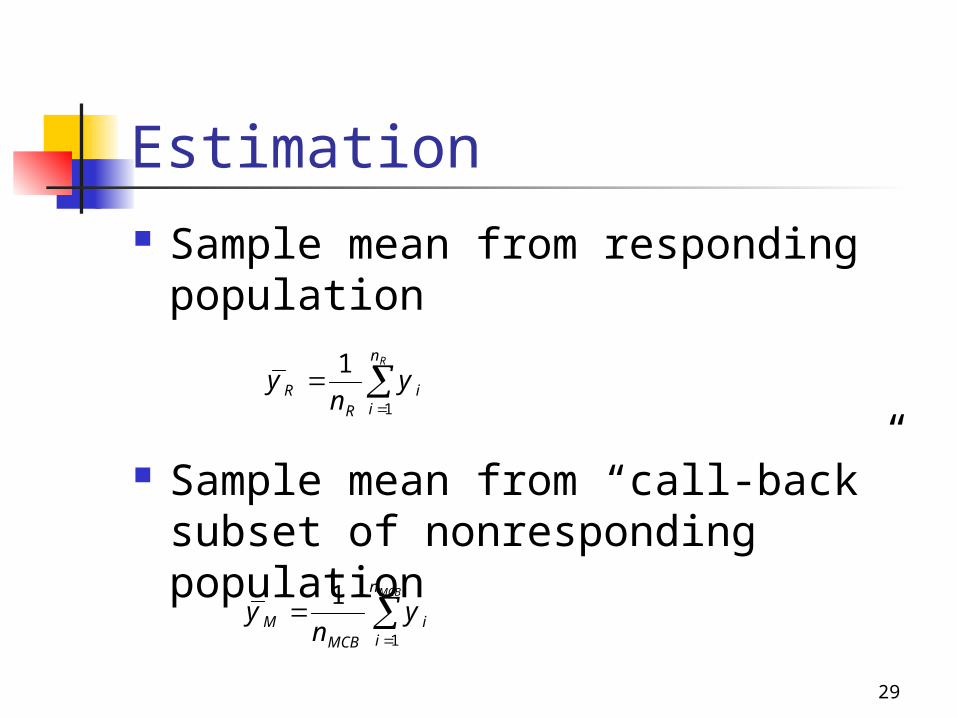
Estimation Sample mean from responding
population
Sample mean from “call-back” subset of nonresponding population
Rn
ii
RR y
ny
1
1
MCBn
ii
MCBM y
ny
1
1
30
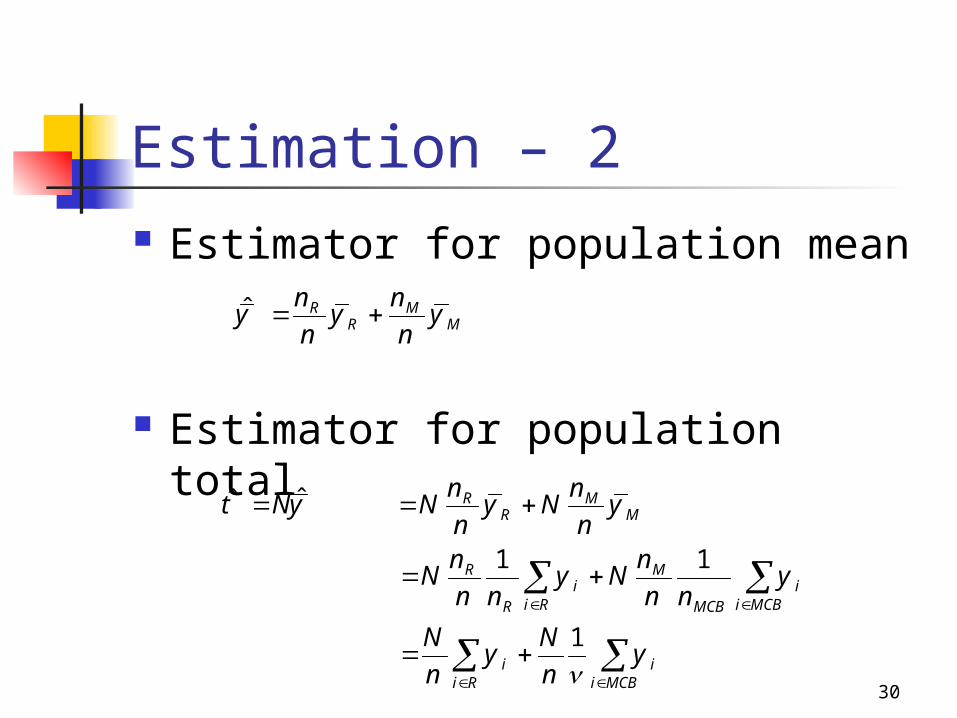
Estimation – 2 Estimator for population mean
Estimator for population total
MM
RR y
nn
ynn
y ˆ
MCBii
Rii
MCBii
MCB
M
Rii
R
R
MM
RR
ynN
ynN
ynn
nNy
nnn
N
ynn
Nynn
NyNt
1
11
ˆˆ
31
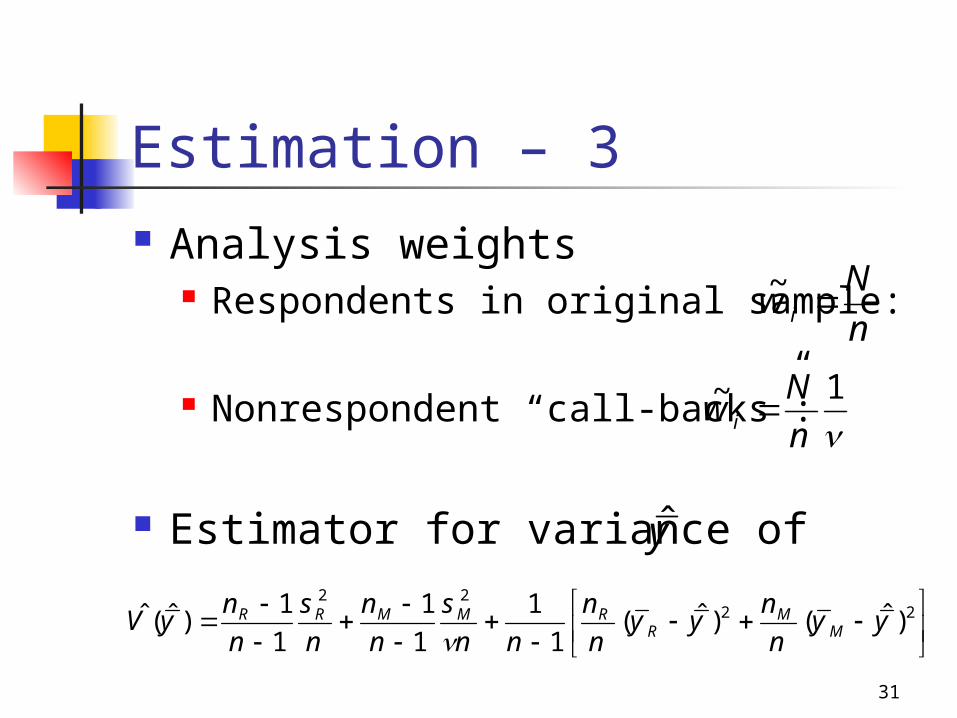
Estimation – 3 Analysis weights
Respondents in original sample:
Nonrespondent “call-backs”:
Estimator for variance of
2222
)ˆ()ˆ(1
111
11
)ˆ(ˆ yynn
yynn
nns
nn
ns
nn
yV MM
RRMMRR
y
nN
w i ~
1~
nN
w i
32
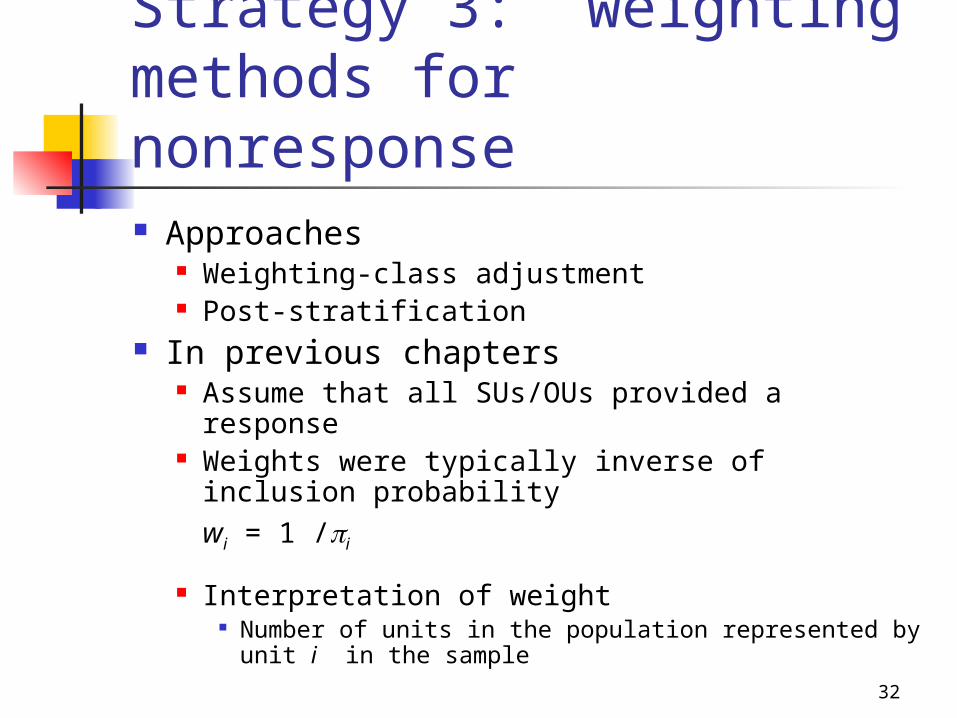
Strategy 3: weighting methods for nonresponse Approaches
Weighting-class adjustment Post-stratification
In previous chapters Assume that all SUs/OUs provided a response Weights were typically inverse of inclusion
probability wi = 1 /i
Interpretation of weight Number of units in the population represented by
unit i in the sample
33
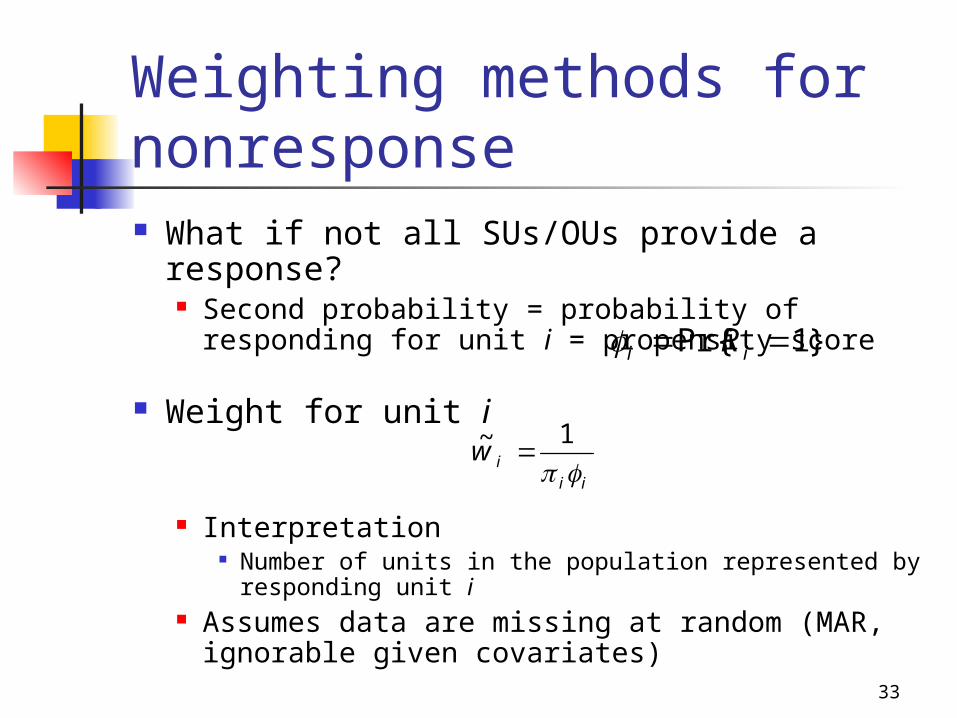
Weighting methods for nonresponse What if not all SUs/OUs provide a response?
Second probability = probability of responding for unit i = propensity score
Weight for unit i
Interpretation Number of units in the population represented by
responding unit i Assumes data are missing at random (MAR,
ignorable given covariates)
iiiw
1~
}1Pr{ ii R
34
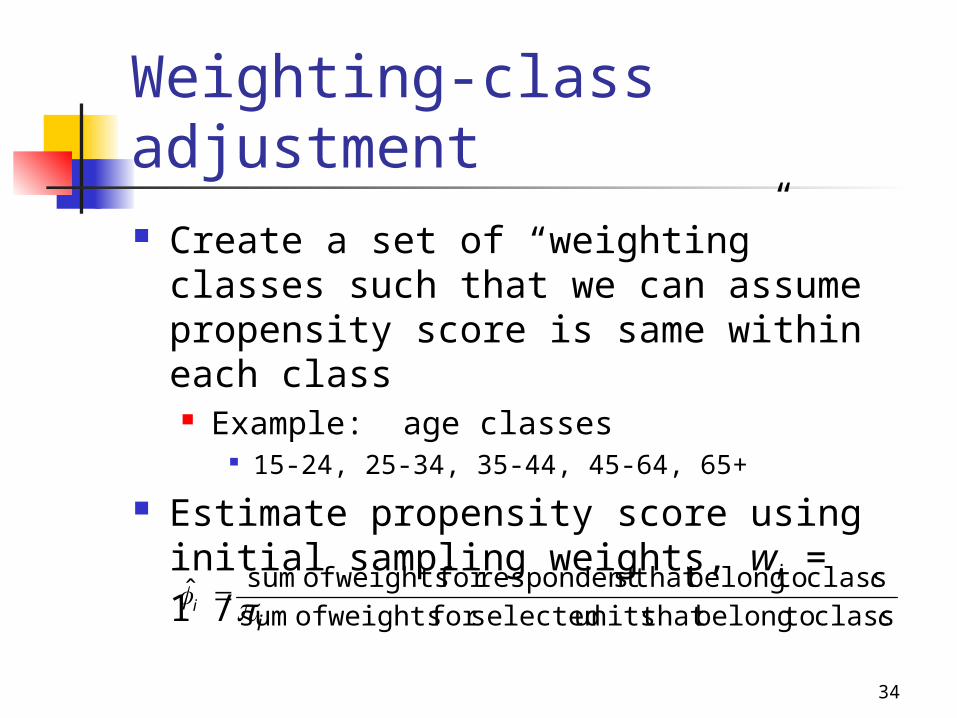
Weighting-class adjustment Create a set of “weighting” classes such
that we can assume propensity score is same within each class Example: age classes
15-24, 25-34, 35-44, 45-64, 65+
Estimate propensity score using initial sampling weights, wi = 1 /i
cc
i class to belongthat units selectedfor weights of sum class to belongthat srespondentfor weights of sumˆ
35
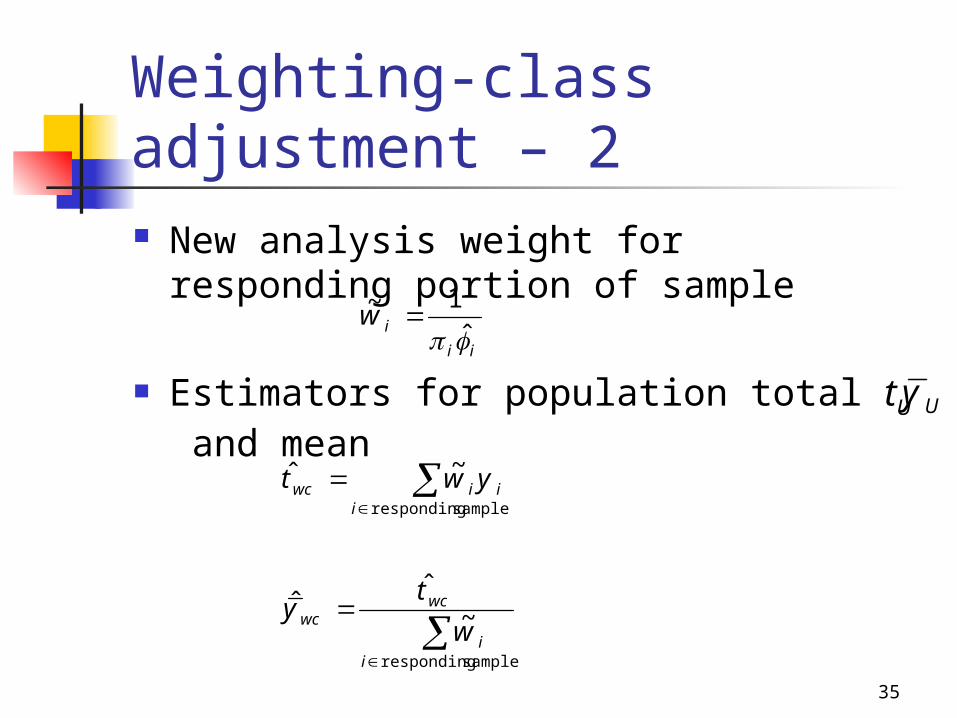
Weighting-class adjustment – 2 New analysis weight for responding
portion of sample
Estimators for population total tU and mean
ii
iw ˆ1~
sample responding
sample responding
~ˆ
ˆ
~ˆ
ii
wcwc
iiiwc
w
ty
ywt
Uy
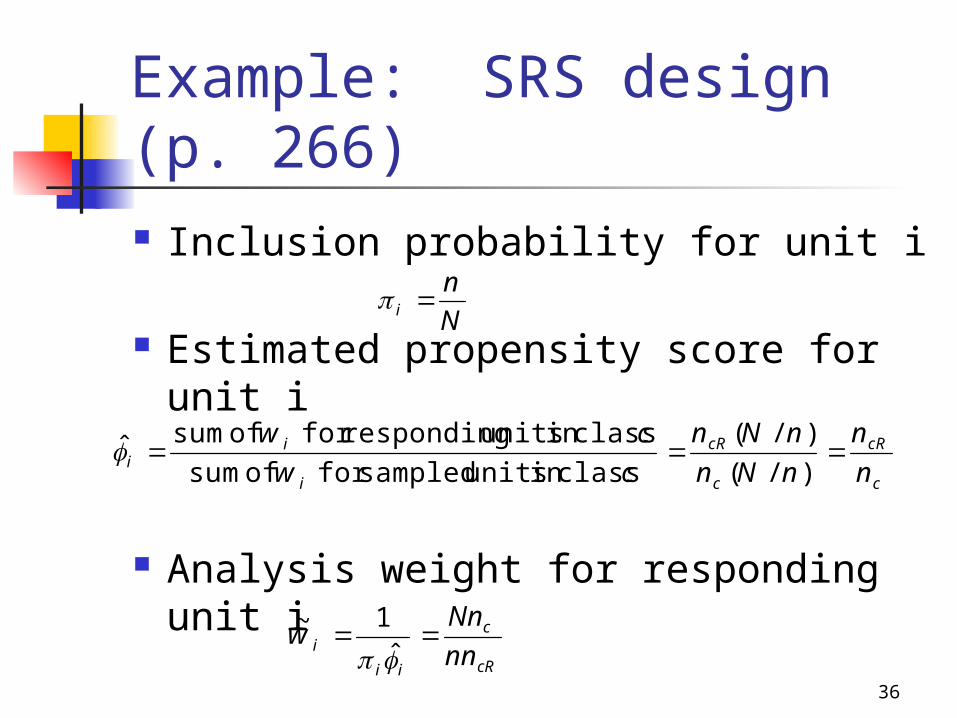
36
Example: SRS design (p. 266) Inclusion probability for unit i
Estimated propensity score for unit i
Analysis weight for responding unit i
c
cR
c
cR
i
ii n
nnNnnNn
cwcw
)/()/(
class in units sampledfor of sum class in units respondingfor of sum
cR
c
ii
i nnNn
w ˆ1~
Nn
i
37
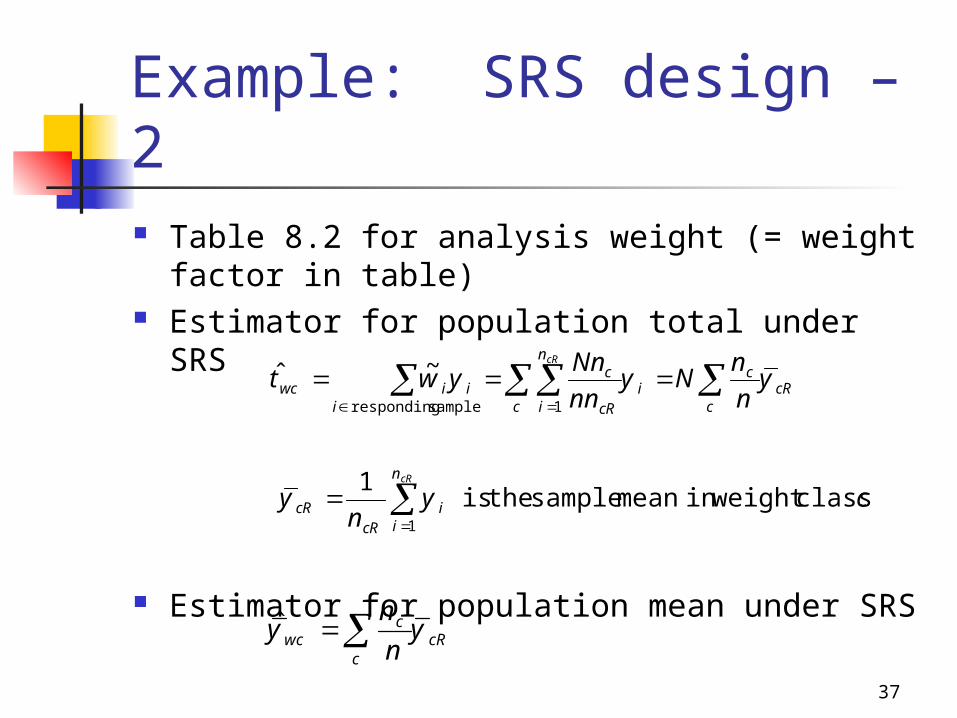
Example: SRS design – 2 Table 8.2 for analysis weight (= weight factor
in table) Estimator for population total under SRS
Estimator for population mean under SRS
cyn
y
ynn
NynnNn
ywt
cR
cR
n
ii
cRcR
cRc
ci
c
n
i cR
c
iiiwc
classweight in mean sample the is 1
~ˆ
1
1sample responding
ˆcR
c
cwc y
nn
y
38
Weighting-class adjustment - 3 Selecting weighting classes
Use principles for selecting strata Classes should be groups of similar
units in relation to Propensity score (likelihood of
responding) Response variable
Should maximize variation across classes for these two factors
39
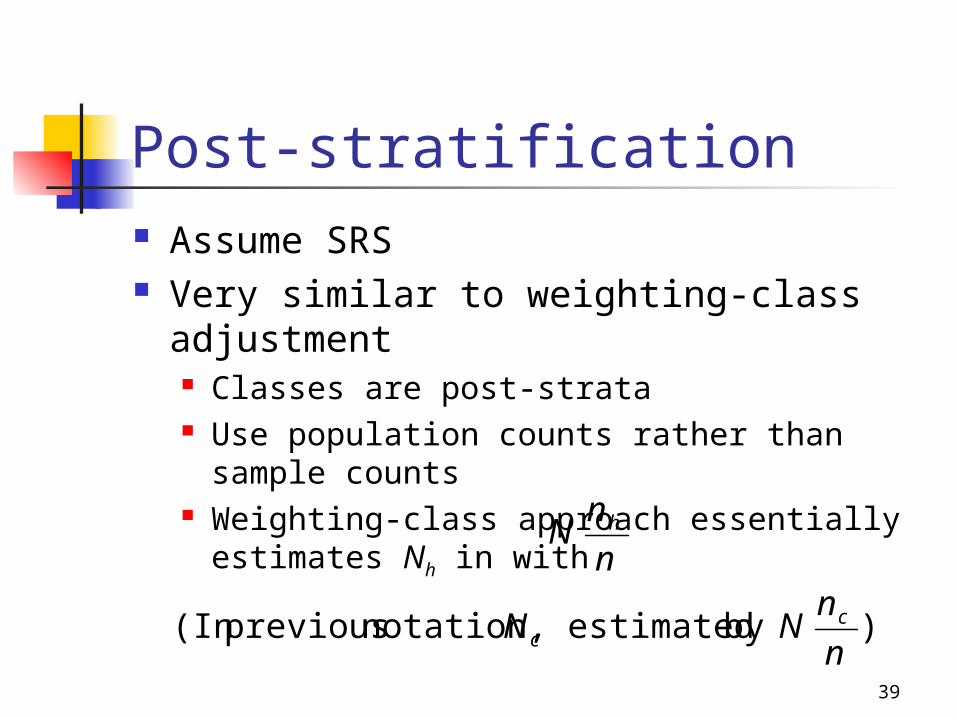
Post-stratification Assume SRS Very similar to weighting-class
adjustment Classes are post-strata Use population counts rather than sample
counts Weighting-class approach essentially
estimates Nh in with
)by estimated notation, previous (In
nn
NN
nn
N
cc
h
40
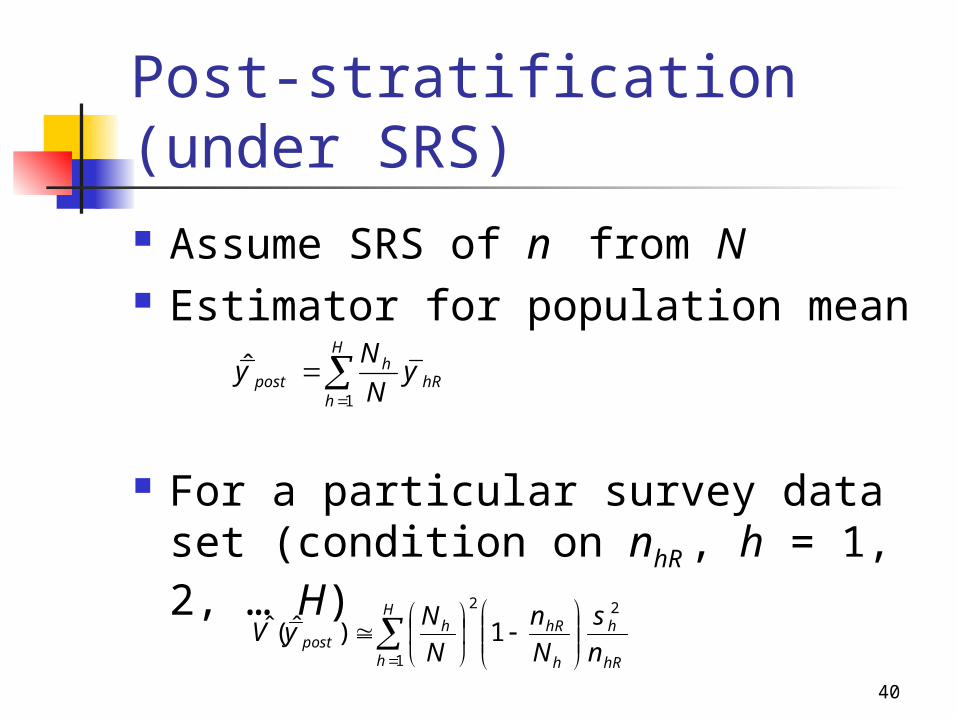
Post-stratification (under SRS) Assume SRS of n from N Estimator for population mean
For a particular survey data set (condition on nhR , h = 1, 2, … H)
ˆ1
H
hhR
hpost y
NN
y
H
h hR
h
h
hRhpost n
sNn
NN
yV1
22
1)ˆ(ˆ
41
Strategy 4: Imputation Missing item (question) data are typical
in a survey Refusals, data collector error, edit erroneous
value after data collection Imputation is a statistical method for
“filling in” missing values If impute all missing values, can get a
complete rectangular data set (rows = units, columns = variables)
An indicator variable should be developed to identify which values are imputed
42
Imputation methods Deductive imputation
Common method, rarely applicable Cell mean imputation
Leads to incorrect distribution of y in dataset Hot-deck imputation (random)
Most common and generally applicable Regression imputation
Between hot-deck and cell mean Multiple imputation
Accounting for variation due to imputation process
43
Deductive imputation Sufficient information exists to identify
the missing value Relatively uncommon (especially with
computer-based systems) Example for NCVS
Person 7 Crime victim = no Violent crime victim = ? Deductive imputation
Crime victim = no Violent crime victim = no
44
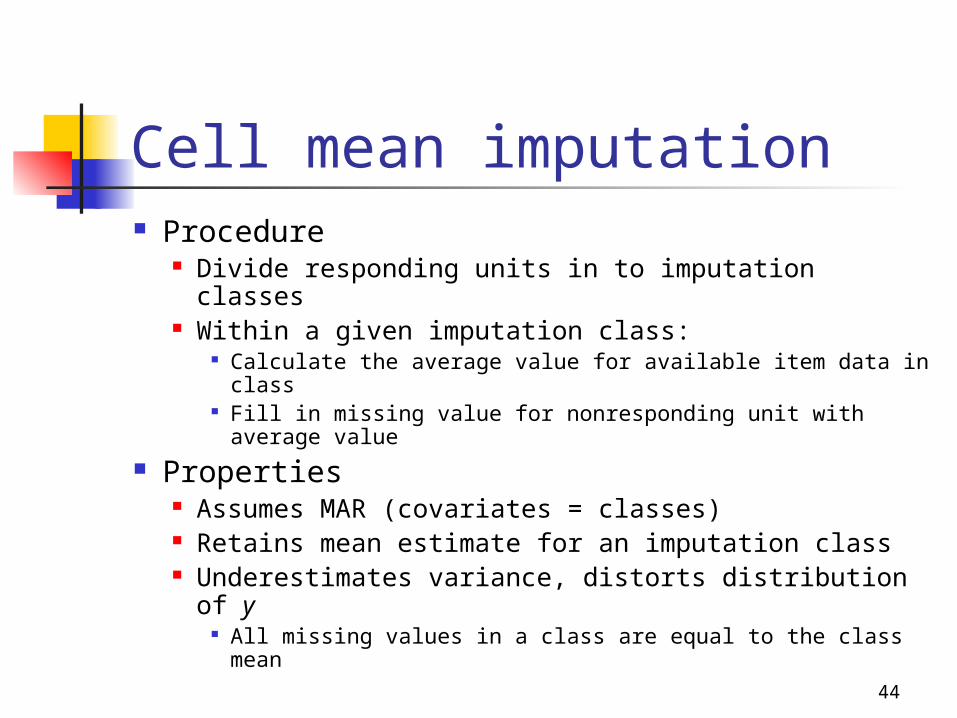
Cell mean imputation Procedure
Divide responding units in to imputation classes Within a given imputation class:
Calculate the average value for available item data in class
Fill in missing value for nonresponding unit with average value
Properties Assumes MAR (covariates = classes) Retains mean estimate for an imputation class Underestimates variance, distorts distribution of y
All missing values in a class are equal to the class mean
45
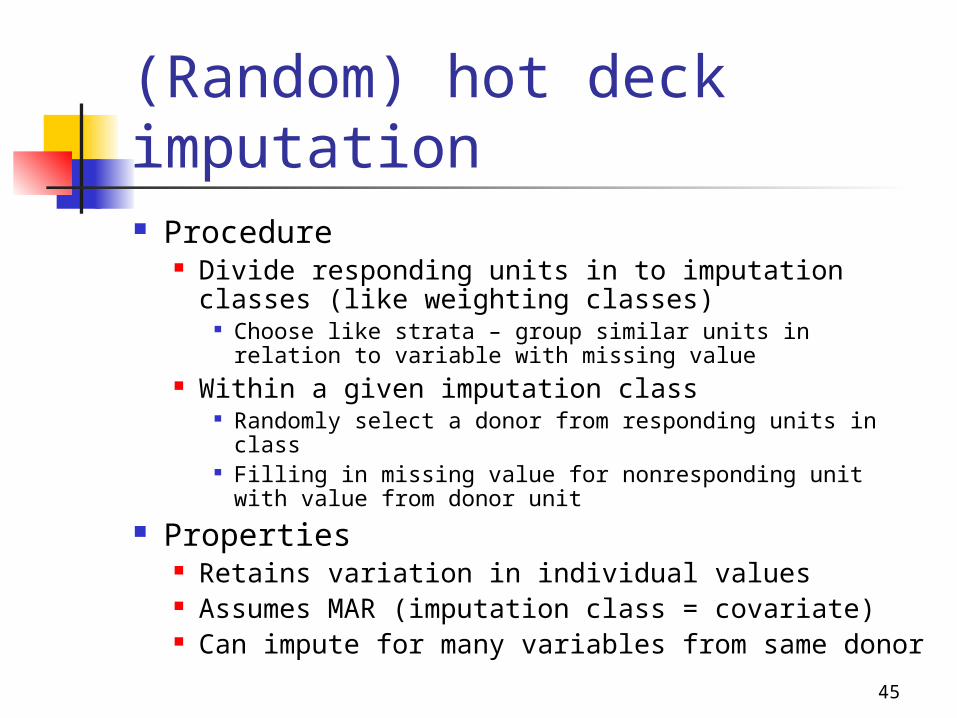
(Random) hot deck imputation Procedure
Divide responding units in to imputation classes (like weighting classes)
Choose like strata – group similar units in relation to variable with missing value
Within a given imputation class Randomly select a donor from responding units in class Filling in missing value for nonresponding unit with
value from donor unit Properties
Retains variation in individual values Assumes MAR (imputation class = covariate) Can impute for many variables from same donor
46
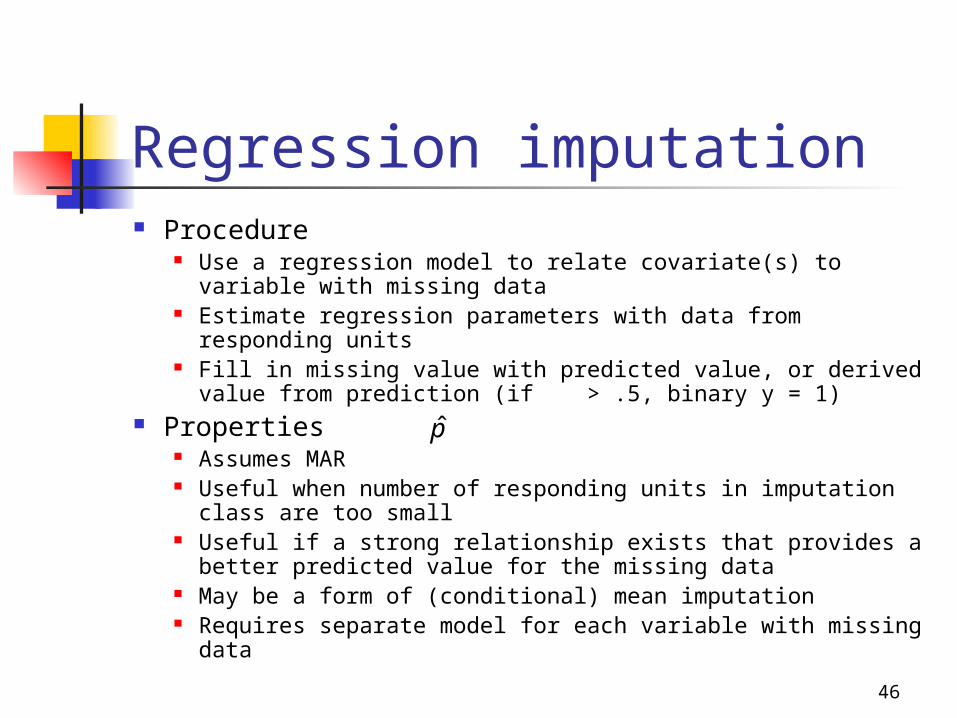
Regression imputation Procedure
Use a regression model to relate covariate(s) to variable with missing data
Estimate regression parameters with data from responding units
Fill in missing value with predicted value, or derived value from prediction (if > .5, binary y = 1)
Properties Assumes MAR Useful when number of responding units in imputation class
are too small Useful if a strong relationship exists that provides a better
predicted value for the missing data May be a form of (conditional) mean imputation Requires separate model for each variable with missing data
p
47
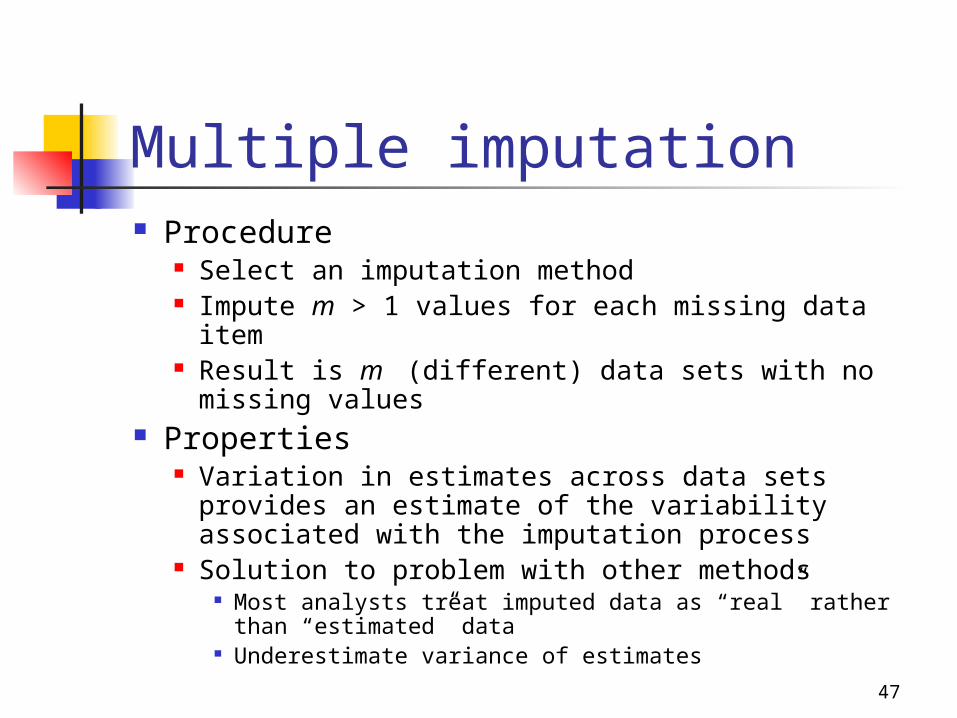
Multiple imputation Procedure
Select an imputation method Impute m > 1 values for each missing data item Result is m (different) data sets with no missing
values Properties
Variation in estimates across data sets provides an estimate of the variability associated with the imputation process
Solution to problem with other methods Most analysts treat imputed data as “real” rather than
“estimated” data Underestimate variance of estimates
48
Imputation summary Most imputation methods assume MAR given
covariates Variation in methods associated with model used to
account for covariate Good methods exist that do not lead to a distorted
distribution of y in the data set Avoid cell mean imputation
Hot deck imputation allows us to perform imputation for >1 variable at a time
Most imputation methods do not account for the fact that you are “estimating” the data when estimating the variance of an estimate
This is the motivation for multiple imputation Need special estimators for variance in multiple imputation
49
Outcome rates MANY ways to describe results of
processes between sample selection and completing data collection
Phases Locating unit Contacting unit (for people, businesses) Gaining cooperation of a unit (refusals) Determining eligibility Obtaining complete item data for a unit
AAPOR reference http://www.aapor.org/default.asp?page=survey_methods/
response_rate_calculator