Embed Size (px)
Citation preview

1
Chapter 7:
MECHANICAL PROPERTIES

Chapter Outline
Terminology for Mechanical Properties The Tensile Test: Stress-Strain Diagram Properties Obtained from a Tensile Test True Stress and True Strain The Bend Test for Brittle Materials Hardness of Materials

3
Questions to Think About
• Stress and strain: What are they and why are they used instead of load and deformation?
• Elastic behavior: When loads are small, how much deformation occurs? What materials deform least?
• Plastic behavior: At what point do dislocations cause permanent deformation? What materials are most resistant to permanent deformation?
• Toughness and ductility: What are they and how do we measure them?
• Ceramic Materials: What special provisions/tests are made for ceramic materials?

4
Stress-Strain Test
specimen
machine

5
Tensile Test

6
Important Mechanical Properties from a Tensile Test
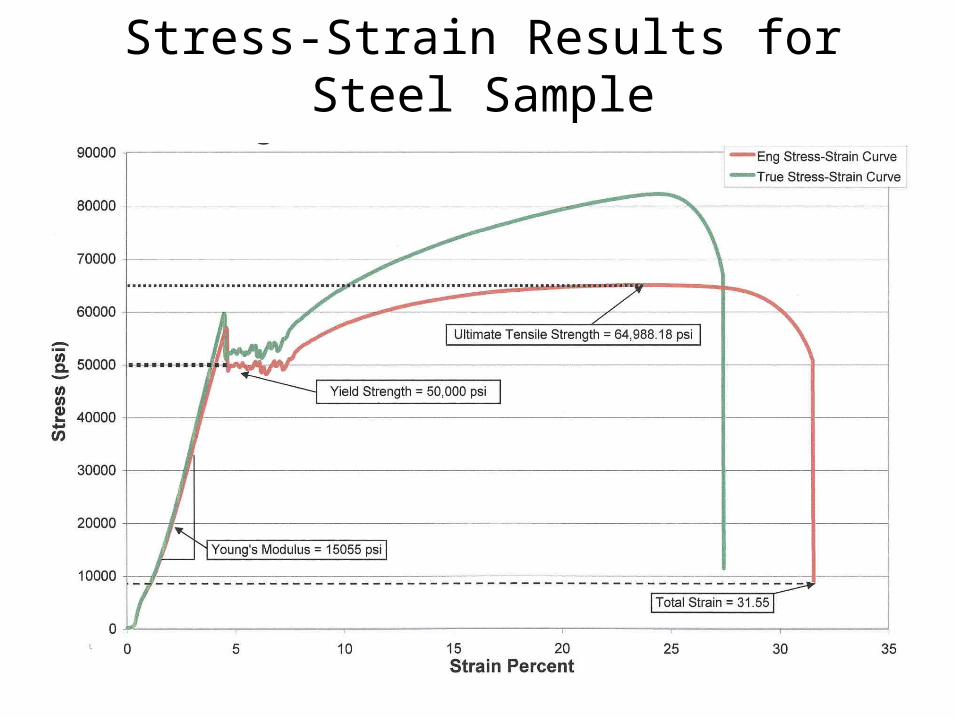
• Young's Modulus: This is the slope of the linear portion of the stress-strain curve, it is usually specific to each material; a constant, known value.
• Yield Strength: This is the value of stress at the yield point, calculated by plotting young's modulus at a specified percent of offset (usually offset = 0.2%).
• Ultimate Tensile Strength: This is the highest value of stress on the stress-strain curve.
• Percent Elongation: This is the change in gauge length divided by the original gauge length.

Terminology
Load - The force applied to a material during testing.
Strain gage or Extensometer - A device used for measuring change in length (strain).
Engineering stress - The applied load, or force, divided by the original cross-sectional area of the material.
Engineering strain - The amount that a material deforms per unit length in a tensile test.

8
F
bonds stretch
return to initial
1. Initial 2. Small load 3. Unload
Elastic means reversible.
F
Linear- elastic
Non-Linear-elastic
Elastic Deformation

9
1. Initial 2. Small load 3. Unload
Plastic means permanent.
F
linear elastic
linear elastic
plastic
planes still sheared
F
elastic + plastic
bonds stretch & planes shear
plastic
Plastic Deformation (Metals)

10
Typical stress-strain behavior for a metal showing elastic and plastic deformations, the proportional limit P and the yield strength σy, as determined using the 0.002 strain offset method (where there
is noticeable plastic deformation). P is the gradual elastic to plastic transition.

11
Plastic Deformation (permanent)
• From an atomic perspective, plastic deformation corresponds to the breaking of bonds with original atom neighbors and then reforming bonds with new neighbors.
• After removal of the stress, the large number of atoms that have relocated, do not return to original position.
• Yield strength is a measure of resistance to plastic deformation.

12

(c)2003 Brooks/Cole, a division of Thomson Learning, Inc. Thomson Learning™ is a trademark used herein under license.
• Localized deformation of a ductile material during a tensile test produces a necked region. • The image shows necked region in a fractured sample

14
Permanent Deformation
• Permanent deformation for metals is accomplished by means of a process called slip, which involves the motion of dislocations.
• Most structures are designed to ensure that only elastic deformation results when stress is applied.
• A structure that has plastically deformed, or experienced a permanent change in shape, may not be capable of functioning as intended.

15
tensile stress,
engineering strain,
y
p = 0.002
Yield Strength, y
tensile stress,
engineering strain,
Elastic initially
Elastic+Plastic at larger stress
permanent (plastic) after load is removed
pplastic strain

Stress-Strain Diagram
Strain ( ) (L/Lo)
41
2
3
5
Str
ess
(F
/A)
Elastic Region
PlasticRegion
StrainHardening Fracture
ultimatetensile strength
Slop
e=E
Elastic region slope =Young’s (elastic) modulus yield strengthPlastic region ultimate tensile strength strain hardening fracture
necking
yieldstrength
UTS
y
εEσ
ε
σE
12
y
ε ε
σE
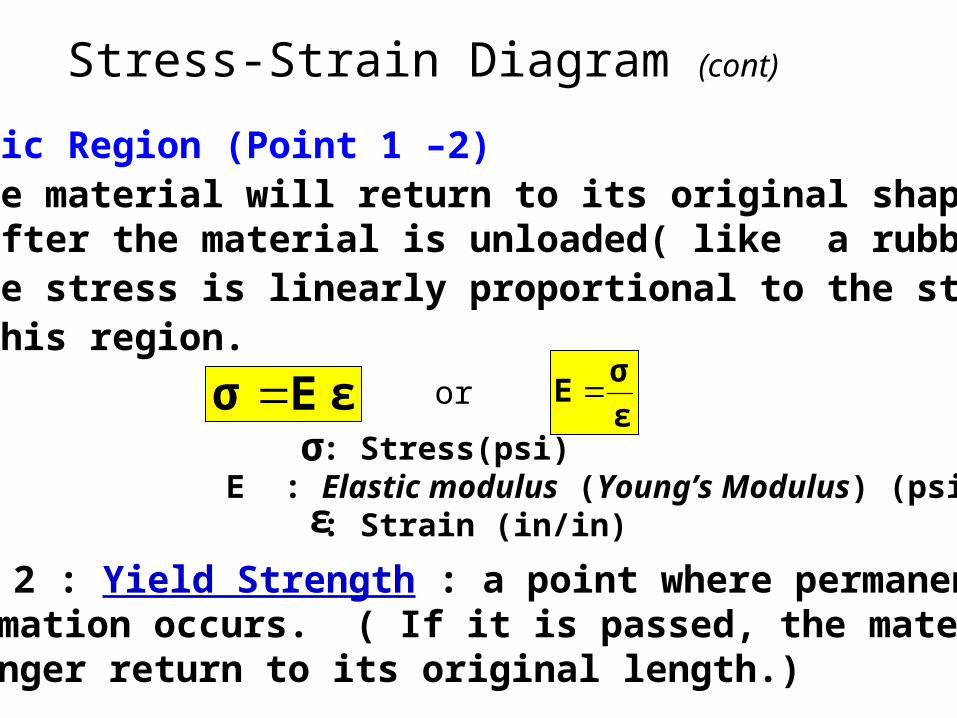
Stress-Strain Diagram (cont)
• Elastic Region (Point 1 –2) - The material will return to its original shape after the material is unloaded( like a rubber band). - The stress is linearly proportional to the strain in this region.
εEσ : Stress(psi)E : Elastic modulus (Young’s Modulus) (psi) : Strain (in/in)
σ
ε
- Point 2 : Yield Strength : a point where permanent deformation occurs. ( If it is passed, the material will no longer return to its original length.)
ε
σE or

• Strain Hardening
- If the material is loaded again from Point 4, the
curve will follow back to Point 3 with the same
Elastic Modulus (slope).
- The material now has a higher yield strength of
Point 4.
- Raising the yield strength by permanently straining
the material is called Strain Hardening.
Stress-Strain Diagram (cont)
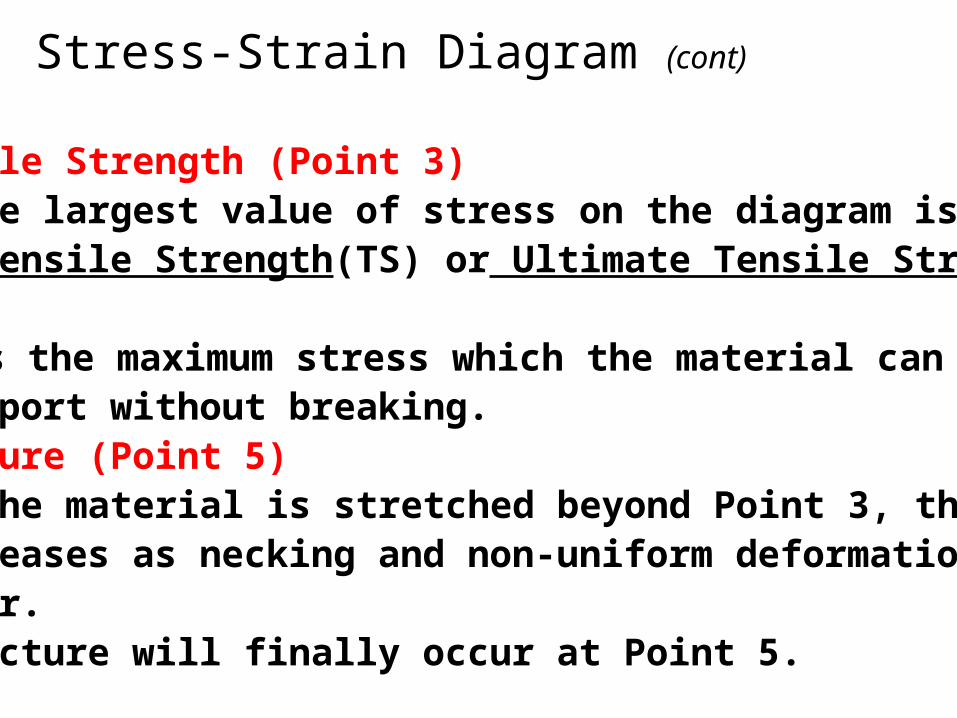
• Tensile Strength (Point 3) - The largest value of stress on the diagram is called Tensile Strength(TS) or Ultimate Tensile Strength (UTS) - It is the maximum stress which the material can support without breaking.• Fracture (Point 5) - If the material is stretched beyond Point 3, the stress decreases as necking and non-uniform deformation occur. - Fracture will finally occur at Point 5.
Stress-Strain Diagram (cont)
(c)2003 Brooks/Cole, a division of Thomson Learning, Inc. Thomson Learning™ is a trademark used herein under license.
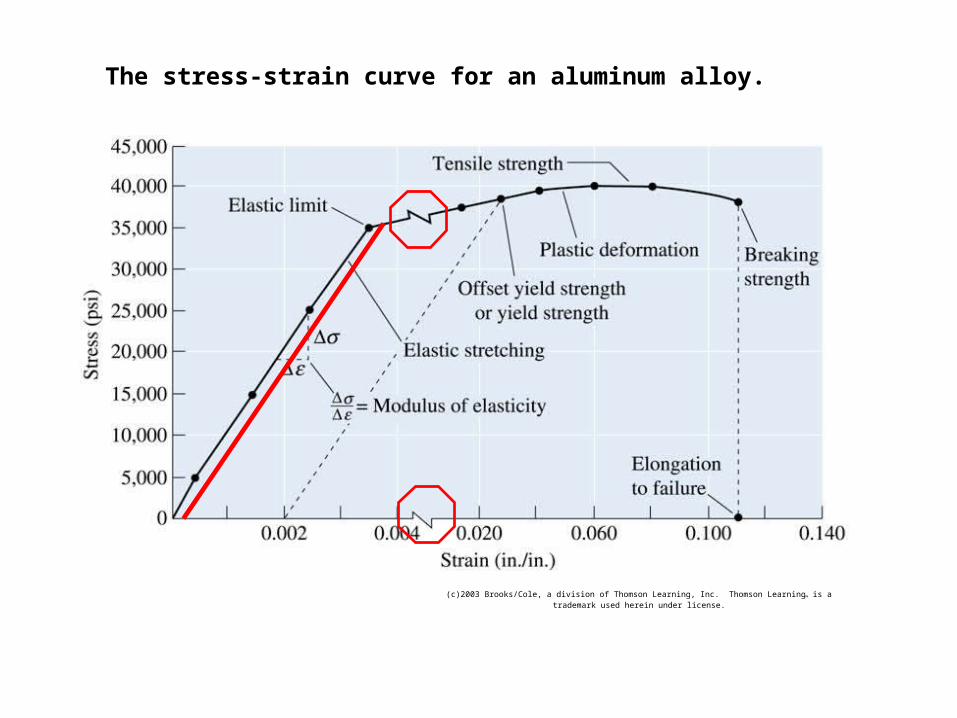
The stress-strain curve for an aluminum alloy.

21
• Stress-strain behavior found for some steels with yield point phenomenon.

22
T
E
N
S
I
L
E
P
R
O
P
E
R
T
I
E
S

23
Graphite/ Ceramics/ Semicond
Metals/ Alloys
Composites/ fibersPolymers
Yield
str
en
gth
, y (M
Pa)
PVC
Ha
rd t
o m
ea
sure,
si
nce in
ten
sion
, fr
actu
re u
sually
occu
rs b
efo
re y
ield
.
Nylon 6,6
LDPE
70
20
40
6050
100
10
30
200
300
400500600700
1000
2000
Tin (pure)
Al (6061)a
Al (6061)ag
Cu (71500)hrTa (pure)Ti (pure)aSteel (1020)hr
Steel (1020)cdSteel (4140)a
Steel (4140)qt
Ti (5Al-2.5Sn)aW (pure)
Mo (pure)Cu (71500)cw
Ha
rd t
o m
ea
sure
, in
cera
mic
matr
ix a
nd
ep
oxy m
atr
ix c
om
posi
tes,
sin
ce
in
ten
sion
, fr
actu
re u
sually
occu
rs b
efo
re y
ield
.HDPEPP
humid
dryPC
PET
¨ Room T valuesa = annealedhr = hot rolledag = agedcd = cold drawncw = cold workedqt = quenched & tempered
Yield Strength: Comparison

24
• After yielding, the stress necessary to continue plastic deformation in metals increases to a maximum point (M) and then decreases to the eventual fracture point (F).• All deformation up to the maximum stress is uniform throughout the tensile sample. • However, at max stress, a small constriction or neck begins to form.• Subsequent deformation will be confined to this neck area.• Fracture strength corresponds to the stress at fracture.
Region between M and F:• Metals: occurs when noticeable necking starts.• Ceramics: occurs when crack propagation starts.• Polymers: occurs when polymer backbones are aligned and about to break.
Tensile Strength, TS

25
In an undeformed thermoplastic polymer tensile sample, (a)the polymer chains are randomly oriented. (b)When a stress is applied, a neck develops as chains become aligned locally. The neck continues to grow until the chains in the entire gage length have aligned. (c)The strength of the polymer is increased

26
Room T values
Si crystal<100>
Graphite/ Ceramics/ Semicond
Metals/ Alloys
Composites/ fibersPolymers
Ten
sile
str
en
gth
, TS
(MPa)
PVC
Nylon 6,6
10
100
200300
1000
Al (6061)a
Al (6061)agCu (71500)hr
Ta (pure)Ti (pure)aSteel (1020)
Steel (4140)a
Steel (4140)qt
Ti (5Al-2.5Sn)aW (pure)
Cu (71500)cw
LDPE
PP
PC PET
20
3040
20003000
5000
Graphite
Al oxide
Concrete
Diamond
Glass-soda
Si nitride
HDPE
wood( fiber)
wood(|| fiber)
1
GFRE(|| fiber)
GFRE( fiber)
CFRE(|| fiber)
CFRE( fiber)
AFRE(|| fiber)
AFRE( fiber)
E-glass fib
C fibersAramid fib
Based on data in Table B4, Callister 6e.
a = annealedhr = hot rolledag = agedcd = cold drawncw = cold workedqt = quenched & temperedAFRE, GFRE, & CFRE =aramid, glass, & carbonfiber-reinforced epoxycomposites, with 60 vol%fibers.
Tensile Strength: Comparison

27
• Tensile stress, : • Shear stress, :
Area, A
Ft
Ft
FtAo
original area before loading
Area, A
Ft
Ft
Fs
F
F
Fs
FsAo
Stress has units: N/m2 or lb/in2
Engineering Stress

28
VMSE
http://www.wiley.com/college/callister/0470125373/vmse/strstr.htm
http://www.wiley.com/college/callister/0470125373/vmse/index.htm

Example 1
Tensile Testing of Aluminum Alloy
Convert the change in length data in the table to engineering stress and strain and plot a stress-strain curve.
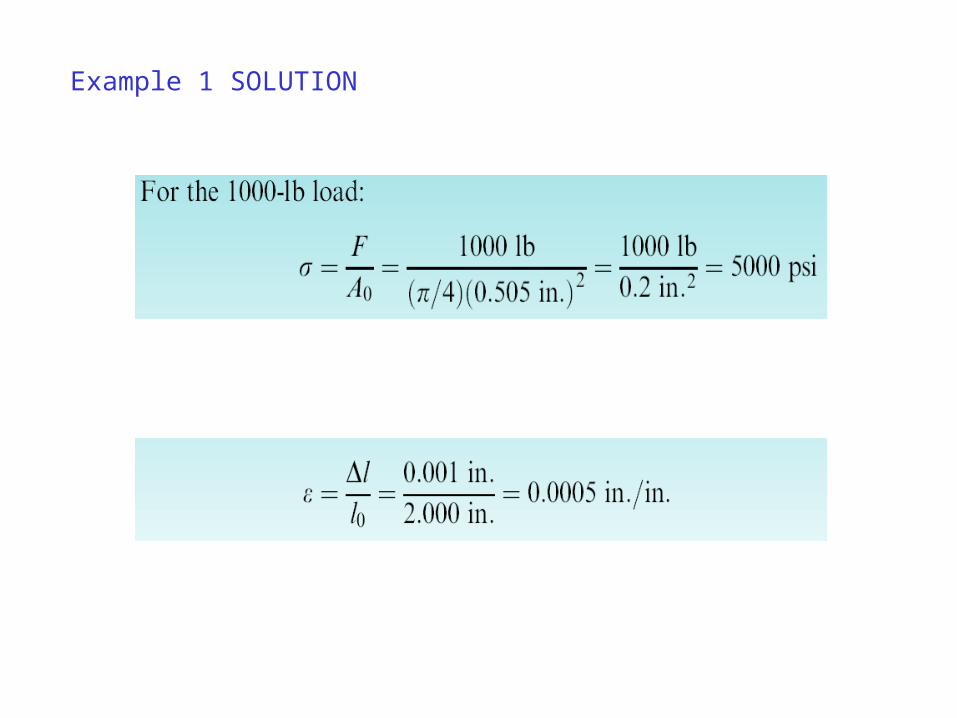
Example 1 SOLUTION

31
Engineering tensile strain,
Engineering tensile stress,
smaller %EL (brittle if %EL<5%)
larger %EL (ductile if %EL>5%)
• Another ductility measure: 100% xA
AAAR
o
fo
• Ductility may be expressed as either percent elongation (% plastic strain at fracture) or percent reduction in area.• %AR > %EL is possible if internal voids form in neck.
Lo LfAo Af
100% xl
llEL
o
of
Ductility, %EL
Ductility is a measure of the plastic deformation that has been sustained at fracture:
A material that suffers very little plastic deformation is brittle.

32
Toughness
Lower toughness: ceramics
Higher toughness: metals
Toughness is the ability to absorb energy up to fracture (energy per unit volume of material).
A “tough” material has strength and ductility.
Approximated by the area under the stress-straincurve.

• Energy to break a unit volume of material• Approximate by the area under the stress-strain curve.
21
smaller toughness- unreinforced polymers
Engineering tensile strain,
Engineering tensile stress,
smaller toughness (ceramics)
larger toughness (metals, PMCs)
Toughness
34
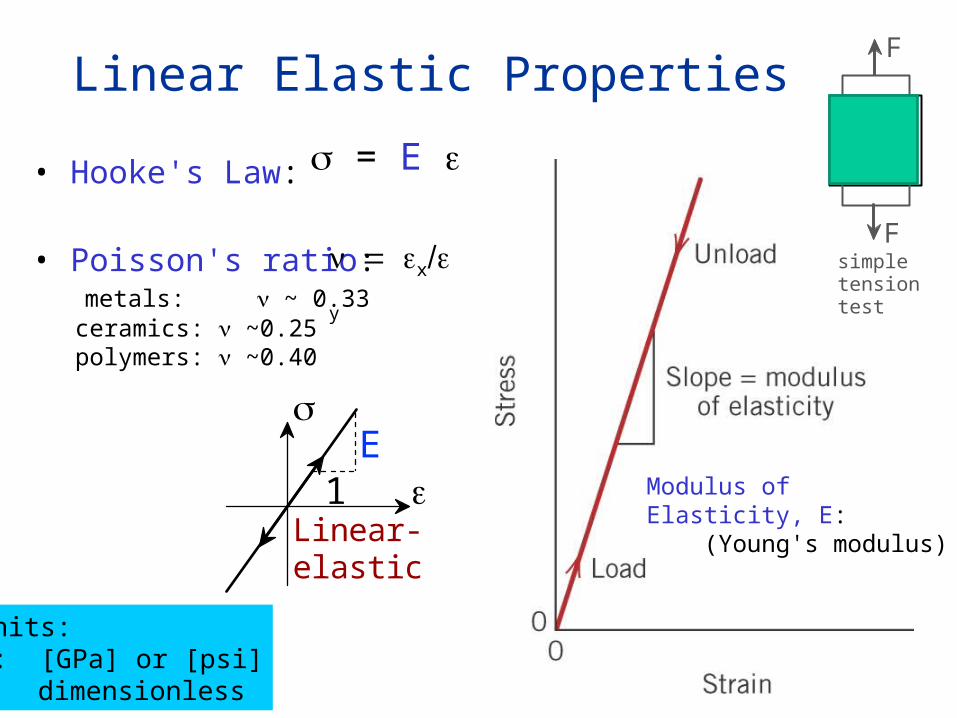
Linear Elastic Properties
Modulus of Elasticity, E: (Young's modulus)
• Hooke's Law: = E
• Poisson's ratio: metals: ~ 0.33 ceramics: ~0.25 polymers: ~0.40
Linear- elastic
1E
Units:E: [GPa] or [psi]: dimensionless
F
Fsimple tension test
x
y

35
Engineering Strain
Strain is dimensionless.

36
Axial (z) elongation (positive strain) and lateral (x and y) contractions (negative strains) in response to an imposed tensile stress.

True Stress and True Strain
True stress The load divided by the actual cross-sectional area of the specimen at that load.
True strain The strain calculated using actual and not original dimensions, given by εt ln(l/l0).
•The relation between the true stress-true strain diagram and engineering stress-engineering strain diagram. •The curves are identical to the yield point.
38
Stress-Strain Results for Steel Sample

Example 2: Young’s Modulus - Aluminum Alloy
From the data in Example 1, calculate the modulus of elasticity of the aluminum alloy.

• Use the modulus to determine the length after deformation of a bar of initial length of 50 in.
• Assume that a level of stress of 30,000 psi is applied.
Example 2: Young’s Modulus - Aluminum Alloy - continued

410.2
8
0.6
1
Magnesium,Aluminum
Platinum
Silver, Gold
Tantalum
Zinc, Ti
Steel, NiMolybdenum
Graphite
Si crystal
Glass -soda
Concrete
Si nitrideAl oxide
PC
Wood( grain)
AFRE( fibers)*
CFRE *
GFRE*
Glass fibers only
Carbon fibers only
Aramid fibers only
Epoxy only
0.4
0.8
2
46
10
20
406080
100
200
600800
10001200
400
Tin
Cu alloys
Tungsten
<100>
<111>
Si carbide
Diamond
PTF E
HDPE
LDPE
PP
Polyester
PSPET
CFRE( fibers)*
GFRE( fibers)*
GFRE(|| fibers)*
AFRE(|| fibers)*
CFRE(|| fibers)*
MetalsAlloys
GraphiteCeramicsSemicond
PolymersComposites
/fibers
E(GPa)
Eceramics > Emetals >> Epolymers
109 Pa Composite data based onreinforced epoxy with 60 vol%of aligned carbon (CFRE),aramid (AFRE), or glass (GFRE)fibers.
Young’s Moduli: Comparison

Example 3: True Stress and True Strain Calculation
Compare engineering stress and strain with true stress and strain for the aluminum alloy in Example 1 at (a) the maximum load. The diameter at maximum load is 0.497 in. and at fracture is 0.398 in.
Example 3 SOLUTION

large hardening
small hardening
unlo
ad
relo
ad
y 0
y 1
Strain Hardening
T C T n“true” stress (F/A) “true” strain: ln(L/Lo)
hardening exponent: n=0.15 (some steels) to n=0.5 (some copper)
An increase in y due to plastic deformation.

44
Strain Hardening (n, K or C values)
T C T n“true” stress (F/A) “true” strain: ln(L/Lo)
hardening exponent: n=0.15 (some steels) to n=0.5 (some copper)


47
Mechanical Behavior - Ceramics
• The stress-strain behavior of brittle ceramics is not usually obtained by a tensile test.1. It is difficult to prepare and test
specimens with specific geometry.
2. It is difficult to grip brittle materials without fracturing them.
3. Ceramics fail after roughly 0.1% strain; specimen have to be perfectly aligned.

The Bend Test for Brittle Materials
Bend test - Application of a force to the center of a bar that is supported on each end to determine the resistance of the material to a static or slowly applied load.
Flexural strength or modulus of rupture -The stress required to fracture a specimen in a bend test.
Flexural modulus - The modulus of elasticity calculated from the results of a bend test, giving the slope of the stress-deflection curve.
(c)2003 Brooks/Cole, a division of Thomson Learning, Inc. Thomson Learning™ is a trademark used herein under license.
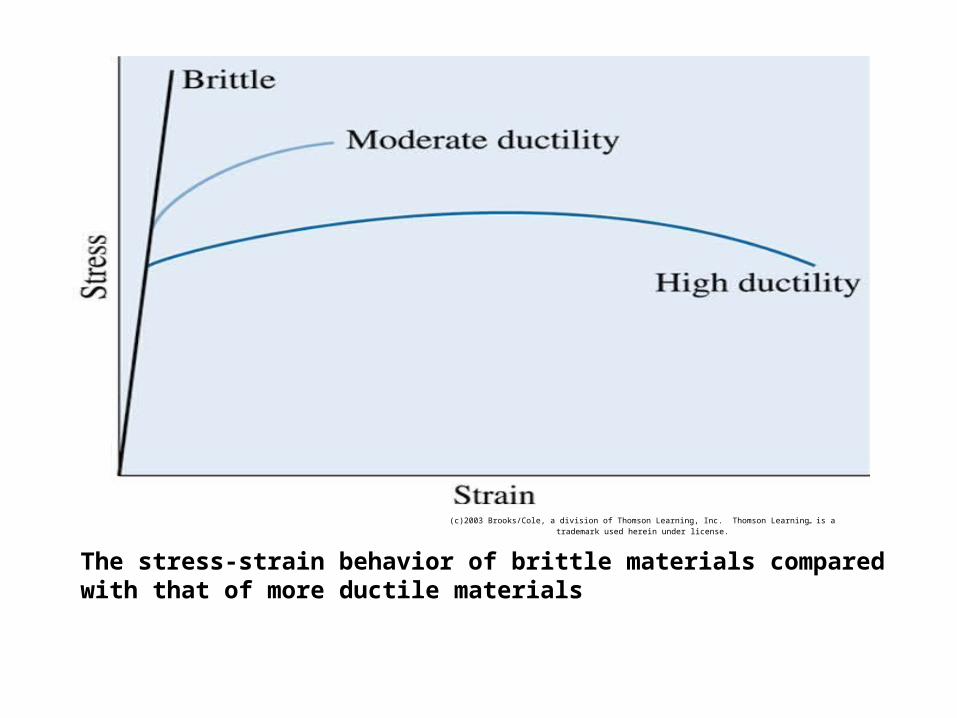
The stress-strain behavior of brittle materials compared with that of more ductile materials

(c)2003 Brooks/Cole, a division of Thomson Learning, Inc. Thomson Learning™ is a trademark used herein under license.
(a) The bend test often used for measuring the strength of brittle materials, and (b) the deflection δ obtained by bending
51
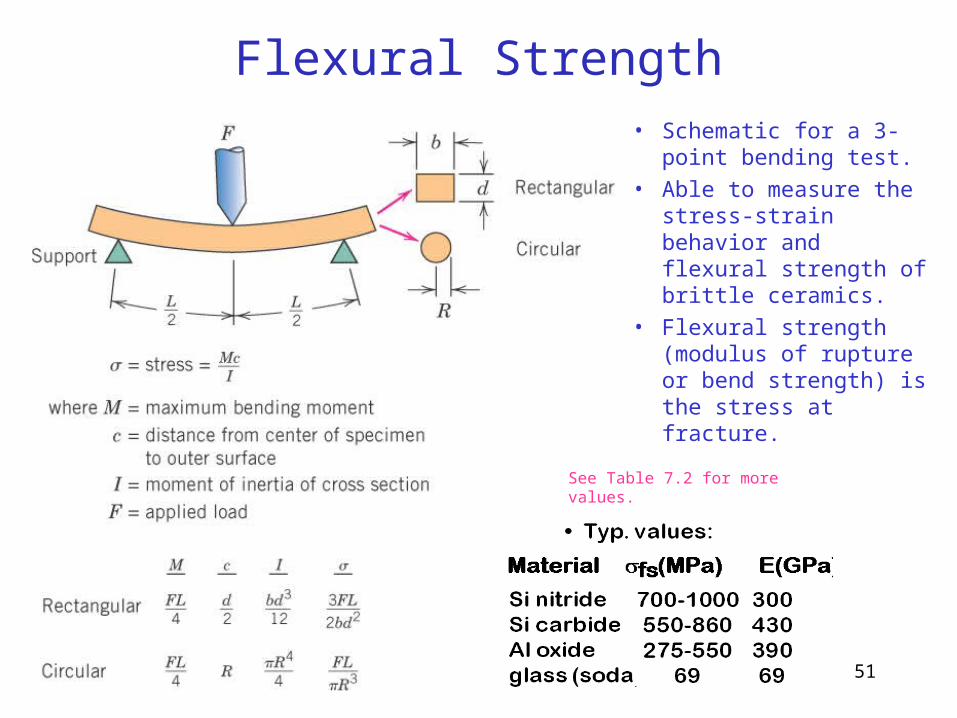
• Schematic for a 3-point bending test.
• Able to measure the stress-strain behavior and flexural strength of brittle ceramics.
• Flexural strength (modulus of rupture or bend strength) is the stress at fracture.
Flexural Strength
See Table 7.2 for more values.

23
• Room T behavior is usually elastic, with brittle failure.• 3-Point Bend Testing often used. --tensile tests are difficult for brittle materials.
FL/2 L/2
= midpoint deflection
cross section
R
b
d
rect. circ.
• Determine elastic modulus according to:
E
F
L3
4bd3
F
L3
12R4
rect. cross
section
circ. cross
section
Fx
linear-elastic behavior
F
slope =
MEASURING ELASTIC MODULUS

24
• 3-point bend test to measure room T strength.F
L/2 L/2cross section
R
b
d
rect. circ.
location of max tension
• Flexural strength:
rect. fs m
fail 1.5FmaxL
bd2
FmaxL
R3
xF
Fmax
max
• Typ. values:Material fs(MPa) E(GPa)
Si nitrideSi carbideAl oxideglass (soda)
700-1000550-860275-550
69
30043039069
Data from Table 12.5, Callister 6e.
MEASURING STRENGTH

54
--brittle response (aligned chain, cross linked & networked case) --plastic response (semi-crystalline case)
Stress-Strain Behavior: Elastomers
3 different responses:A – brittle failure
B – plastic failure
C - highly elastic (elastomer)
initial: amorphous chains are kinked, heavily cross-linked.
final: chains are straight,
still cross-linked
0
20
40
60
0 2 4 6
(MPa)
8
x
x
x
elastomer
plastic failure
brittle failure
Deformation is reversible!

Hardness of Materials
Hardness test - Measures the resistance of a material to penetration by a sharp object.
Macrohardness - Overall bulk hardness of materials measured using loads >2 N.
Microhardness Hardness of materials typically measured using loads less than 2 N using such test as Knoop (HK).
Nano-hardness - Hardness of materials measured at 1–10 nm length scale using extremely small (~100 µN) forces.

56
Hardness• Hardness is a measure of a material’s resistance
to localized plastic deformation (a small dent or scratch).
• Quantitative hardness techniques have been developed where a small indenter is forced into the surface of a material.
• The depth or size of the indentation is measured, and corresponds to a hardness number.
• The softer the material, the larger and deeper the indentation (and lower hardness number).

57
• Resistance to permanently indenting the surface.• Large hardness means: --resistance to plastic deformation or cracking in compression. --better wear properties.
e.g., 10mm sphere
apply known force (1 to 1000g)
measure size of indent after removing load
dDSmaller indents mean larger hardness.
increasing hardness
most plastics
brasses Al alloys
easy to machine steels file hard
cutting tools
nitrided steels diamond
Adapted from Fig. 6.18, Callister 6e. (Fig. 6.18 is adapted from G.F. Kinney, Engineering Properties and Applications of Plastics, p. 202, John Wiley and Sons, 1957.)
Hardness

58
Hardness Testers

59

60
Conversion of Hardness Scales
Also see: ASTM E140 - 07 Volume 03.01Standard Hardness Conversion Tables for Metals Relationship Among Brinell Hardness, Vickers Hardness, Rockwell Hardness, Superficial Hardness, Knoop Hardness, and Scleroscope Hardness
61
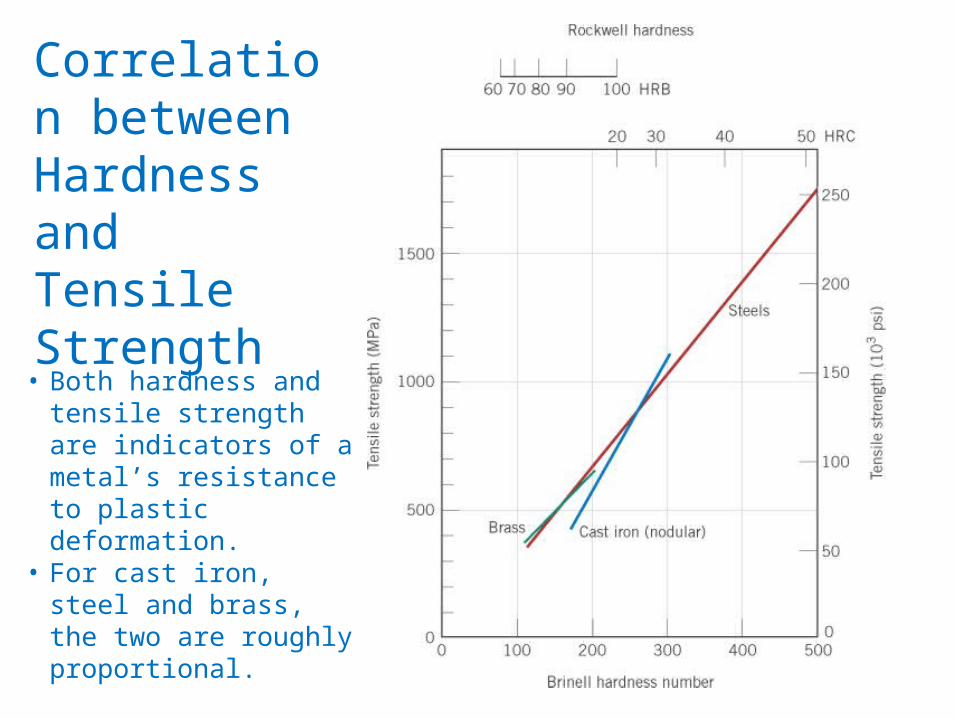
Correlation between Hardness and Tensile Strength
• Both hardness and tensile strength are indicators of a metal’s resistance to plastic deformation.
• For cast iron, steel and brass, the two are roughly proportional.
• Tensile strength (psi) = 500*BHR


63
• Stress and strain: These are size-independent measures of load and displacement, respectively.
• Elastic behavior: This reversible behavior often shows a linear relation between stress and strain. To minimize deformation, select a material with a large elastic modulus (E or G).
• Plastic behavior: This permanent deformation behavior occurs when the tensile (or compressive)
uniaxial stress reaches y.• Toughness: The energy needed to break a unit volume of material.
• Ductility: The plastic strain at failure.
Summary


![[PPT]Chapter 6: Mechanical Properties - University of · Web viewChapter 6: Behavior Of Material Under Mechanical Loads = Mechanical Properties. Stress and strain: What are they and](https://img.pdfslide.us/doc/110x75/5aa28a3b7f8b9a07758d23c8/pptchapter-6-mechanical-properties-university-of-viewchapter-6-behavior.jpg)


![[PPT]CHAPTER 6: MECHANICAL PROPERTIES - …materialteknologi.hig.no/Materiallare/W.D.Callister... · Web viewTitle CHAPTER 6: MECHANICAL PROPERTIES Author jhayton Last modified by](https://img.pdfslide.us/doc/110x75/5afb4ce17f8b9aac24910e7c/pptchapter-6-mechanical-properties-viewtitle-chapter-6-mechanical-properties.jpg)