Embed Size (px)
Citation preview

1
Chapter 5: Creating Summarized Output
5.1 Generating Summary Statistics
5.2 Creating a Summary Report with the Summary Tables Task
5.3 Creating and Applying Custom Formats

2
Chapter 5: Creating Summarized Output
5.1 Generating Summary Statistics5.1 Generating Summary Statistics
5.2 Creating a Summary Report with the Summary Tables Task
5.3 Creating and Applying Custom Formats
3
Objectives Create a summary table. Create a summary report. Export summary data to Excel.

4
Business ScenarioManagement would like a report that includes a summary of profits for each product line and category. The report should be accessible as an HTML file or an Excel spreadsheet stored on a shared network drive.

5
Summary Statistics TaskThe Summary Statistics task can be used to calculate summary statistics based on groups within the data. You can produce reports, graphs, and data sets as output.

6
Summary Statistics TaskThe Summary Statistics task has both a wizard and a standard task dialog box that can be used to set up results.

7
Summary Statistics: Task RolesUse the wizard to assign variables to roles.
Specify variables whosevalues define subgroups.
Compute statisticsfor each numericvariable in the list.

8
9
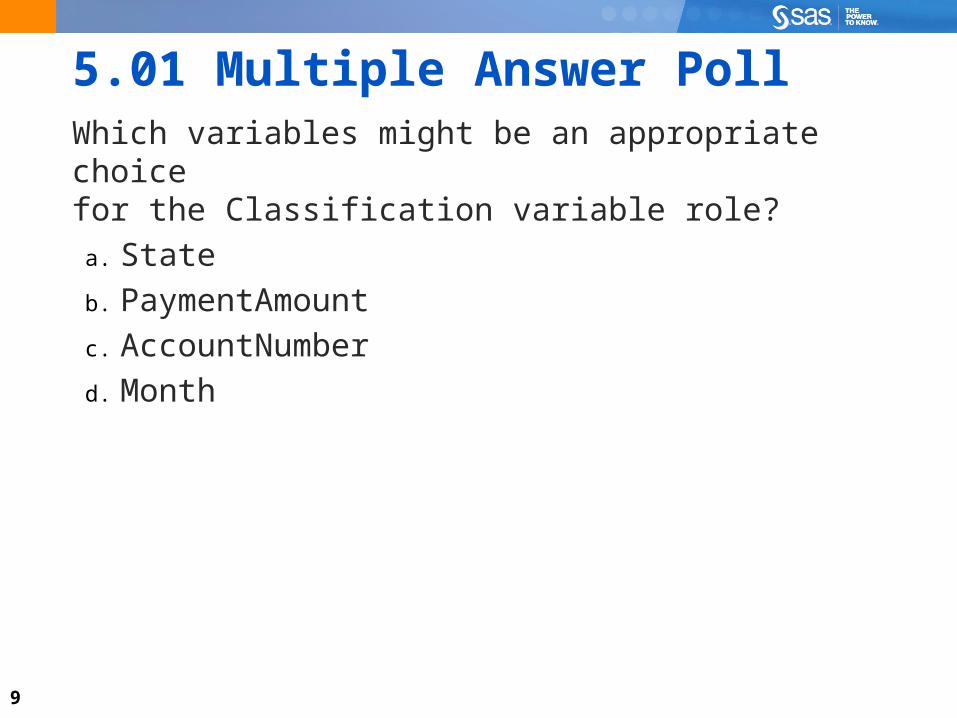
5.01 Multiple Answer PollWhich variables might be an appropriate choice for the Classification variable role?
a. State
b. PaymentAmount
c. AccountNumber
d. Month
10
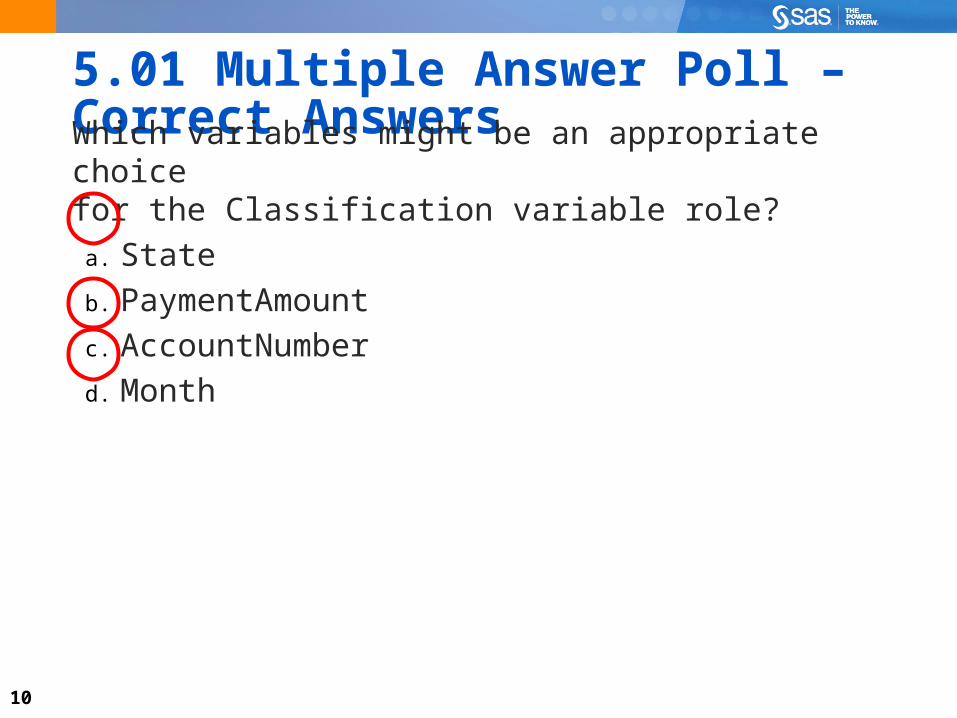
5.01 Multiple Answer Poll – Correct AnswersWhich variables might be an appropriate choice for the Classification variable role?
a. State
b. PaymentAmount
c. AccountNumber
d. Month
11
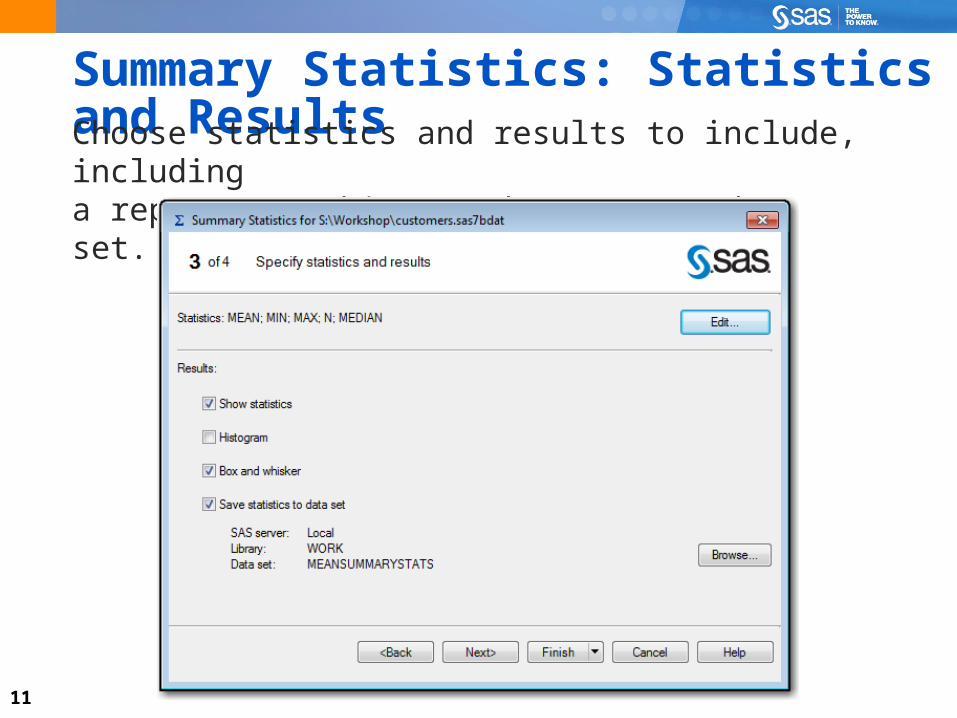
Summary Statistics: Statistics and ResultsChoose statistics and results to include, including a report, graphics, and an output data set.
12
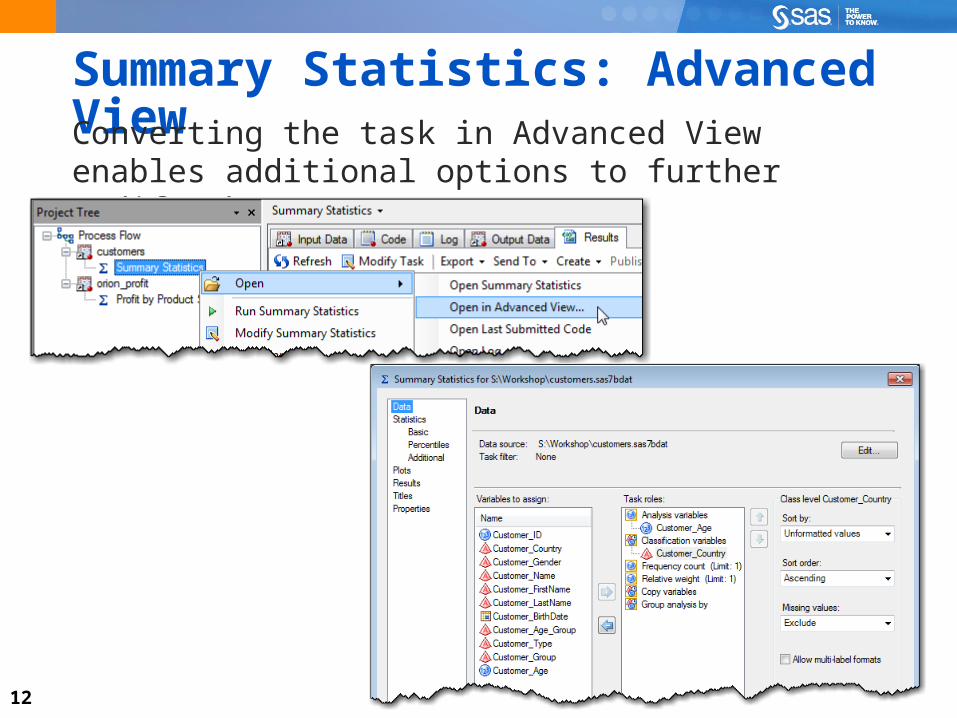
Summary Statistics: Advanced ViewConverting the task in Advanced View enables additional options to further modify the output.

13
Summarizing Data
This demonstration illustrates how to use the Summary Statistics task to summarize data, store the results in a summary table, and export the table to Microsoft Excel.

14

15
Exercise
This exercise reinforces the concepts discussed previously.

16

17
Chapter 5: Creating Summarized Output
5.1 Generating Summary Statistics
5.2 Creating a Summary Report with 5.2 Creating a Summary Report with the Summary Tables Task the Summary Tables Task
5.3 Creating and Applying Custom Formats

18
Objectives Access the Summary Tables task. Specify a table layout and statistics. Define headings for columns and rows. Assign a label for missing values. Add titles to the report. Generate the tabular summary report.

19
Business ScenarioTo better understand customer purchasing, the Orion marketing group would like a report that summarizes total profits for each customer age group and product category.

20
Summary TablesThe Summary Tables wizard or task can be used to generate a tabular summary report.
21
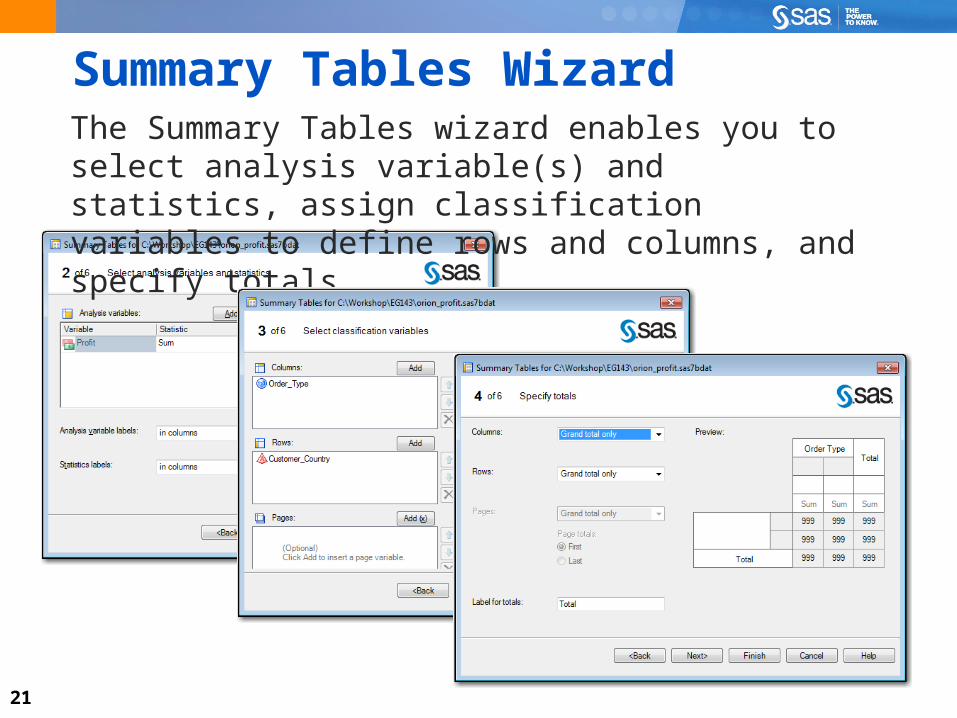
Summary Tables WizardThe Summary Tables wizard enables you to select analysis variable(s) and statistics, assign classification variables to define rows and columns, and specify totals.

22

23
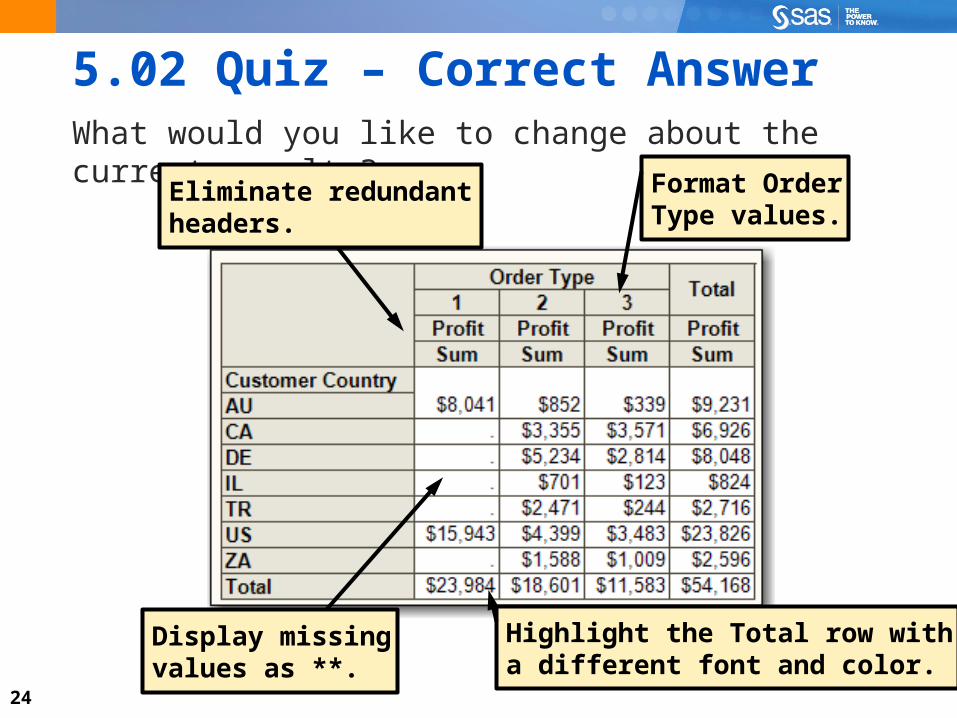
5.02 QuizWhat would you like to change about the current results?
24
5.02 Quiz – Correct AnswerWhat would you like to change about the current results?
Format OrderType values.
Eliminate redundantheaders.
Highlight the Total row witha different font and color.
Display missingvalues as **.

25
Summary Tables: Advanced ViewUse the Summary Tables task in Advanced View to further modify the labels, fonts, and formats in the table results.

26
Summary Tables: Modifying the Display

27
Summary Tables: Results

28
Creating a Tabular Summary Report
This demonstration illustrates how to use the Summary Tables task to generate descriptive statistics and display them in a tabular report.

29

30
Exercise
This exercise reinforces the concepts discussed previously.

31

32
Chapter 5: Creating Summarized Output
5.1 Generating Summary Statistics
5.2 Creating a Summary Report with the Summary Tables Task
5.3 Creating and Applying Custom Formats5.3 Creating and Applying Custom Formats

33
Objectives Create user-defined formats. Apply user-defined formats.
34
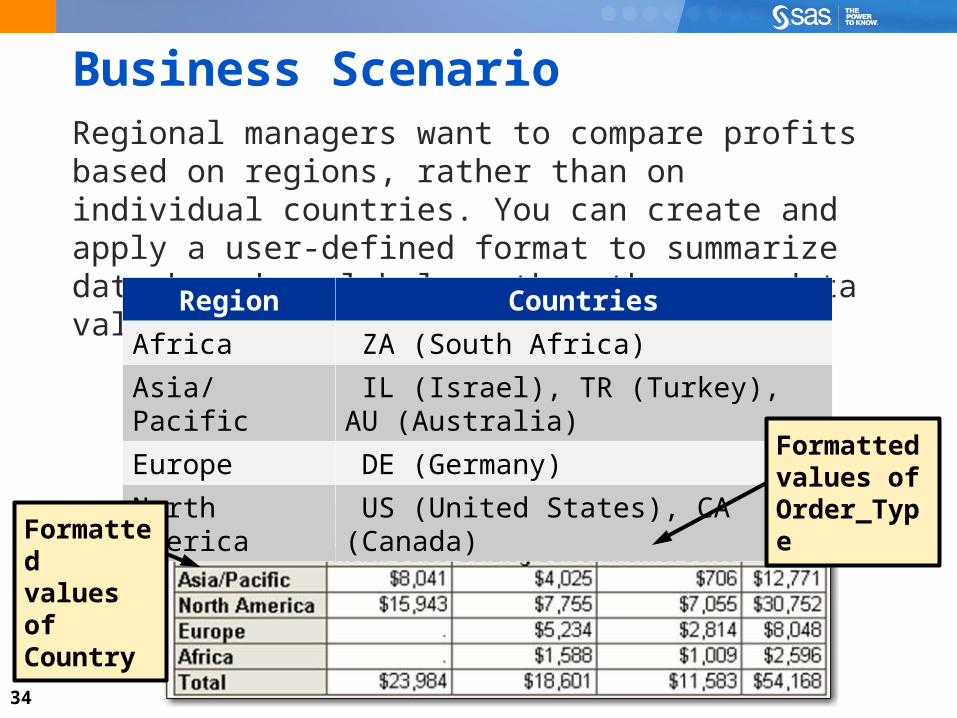
Business ScenarioRegional managers want to compare profits based on regions, rather than on individual countries. You can create and apply a user-defined format to summarize data based on labels rather than raw data values.
Region Countries
Africa ZA (South Africa)
Asia/Pacific IL (Israel), TR (Turkey), AU (Australia)
Europe DE (Germany)
North America US (United States), CA (Canada)Formattedvalues ofCountry
Formatted values of Order_Type

35
User-Defined FormatsYou can create custom formats to display data values with more descriptive or alternative labels.
36
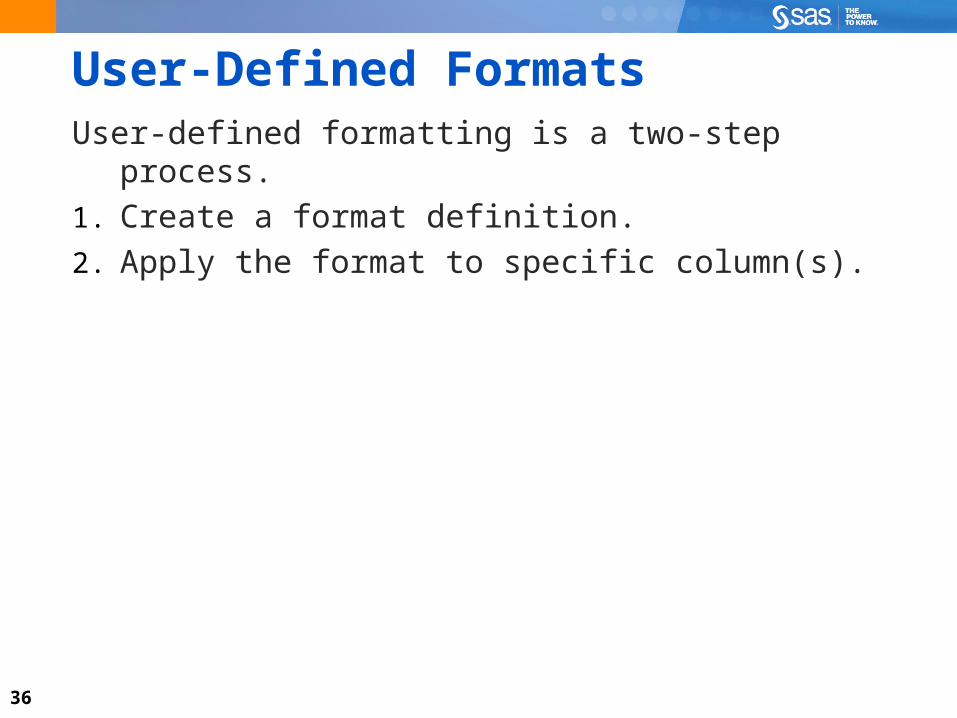
User-Defined FormatsUser-defined formatting is a two-step process.
1. Create a format definition.
2. Apply the format to specific column(s).

37
Create Format TasksTwo tasks are available to create a user-defined format. Create Format Create Format from Data Set
(new in SAS Enterprise Guide 4.3)

38
Create Format: OptionsThe Create Format: Options window enables you to name the format and determine the type and storage location.

39
Create Format: Define FormatsThe Define formats window enables you to define a list of labels that apply to discrete data values or ranges.

40
Create Format from Data SetUse the Create Format from Data Set task to create a format based on values in an existing data source.

41
User-Defined FormatsUser-defined formatting is a two-step process.
1. Create a format definition.
2. Apply the format to specific column(s).

42
Applying Formats in Tasks (Review)You can apply custom formats in the same places that formats defined in SAS can be used.
43
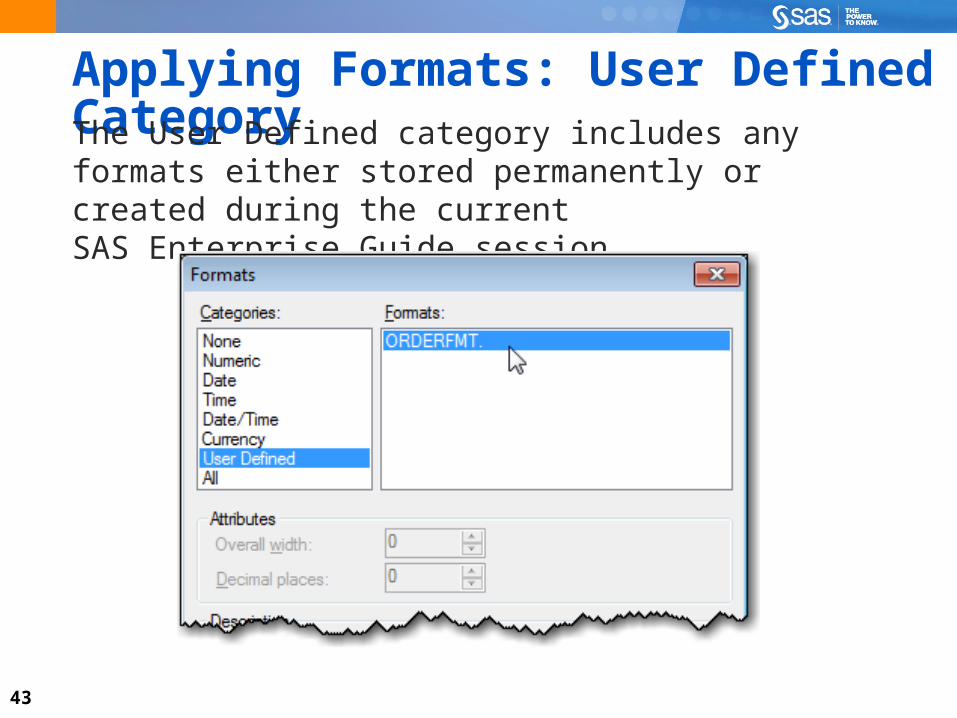
Applying Formats: User Defined CategoryThe User Defined category includes any formats either stored permanently or created during the current SAS Enterprise Guide session.

44
45
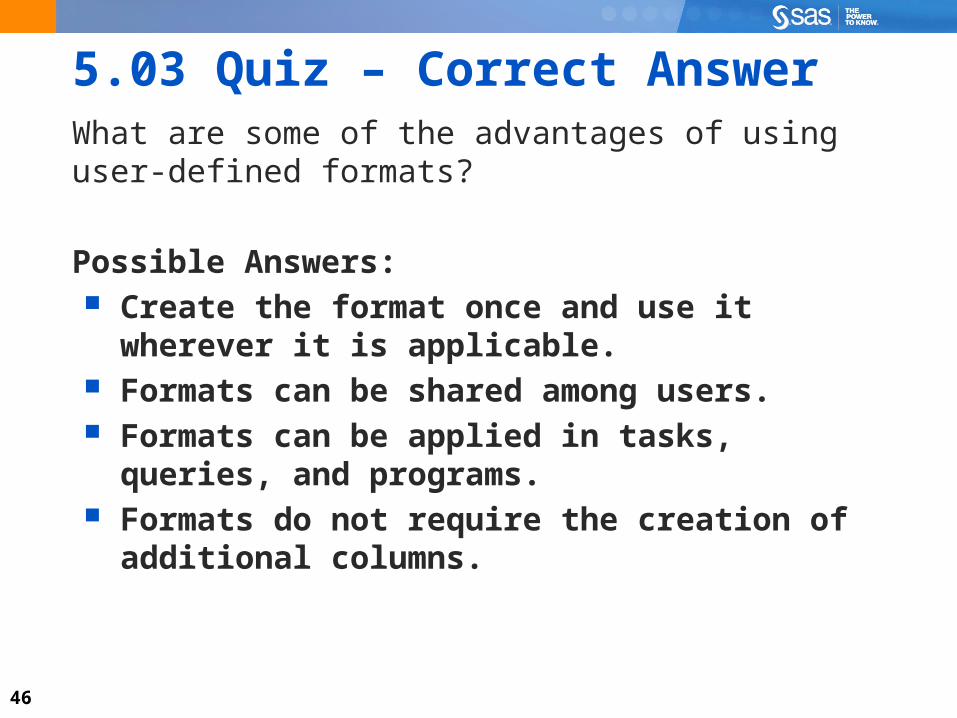
5.03 QuizWhat are some of the advantages of using user-defined formats?
46
5.03 Quiz – Correct AnswerWhat are some of the advantages of using user-defined formats?
Possible Answers: Create the format once and use it wherever it is
applicable. Formats can be shared among users. Formats can be applied in tasks, queries, and
programs. Formats do not require the creation of additional
columns.
47
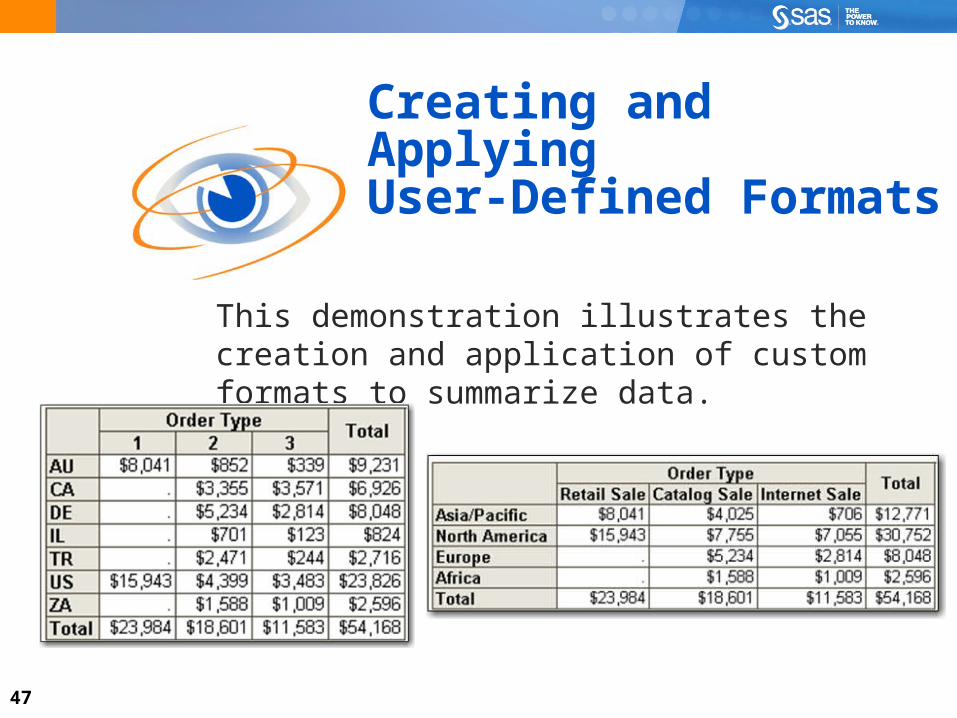
Creating and Applying User-Defined Formats
This demonstration illustrates the creation and application of custom formats to summarize data.

48
49
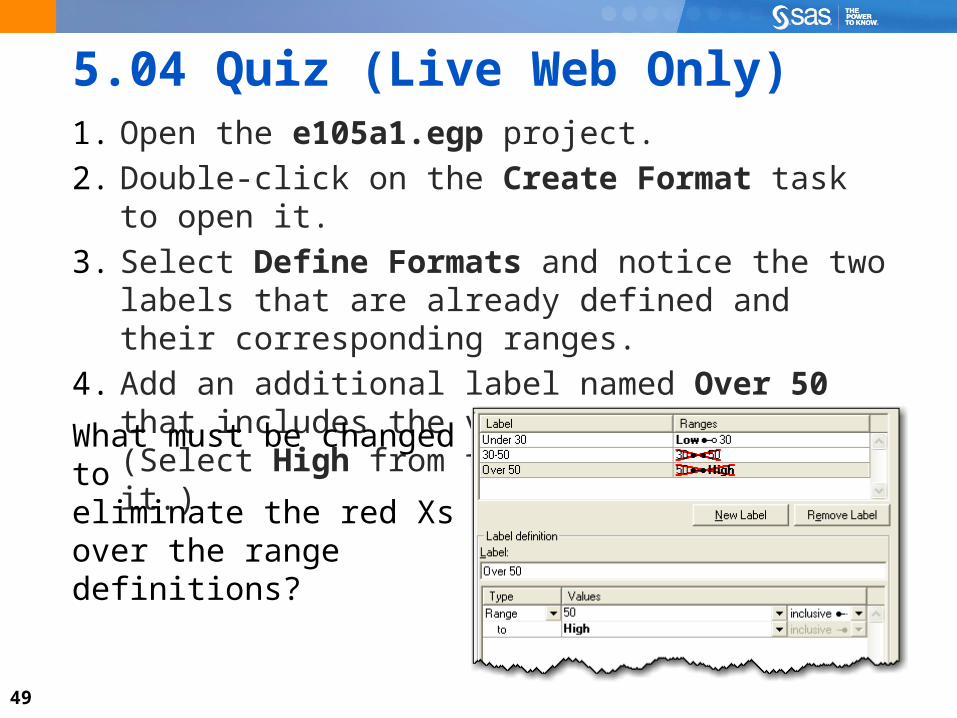
5.04 Quiz (Live Web Only)1. Open the e105a1.egp project.
2. Double-click on the Create Format task to open it.
3. Select Define Formats and notice the two labels that are already defined and their corresponding ranges.
4. Add an additional label named Over 50 that includes the values 50 to High. (Select High from the list; do not type it.)
What must be changed to eliminate the red Xs over the range definitions?

50
5.04 Quiz – Correct Answer1. Open the e105a1.egp project.
2. Double-click on the Create Format task to open it.
3. Select Define Formats and notice the two labels that are already defined and their corresponding ranges.
4. Add an additional label named Over 50 that includes the values 50 to High. (Select High from the list; do not type it.)
What must be changed to eliminate the red Xs over the range definitions?
Change inclusive toexclusive so ranges donot overlap.

51
52
Exercise
This exercise reinforces the concepts discussed previously.

53

54
Chapter Review1. In a wizard, you cannot modify the properties of a
column. What is another consideration for using a wizard versus the task dialog box, if both are available?
2. If the task dialog box offers so much more, then why use the wizard?
55
Chapter Review Answers1. In a wizard, you cannot modify the properties of a
column. What is another consideration for using a wizard versus the task dialog box, if both are available?
2. If the task dialog box offers so much more, then why use the wizard?
The wizard does not have all the options/choices that are available in the task dialog box.
The wizard interface provides selections that can quickly generate a result, often with all the choices you need. If you do need additional options, then you can convert the wizard to Advanced View.

56
Chapter Review3. In the Summary Statistics task, the analysis variable
must be a numeric variable. What type of variable is usually used in the Classification role?
4. Is a format only available in the project that defined it?
57
Chapter Review Answers3. In the Summary Statistics task, the analysis variable
must be a numeric variable. What type of variable is usually used in the Classification role?
4. Is a format only available in the project that defined it?
A categorical variable is used in the Classification role. This is usually a character column such as State or Zip Code. It can be a numeric column such as Year, storing a four-digit year value, or Day_of_Week, storing the values 1 through 7, representing the different weekdays.
No, a format, if stored in a permanent location, is available to different projects, even different SAS Enterprise Guide users.

58
Chapter Review5. When you create a character format, are the data
values case sensitive?
6. What are the three dimensions in a report from the Summary Tables task?

59
Chapter Review Answers5. When you create a character format, are the data
values case sensitive?
6. What are the three dimensions in a report from the Summary Tables task?
Yes, the data values defined in the format must match the case of the stored data value.
The dimensions are Columns, Rows, and Pages.