Embed Size (px)
Citation preview
1
CHAPTER 14: CORPORATE FINANCING DECISIONS AND MARKET EFFICIENCY
Topics:
• 14.1 Differences between investment and financing decisions
• 14.2 What is market efficiency?
• 14.3 Types of market efficiency
• 14.4, 14.6 Empirical evidence
• 14.8 Implications and lessons of market efficiency
2
Background
• Till now you learned how to spend money - the capital budgeting decision - the left-hand side of the balance sheet
• Now you will learn how to raise money i.e. financing the capital expenditures - the right-hand side of the balance sheet
• Hold the firm’s capital budgeting decision constant and determine what is the best financing strategy
3
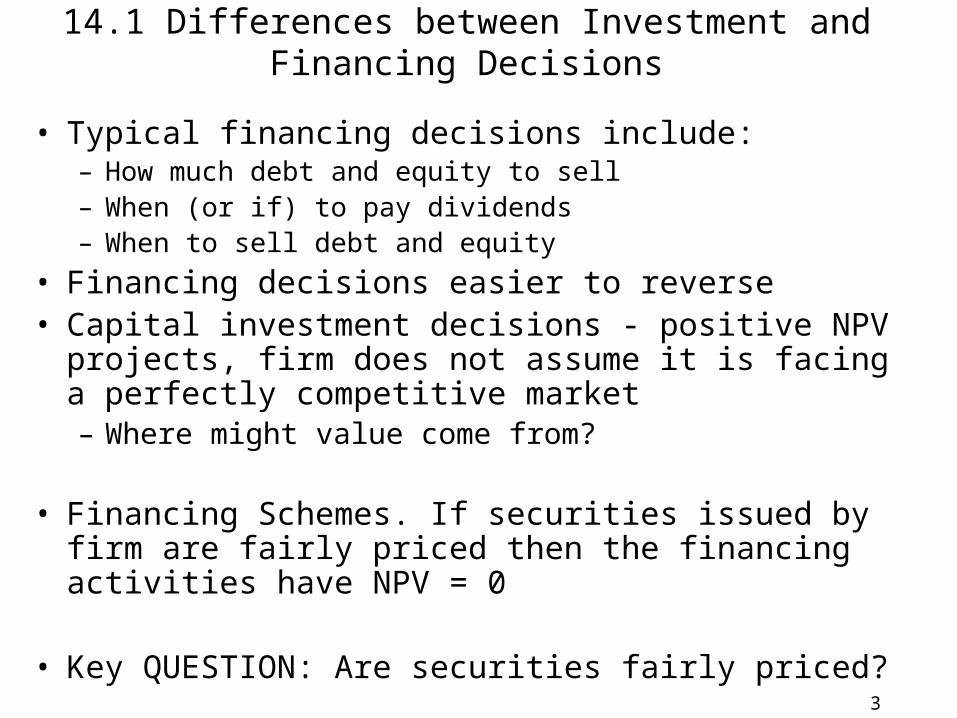
14.1 Differences between Investment and Financing Decisions
• Typical financing decisions include:– How much debt and equity to sell– When (or if) to pay dividends– When to sell debt and equity
• Financing decisions easier to reverse• Capital investment decisions - positive NPV projects, firm
does not assume it is facing a perfectly competitive market– Where might value come from?
• Financing Schemes. If securities issued by firm are fairly priced then the financing activities have NPV = 0
• Key QUESTION: Are securities fairly priced?
4
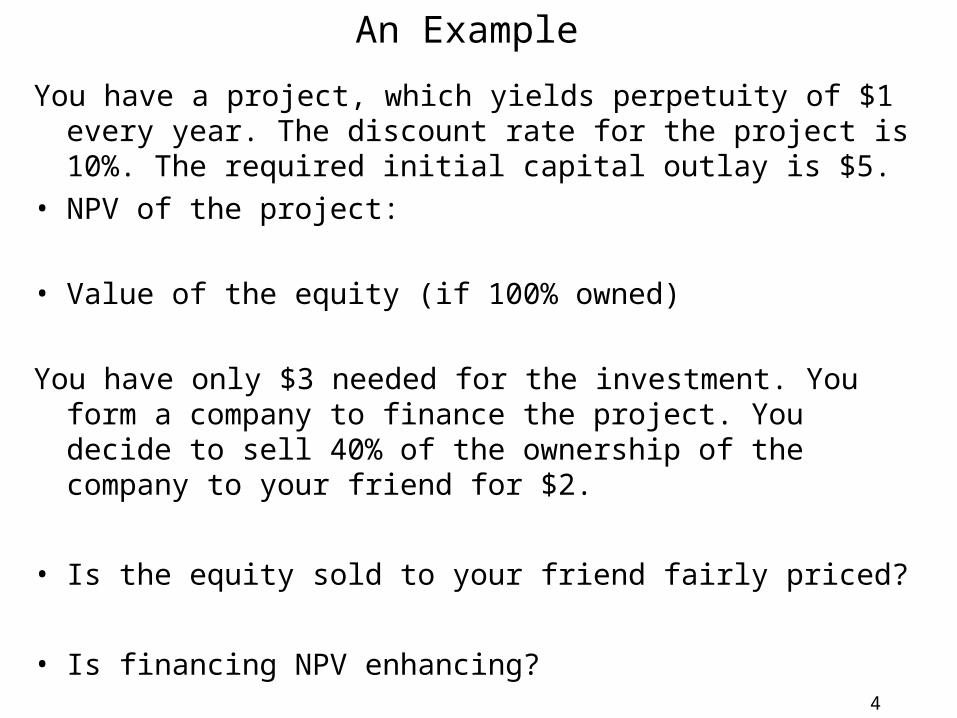
An Example
You have a project, which yields perpetuity of $1 every year. The discount rate for the project is 10%. The required initial capital outlay is $5.
• NPV of the project:
• Value of the equity (if 100% owned)
You have only $3 needed for the investment. You form a company to finance the project. You decide to sell 40% of the ownership of the company to your friend for $2.
• Is the equity sold to your friend fairly priced?
• Is financing NPV enhancing?
5
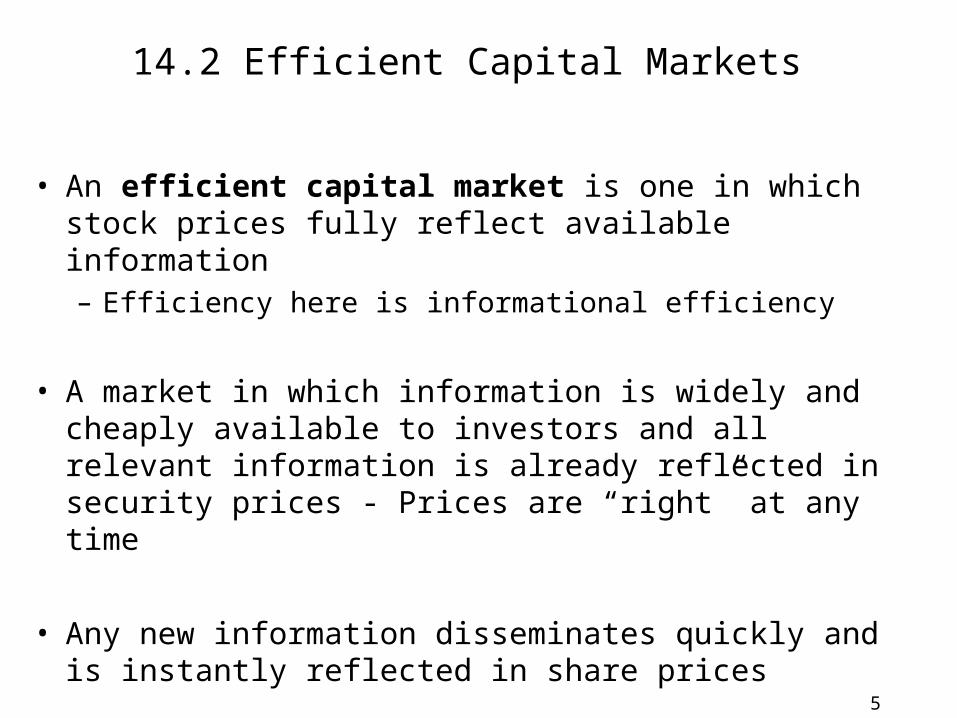
14.2 Efficient Capital Markets
• An efficient capital market is one in which stock prices fully reflect available information– Efficiency here is informational efficiency
• A market in which information is widely and cheaply available to investors and all relevant information is already reflected in security prices - Prices are “right” at any time
• Any new information disseminates quickly and is instantly reflected in share prices
6
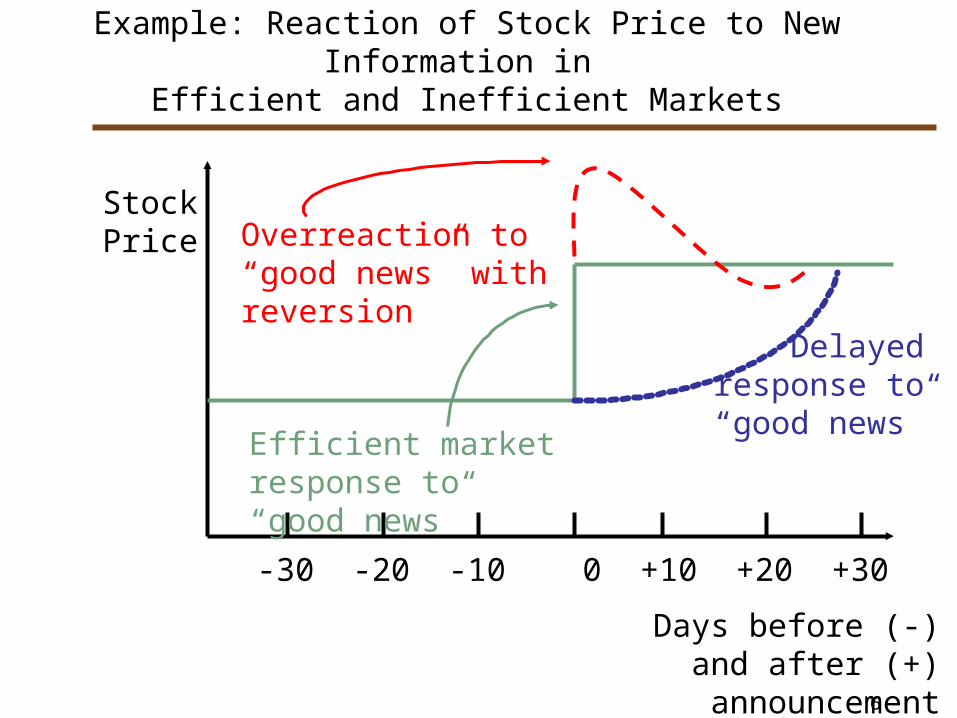
Example: Reaction of Stock Price to New Information in Efficient and Inefficient Markets
Stock Price
-30 -20 -10 0 +10 +20 +30
Days before (-) and after (+)
announcement
Efficient market response to “good news”
Overreaction to “good news” with reversion
Delayed response to
“good news”
7
Implications of the Efficient Market Hypothesis (EMH)
• Investors– Investors may hope for superior returns but all they can rationally expect
in an efficient market is that they shall obtain a return that is just sufficient to compensate them for the time value of money and for the risks they bear
• Firms expect fair value for securities they sell
• In the words of press:– …. Because prices are “efficient” - they reflect all available facts. Future
prices differ from current prices only if buyers or sellers get new information. This by definition, is random. But why should prices be efficient? Put simply, if they are not, it means the market is ignoring price-sensitive information. But this gives whoever has that information a chance to make big profits by trading on it. As soon as he does so, the overlooked information is incorporated in the price. This will make it “efficient”.
-The Economist, December 5, 1992
8
14.3 Different Levels of Efficiency
• Weak form of market efficiency – Stock prices fully reflect all information contained in past
prices and volume
– Stock price movements are independent of what happened in the past
• Semi-strong form of market efficiency – Stock prices fully reflect all publicly available information
– Publicly available information includes historic prices and published accounting statements
• Strong form of market efficiency – Stock prices fully reflect all information, public or private
9
Weak Form Efficiency & Random walk
• Debate on market efficiency began with the discovery that stock prices seem to follow a random walk (Maurice Kendall, 1953)
• What does random walk mean?
• If stock prices follow eqn. (14.1) they are said to follow a random walk
Pt = Pt-1 + expected return + et (random error)
E(Pt) = Pt-1 + expected return
10
Stoc
k Pr
ice
Time
Sell
Sell
Buy
Buy
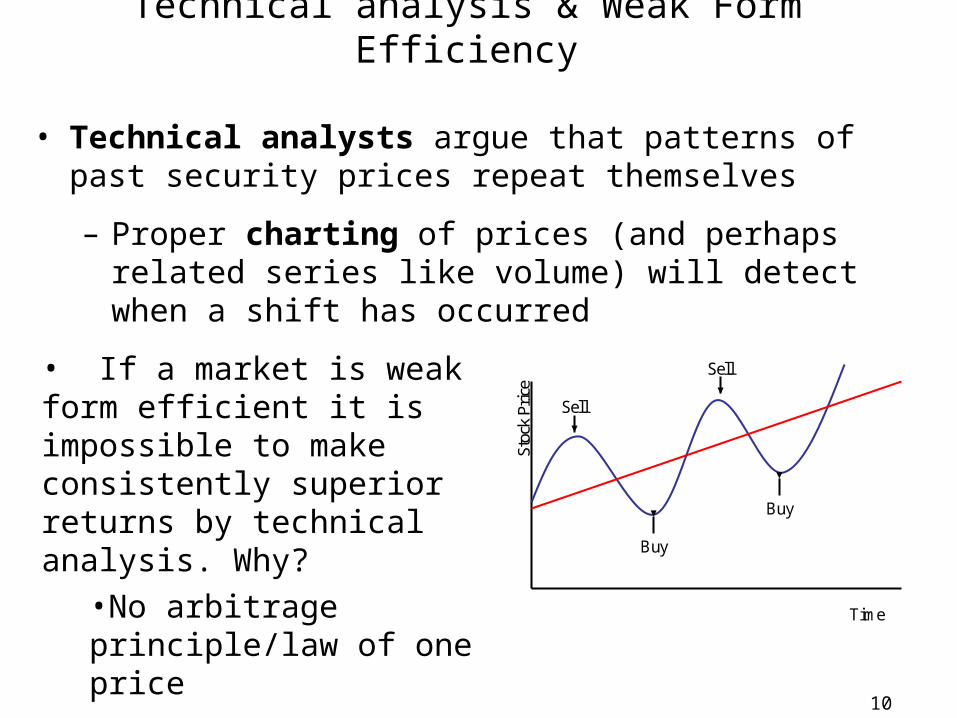
Technical analysis & Weak Form Efficiency
• Technical analysts argue that patterns of past security prices repeat themselves
– Proper charting of prices (and perhaps related series like volume) will detect when a shift has occurred
• If a market is weak form efficient it is impossible to make consistently superior returns by technical analysis. Why?
•No arbitrage principle/law of one price
11
Semi-strong Form Efficiency & Fundamental analysis
• Prices incorporate all publicly available information contained in accounting statements and in past stock prices, stock returns and trading volume
• Fundamental analysts study firm/industry fundamentals and try to judge whether a stock is under- or over-valued
• If a market is semi-strong form efficient – It is impossible to make consistently superior returns by
fundamental analysis
– Markets and stock prices react exceptionally fast to the release of information i.e. profit opportunities disappear fairly quickly before they become publicly known.
12
Strong Form Efficiency
• Prices incorporate all information, public or private– Anything pertinent to the stock and known to at least one
investor is already incorporated into the security’s price.
• If a market is strong form efficient it is impossible to make consistently superior returns from insider information
13
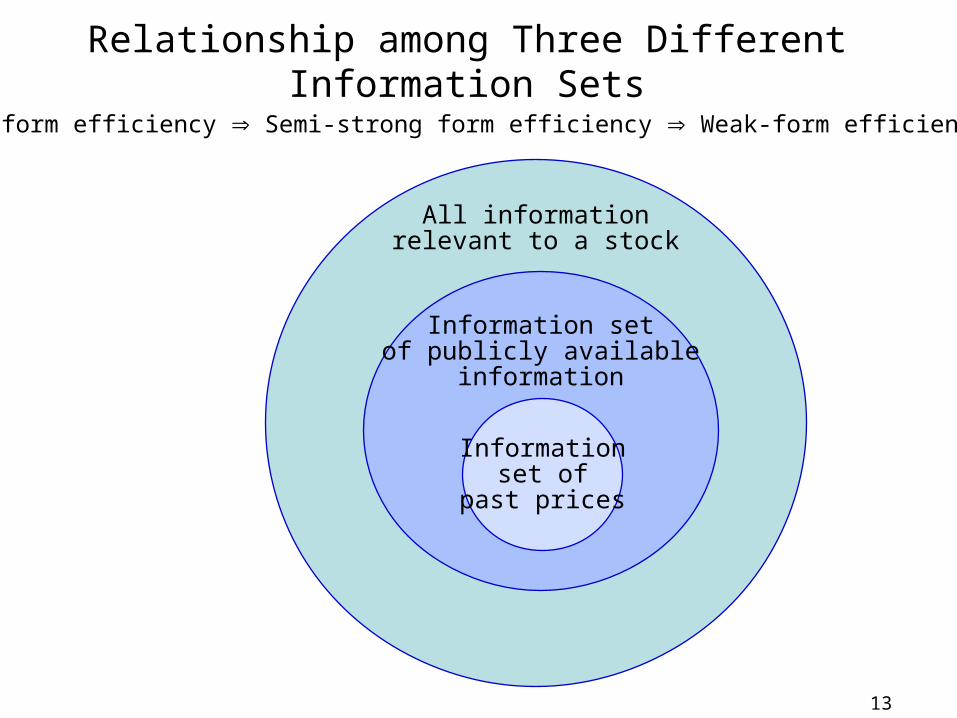
Relationship among Three Different Information Sets
All informationrelevant to a stock
Information setof publicly available
information
Informationset of
past prices
Strong-form efficiency Semi-strong form efficiency Weak-form efficiency
14
Some misconceptions about EMH
• Investors can throw darts to select stocks.
• Prices are random or uncaused.– Prices reflect information.
– The price CHANGE is driven by new information, which by definition arrives randomly.
15
14.4 Empirical Evidence for EMH
• there is an enormous amount of evidence about market efficiency, and it is mostly (but definitely not always) consistent with efficiency
• in general, there are three broad categories of tests:– correlation tests—are price changes random? Are there
profitable trading rules?– event studies—does the market react quickly and efficiently to
new information?– performance of mutual fund managers
• the first one above relates to weak form efficiency, the second and third to semi-strong
• it is hard to test strong form, but what evidence there is• suggests that it does not hold (insider trading is profitable)
1632
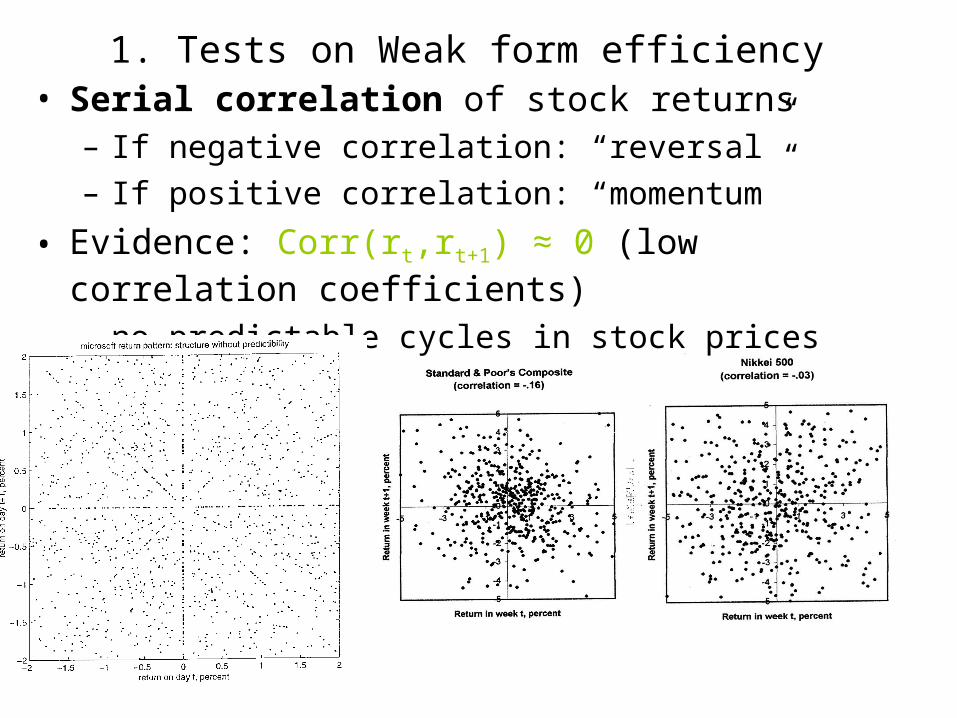
1. Tests on Weak form efficiency• Serial correlation of stock returns
– If negative correlation: “reversal”
– If positive correlation: “momentum”
• Evidence: Corr(rt,rt+1) ≈ 0 (low correlation coefficients)
– no predictable cycles in stock prices
17
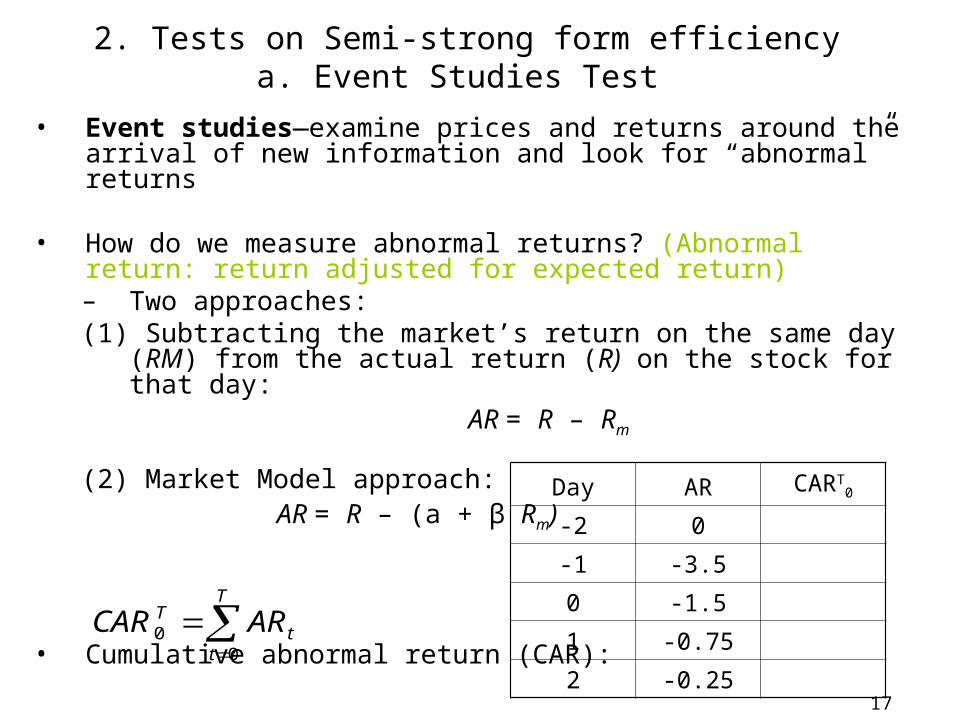
2. Tests on Semi-strong form efficiencya. Event Studies Test
• Event studies—examine prices and returns around the arrival of new information and look for “abnormal” returns
• How do we measure abnormal returns? (Abnormal return: return adjusted for expected return)– Two approaches: (1) Subtracting the market’s return on the same day (RM) from the actual
return (R) on the stock for that day:AR = R – Rm
(2) Market Model approach:AR = R – (a + β Rm)
• Cumulative abnormal return (CAR):
T
tt
T ARCAR0
0
Day AR CART0
-2 0
-1 -3.5
0 -1.5
1 -0.75
2 -0.25
18
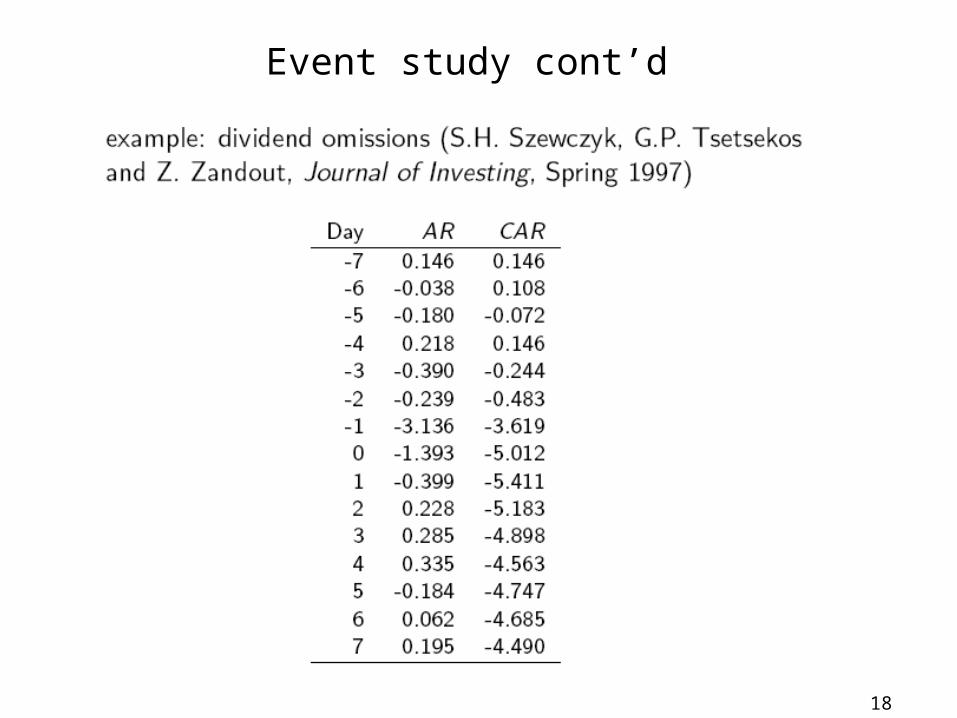
Event study cont’d
19
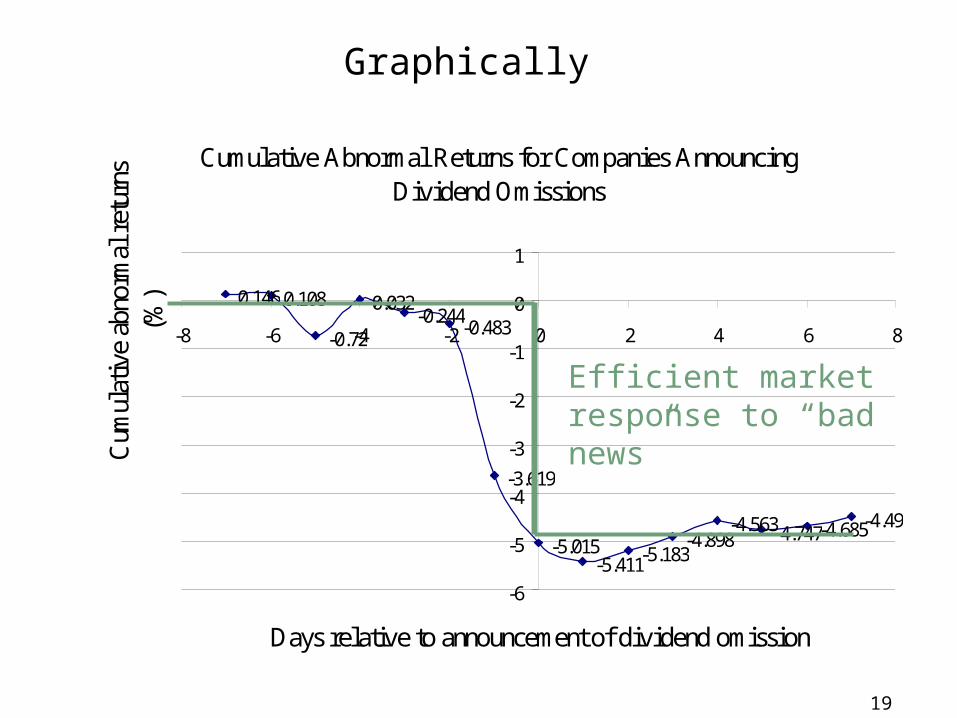
Graphically
Cumulative Abnormal Returns for Companies Announcing Dividend Omissions
0.146 0.108
-0.72
0.032-0.244
-0.483
-3.619
-5.015-5.411-5.183
-4.898-4.563-4.747-4.685-4.49
-6
-5
-4
-3
-2
-1
0
1
-8 -6 -4 -2 0 2 4 6 8
Days relative to announcement of dividend omission
Cum
ulat
ive
abno
rmal
ret
urns
(%
)
Efficient market response to “bad news”
20
Event studies evidence
• Over the years, event study methodology has been applied to a large number of events including:– Dividend increases and decreases
– Earnings announcements
– Mergers
– Capital spending
– New issues of stock
• Most event studies do not conclude that there are profit opportunities.
21
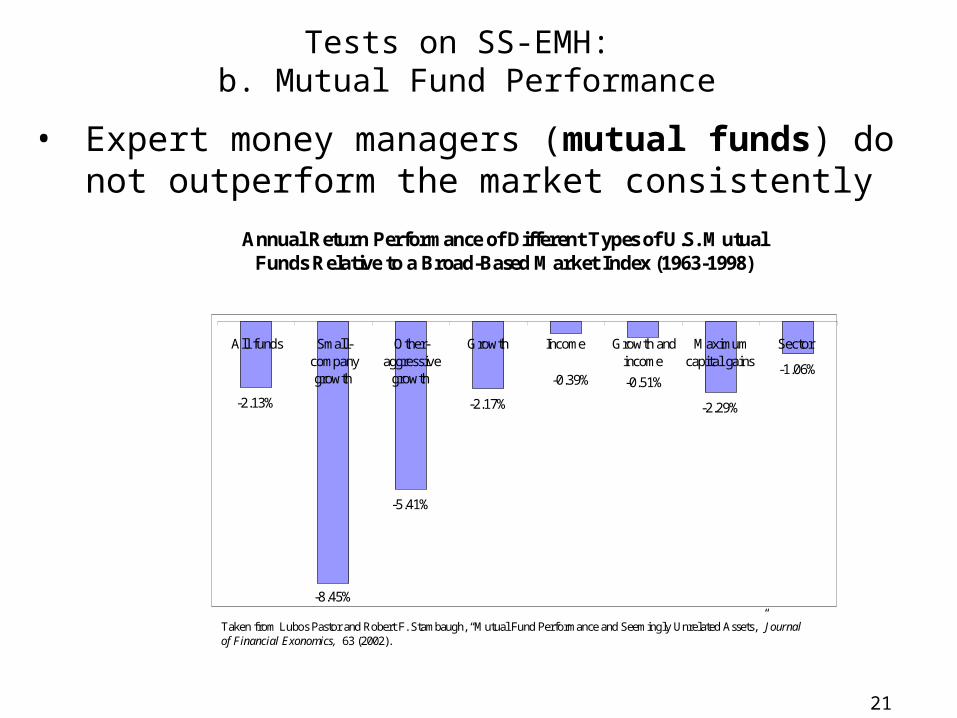
-2.13%
-8.45%
-5.41%
-2.17% -2.29%
-1.06%-0.39% -0.51%
All funds Small-companygrowth
Other-aggressive
growth
Growth Income Growth andincome
Maximumcapital gains
Sector
Annual Return Performance of Different Types of U.S. Mutual Funds Relative to a Broad-Based Market Index (1963-1998)
Taken from Lubos Pastor and Robert F. Stambaugh, “Mutual Fund Performance and Seemingly Unrelated Assets,” Journal of Financial Exonomics, 63 (2002).
Tests on SS-EMH: b. Mutual Fund Performance
• Expert money managers (mutual funds) do not outperform the market consistently
22
3. Tests on Strong form efficiency
• Strong form efficiency does not hold - insider trading profitable
23
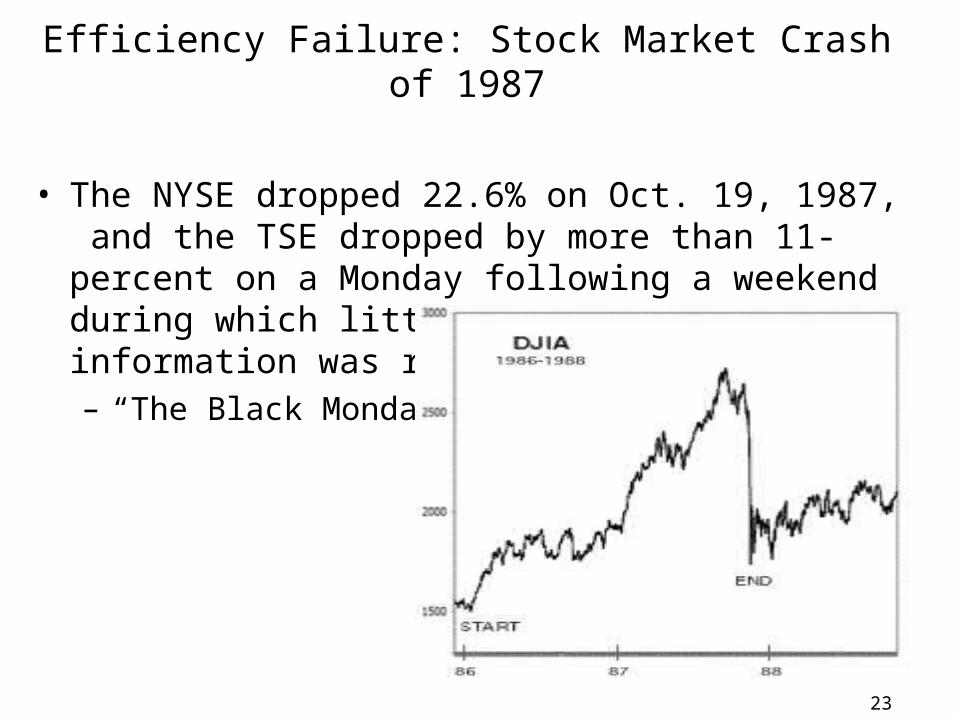
Efficiency Failure: Stock Market Crash of 1987
• The NYSE dropped 22.6% on Oct. 19, 1987, and the TSE dropped by more than 11-percent on a Monday following a weekend during which little surprising information was released.– “The Black Monday”
24
Another Efficiency Failure: 3Com and Palm
• In 1999, when 3Com divested Palm Computing, they retained a 95% stake.
• On Palm’s IPO day, the price per share went from $38 (offer price) to $95.06.– Palm’s market cap was $54.3 billion
– 3Com’s market cap was $28 billion
• Why? – You would like to buy 3Com and sell Palm.
– For an IPO, it is difficult to short-sell.
25
EMH Anomalies (1)
• Pricing anomalies (statistical regularities that occur over long periods of time and are present in the stock markets of different countries - they cannot be explained by existing financial models)– Some continuing positive return after good earnings announcements. (post earnings announcement drift)– Small vs. large stocks
– Value vs. growth (Fig. 14.7)
– January effectmost of the difference between small and large cap performance happens in January
– weekend effect: returns tend to be lower on Mondays, higher on Fridays (no longer true for large cap Cdn stocks), and especially high before trading holidays
26
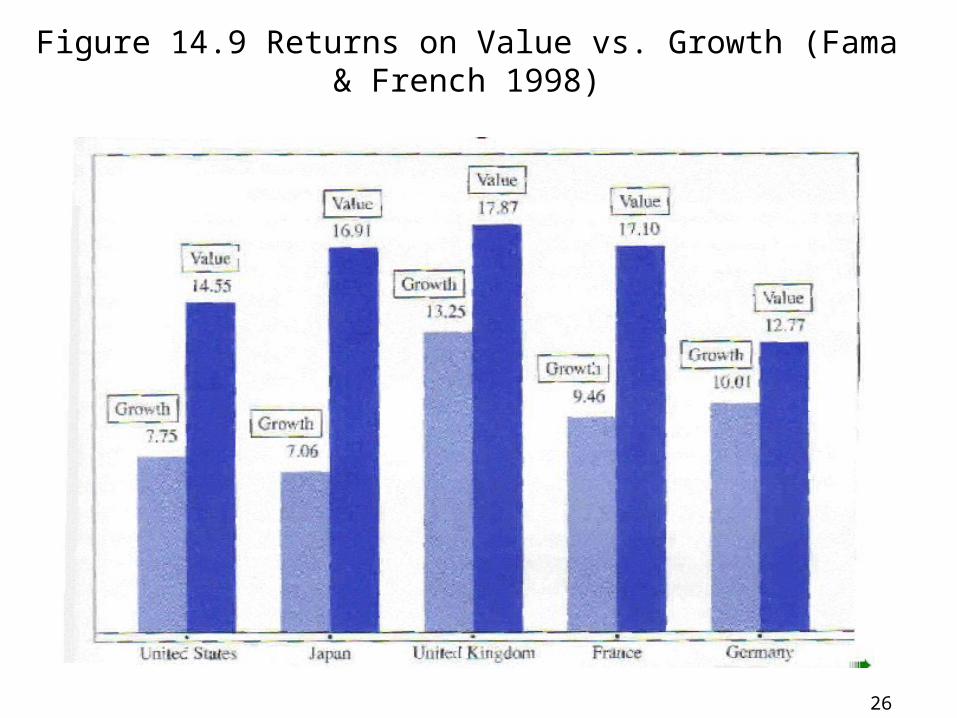
Figure 14.9 Returns on Value vs. Growth (Fama & French 1998)
27
EMH Anomalies (2)
• Momentum and reversal– Price reversal - the most extreme losers (winners) over the
past few years (3 to 5 year period) tend to have strong (low) returns relative to the market during the following years (DeBondt and Thaler)
– Momentum –Over 3 to 12 months returns tend to carry a momentum (Jegadeesh and Titman)
• Recent trends: Behavioral finance– Investors are behavioral. E.g., speculative bubbles. (1987
market crash, 1999-2001 internet bubble)
28
14.5 Implications of EMH for Corporate Finance
• If markets are efficient – prices mean something
• Trust market prices - Prices impound all information about the value of each security -No free lunches on Bay Street
– Markets have no memory - sequence of past price changes contain no information about future changes
– Accounting and efficient markets
– Timing of issuance of securities
29
Review Questions
• Why are markets efficient?
• Assigned Problems # 14.4 - 7, 9, 12, 14, 17-20 (For Q20, the diagram is at the end of the page)
30
Example
• On May 15, 1997, the government of Kuwait offered to sell 170 million BP shares, worth about $2 billion. Goldman Sachs was contacted after the stock market closed in London and given one hour to decide whether to bid on the stock. They decided to offer $11.59 per share, and Kuwait accepted. Then Goldman Sachs started looking for buyers. They lined up 500 institutional and individual investors worldwide and resold all the shares at $11.70. The resale was complete before the London Stock Exchange opened the next morning. Goldman Sachs made $15 million overnight. What does this deal say about market efficiency?
31
Readings: EMH or NOT? The debate goes on…
• See the following WSJ article appearing on the Oct. 18, 2004 issue:– Stock Characters: As Two Economists Debate Markets, The
Tide Shifts; Belief in Efficient Valuation Yields Ground to Role Of Irrational Investors; Mr. Thaler Takes On Mr. Fama
(Article attached in the course website)