Embed Size (px)
Citation preview
1
Chapter 1
Preliminaries
2
1.3
Functions and Their Graphs

3
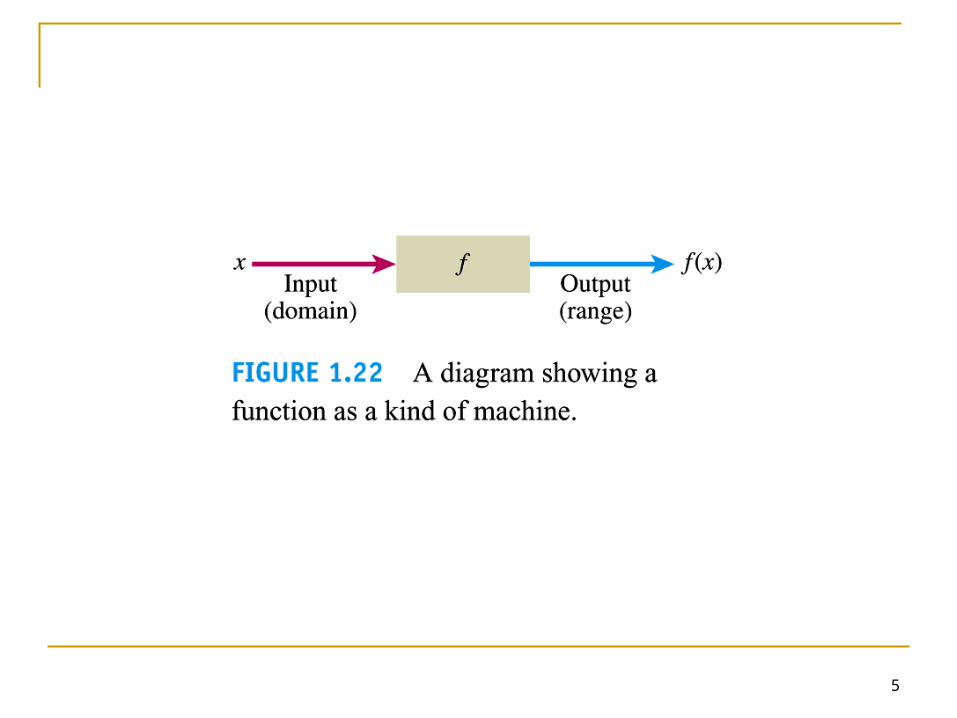
Function
y = f(x) f represents function (a rule that tell us how
to calculate the value of y from the variable x x : independent variable (input of f ) y : dependent variable (the correspoinding
output value of f at x)

4
Definition Domain of the function
The set of D of all possible input values
Definition Range of the function
The set of all values of f(x) as x varies throughout D
5

6
7
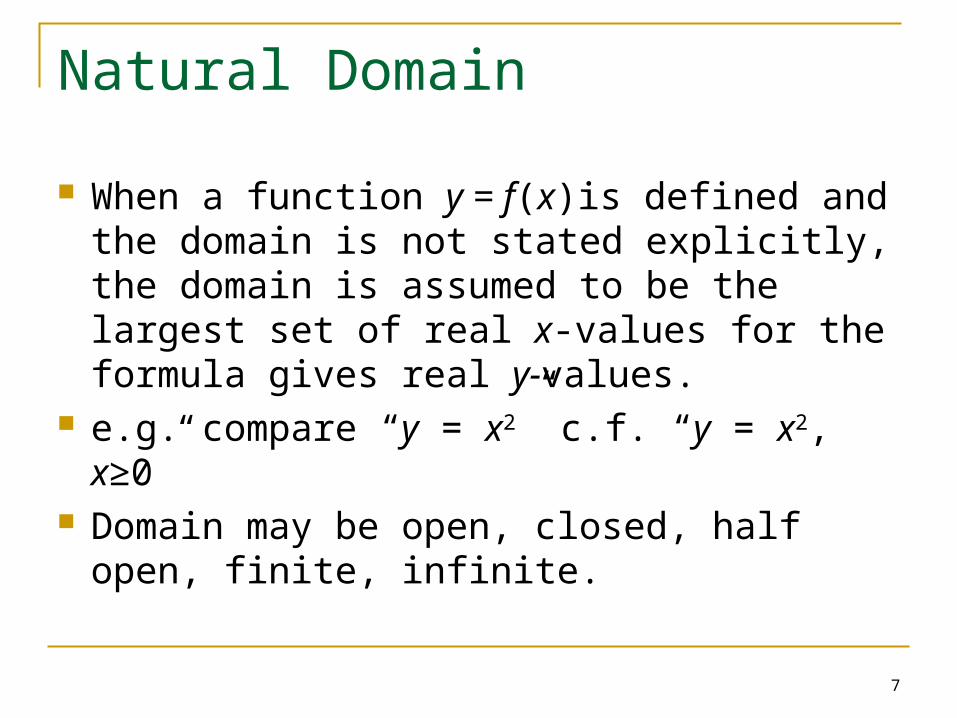
Natural Domain
When a function y = f(x)is defined and the domain is not stated explicitly, the domain is assumed to be the largest set of real x-values for the formula gives real y-values.
e.g. compare “y = x2” c.f. “y = x2, x≥0” Domain may be open, closed, half open,
finite, infinite.
8
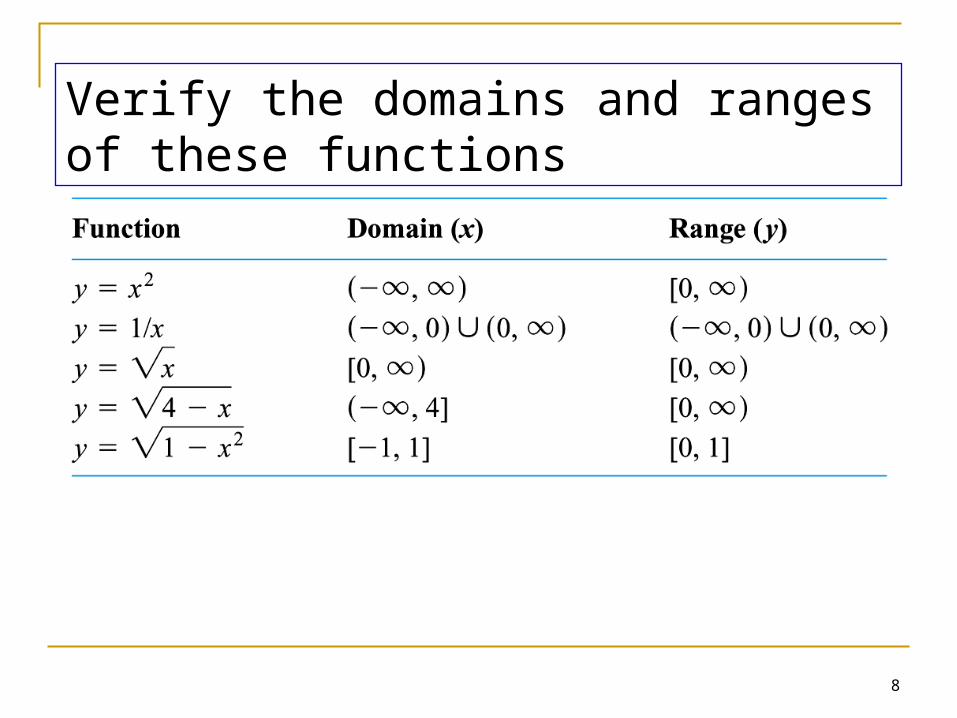
Verify the domains and ranges of these functions
9
Graphs of functions
Graphs provide another way to visualise a function
In set notation, a graph is
{(x,f(x)) | x D} The graph of a function is a useful picture of
its behaviour.

10
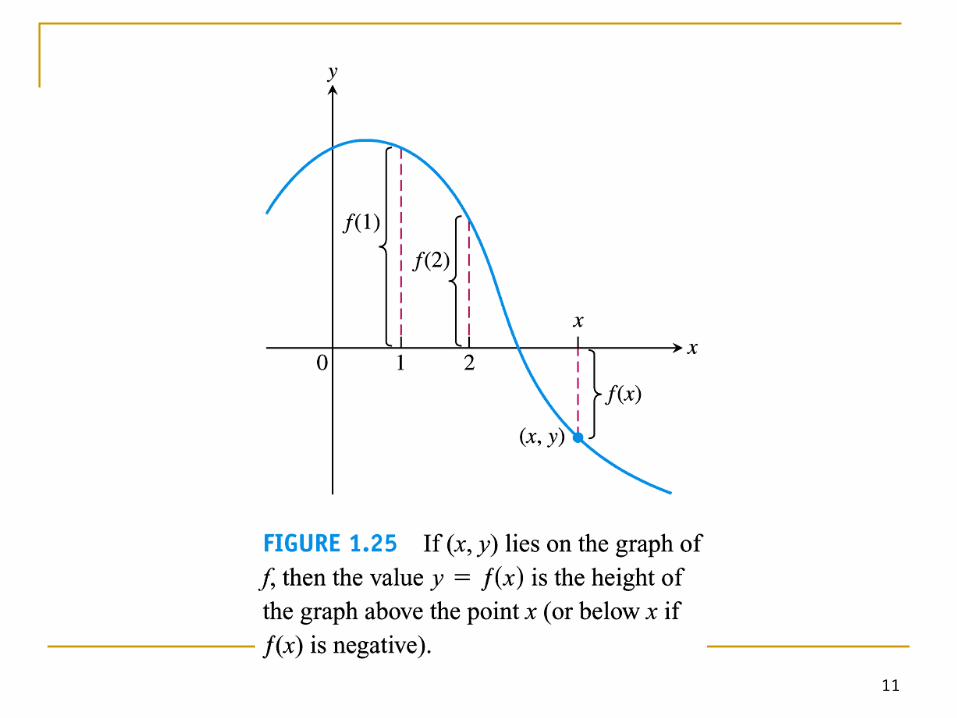
11

12
Example 2 Sketching a graph
Graph the function y = x2 over the interval
[-2,2]
13
The vertical line test
Since a function must be single valued over its domain, no vertical line can intersect the graph of a function more than once.
If a is a point in the domain of a function f, the vertical line x=a can intersect the graph of f in a single point (a, f(a)).

14
15
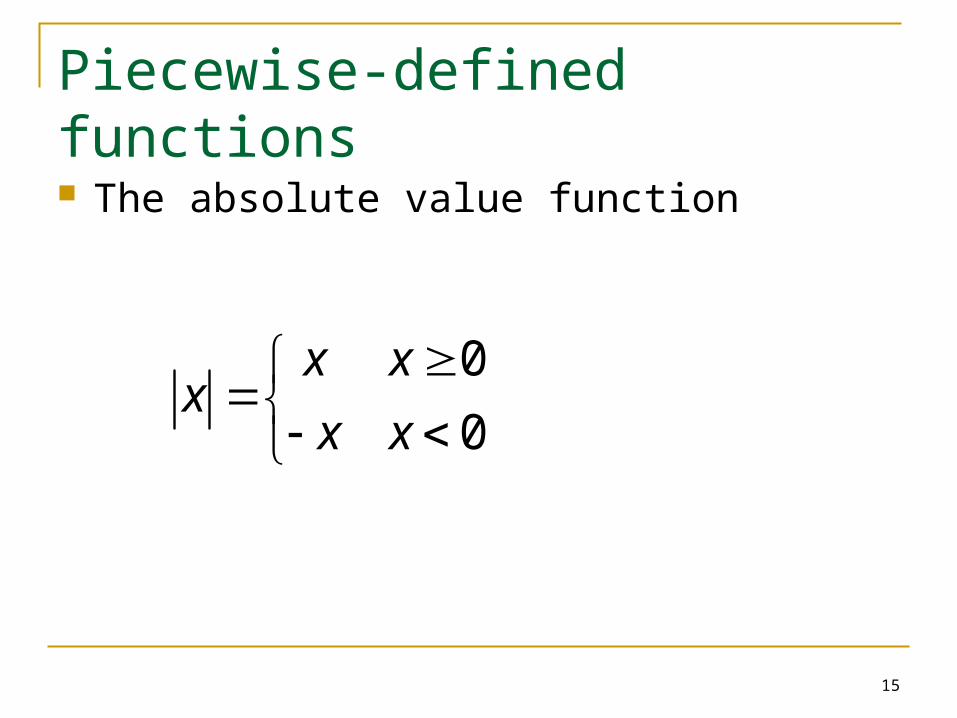
Piecewise-defined functions
The absolute value function
0
0
x xx
x x

16
17
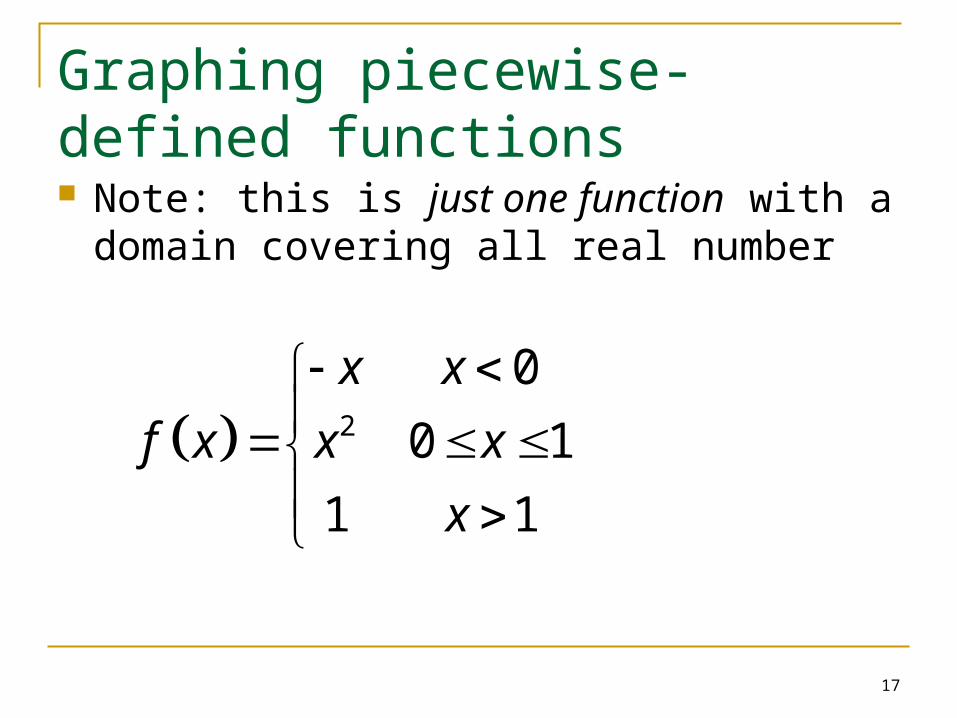
Graphing piecewise-defined functions Note: this is just one function with a domain
covering all real number
2
0
0 1
1 1
x x
f x x x
x

18
19
The greatest integer function
Also called integer floor function f = [x], defined as greatest integer less than
or equal to x. e.g. [2.4] = 2 [2]=2 [-2] = -2, etc.

20
Note: the graph is the blue colour lines, not the one in red
21
Writing formulas for piecewise-defined functions Write a formula for the function y=f(x) in
Figure 1.33

22
23
1.4
Identifying Functions;
Mathematical Models

24
Linear functions
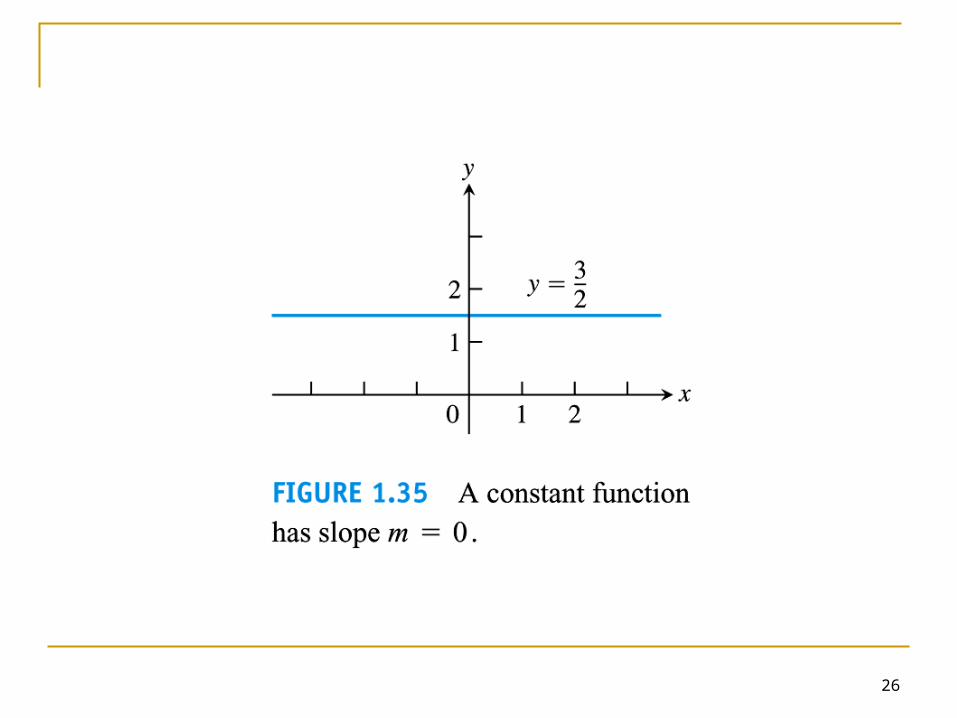
Linear function takes the form of y=mx + b m, b constants m slope of the graph b intersection with the y-axis The linear function reduces to a constant
function f = c when m = 0,

25
26
27
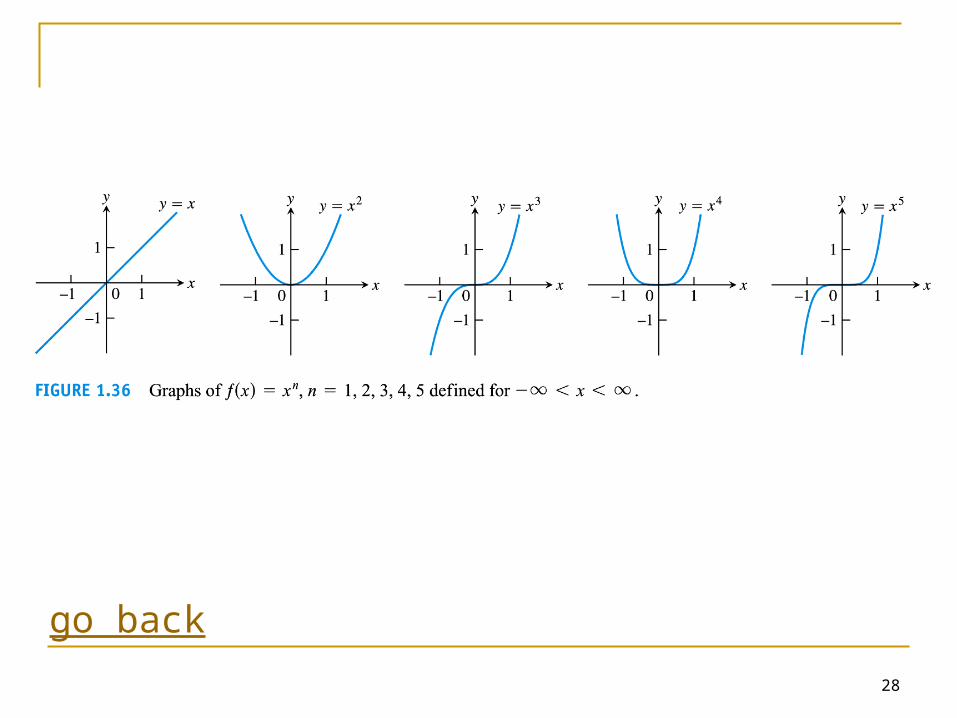
Power functions
f(x) = xa
a constant Case (a): a = n, a positive integer
28
go back

29
Power functions
Case (b): a = -1 (hyperbola) or a=-2
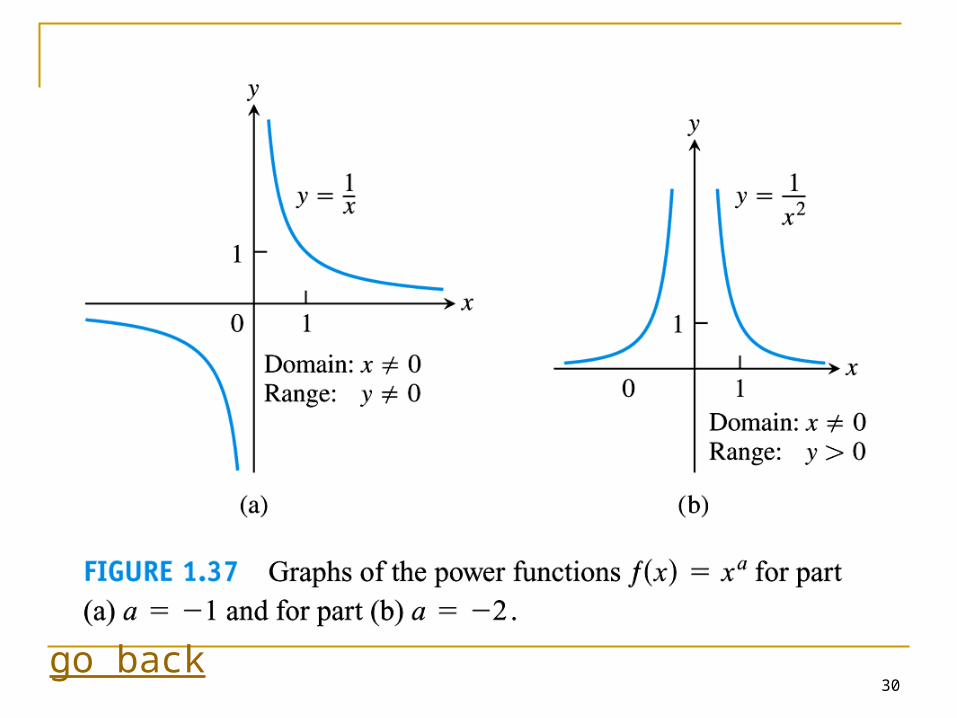
30go back

31
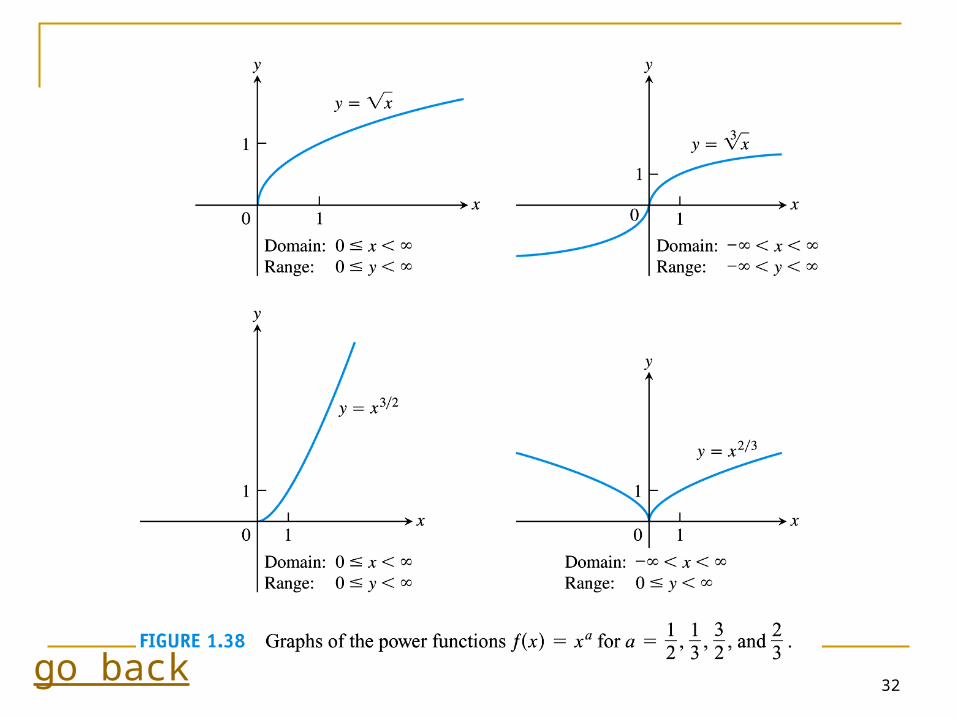
Power functions
Case (c): a = ½, 1/3, 3/2, and 2/3 f(x) = x½ = x (square root) , domain = [0 ≤ x < ∞) g(x) = x1/3 = 3x(cube root), domain = (-∞ < x < ∞)
p(x) = x2/3= (x1/3)2, domain = ? q(x) = x3/2= (x3)1/2 domain = ?
32go back
33
Polynomials
p(x)= anxn + an-1xn-1 + an-2xn-2 + a1x + a0
n nonnegative integer (1,2,3…) a’s coefficients (real constants) If an 0, n is called the degree of the
polynomial
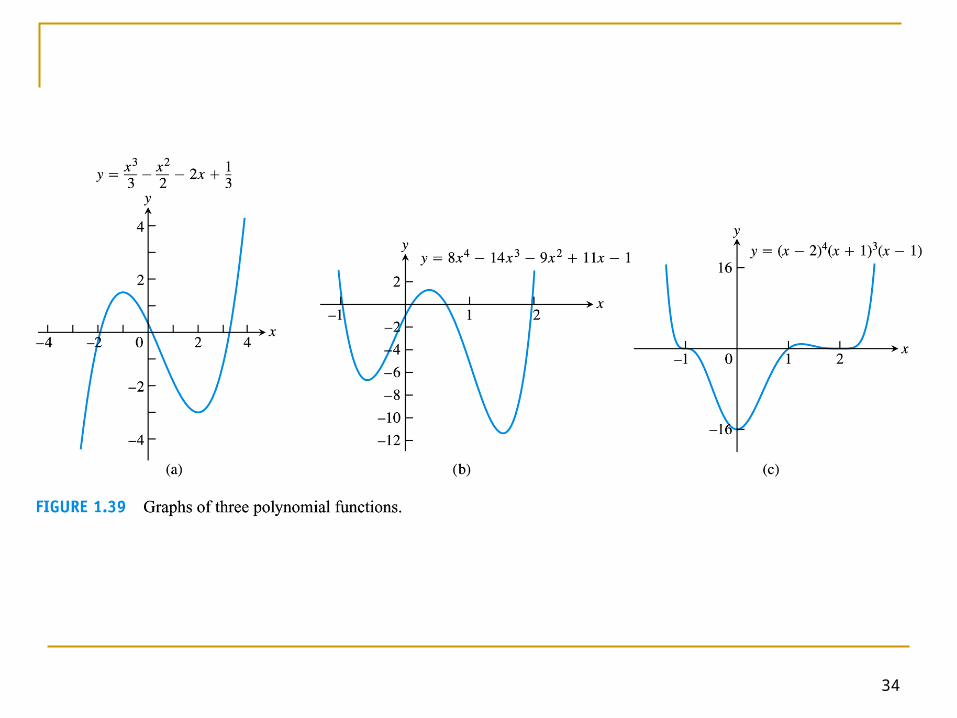
34

35
Rational functions
A rational function is a quotient of two polynomials:
f(x) = p(x) / q(x) p,q are polynomials. Domain of f(x) is the set of all real number x
for which q(x) 0.
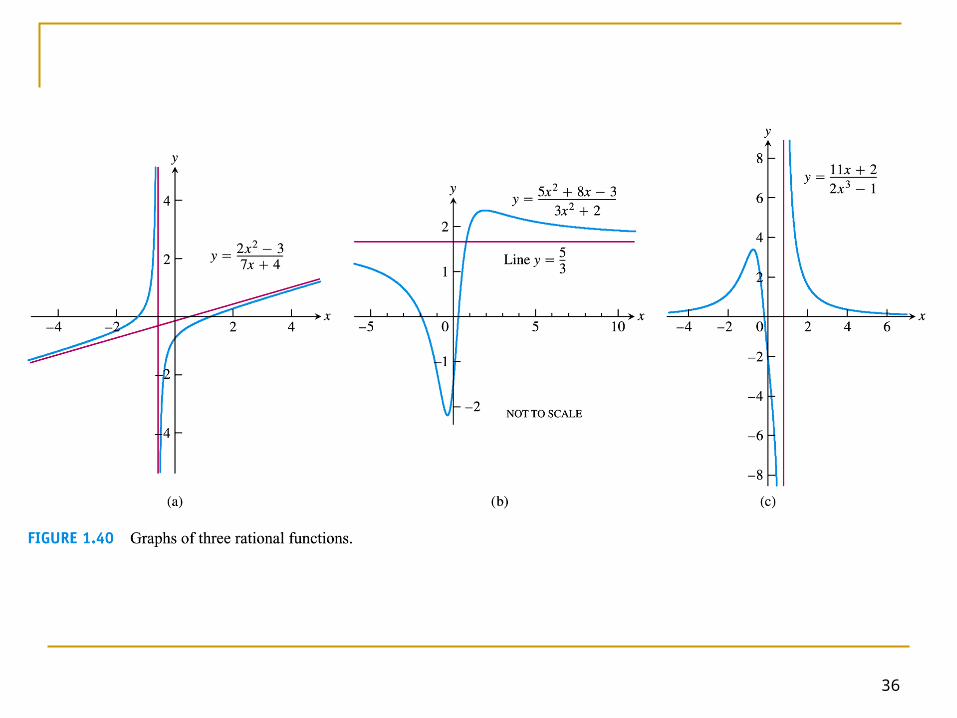
36

37
Algebraic functions
Functions constructed from polynomials using algebraic operations (addition, subtraction, multiplication, division, and taking roots)

38

39
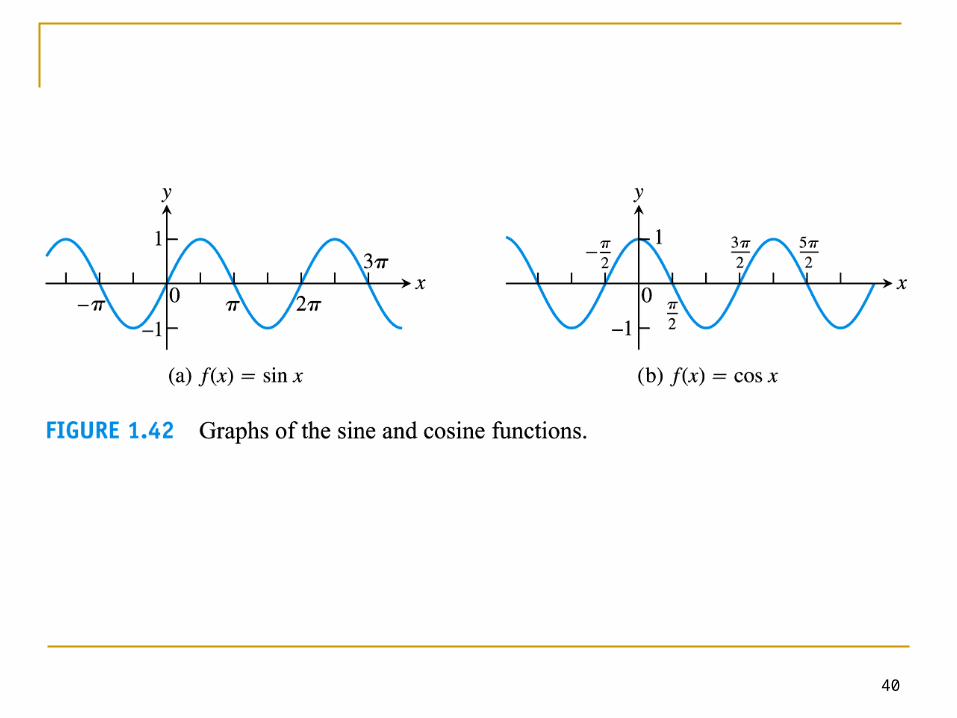
Trigonometric functions
More details in later chapter
40
41
Exponential functions
f(x) = ax
Where a > 0 and a 0. a is called the ‘base’.
Domain (-∞, ∞) Range (0, ∞) Hence, f(x) > 0 More in later chapter
42
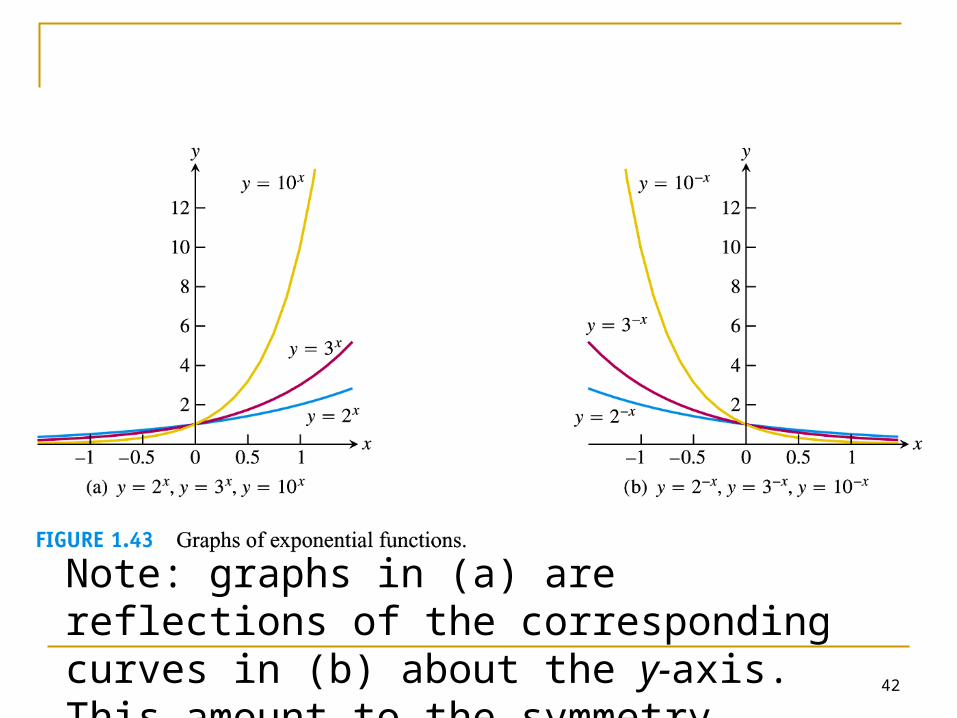
Note: graphs in (a) are reflections of the corresponding curves in (b) about the y-axis. This amount to the symmetry operation of x ↔ -x.
43
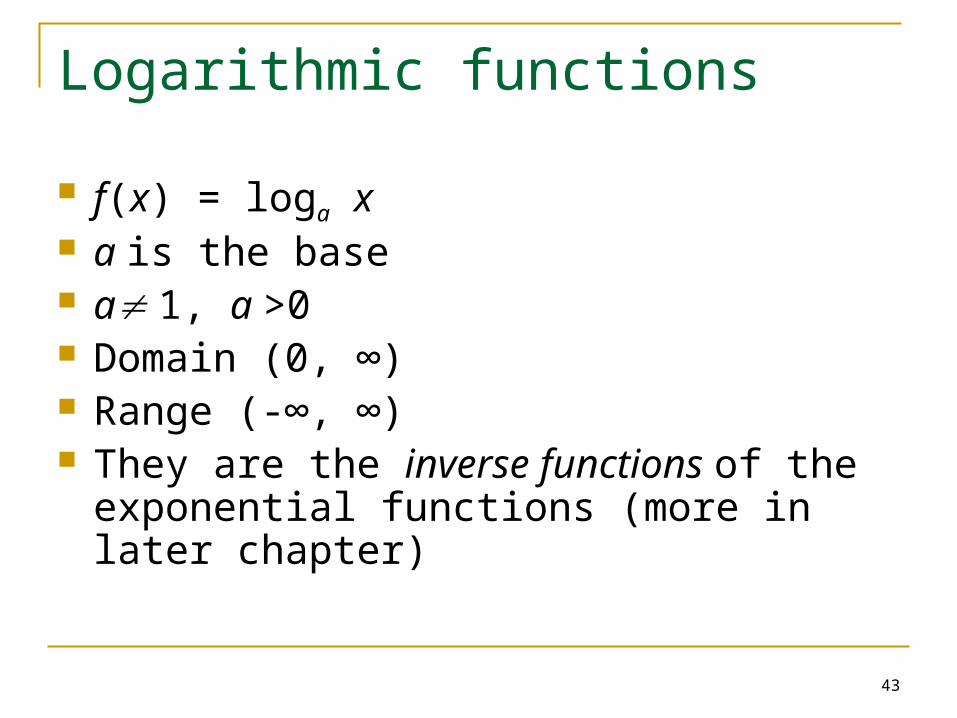
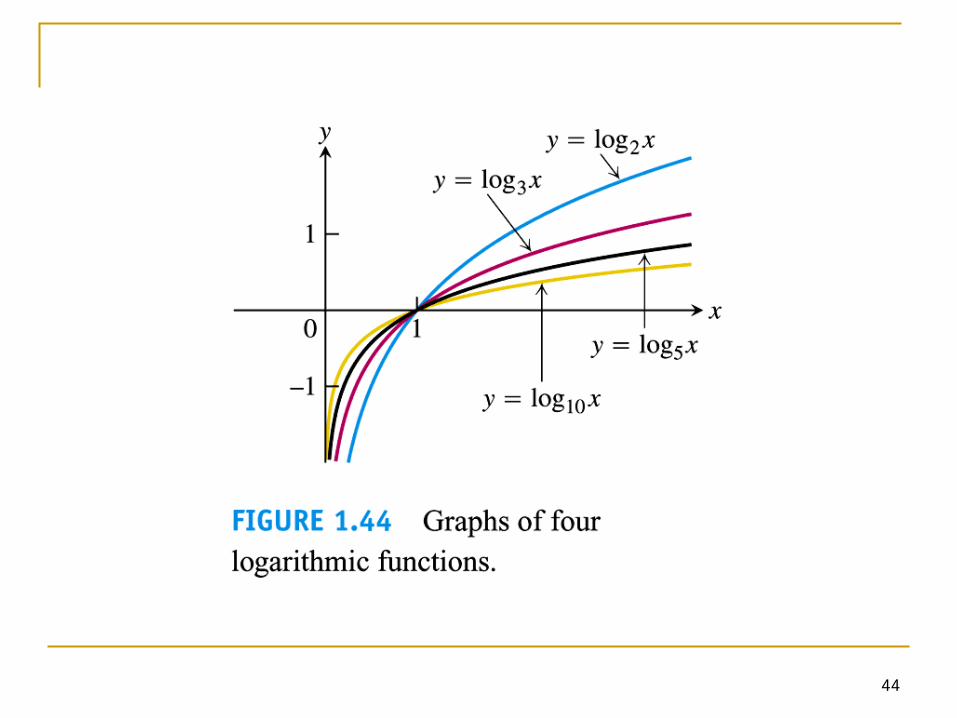
Logarithmic functions
f(x) = loga x a is the base a 1, a >0 Domain (0, ∞) Range (-∞, ∞) They are the inverse functions of the
exponential functions (more in later chapter)
44

45
Transcendental functions
Functions that are not algebraic Include: trigonometric, inverse trigonometric,
exponential, logarithmic, hyperbolic and many other functions
46
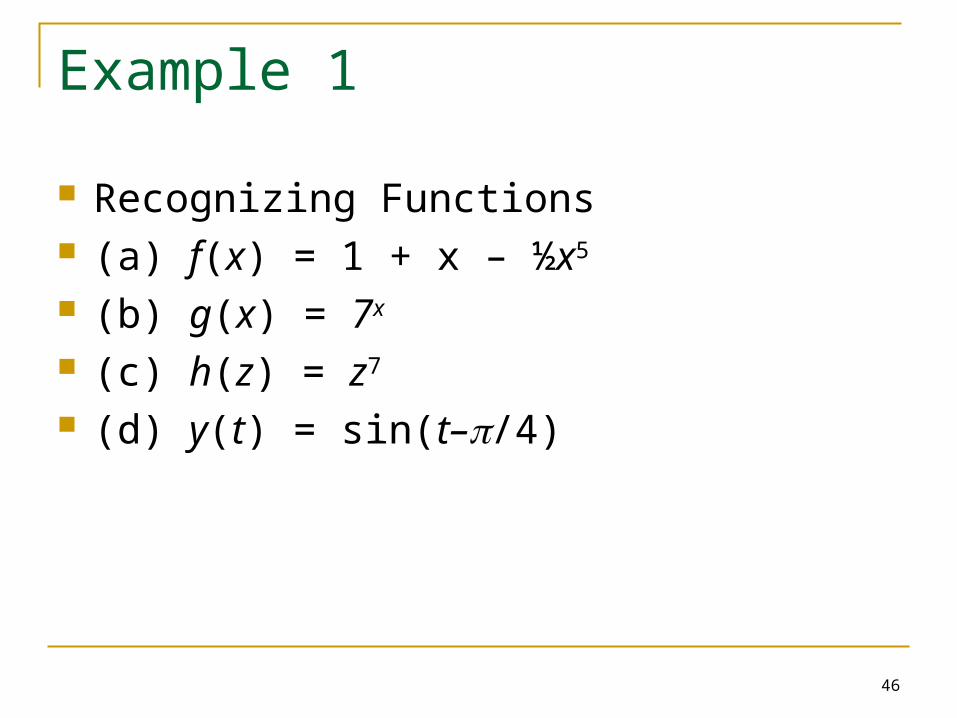
Example 1
Recognizing Functions (a) f(x) = 1 + x – ½x5
(b) g(x) = 7x
(c) h(z) = z7
(d) y(t) = sin(t–/4)
47
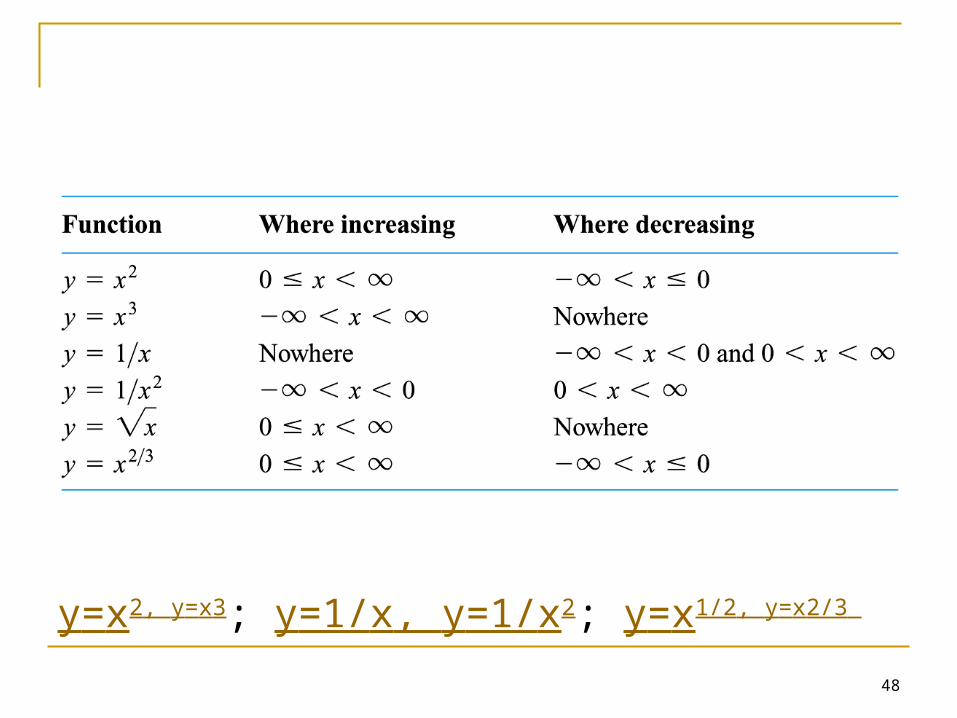
Increasing versus decreasing functions A function is said to be increasing if it rises as
you move from left to right A function is said to be decreasing if it falls as
you move from left to right
48
y=x2, y=x3; y=1/x, y=1/x2; y=x1/2, y=x2/3
49

50
51
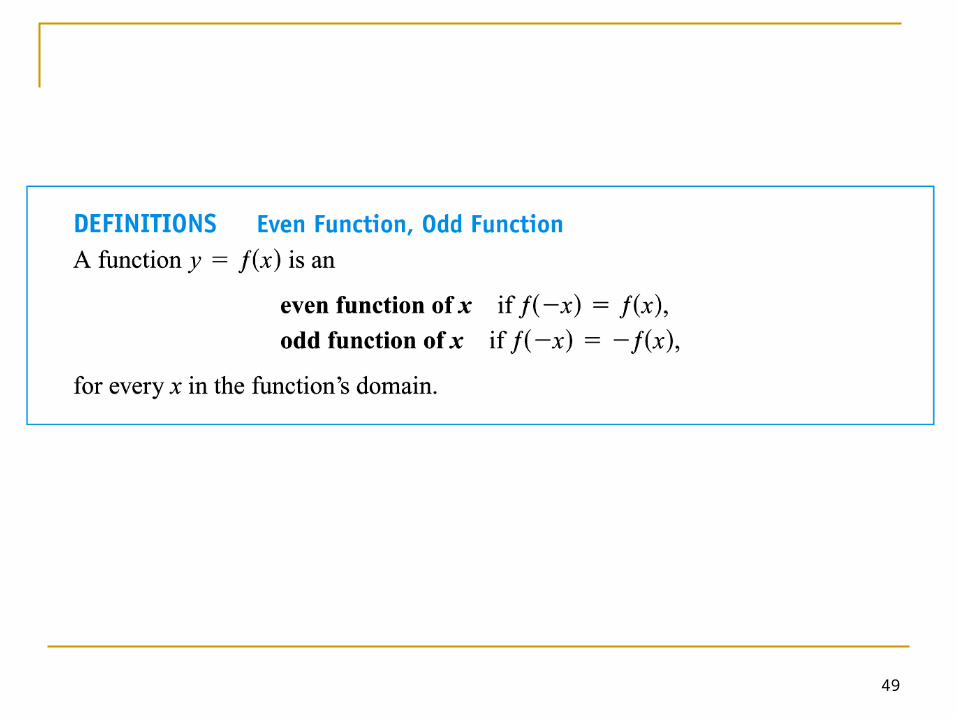
Recognising even and odd functions f(x) = x2 Even function as (-x)2 = x2 for all x,
symmetric about the all x, symmetric about the y-axis.
f(x) = x2 + 1 Even function as (-x)2 + 1 = x2+ 1 for all x, symmetric about the all x, symmetric about the y-axis.
52
Recognising even and odd functions f(x) = x. Odd function as (-x) = -x for all x,
symmetric about origin. f(x) = x+1. Odd function ?
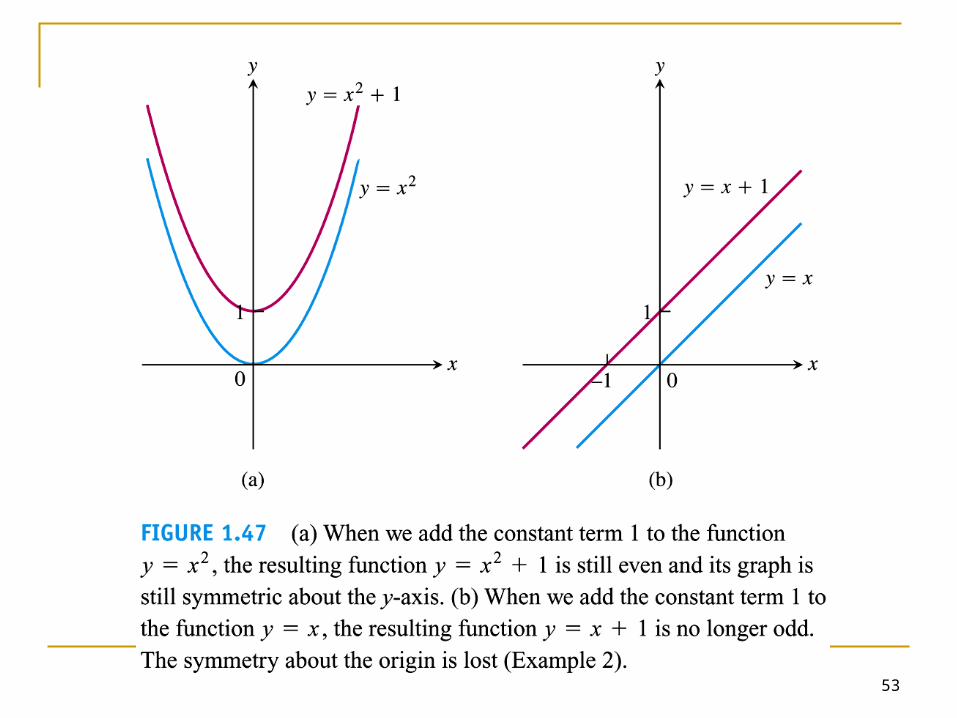
53
54
1.5
Combining Functions;
Shifting and Scaling Graphs
55
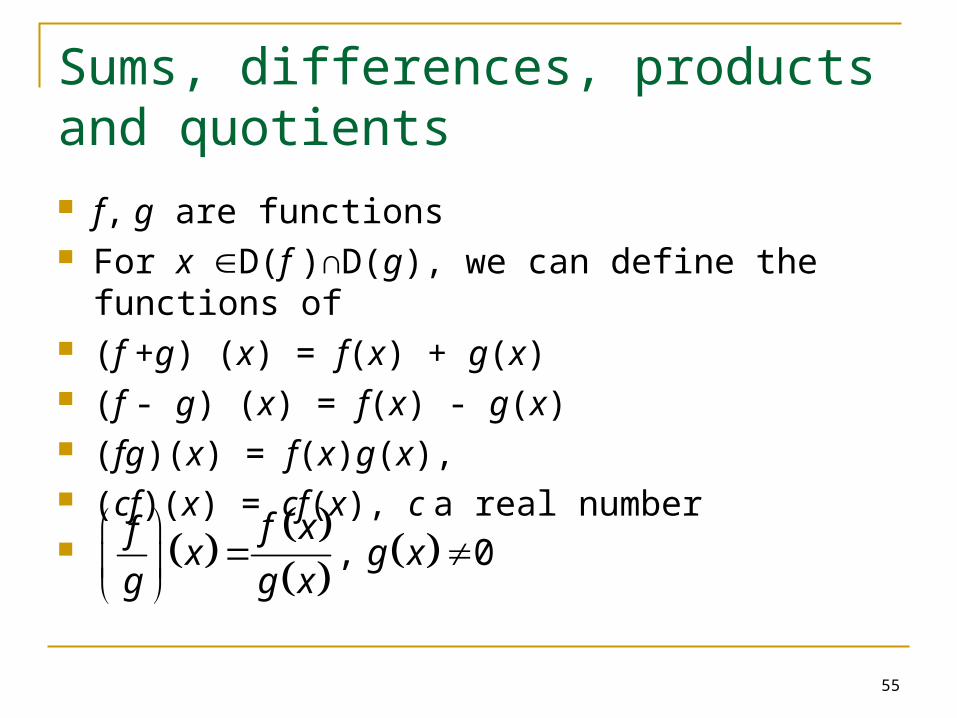
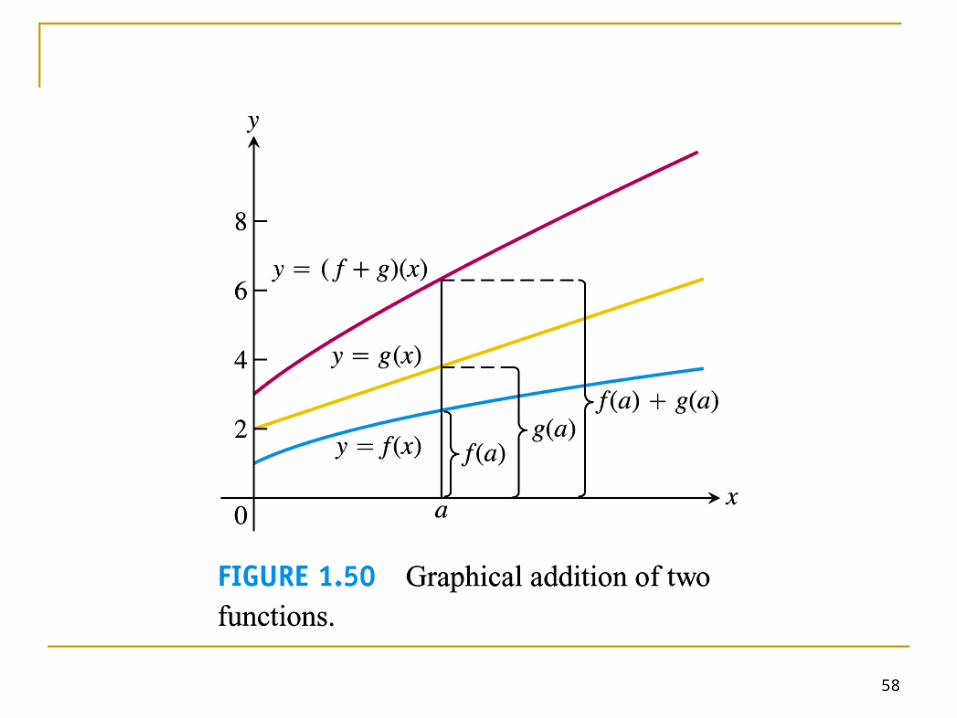
Sums, differences, products and quotients f, g are functions For x D(f )∩D(g), we can define the functions of (f +g) (x) = f(x) + g(x) (f - g) (x) = f(x) - g(x) (fg)(x) = f(x)g(x), (cf)(x) = cf(x), c a real number
, 0
f xfx g x
g g x
56
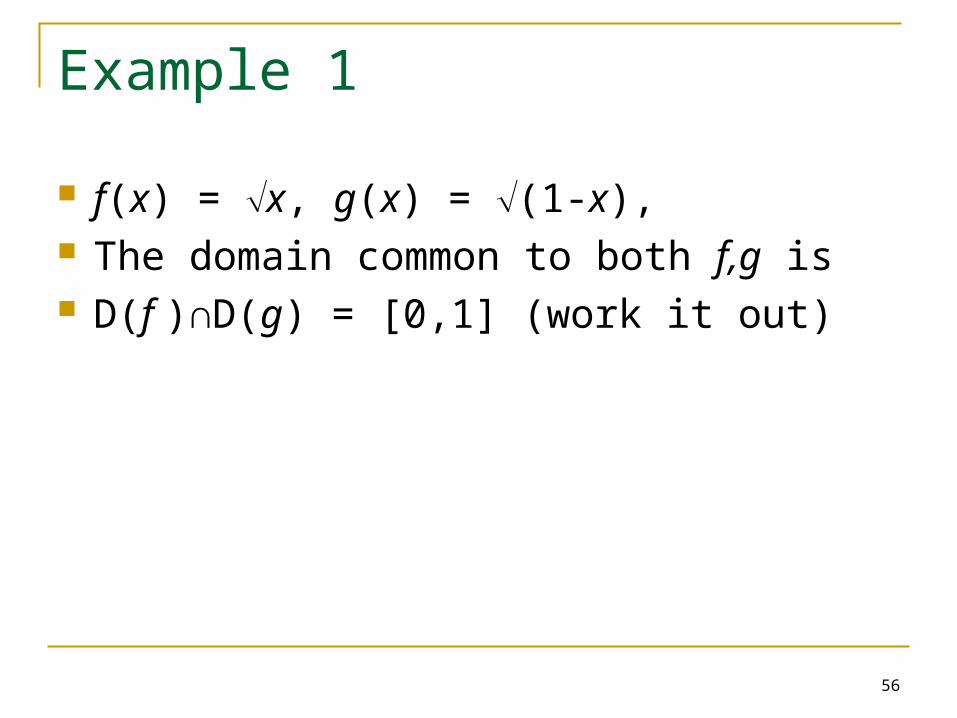
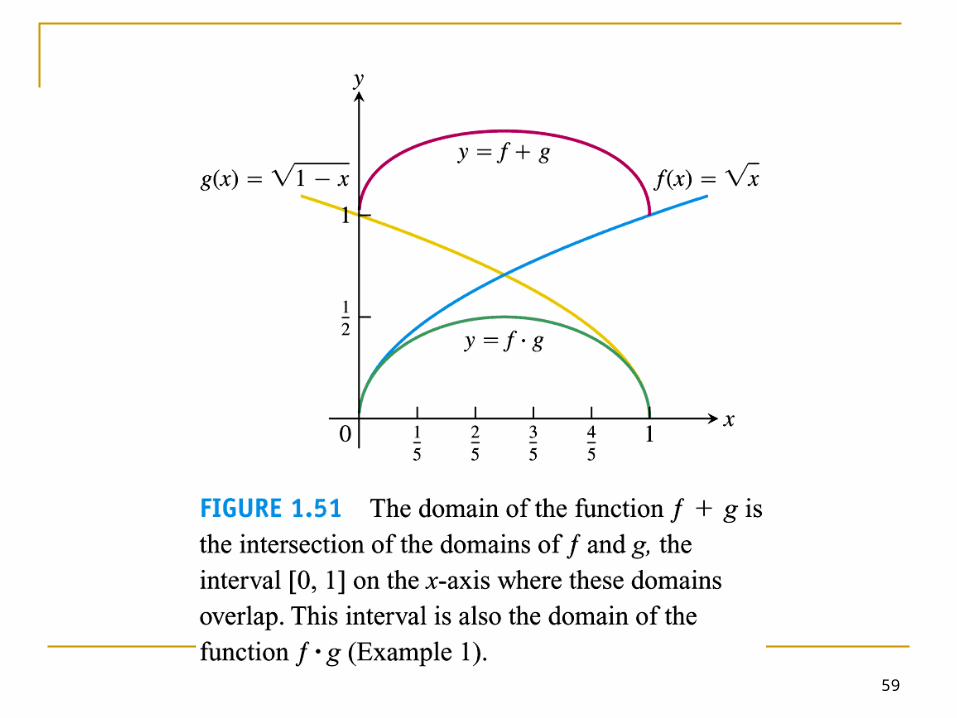
Example 1
f(x) = x, g(x) = (1-x), The domain common to both f,g is D(f )∩D(g) = [0,1] (work it out)

57
58
59
60
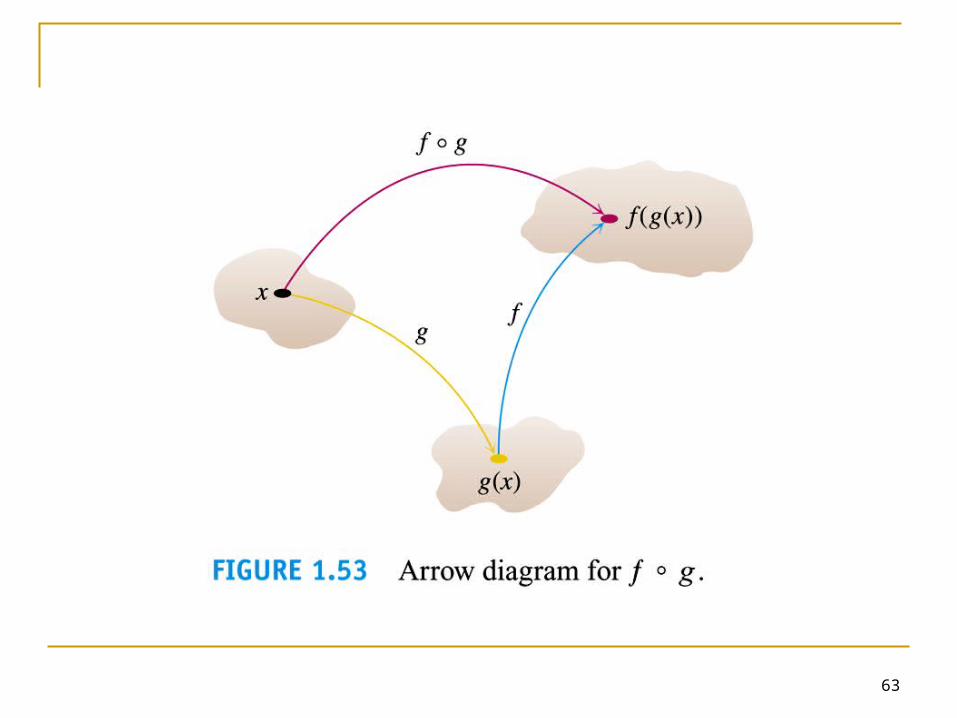
Composite functions
Another way of combining functions

61

62
63
64
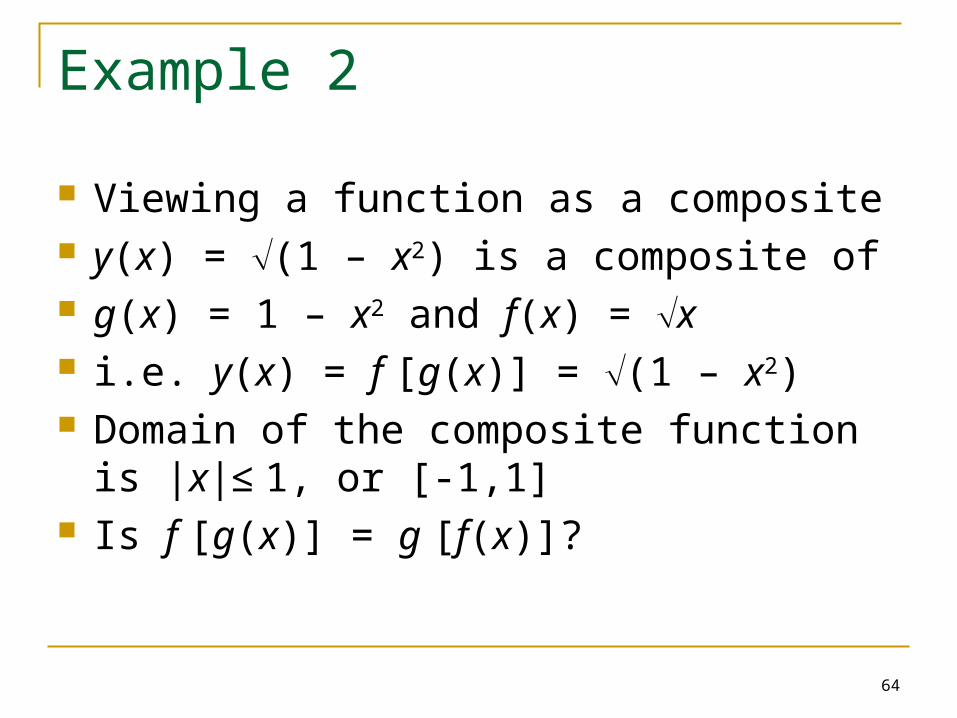
Example 2
Viewing a function as a composite y(x) = (1 – x2) is a composite of g(x) = 1 – x2 and f(x) = x i.e. y(x) = f [g(x)] = (1 – x2) Domain of the composite function is |x|≤ 1, or
[-1,1] Is f [g(x)] = g [f(x)]?
65
Example 3
Read it yourself Make sure that you know how to work out the
domains and ranges of each composite functions listed
66
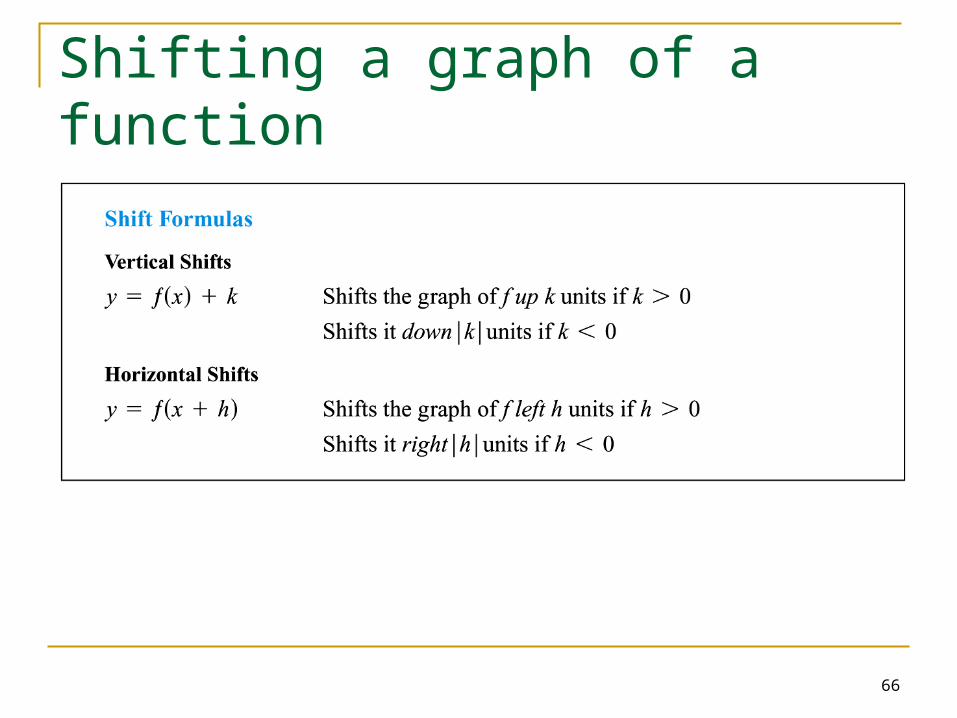
Shifting a graph of a function
67
Example 4
(a) y = x2, y = x2 +1 (b) y = x2, y = x2 -2
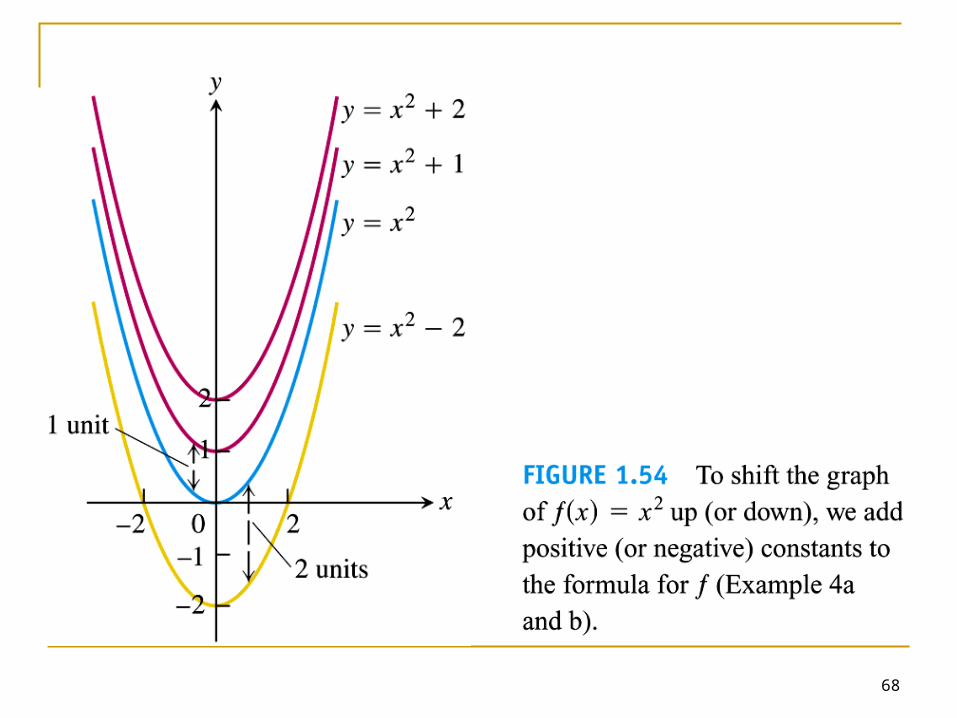
68
69
Example 4
(c) y = x2, y = (x + 3)2, y = (x - 3)2

70

71
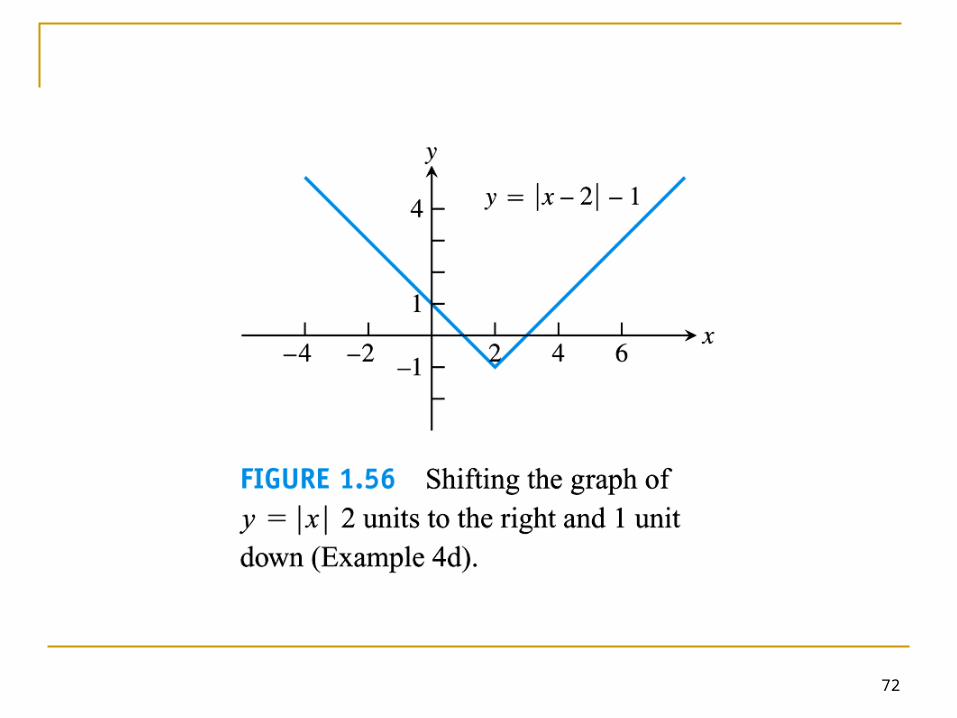
Example 4
(d) y = |x|, y = |x - 2| - 1
72
73
Scaling and reflecting a graph of a function To scale a graph of a function is to stretch or
compress it, vertically or horizontally. This is done by multiplying a constant c to the
function or the independent variable

74

75
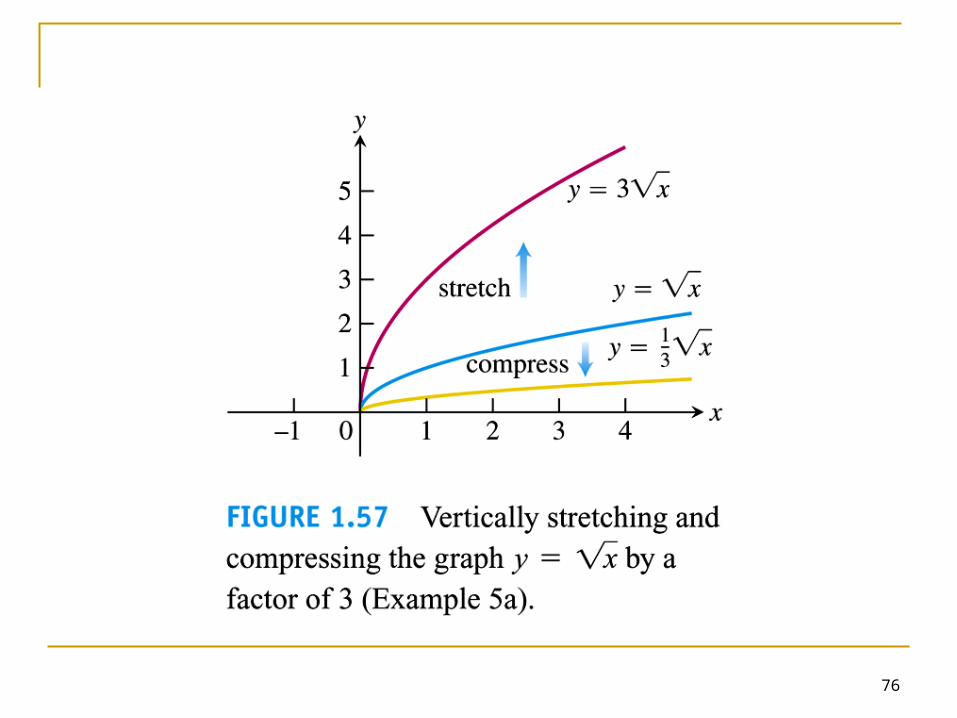
Example 5(a)
Vertical stretching and compression of the graph y = x by a factor or 3
76

77
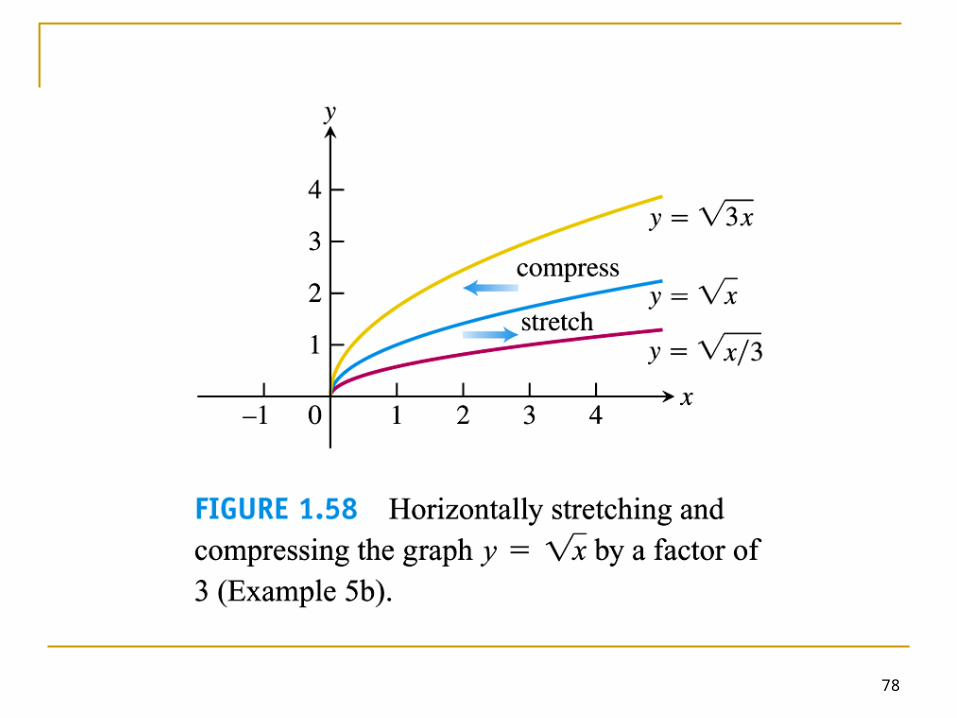
Example 5(b)
Horizontal stretching and compression of the graph y = x by a factor of 3
78
79
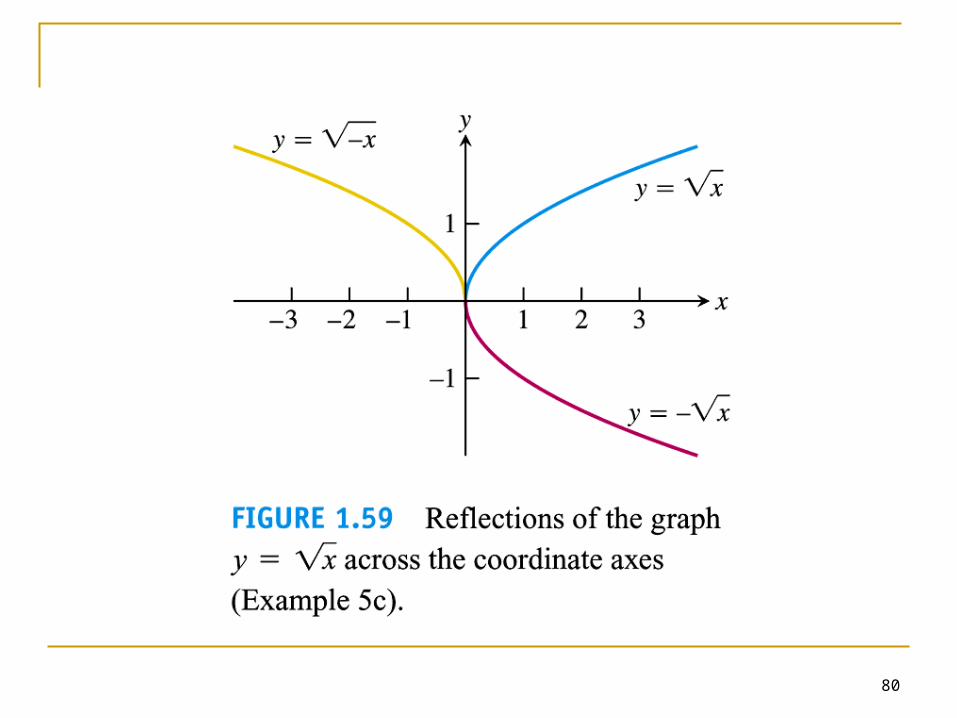
Example 5(c)
Reflection across the x- and y- axes c = -1
80
81
Example 6
Read it yourself

82
83
1.6
Trigonometric Functions
84
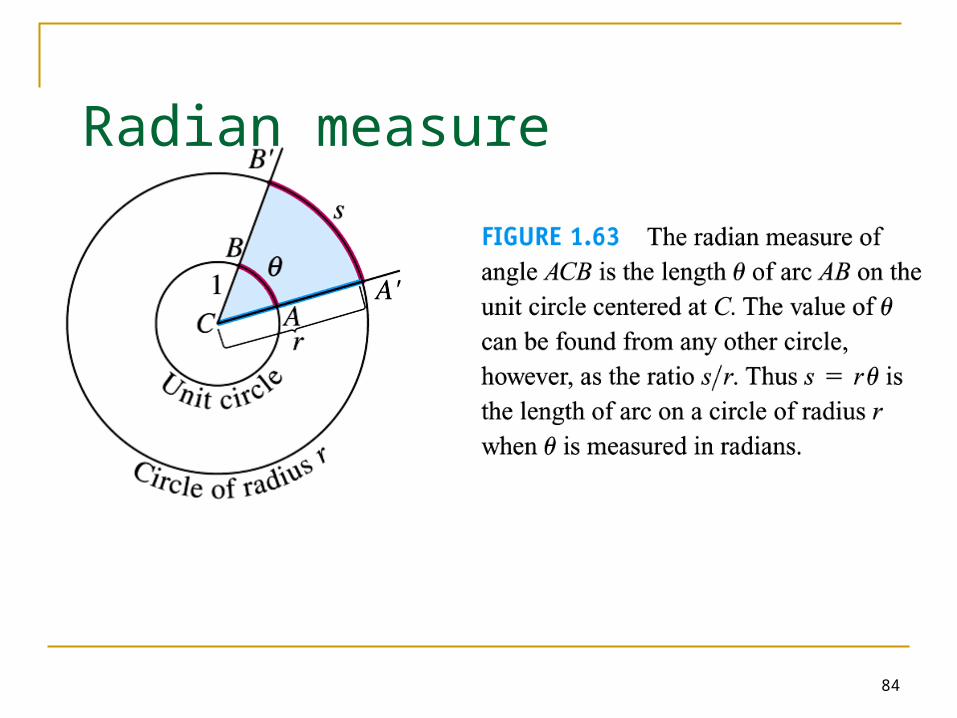
Radian measure
85

86
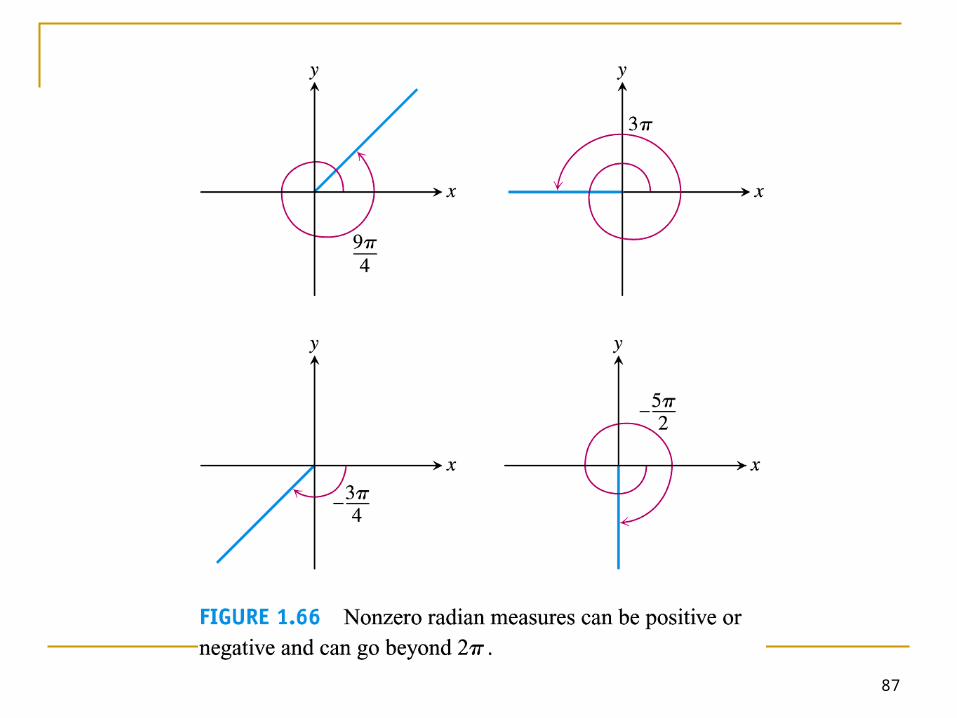
87
88
Angle convention
Be noted that angle will be expressed in terms of radian unless otherwise specified.
Get used to the change of the unit
89
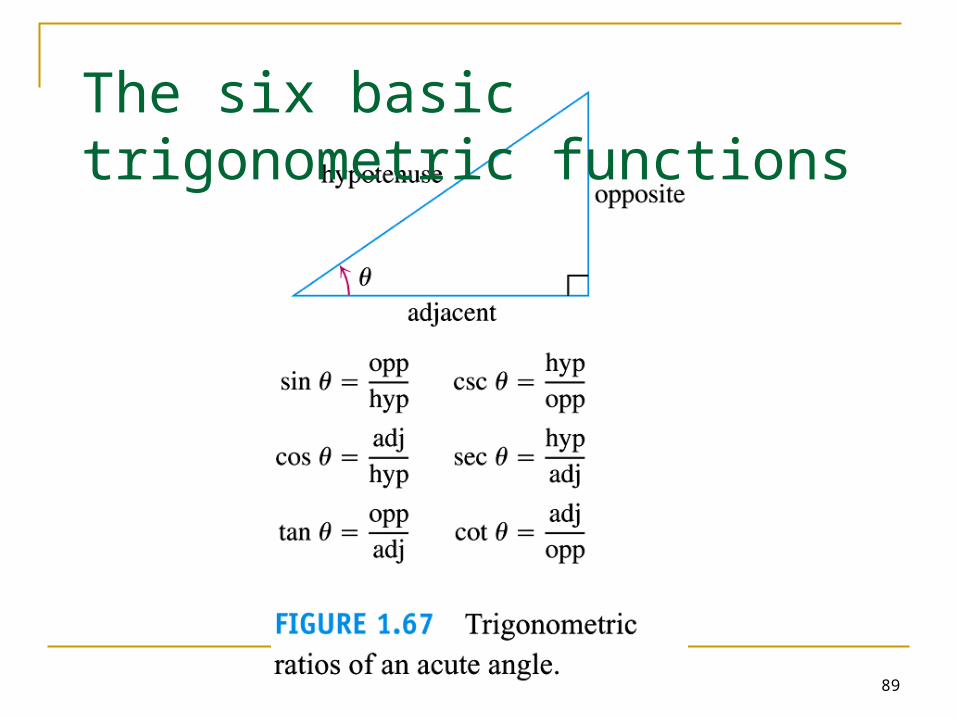
The six basic trigonometric functions

90
sine: sin = y/r cosine: cos = x/r tangent: tan = y/x cosecant: csc = r/y
secant: sec = r/x cotangent: cot = x/y
Define the trigo functios in terms of the coordinats of the point P(x,y) on a circle of radius r
Generalised definition of the six trigo functions

91
92
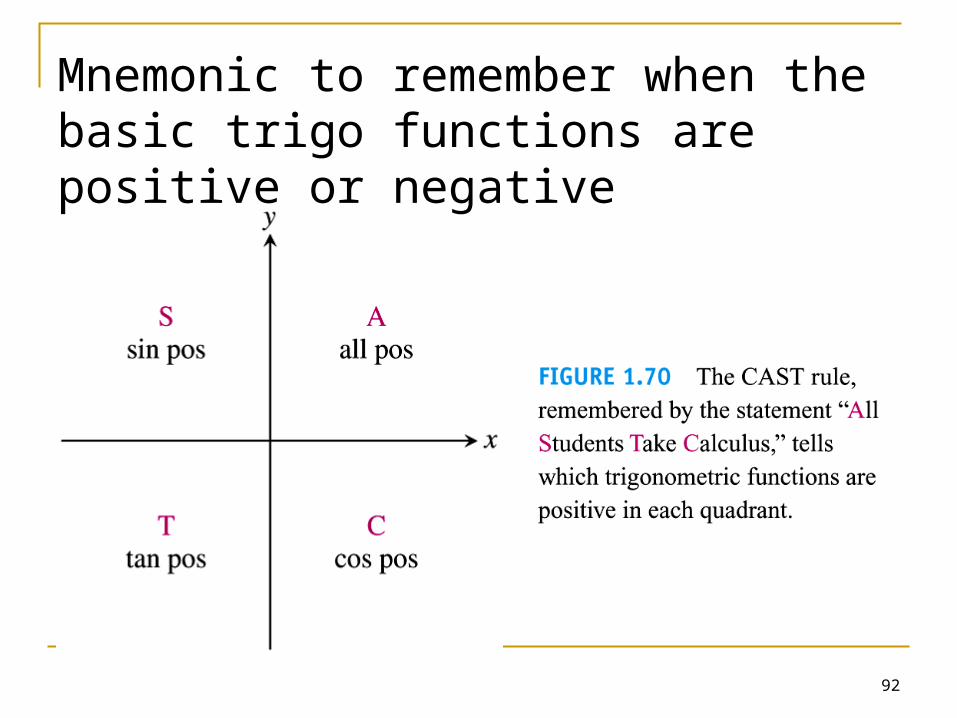
Mnemonic to remember when the basic trigo functions are positive or negative
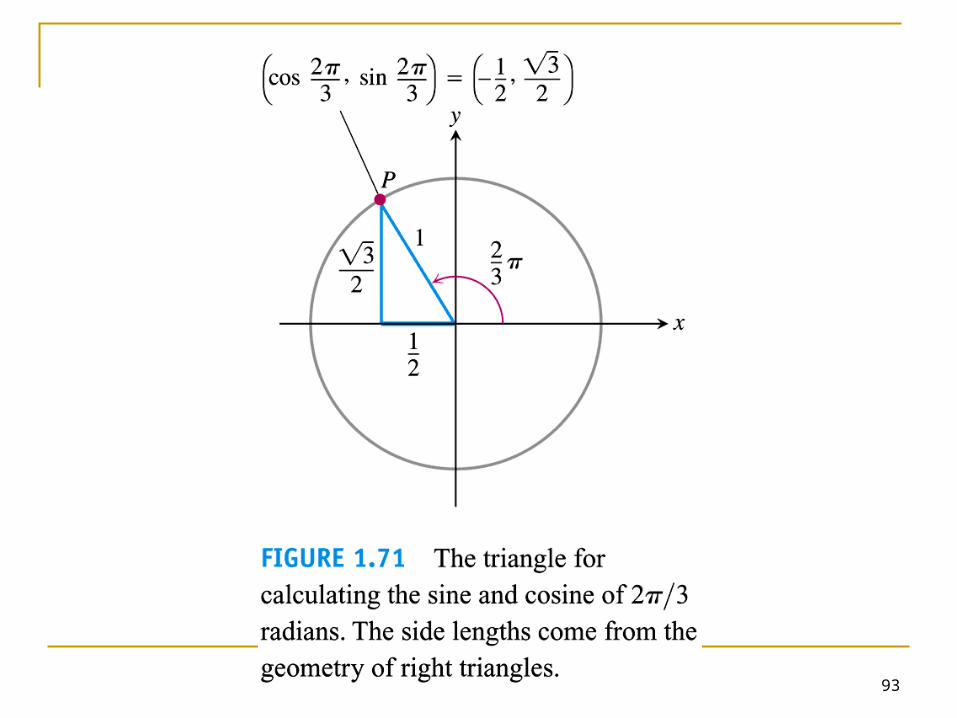
93

94
95
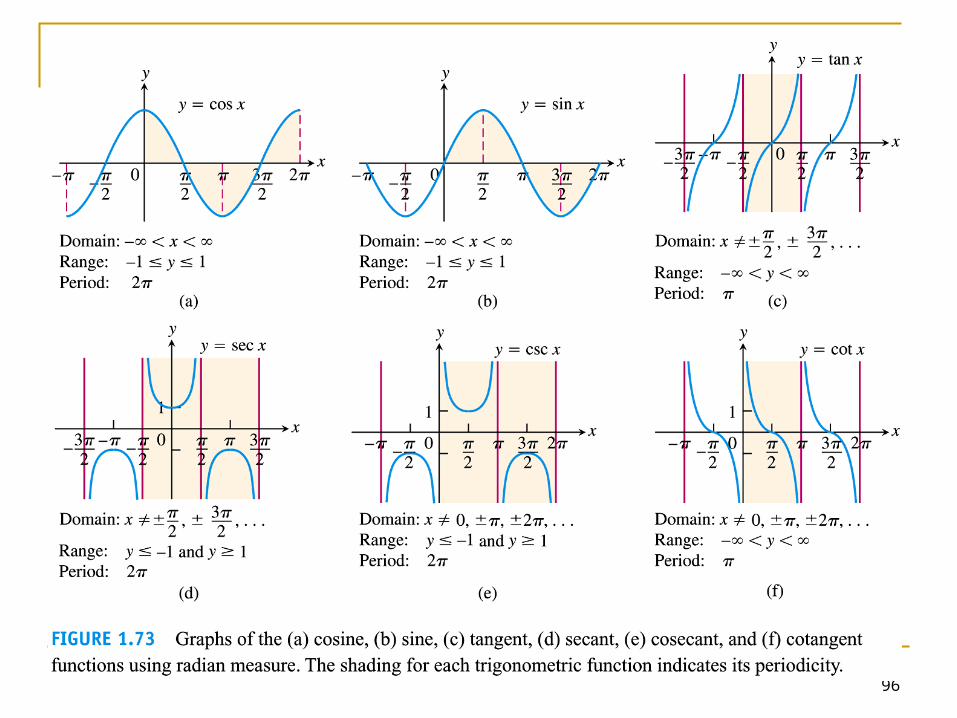
Periodicity and graphs of the trigo functions
Trigo functions are also periodic.
96
97
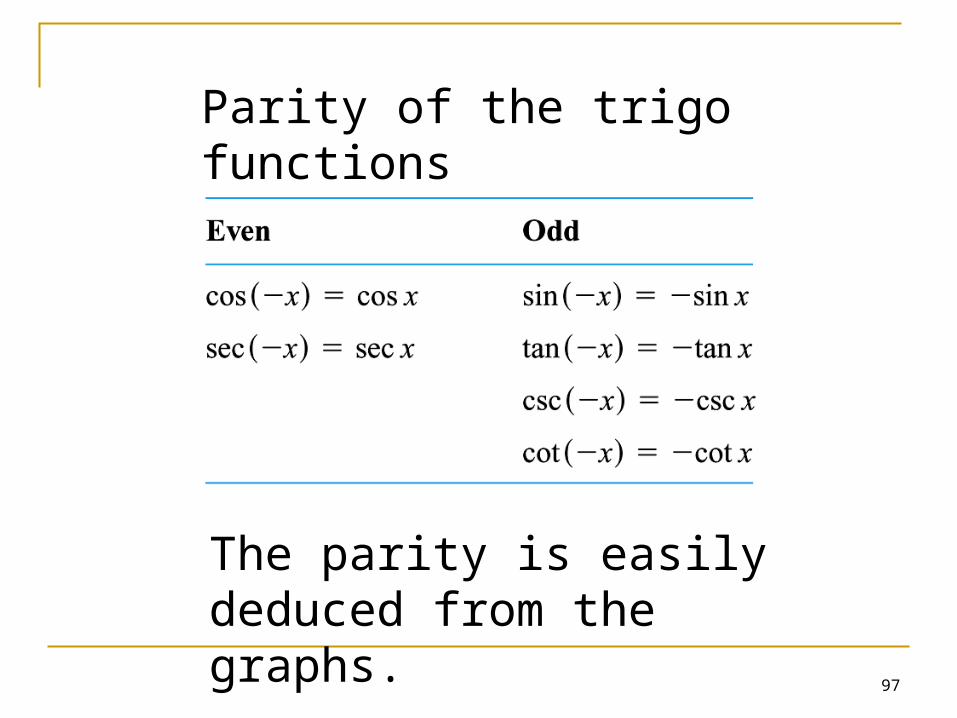
Parity of the trigo functions
The parity is easily deduced from the graphs.
98
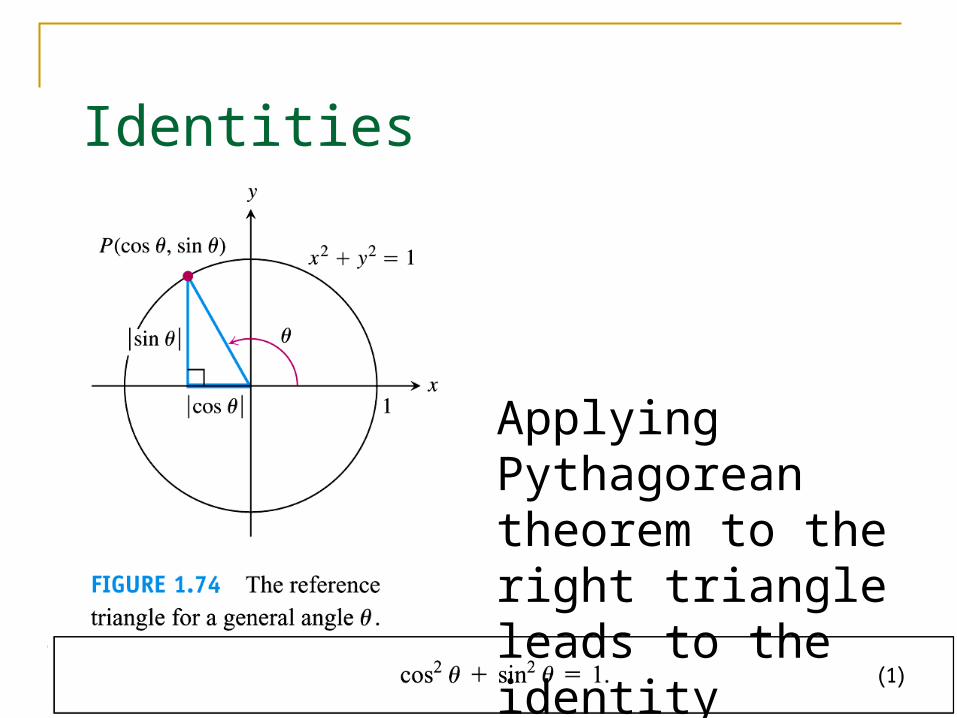
Identities
Applying Pythagorean theorem to the right triangle leads to the identity
99
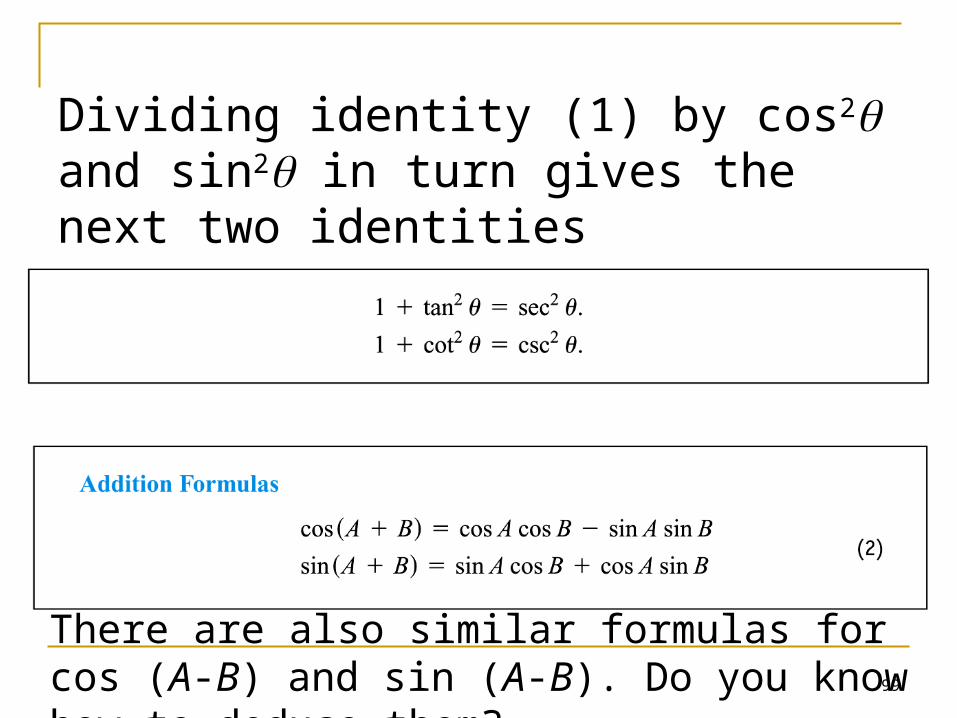
Dividing identity (1) by cos2 and sin2 in turn gives the next two identities
There are also similar formulas for cos (A-B) and sin (A-B). Do you know how to deduce them?

100
Identity (3) is derived by setting A = B in (2)
Identities (4,5) are derived by combining (1) and (3(i))

101
Law of cosines
c2= (acos- b)2 + (asin)2
= a2+b2 -2abcos