Embed Size (px)
Citation preview

1
Mortality and morbidity in the 21st century
POST-CONFERENCE VERSION
Anne Case1 and Angus Deaton2
April 10, 2017
Prepared for the Brookings Panel on Economic Activity, March 23−24, 2017. This is not the final version of the paper. Comments welcome. We are grateful to our pre-conference reviewers David Cutler, Jan Eberly and Adriana Lleras-Muney as well as to Jonathan Skinner and participants at the Brookings meeting, and to the National Institute on Aging for funding through the National Bureau of Economic Research, Grant NIA R01AG053396. The data appendix will be added by May 1st.
1 Center for Health and Wellbeing, Woodrow Wilson School, Princeton University, and NBER 2 Center for Health and Wellbeing, Woodrow Wilson School, Princeton University, NBER, and Uni-versity of Southern California

2
SUMMARY
We build on and extend the findings in Case and Deaton (2015) on increases in mortality and mor-bidity among white non-Hispanic Americans in midlife since the turn of the century. Increases in all-cause mortality continued unabated to 2015, with additional increases in drug overdoses, sui-cides, and alcohol-related liver mortality, particularly among those with a high-school degree or less. The decline in mortality from heart disease has slowed and, most recently, stopped, and this combined with the three other causes is responsible for the increase in all-cause mortality. Not only are educational differences in mortality among whites increasing, but mortality is rising for those without, and falling for those with, a college degree. This is true for non-Hispanic white men and women in all age groups from 25−29 through 60−64. Mortality rates among blacks and Hispanics continue to fall; in 1999, the mortality rate of white non-Hispanics aged 50−54 with only a high-school degree was 30 percent lower than the mortality rate of blacks in the same age group but irre-spective of education; by 2015, it was 30 percent higher. There are similar crossovers in all age groups from 25−29 to 60−64.
Mortality rates in comparable rich countries have continued their pre-millennial fall at the rates that used to characterize the US. In contrast to the US, mortality rates in Europe are falling for those with low levels of educational attainment, and have fallen further over this period than mortality rates for those with higher levels of education.
Many commentators have suggested that poor mortality outcomes can be attributed to contempo-raneous levels of resources, particularly to slowly growing, stagnant, and even declining incomes; we evaluate this possibility, but find that it cannot provide a comprehensive explanation. In particu-lar, the income profiles for blacks and Hispanics, whose mortality rates have fallen, are no better than those for whites. Nor is there any evidence in the European data that mortality trends match income trends, in spite of sharply different patterns of median income across countries after the Great Recession.
We propose a preliminary but plausible story in which cumulative disadvantage over life, in the la-bor market, in marriage and child outcomes, and in health, is triggered by progressively worsening labor market opportunities at the time of entry for whites with low levels of education. This ac-count, which fits much of the data, has the profoundly negative implication that policies, even ones that successfully improve earnings and jobs, or redistribute income, will take many years to reverse the mortality and morbidity increase, and that those in midlife now are likely to do much worse in old age than those currently older than 65. This is in contrast to an account in which resources af-fect health contemporaneously, so that those in midlife now can expect to do better in old age as they receive Social Security and Medicare. None of this implies that there are no policy levers to be pulled; preventing the over-prescription of opioids is an obvious target that would clearly be help-ful.

3
Introduction
Around the turn the century, after decades of improvement, all-cause mortality rates
among white non-Hispanic men and women in middle age stopped falling in the US,
and began to rise (Case and Deaton 2015). While midlife mortality continued to fall in
other rich countries, and in other racial and ethnic groups in the US, white non-His-
panic mortality rates for those aged 45-54 increased from 1998 through 2013. Mortality
declines from the two biggest killers in middle age—cancer and heart disease—were off-
set by marked increases in drug overdoses, suicides, and alcohol-related liver mortality
in this period. By 2014, rising mortality in midlife, led by these “deaths of despair,” was
large enough to offset mortality gains for children and the elderly (Kochanek, Arias, and
Bastian 2016), leading to a decline in life expectancy at birth among white non-Hispan-
ics between 2013 and 2014 (Arias 2016), and a decline in overall life expectancy at birth
in the US between 2014 and 2015 (Xu et al 2016). Mortality increases for whites in mid-
life were paralleled by morbidity increases, including deteriorations in self-reported
physical and mental health, and rising reports of chronic pain.
Many explanations have been proposed for these increases in mortality and mor-
bidity. Here, we examine economic, cultural and social correlates using current and his-
torical data from the US and Europe. This is a daunting task whose completion will take
many years; this current piece is necessarily exploratory, and is mostly concerned with
description and interpretation of the relevant data. We begin, in Section I, by updating
and expanding our original analysis of morbidity and mortality. Section II discusses the
most obvious explanation, in which mortality is linked to resources, especially family in-
comes. Section III presents a preliminary but plausible account of what is happening;
according to this, deaths of despair come from a long-standing process of cumulative

4
disadvantage for those with less than a college degree. The story is rooted in the labor
market, but involves many aspects of life, including health in childhood, marriage, child
rearing, and religion. Although we do not see the supply of opioids as the fundamental
factor, the prescription of opioids for chronic pain added fuel to the flames, making the
epidemic much worse than it otherwise would have been. If our overall account is cor-
rect, the epidemic will not be easily or quickly reversed by policy, nor can those in mid-
life today be expected to do as well after age 65 as do the current elderly. This does not
mean that nothing can be done. Controlling opioids is an obvious priority, as is trying to
counter the negative effects of a poor labor market on marriage, perhaps through better
safety nets for mothers with children.
Preliminaries
A few words about methods. Our original paper simply reported a set of facts—increases
in morbidity and mortality—that were both surprising and disturbing. The causes of
death underlying the mortality increases were documented, which identified the imme-
diate causes, but did little to explore underlying factors that could be playing a role. We
are still far from a smoking gun or a fully developed model, though we make a start in
Section III. Instead, our method here is to explore and expand the facts in a range of di-
mensions, by race and ethnicity, by education, by sex, by trends over time, and by com-
parisons between the US and other rich countries. Descriptive work of this kind raises
many new facts, and those facts often suggest a differential diagnosis, that some particu-
lar explanation cannot be universally correct because it works in one place but not an-
other, either across the US, or between the US and other countries. At the same time,
our descriptions uncover new facts that need to be explained and reconciled.

5
Two measures are commonly used to document current mortality in a popula-
tion: life expectancy, and age-specific mortality. Although related, and sometimes even
confused—many reports of our original paper incorrectly claimed that we had shown
that life expectancy had fallen—they are different, and the distinction between them is
important. Life expectancy at any given age is an index of mortality rates beyond that
age and is perhaps the more commonly used measure (for recent examples, see Chetty et
al 2016, Currie and Schwandt 2016, CDC 2015). Life expectancy at age a is a measure of
the number of years a hypothetical person could be expected to live beyond a, if current
age-specific mortality rates continue into the future; it is a function of mortality rates
alone, and does not depend on the age structure of the population. Life expectancy with-
out qualification refers to life expectancy at birth (age zero), and is the number most of-
ten quoted; however, when mortality rates at different ages move in different directions,
life expectancy trends can also differ by age. The calculation of life expectancy attaches
to each possible death year the probability of surviving to that year and then dying, us-
ing today’s survival rates. Because early mortality rates enter all future survival proba-
bilities, life expectancy is more sensitive to changes in mortality rates the earlier in life
these occur; the oft-used life expectancy at birth is much more sensitive to saving a child
than saving someone in midlife or old age, and changes in life expectancy can mask off-
setting changes occurring in earlier and later life. In our context, where mortality rates
are rising in midlife, but falling among the elderly and among children, life expectancy
at birth will respond only slowly—if at all. If middle-aged mortality is regarded as an in-
dicator of some pathology, whether economic or social—the canary in the coalmine—or
an indicator of economic success and failure, Sen (1998), life expectancy is likely to be a
poor and insensitive indicator. The focus of our analysis is therefore not life expectancy

6
but age-specific mortality, with rates defined as the number of deaths in a population of
a given age, per 100,000 people at risk.
Our earlier work reported annual mortality results for white non-Hispanic men
and women (together) aged 45 to 54 in the years between 1990 and 2013. In this paper,
we present a more complete picture of midlife mortality—by sex and education group,
over the full age range of midlife, using shorter age windows, over time, by cause, and by
small geographic areas. Dissecting changes over space, and across age, gender and edu-
cation helps us to match facts against potential explanations for the epidemic. We use
data on mortality and morbidity from the US and other OECD countries, as well as data
on economic and social outcomes, such as earnings, income, labor force participation,
and marital status.
We shall be much concerned with education, and work with three educational
groups, those with a high school degree or less, those with some college but no BA, and
those with a BA or more. Among white non-Hispanics ages 45-54, the share of each edu-
cation group in the population has seen little change since the early 1990s, with those
with no more than a high school degree comprising approximately 40 percent, some col-
lege (30 percent) and a BA or more (30 percent). It is important not to focus on those
with less than a high school degree, a group that has grown markedly smaller over time,
and is likely to be increasingly negatively selected on health. Whether or how education
causes better health is a long-unsettled question on which we take no position, but we
show health outcomes by education because they suggest likely explanations. For the
midlife group, the unchanging educational composition since the mid-1990s rules out
one explanation, that the less educated group is doing worse because of selection, as
would be the case if we had worked with high-school dropouts. When we examine other

7
age, ethnic, or racial groups, or midlife white non-Hispanics in periods before the mid-
1990s, the underlying educational compositions are not constant, and selection into ed-
ucation must be considered as an explanation for the evidence. More generally, we note
the obvious point that people with more or less education differ in many ways, so that
there can be no inference from our results that less educated people would have had the
same health outcomes as more educated people had they somehow been “dosed” with
more years of schooling.
Our data on mortality rates come from the CDC through the CDC-Wonder web-
site; mortality by education requires special calculation, and full details of our sources
and procedures are laid out in Appendix 1 (Data sources).
Early commentary on our work focused on our lack of age adjustment within the
age group 45-54 (Gelman and Auerbach 2016). Indeed the average age of white non-
Hispanics (WNH) aged 45-54 increased by half a year between 1990 and 2015 so that
part of the mortality increase we documented is attributable to this aging. Gelman and
Auerbach’s age-adjusted mortality rates for WNHs in the 45−54 year age group show
that the increase in all-cause mortality is larger for women, a result we have confirmed
on the data to 2015 (36 per 100,000 increase for women, 9 per 100,000 increase for
men, between 1998 and 2015, (single-year) age-adjusted using 2010 as the base year,
with little variation in the increases when we use different base years). In the current
analysis, we work primarily with five-year age groups, and we have checked that age-ad-
justment makes essentially no difference to our results with these groups; for US WNHs
aged 50−54, average age increased by only 0.09 years from 1990 to 2015.
Age-adjustment can be avoided by working with mortality by individual year of
age, though the resulting volume of material can make presentation problematic. In the

8
Graphical Appendix, we present some results by single year of age, which can be com-
pared to results in the main text. We discuss the separate experience of men and women
in some detail below; unless there is indication otherwise, results apply to men and
women together.
I. Mortality and morbidity in the US and other rich countries
I.A Documenting mortality
Increasing midlife white mortality rates, particularly for whites with no more than a
high school degree, stand in contrast to mortality declines observed for other ethnic and
racial groups in the US, and those observed in other wealthy countries. Figure 1.1 shows
mortality rates per 100,000 for men and women (combined) aged 50 to 54 from 1999 to
2015. We show separate mortality rates for black non-Hispanics, for Hispanics and for
all white non-Hispanics as well as for the subset of white non-Hispanics with no more
than a high school degree. The top line shows rapid mortality decline for blacks, while
the bottom line shows that Hispanics continue to make progress against mortality at a
rate of improvement that, as we shall see, is similar to the rate of mortality decline in
other rich countries. In contrast, white non-Hispanics are losing ground. White non-
Hispanic men are doing less badly than white non-Hispanic women, a distinction not
shown here but examined in detail below, but mortality rates for both were higher in
2015 than in 1998. While we do not have data on white non-Hispanics before 1989, we
can track mortality rates for all whites aged 45–54 from 1900; during the 20th century,
these mortality rates declined from more than 1,400 per 100,000 to less than 400 per
100,000. After the late 1930s, mortality fell year by year, with the exception of a pause
around 1960 (likely attributable to the rapid increase in the prevalence of smoking in

9
the 1930s and 40s) with
rapid decline resuming
from 1970 with improved
treatments for heart dis-
ease. In this historical
context of almost contin-
uous improvement, the
rise in mortality in midlife
is an extraordinary and
unanticipated event.
Mortality rates of
black non-Hispanics aged 50−54 have been and remain higher than those of white non-
Hispanics aged 50−54 as a whole, but have fallen rapidly, by around 25 percent from
1999 to 2015; as a result of this, and of the rise in white mortality, the black-white mor-
tality gap in this (and other) age group(s) has been closing, National Center for Health
Statistics (2016), Fuchs (2016). In this regard, the top two lines in Figure 1.1 are of inter-
est: mortality rates of non-Hispanic whites with a high school degree or less, which were
around 30 percent lower than mortality rates of blacks (irrespective of education) in
1999 (722 vs. 945 per 100,000), by 2015 were 30 percent higher (927 vs. 703 per
100,000). The same mortality crossover between black non-Hispanics and the least edu-
cated white non-Hispanics can be seen in Table 1 for every 5-year age group from 25-29
to 60-64; we note that for age-groups younger than 45, there has been a decline in the
fraction of WNHs with only a high school degree, so that selection may be playing some
White non-Hispanicshigh school or less
Black non-Hispanics
White non-Hispanics (all)
Hispanics
300
500
700
900
deat
hs p
er 1
00,0
00
2000 2005 2010 2015Survey year
All-cause mortality by race and ethnicity, ages 50-54
Figure 1.1: All-cause mortality by race and ethnicity, men and women, ages 50-54

10
Table 1. All-cause mortality rates, White non-Hispanics with high school or less (LEHS), and Black non-Hispanics (All)
1999 2015
Ages: Whites- LEHS Blacks - All Whites - LEHS Blacks - All
25-29 145.7 169.8 266.2 154.6
30-34 176.8 212.0 335.5 185.5
35-39 228.8 301.4 362.8 233.6
40-44 332.2 457.4 471.4 307.2
45-49 491.2 681.6 620.1 446.6
50-54 722.0 945.4 927.4 703.1
55-59 1087.6 1422.8 1328.3 1078.9
60-64 1558.4 1998.3 1784.6 1571.1
Notes. Mortality rates are expressed as deaths per 100,000 people at risk.
role for the younger groups. Recent literature contains many references to poorly edu-
cated whites losing ground to other groups in various life dimensions, including to Afri-
can-Americans; the mortality crossover presented in Figure 1.1 provides one dramatic
example.
Figure 1.1 presents the comparison of white non-Hispanics with a high school de-
gree or less with all black non-Hispanics—including those with some college or a college
degree, who carry a lower risk of mortality. Putting black and white non-Hispanics with
a high school degree or less head-to-head, Figure 1.2 shows that the black-white mortal-
ity gap has closed for every five-year age cohort between 25-29, and 50-54 year olds—
due both to mortality declines for blacks, and mortality increases for whites. The racial
gap in mortality among the least educated has all but disappeared. Again, we note the

11
decline in the fraction of those with a high school degree or less education in younger
age-cohorts; the declines are similar (20 percentage points) for WNHs and BNHs.
Figure 1.3 shows the comparison of the US with selected other rich countries
(France, Germany, UK, Canada, Australia, and Sweden). This updates Figure 1 in Case
and Deaton (2015), using the original ten-year age band, 45–54, adding years 2014 and
2015, and compares unadjusted mortality in the left-hand panel with (single year of)
age-adjusted mortality in the right-hand panel. The US and comparison countries have
been age adjusted within the age band using 2010 as the base year using mortality data
for single years of age from the raw data. Age adjustment changes little, but somewhat
smooths the rates of decline in comparison countries. Using the age-adjusted rates,
every comparison country had an average rate of decline of 2 percent per year between
1990 and 2015. While white non-Hispanics saw that same decline until the late 1990s, it
was followed by intermittent and overall mortality increases through 2015. Age-adjusted

12
mortality rates of black non-Hispanics 45-54 fell by 2.7 percent per year from 1999 to
2015, and those of Hispanics by 1.9 percent.
Appendix Figure 1 presents all-cause mortality by selected single year ages for
ages 30, 40, 45, 50, 55 and 60. From age 30 through age 55, US mortality was (at best)
not falling, and for some ages increased, while rates in other rich countries fell at all
ages.
Figure 1.4 presents mortality rate trends for midlife five-year age groups from
2000-2014 for US white non-Hispanics, black non-Hispanics, and Hispanics, and aver-
age trends for the six comparison countries used above. (Five of six comparison coun-
tries reported deaths through 2013; three of six through 2014. Trends for comparison
countries are estimated as the coefficient on the time trends from age-group specific re-
gressions of log mortality on a time trend and on a set of country indicators.) White
non-Hispanics aged 30-34 had mortality rate increases of almost 2 percent per year on

13
average over this 15-year pe-
riod. Changes in direction for
mortality rates in young
adulthood or early middle
age, taken alone, are less un-
common and less surprising:
death rates are low at these
ages, and shocks can easily
lead to a change of direction
(for example, HIV in the US
in the early 1990s). But the
fact that the US has pulled away from comparison countries throughout middle age is
cause for concern. Our main focus here is not on whether progress on all-cause mortal-
ity has only flat-lined or actually reversed course, although this was what attracted most
public response to our original paper. Rather, our main focus is that other wealthy coun-
tries continued to make progress while the US did not. As we have seen, black non-His-
panics have higher mortality rates than whites, but their mortality has fallen even more
rapidly than rates in Europe, while Hispanics, who have lower mortality rates than
whites, had declines in rates similar to the average in comparison countries in all age
groups.
Table 2 presents all-cause mortality trends for the 50-54 age band for US white
non-Hispanics, black non-Hispanics and Hispanics and a larger set of comparison coun-
tries, now including Ireland, Switzerland, Denmark, the Netherlands, Spain, Italy and
USW
USB USHEUR
USW
USB
USHEUR
5 year age group
USW
USBUSH
EUR
-.04
-.02
0.0
2
30 35 40 45 50 55 60Comparison countries: AUS, CAN, FRA, GER, UK, SWE
US white- and black-non-Hispanics, US Hispanics and comparison countriesMortality trends 2000-2014 by five-year age group
Figure 1.4 Mortality trends 2000-2014 by five-year age group, US Whites, US Blacks, US Hispanics, and comparison countries

14
Japan. The numbers in the table are the coefficients on time in (country- and cause-spe-
cific) regressions of the logarithm of mortality for the cause in each column on a time
trend, and the numbers can be interpreted as average annual rates of change. The mor-
Table 2. Trends in mortality by cause, annual average rate of change 1999-2015, men and women 50-54
Country or racial/ethnic group
All-cause Drugs, Alcohol, Suicide
Heart dis-ease
Cancer
US white non-Hispanics 0.005 0.054 –0.010 –0.011
US black non-Hispanics –0.023 0.001 –0.027 –0.024
US Hispanics –0.015 0.010 –0.025 –0.015
United Kingdom –0.021 0.010 –0.040 –0.023
Ireland –0.026 0.030 –0.051 –0.023
Canada –0.011 0.025 –0.030 –0.018
Australia –0.010 0.025 –0.028 –0.018
France –0.013 –0.012 –0.029 –0.017
Germany –0.019 –0.023 –0.035 –0.021
Sweden –0.021 0.008 –0.031 –0.023
Switzerland –0.025 –0.026 –0.040 –0.023
Denmark –0.018 0.001 –0.047 –0.026
Netherlands –0.023 –0.000 –0.055 –0.014
Spain –0.021 –0.003 –0.032 –0.020
Italy –0.021 –0.022 –0.047 –0.020
Japan –0.022 –0.021 –0.014 –0.028
tality trend is positive for US whites, and negative for US black non-Hispanics, US His-
panics, and for every other country. In this larger set of comparison countries, mortality

15
rates for men and women aged 50-54 declined by 1.9 percent per year on average be-
tween 1999 and 2014, while rates for US white non-Hispanics increased by 0.5 percent a
year.
That deaths of des-
pair play a part in the mor-
tality turnaround can be
seen in Figure 1.5, which
presents mortality rates
from alcohol and drug poi-
soning, suicide, and alco-
holic liver disease and cir-
rhosis for US white non-
Hispanic men and
women (USW), and those in comparison countries, all aged 50−54. US whites had much
lower mortality rates from drugs, alcohol and suicide than France, Germany or Sweden
in 1990, but while mortality rates in comparison countries converged to around 40
deaths per 100,000 after 2000, those among US white non-Hispanics doubled, to 80
per 100,000. The average annual rate of change from 1999–2015 of mortality rates from
“deaths of despair” are presented in column 2 of Table 2. For US black non-Hispanics,
mortality from these causes has been constant at 50 deaths per 100,000 after 2000. The
trends in other English speaking countries may provide something of a warning flag: the
UK, Ireland, Canada and Australia stand alone among the comparison countries in hav-
ing substantial positive trends in mortality from drugs, alcohol and suicide over this pe-
riod. However, their increases are dwarfed by the increase among US whites.
USW
GER
FRA
SWE
CAN
AUS
UK
2550
75de
aths
per
100
,000
1990 2000 2010year
Drug, alcohol and suicide mortality, men and women ages 50-54
Figure 1.5: Deaths of despair, men and women, aged 50-54

16
The epidemic spread from the southwest, where it was centered in 2000, first to
Appalachia, Florida and the west coast by the mid-2000s, and is now countrywide (Fig-
ure 1.6). Rates have been consistently lower in the Large Fringe MSAs, but increases
were seen at every level of residential urbanization in the US (Appendix Figure 2); it is
neither an urban nor a rural epidemic, rather both.
The units in Figure 1.6 are small geographic units that we refer to as coumas, a
blend of counties and PUMAs (Public Use Microdata Areas). For counties that are larger
than PUMAs, the couma is the county and is comprised of PUMAs, while in parts of the
country where counties are sparsely populated, one PUMA may contain many counties,
and the PUMA becomes the couma. (Details are provided in Data Appendix 1.) We have
constructed close to 1,000 coumas, which cover the whole of the US, with each contain-
ing at least 100,000 people.
We now turn to birth cohorts, beginning with the cohort born in 1935; this analy-
sis is important for the story that we develop in Section III below. (Note that, over this
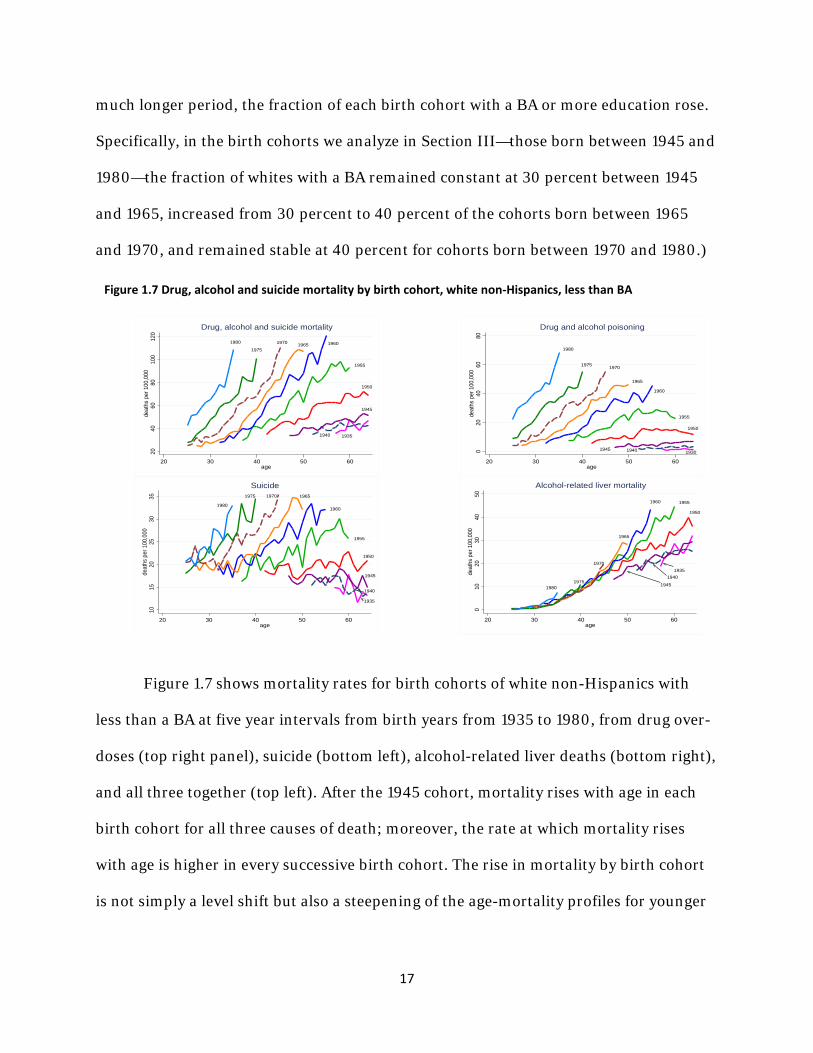
17
much longer period, the fraction of each birth cohort with a BA or more education rose.
Specifically, in the birth cohorts we analyze in Section III—those born between 1945 and
1980—the fraction of whites with a BA remained constant at 30 percent between 1945
and 1965, increased from 30 percent to 40 percent of the cohorts born between 1965
and 1970, and remained stable at 40 percent for cohorts born between 1970 and 1980.)
Figure 1.7 shows mortality rates for birth cohorts of white non-Hispanics with
less than a BA at five year intervals from birth years from 1935 to 1980, from drug over-
doses (top right panel), suicide (bottom left), alcohol-related liver deaths (bottom right),
and all three together (top left). After the 1945 cohort, mortality rises with age in each
birth cohort for all three causes of death; moreover, the rate at which mortality rises
with age is higher in every successive birth cohort. The rise in mortality by birth cohort
is not simply a level shift but also a steepening of the age-mortality profiles for younger
1935
1940
1945
1950
1955
1960
196519701975
1980
1015
2025
3035
deat
hs p
er 1
00,0
00
20 30 40 50 60age
Suicide
1950
1955
1960
1965
19701975
1980
1945 1940 1930020
4060
80de
aths
per
100
,000
20 30 40 50 60age
Drug and alcohol poisoning
1950
19551960
1965
19701935
1940
194519801975
010
2030
4050
deat
hs p
er 1
00,0
00
20 30 40 50 60age
Alcohol-related liver mortality
19351940
1945
1950
1955
1960196519701975
1980
2040
6080
100
120
deat
hs p
er 1
00,0
00
20 30 40 50 60age
Drug, alcohol and suicide mortality
Figure 1.7 Drug, alcohol and suicide mortality by birth cohort, white non-Hispanics, less than BA

18
cohorts. The steepening is not confined to the baby-boom (1945-60) cohorts; age-mor-
tality profiles are ever steeper in the cohorts that follow the baby-boomers. Repeating
the analysis for all education levels pooled yields qualitatively similar results, but with
the upward movement and the steepening slightly muted (Appendix Figure 3); we shall
return to the issue of selection into education in Section III below.
As noted by
Meara and Skin-
ner (2015) in
their commen-
tary on Case and
Deaton (2015),
increases in mor-
tality from deaths of despair would not have been large enough to change the direction
of all-cause mortality for US whites had this group maintained its progress against other
causes of death. For the two major causes of death in midlife, heart disease and cancer,
the rate of mortality decline for age groups 45-49 and 50-54 fell from 2 percent per year
on average between 1990 and 1999 to 1 percent per year between 2000-2014. The left
panel of Figure 1.8 presents heart disease mortality rates for US white non-Hispanics
and comparison countries from 1990-2014. US whites began the 1990s with mortality
rates from heart disease that were high relative to other wealthy countries and, while
rates continued to fall elsewhere, the rate of decline first slowed in the US, and then
stopped entirely between 2009 and 2015. With respect to cancer (right panel of Figure

19
1.8), US whites began the 1990s in the middle of the pack; again, if in less dramatic fash-
ion, progress for US whites slowed after 2000. The last two columns in Table 2 show
that, for both heart disease and cancer, US whites ages 50-54 had less than half the rate
of decline observed for US blacks and almost all of the comparison countries in the pe-
riod 1999-2014.
The slowdown in progress on cancer can be partially explained by smoking: the
decline in lung cancer mortality slowed for white non-Hispanic men ages 45-49 and 50-
54 in 2000-2014, and the mortality rate increased for women 45-49 between 2000 and
2010. (See Appendix Figure 4.) This puts the progress made against lung cancer by US
whites toward the bottom of the pack in comparison with US blacks and with other
wealthy countries.
Explaining the slowdown in progress in heart disease mortality is not straightfor-
ward. Many commentators have long predicted that obesity would eventually have this
effect, and see little to explain, e.g. Flegal et al (2005), Olshansky et al (2005), Lloyd-
Jones (2016). But the time, sex, and race patterns of obesity do not obviously match the
patterns of heart disease. While obesity rates are rising more rapidly among blacks than
among whites in the US, blacks made rapid progress against heart disease in the period
1999-2015 (see Table 2 and Appendix Figure 5). Beyond that, if the US is a world leader
in obesity, Britain is not far behind, with 25 percent of the adult population obese, com-
pared with 28 percent among US WNH, but Britain shows a continued decline in mor-
tality from heart disease. Stokes and Preston (2017) argue persuasively that deaths at-
tributable to diabetes are understated in the US, perhaps by a factor of four, so that the
additional obesity-related deaths from diabetes are not being measured but may be in-

20
correctly being attributed to heart disease. They note that when diabetes and cardiovas-
cular disease are both mentioned on a death certificate, “whether or not diabetes is
listed as the underlying cause is highly variable and to some extent arbitrary.” (p. 2/9) If
this happens in other countries, it might also explain the slowing of heart disease pro-
gress in other rich countries in which obesity rates are rising. Returning to six compari-
son countries examined earlier (AUS, CAN, FRA, GER, SWE, UK), we find that on aver-
age the decline in heart disease slowed from 4.0 percent per year (1990-99) to 3.2 per-
cent (2000-2014), see Figure 1.8. The contribution of obesity and diabetes to the mor-
tality increases documented here clearly merits additional attention.
Mortality rates increased at different rates in different parts of the country in the
period 1999-2015. Of the nine census divisions, the hardest hit was East South Central
(Alabama, Kentucky, Tennessee and Mississippi), which saw mortality rates rise 1.6 per-
cent per year on average for white non-Hispanics 50-54, increasing from 552 to 720
deaths per 100,000 over this period. Mortality rates fell in the Mid-Atlantic division,

21
held steady in New England and the Pacific division, but grew substantially in all other
divisions. A more complete picture of the change in mortality rates can be seen in Figure
1.9, which maps mortality rates for white non-Hispanics, ages 45-54, by the coumas in-
troduced above. The left (right) panel of Figure 1.9 presents mortality rates by couma in
2000 (2014). With the exception of the I-95 corridor, and parts of the upper Midwest,
all parts of the US have seen mortality increases since the turn of the century; 70 per-
cent of coumas saw mortality rate increases between 2000 and 2011 (the last year in
which the PUMAs drawn for 2000 allow a decade-long alignment of coumas.) Mortality
rates for WNHs aged 45-54 trended downward in only three states over the period 1999-
2015: California, New Jersey and New York. Although the media often report the mor-
tality turnaround as a rural phenomenon, all-cause mortality of white non-Hispanics
aged 50-54 rose on average one percent a year in four of six residential classifications
between 1999 and 2015—Medium MSAs, Small MSAs, Micropolitan Areas, and Noncore
(non-MSA) areas. Mortality rates were constant in Large Fringe MSAs over this period,
and fell weakly (0.3 percent per year on average) in the Large Central MSAs.
By construction, mortality from deaths of despair and all-cause mortality are
highly correlated; deaths of despair are a large and growing component of midlife all-
cause mortality. But it is important to remember that changes in all-cause mortality are
also driven by other causes, particularly heart disease and cancer, and that progress on
those varies from state to state. Take, for example, mortality in two states that are often
compared to emphasize the importance of health behaviors—Nevada and Utah. Two-
thirds of Utahans are Mormon; LDS adherence requires abstinence from alcohol, coffee,
and tobacco. Two-thirds of Nevadans live in the Las Vegas−Henderson−Paradise MSA.

22
Ranking states by their all-cause mortality rate for WNH aged 45-54, we find that Ne-
vada ranked 9th highest among all states in 2014; Utah ranked 31st. Heart disease mor-
tality was twice as high in Nevada in 2014 as it was in Utah (119 per 100,000 vs 59 per
100,000). However, both Nevada and Utah were among the top-ten states ranked by
mortality from drugs, alcohol and suicide in that year. Nevada was 4th highest, with 117
deaths per 100,000, and Utah was 10th, with 99 deaths per 100,000 WNH aged 45-54.
The suicide rate doubled in Utah in this population between 1999 and 2014, and the poi-
soning rate increased 150 percent. Different forces—social and economic, health-behav-
ior and health-care related—may drive changes in some causes of death, but not others,
and these forces themselves are likely to change with time.
As we saw in Figure 1.1, changes in US mortality rates for WNHs differ starkly by level of
education. Figure 1.10 shows this more explicitly for men and women separately.
Changes in mortality rates between 1998 (the year with the lowest mortality rate for
those aged 45-54) and 2015 are tracked by five-year age cohort, with men in the left

23
panel, and women in the right. From ages 25−29 to ages 55−59, men and women with
less than a four-year college degree saw mortality rates rise between 1998 and 2015,
while those with a BA or more education saw mortality rates drop, with larger decreases
at higher ages. Overall, this resulted in mortality rate increases for each five-year age
group, taking all education groups together, marked by the solid red lines in Figure 1.10.
Although there are some differences between men and women, the patterns of changes
in mortality rates are broadly similar in each education group.
The key story in this Figure is the increase in mortality rates for both men and
women without a BA, particularly for those with no more than a high school degree.
For WNH aged 50-54, Figure 1.11 compares deaths of despair for men and women with
a high school degree or
less (approximately 40
percent of this popula-
tion over the period 1999
to 2015) to those with a
BA or more (32-35 per-
cent). For both men and
women with less educa-
tion, deaths of despair
are rising in parallel, pushing mortality upwards. However, the net effect on all-cause
mortality depends on what is happening to deaths from heart disease and from cancer,
including lung cancer, and those other causes have different patterns for men and
women. We shall document these findings in more detail in future work.
men, high school or less
women, high school or less
men, BA or more
women, BA or more
050
100
150
200
deat
hs p
er 1
00,0
00
2000 2005 2010 2015year
Figure 1.11 Drug, Alcohol and Suicide Mortality, white non-Hispanics 50-54

24
Over this period, the disparity in mortality grew markedly between those with
and without a BA. The mortality rate for men with less than a BA aged 50-54, for exam-
ple, increased from 762 per 100,000 to 867 between 1998 and 2015, while for men with
a BA or more education, mortality fell from 349 to 243. Those with less than a BA saw
progress stop in mortality from heart disease and cancer, and saw increases in chronic
lower respiratory disease and deaths from drugs, alcohol, and suicide (Appendix Figure
6). Moreover, increasing differences between education groups are found for each com-
ponent of deaths of despair—drug overdoses, suicide, and alcohol-related liver mortal-
ity—analyzed separately (Appendix Figure 7).
Our findings on the widening educational gradient in Figure 1.10 are consistent
with and extend a long literature, recently reviewed, for example, by Hummer and Her-
nandez (2016). Kitigawa and Hauser (1973) first identified educational gradients in mor-
tality in the US, and later work, particularly Elo and Preston (1995), found that the differ-
ences widened for men between 1970 and 1980. Meara, Richards, and Cutler (2005) show
a further widening from 1981 to 2000. They show that there was essentially no gain in
adult life expectancy from 1981−2000 for whites with a high school degree or less, and that
educational disparities widened, for men and women, and for whites and blacks. A widely
reported study by Olshansky et al (2012) found that life expectancy of white men and
women without a high school degree decreased from 1990 to 2008. Given that the fraction
of population without a high school degree declined rapidly over this period and if, as is al-
most certain, that fraction was increasingly negatively selected, the comparison involves
two very different groups, one that was much sicker than the other when they left school,

25
see Begier et al (2013). Bound et al (2014) address the issue by looking at changes in mor-
tality at different percentiles of the educational distribution and find no change in the sur-
vival curves for women at the bottom educational quartile between 1990 and 2010 and an
improvement for men.
Our own findings here are more negative than those in the literature. Figure 1.10
shows that mortality rates for those with no more than a high school degree increased from
1998−2015 for white non-Hispanic men and women in all five-year age groups from 25−29
to 60−64. We suspect that these results differ from Meara et al (2005) because of the large
differential increase in deaths from suicides, poisonings, and alcoholic liver disease after
1999 among whites with the lowest educational attainment, see again Figure 1.11.
Mortality differentials by education among whites in the US contrast with those in
Europe. In a recent study, Mackenbach et al (2016) examine mortality data from eleven Eu-
ropean countries (or regions) over the period 1990-2010, and find that, in most cases, mor-
tality rates fell for all education groups, and fell by more among the least educated, so that
the (absolute) differences in mortality rates by education have diminished. (Disparities
have increased in relative terms because the larger decreases among the less well educated
have been less than proportional to their higher baseline mortality rates.)
I.B Documenting morbidity
Large and growing education differentials in midlife mortality are paralleled by reported
measures of midlife health and mental health. Figure 1.12 presents levels and changes over
time (1999-2015) in the fraction of white non-Hispanics at each age between 35 and 74
who report themselves in “excellent” or “very good” health (on a five-point scale that in-
cludes “good, fair or poor” as options). That self-assessed health falls with age is a standard

26
(and expected) result, and can be seen in all three panels, each for an education group. In
the period 1999-2001, there are marked differences between the education groups in self-
assessed health: 73 percent of 50 year olds with a BA or more report themselves in excel-
lent/very good health, true of 61 percent of those with some college education, and only 49
percent of those with a high school degree or less. Over the period 1999-2015, differences
between education groups became more pronounced, with fewer adults in lower education
categories reporting excellent health at any given age. In 2013-15, at age 50, the fraction of
BAs reporting excellent health had not changed, while that fraction fell 6 percentage points
for those with some college, and 7 percentage points for those with a high school degree or
less. (Beyond retirement age, which saw progress against mortality in the early 2000s,
self-assessed health registers improvement as well.)
Since the mid-1990s (when questions on pain and mental health began to be asked
annually in the National Health Interview Survey), middle-aged whites’ reports of chronic
pain and mental distress have increased, as have their reports of difficulties with activities

27
of daily living (Case and Deaton 2015). Figure 1.13 presents results for white non-Hispanic
reports of sciatic pain, for birth cohorts spaced by ten years, separately for those with less
than a four-year college degree (left panel), and those with a BA or more education (right
panel). Pain is a risk factor for suicide and, as the left panel shows, for those with less than
a college degree there has been a marked increase between birth cohorts in reports of sci-
atic pain. As was the case for mortality, the age-profiles for pain steepen with each succes-
sive birth cohort. For those with a BA, successive birth cohorts overlap in their reports of
pain at any given age, while for those with less education, an ever-larger share report pain
in successive cohorts. Similar results obtain for other morbidities.
II. Mortality and incomes
II.A Introduction
Much of the commentary has linked the deteriorating health of midlife whites to what has
happened to their earnings and incomes, and in particular to stagnation in median wages

28
and in median family incomes. Because there has been real growth in per capita GDP and in
mean per capita income, the poor performance for middle-class incomes can be mechani-
cally attributed to the rising share of total income captured by the best-off Americans. This
suggests an account in which stagnant incomes and deteriorating health become part of the
narrative of rising income inequality, see Stiglitz (2015) for one provocative statement. Ac-
cording to this, the rise in suicides, overdoses, and alcohol abuse would not have occurred
if economic growth had been more equally shared. Quite apart from the question of
whether, if the top had received less, the rest would have received more, we shall see that
the economic story can account for part of the increases in mortality and morbidity, but
only a part, and that it leaves more unexplained than it explains. Our preliminary conclu-
sion is that, as in previous historical episodes, the changes in mortality and morbidity are
only coincidentally correlated with changes in income.
II.B Contemporaneous evidence
For middle-aged whites, there is a strong correlation between median real household in-
come per person and mortality from 1980 and 2015; an inverse U-shaped pattern of real
income, rising through the 1980s and 1990s and falling thereafter, matches the U-shape of
mortality, which fell until 1998 and was flat thereafter. After 1990, we can separate out
Hispanics and look at white non-Hispanics, for whom the recent mortality experience was
worse than for whites as a whole. The left panel of Figure 2.1 shows, for households headed
by white non-Hispanics aged 50−54, real median household income per member from
March CPS files (presented as solid blue lines), and (unadjusted all-cause) mortality rates
for men and women aged 50−54 together (dashed red lines). Mortality and income match
closely. The right panel shows mortality for the age group 65-69, and median real income

29
per member in households headed by someone in that age band. This older group has done
well since 1990 in part because, for those who qualify, initial Social Security payments are
indexed to average wages and are subsequently indexed to the CPI; average wages have
done better than median wages. Real incomes for those aged 65–69 increased by a third be-
tween 1990 and 2015, while incomes for (all) middle-aged groups show an initial increase
followed by subsequent decline, though the timing and magnitudes are different across age
groups. Appendix Figure 8 shows that while the matching of mortality and household in-
come is strongest for the 50–54 age group, it appears at other ages too, albeit less clearly.
This looks like good evidence for the effects of income on mortality, not at an annual fre-
quency, which the graphs clearly show is not the case, but because of the (approximate)
matching of the timing of the turnarounds across age groups.
When we disaggregate by educational attainment in Figure 2.2, there is less support
for an income-based explanation for mortality. The left-hand panel shows year margins for

30
log median real income per member, for householders aged 30-64, from regressions of log
median real income per member on householder age effects and year effects, run sepa-
rately by education group. The general widening inequality in family incomes in the US
does not show up here in any divergence between the median incomes of those with differ-
ent educational qualifications, and does not match the divergence in mortality between ed-
ucation groups, discussed above and seen in the right-hand panel. The negative correlation
between mortality and income could be restored by removing the divergent trends from
mortality, yet there seems no principled reason to do so.
The matching of income and mortality fares poorly both for black non-Hispanics and
for Hispanics. Black household incomes rose and fell in line with white household incomes
for all age groups between 1990 and 2015 and indeed, after 1999, blacks with a college ed-
ucation experienced even more severe percentage declines in income than did whites in
the same education group (Figure 2.3). Yet black mortality rates have fallen steadily, at
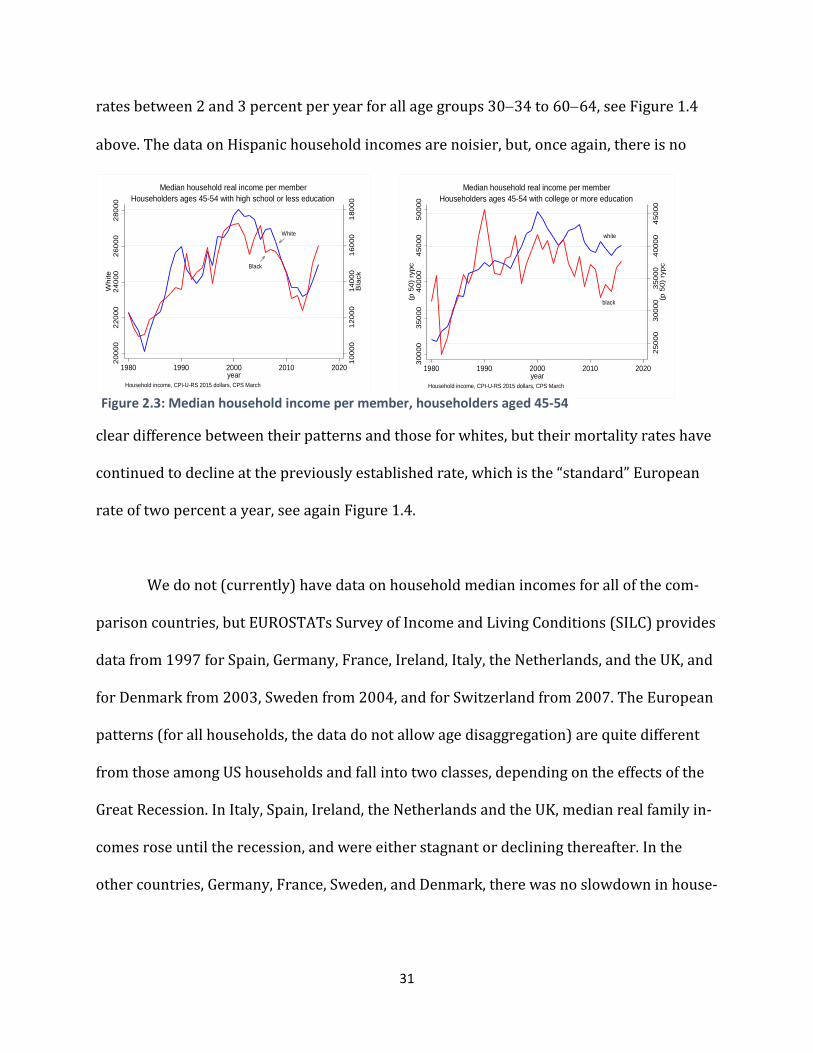
31
rates between 2 and 3 percent per year for all age groups 30−34 to 60−64, see Figure 1.4
above. The data on Hispanic household incomes are noisier, but, once again, there is no
clear difference between their patterns and those for whites, but their mortality rates have
continued to decline at the previously established rate, which is the “standard” European
rate of two percent a year, see again Figure 1.4.
We do not (currently) have data on household median incomes for all of the com-
parison countries, but EUROSTATs Survey of Income and Living Conditions (SILC) provides
data from 1997 for Spain, Germany, France, Ireland, Italy, the Netherlands, and the UK, and
for Denmark from 2003, Sweden from 2004, and for Switzerland from 2007. The European
patterns (for all households, the data do not allow age disaggregation) are quite different
from those among US households and fall into two classes, depending on the effects of the
Great Recession. In Italy, Spain, Ireland, the Netherlands and the UK, median real family in-
comes rose until the recession, and were either stagnant or declining thereafter. In the
other countries, Germany, France, Sweden, and Denmark, there was no slowdown in house-
White
Black
1000
012
000
1400
016
000
1800
0B
lack
2000
022
000
2400
026
000
2800
0W
hite
1980 1990 2000 2010 2020year
Household income, CPI-U-RS 2015 dollars, CPS March
Householders ages 45-54 with high school or less educationMedian household real income per member
white
black
2500
030
000
3500
040
000
4500
0(p
50)
ryp
c
3000
035
000
4000
045
000
5000
0(p
50)
ryp
c
1980 1990 2000 2010 2020year
Household income, CPI-U-RS 2015 dollars, CPS March
Householders ages 45-54 with college or more educationMedian household real income per member
Figure 2.3: Median household income per member, householders aged 45-54

32
hold incomes after 2007. As we have seen in Figure 1.3 and Table 2, there is no sign of dif-
ferences between these two groups in the rates of mortality decline, nor of any slowing in
mortality decline as income growth stopped or turned negative. If incomes work in Europe
as they work in the US, and if the income turnaround is responsible for the mortality turna-
round in the US, we would expect to see at least a slowing in mortality decline in Europe, if
only among the worst affected countries, but there is none.
II.C Discussion
Taking all of the evidence together, we find it hard to sustain the income-based explana-
tion. For white non-Hispanics, the story can be told, especially for those aged 50–54, and
for the difference between this group and the elderly, but we are left with no explanation
for why Blacks and Hispanics are doing so well, nor for the divergence in mortality be-
tween college and high-school graduates, whose mortality rates are not just diverging, but
going in opposite directions. Nor does the European experience provide support, because
the mortality trends show no signs of the Great Recession in spite of its marked effects on
household median incomes in some countries but not in others.
It is possible that it is not
the last 20 years that matters, but
rather that the long-run stagna-
tion in wages and in incomes has
bred a sense of hopelessness. But
Figure 2.4 shows that, even if we
go back to the late 1960s, the eth-
nic and racial patterns of median Figure 2.4 Median incomes by race and ethnicity

33
family incomes are similar for whites, blacks, and Hispanics, and so can provide no basis for
their sharply different mortality outcomes after 1998.
There is a microeconomic literature on health determinants that shows that those
with higher incomes have lower mortality rates and higher life expectancy, see National
Academy of Sciences (2015) and Chetty et al (2016) for a recent large-scale study for the
US. Income is correlated with many other relevant outcomes, particularly education,
though there are careful studies, such as Elo and Preston (1996), that find separately pro-
tective effects of income and education, even when both are allowed for together with con-
trols for age, geography, and ethnicity. These studies attempt to control for the obviously
important reverse effect of health on income by excluding those who are not in the labor
force due to long-term physical or mental illness, or by not using income in the period(s)
prior to death. Even so, there are likely also effects that are not eliminated in this way, for
example, that operate through insults in childhood that impair both adult earnings and
adult health. Nevertheless, it seems likely that income is protective of health, at least to
some extent, even if it is overstated in the literature that does not allow for other factors.
There is a somewhat more contested literature on income and mortality at business
cycle frequencies. Sullivan and von Wachter (2009) use administrative data to document
the mortality effects of unemployment among high seniority males, and Coile, Levine, and
McKnight (2014) note the vulnerability to unemployment of older, but pre-retirement
workers, who are unlikely to find new jobs and may be forced into early retirement, possi-
bly without health insurance. The mortality effects that they and Sullivan and von Wachter
document are not all instantaneous, but are spread over many years and are, in any case,
much smaller than the effects that would be required to justify the results in Figure 2.1 for

34
those aged 50–54. At the aggregate level, unemployment cannot explain the mortality turn-
arounds in the post-2000 period; unemployment had recovered its pre-recession level by
the end of the period, and was falling rapidly as mortality rose. It is of course possible that
the aggregate is misleading, either because unemployment excludes discouraged workers,
or because unemployment has not recovered in the places where unemployment prompted
mortality; see Pierce and Schott (2016) and Autor et al (2017) for evidence linking mortal-
ity to trade-induced unemployment.
There is, however, evidence against the unemployment story from Spain in Regidor et al
(2016) who use individual level data for the complete population of Spain to study mortal-
ity in 2004–2007 compared with 2008–2011. In spite of the severity of the Great Recession
in Spain, with unemployment rates rising from 8.2 percent in 2007 to 21.4 percent in 2011,
mortality was lower in the later period. This was true for most causes of death, including
suicide, and for people of high or low wealth, approximately measured by floor space or car
ownership in 2001, as well as for age groups 10–24, 25–49, and 50–74 taken separately.
There is a venerable literature arguing that good times are bad for health, at least in the
aggregate. As early as Ogburn and Thomas (1922), it was noted that mortality in the US
was pro-cyclical, with the apparently paradoxical finding that mortality rates are higher in
booms than in slumps. The result has been frequently but not uniformly confirmed in dif-
ferent times and places; perhaps the best-known study in economics is Ruhm (2009) who
uses time series of states in the US. Ruhm (2015), who grapples with the same data as here,
questions whether it remains true that recessions are good for health. A frequent finding is
that traffic fatalities are pro-cyclical, as are the effects of pollution, Cutler et al (2016). Sui-

35
cides are often found to move in the opposite direction, along with mortality from unem-
ployment, to which they likely contribute. Stevens et al (2016) find that in the US, many of
the deaths in “good” times are among elderly women, and implicate the lower staffing lev-
els in care facilities when labor is tight; pro-cyclical deaths from influenza and pneumonia
show up in several studies, again suggesting the importance of deaths among the elderly.
To the extent that the positive macro relationship between mortality and income is driven
by mortality among the elderly, it makes it easier to tell a story of income being protective
among the middle-age groups such as those on which we focus here.
Our own interpretation is that there is likely some genuine individual-level positive ef-
fect of income on health, but that it is swamped by other macro factors in the aggregate. Of
the results here, particularly those shown in Figure 2.1, we suspect that the matching rela-
tionships are largely coincidental, as has happened in other historical episodes.
The argument for coincidence is well illustrated by disaggregating the left panel of Fig-
ure 2.1 by cause of death. As shown in Section 1, when we look at all-cause mortality, we
need to think about “deaths of despair” (suicides, overdoses, and alcoholism) together with
heart disease. Deaths of despair have been rising at an accelerating rate since 1990 but, for
a decade, were offset by other declining causes of mortality, including heart disease. After
1999, the deaths of despair continued to rise, but were now much larger, while the decline
in heart disease slowed and eventually stopped, so that overall mortality started to go up.
Both of the components are smooth trends, one rising and accelerating, the other falling
but decelerating. Neither one in isolation has any relation to what has been happening to

36
income, but together, they generate a turnaround that, by chance, coincides with the in-
verse U in family incomes. Spurious common U’s are almost as easy to explain as spurious
common trends.
In the long history of the coevolution of health and income, such coincidences are
not uncommon. The Industrial and Health Revolutions that began in the 18th century both
owe their roots to the Enlightenment and the Scientific Revolution, but neither one drove
the other, see Easterlin (1999) for a persuasive account. In developing countries today,
health is largely driven by public action that requires money, but the use of that money for
action on health is far from automatic and depends on policy, Deaton (2013).
A more recent episode comes after 1970 in the US, when economic growth slowed
while the rate of mortality decline accelerated rapidly. Mean real per capita personal dis-
posable income grew at 2.5 percent per annum from 1950 to 1970, slowing to 2.0 percent
per annum from 1970 to 1990; meanwhile, for men and women aged 45–54 (for all ethnic-
ity and races), the Human Mortality Database shows that all-cause mortality fell at 0.5 per-
cent per annum from 1950 to 1970, but at 2.3 percent per annum from 1970 to 1990. Alt-
hough the patterns of mortality vary by sex, the acceleration in mortality decline between
1950–1970 and 1970–1990 characterizes both men and women separately, and all five-
year age groups from 35–39 to 55–59. But neither the slowdown in income nor the in-
crease in inequality that accompanied it had anything to do with the acceleration in mortal-
ity decline, particularly for heart disease, which was driven by the introduction of antihy-
pertensives after 1970, later aided by statins, and by a decline in smoking, particularly for
men. These health improvements were common to all rich countries, albeit with some dif-
ference in timing, and were essentially independent of patterns of growth and inequality in

37
different countries, Deaton and Paxson (2001, 2004), Cutler et al. (2006). Although we do
not consider it explicitly here, the fact that inequality and mortality moved in opposite di-
rections speaks against the hypothesis that relative income—your income rising more rap-
idly than mine, or the success of the top one percent—drives mortality, see also Deaton
(2003).
If we accept these arguments, we are left with no explanation for the mortality turn-
around. We suspect that more likely causes are various slowly moving social trends, such
as the declining employment to population ratio, or the decline in marriage rates, and it is
to these that we turn below. We note that it is difficult to rule out explanations that depend
on long-run forces, such as the fact that those aged 50 in 2010, as opposed to those aged 70
in 2010, were much less likely to have been better off than their parents throughout their
working life, Chetty et al (2016). Even so, we need to explain why stagnant incomes have
this effect on whites but not on blacks. Perhaps the substantial reduction in the
black/white wage gap from the mid-1960s to the mid-1970s gave an enduring sense of
hope to African Americans, though there has been little subsequent reason in income pat-
terns to renew it, Bayer and Charles (2017). Many Hispanics are markedly better off than
their parents or grandparents who were born abroad. Yet none of this explains why being
better off than one’s parents should protect against income decline, though it is not hard to
see why, after a working life at lower incomes than the previous generation, falling incomes
around age 50 might be hard to deal with. (This explanation works less well for younger
age cohorts, who are also bearing the brunt of this epidemic, but who are not yet old
enough to know whether they will be better off than their parents during their working
lives.) The historian Carol Anderson argued in an interview in Politico (2016) that for

38
whites “if you’ve always been privileged, equality begins to look like oppression,” and con-
trasts the pessimism among whites with the “sense of hopefulness, that sense of what
America could be, that has been driving black folks for centuries.” That hopefulness is con-
sistent with the much lower suicide rates among blacks, but beyond that, while suggestive,
it is hard to confront such accounts with the data.
III. Cumulative deprivation
III.A Background
We have seen that it is difficult to link the increasing distress in midlife to the obvious con-
temporaneous aggregate factors, such as income or unemployment. But some of the most
convincing discussions of what has happened to working class whites emphasize a long-
term process of decline, or of cumulative deprivation, rooted in the steady deterioration in
job opportunities for people with low education, see in particular Cherlin (2009, 2014).
This process, which began for those leaving high school and entering the labor force after
the early 1970s—the peak of working class wages, and the beginning of the end of the “blue
collar aristocracy”—worsened over time, and caused, or at least was accompanied by, other
changes in society that made life more difficult for less-educated people, not only in their
employment opportunities, but in their marriages, and in the lives of and prospects for
their children. Traditional structures of social and economic support slowly weakened; no
longer was it possible for a man to follow his father and grandfather into a manufacturing
job, or to join the union. Marriage was no longer the only socially acceptable way to form
intimate partnerships, or to rear children. People moved away from the security of legacy
religions or the churches of their parents and grandparents, towards churches that empha-

39
sized seeking an identity, or replaced membership with the search for connection, Wuth-
now (1990). These changes left people with less structure when they came to choose their
careers, their religion, and the nature of their family lives. When such choices succeed, they
are liberating; when they fail, the individual can only hold him or herself responsible. In the
worst cases of failure, this is a Durkheim-like recipe for suicide.
As technical change and globalization reduced the quantity and quality of oppor-
tunity in the labor market for those with no more than a high school degree, a number of
things happened that have been documented in an extensive literature. Real wages of those
with only a high school degree declined, and the college premium increased. More people
went to college—a choice that, in practical terms, was not available to those lacking the de-
sire, capability, resources, or an understanding of the expected monetary value of a college
degree. Family incomes suffered by less than the decline in wages because women partici-
pated in the labor force in greater numbers, at least up to 2000, and worked to shore up
family finances; even so, there was a loss of wellbeing, at least for some. Chetty et al (2016)
estimate that only 60 percent of the cohort born in 1960 was better off in 1990 than had
been their parents at age 30. They estimate that, for those born in 1940, 90 percent were
better off at 30 than their parents had been at the same age. The data do not permit an
analysis, but the deterioration was likely worse for whites than blacks, and for those with
no more than a high school degree. As the labor market worsens, some people switch to
lower paying jobs—service jobs instead of factory jobs—and some withdraw from the la-
bor market. Figure 3.1 shows that, after the birth cohort of 1940, in each successive birth
cohort, men with less than a four-year college degree were less and less likely to participate

40
in the labor force at any given age—a phenomenon that did not occur among men with a
BA.
It is worth noting again that the fractions with and without a BA are constant for the
cohorts born between 1945 and 1965, then rise from 30 to 40 percent for cohorts born be-
tween 1965 and 1970, beyond which the fraction remains stable at 40 percent. In conse-
quence, some of the deterioration in outcomes for the less-educated cohorts born between
1965 and 1970 may be driven by a decrease in their average positive characteristics; for
example, if education is selected on ability, there will be a decrease in average ability in the
group without a 4-year degree. Yet this cannot be the whole story: if lower ability people
are transferred from the less to the more educated group, outcomes should also deteriorate
for the latter; this is the Will Rogers effect—that moving the least able upwards brings
down the average in both bottom and top groups. Yet the cohort graphs show no evidence
of deterioration among those with a BA. Another way of seeing the same thing is to pool

41
the groups to get a graph that is an attenuated version of the left panel of Figure 3.1 (Ap-
pendix Figure 9).
Lower wages not only brought withdrawal from the labor force, but also made men
less marriageable; marriage rates declined, and there was a marked rise in cohabitation,
much less frowned upon than had been the case a generation before. Figure 3.2 shows that,
after the cohort of 1945, men and women with less than a BA degree are less likely to have
ever been married at any given age. Again, this is not occurring among those with a four-
year degree. Unmarried cohabiting partnerships are less stable than marriages. Moreover,
among those who do marry, those without a college degree are also much more likely to di-
vorce than are those with a degree. The instability of cohabiting partnerships is indeed
their raison d’être, especially for the women, who preserve the option of trading up, see
also Autor, Dorn and Hansen (2017)—so that both men and women lose the security of the
stable marriages that were the standard among their parents. Childbearing is common in

42
cohabiting unions, and again is less disapproved of than once was the case. But, as a result,
more men lose regular contact with their children, which is bad for them, and bad for the
children, many of whom live with several men in childhood. Some of a woman’s partners
may be unsuitable as fathers, and those who are suitable bring renewed loss to children
when they depart in turn. Importantly, this behavior is more common among white women
than among Hispanics or African Americans; the latter have more out of wedlock children,
but have fewer cohabiting partners, see again Cherlin (2009). In Europe, cohabitation is
also common, but is much less unstable, and not so different from marriage. Cherlin (2014)
notes that it is now unusual for white American women without a college degree not to
have a child outside of marriage. The repeated re-partnering in the US is often driven by
the need for an additional income, something that is less true in Europe with its more ex-
tensive safety net, especially of transfer income; Britain, for example, provides uncondi-
tional child allowances that are attached to children.
Social upheaval may have taken different forms, on average, for African Americans.
Black kin networks, though often looser, may be more extensive and more protective, as
when grandmothers care for children. Black churches provide a traditional and continuing
source of support. As has often been noted, blacks are no strangers to labor market depri-
vations, and may be more inured to the insults of the market.
These accounts share much, though not all, with Murray’s (2012) account of decline
among whites in his fictional “Fishtown.” Murray argues that traditional American virtues
are being lost among working-class white Americans, especially the virtue of industrious-
ness. In this argument, the withdrawal of men from the labor force reflects this loss of in-

43
dustriousness; young men in particular prefer leisure—which is now more valuable be-
cause of video games, Aguiar et al (2016)—though much of the withdrawal of young men is
for education, Krueger (2016). The loss of virtue is supported and financed by government
payments, particularly disability payments, see also Eberstadt (2016). If this malaise is re-
sponsible for the mortality and morbidity epidemic, it is unclear why we do not see rising
mortality rates for blacks, for Hispanics, for more educated whites, or indeed for Europe-
ans, although the last group has universal health care and a much more generous safety
net. Indeed, in some European countries, disability programs are so generous and so widely
claimed that average retirement ages are below the minimal legal retirement age, see
Gruber and Wise (2007).
According to Krueger, half of the men who are out of the labor force are taking pain
medication, and two thirds of those take prescription painkiller, such as opioids. Eberstadt
(2017) notes that, in many cases, opioids are paid for by Medicaid, so that “`dependence on
government’ has thus come to take on an entirely new meaning.” Yet it is not only the gov-
ernment that is complicit. Doctors bear some responsibility for their willingness to (over)
prescribe drugs (Quinones (2015), Barnett et al (2017)), especially when they have little
idea of how to cure addiction if and when it occurs. There are also reasonable questions
about an FDA approval system that licenses a class of drugs that has killed around 200,000
people. We should note that a central beneficiary of the opioids are the pharmaceutical
companies who have promoted their sales. According to Ryan, Girion, and Glover (2016),
Purdue Pharmaceutical had earned $31 billion from sales of OxyContin as of mid-2016.

44
In our account here, we emphasize the labor market, globalization and technical
change as the fundamental forces, and put less focus on any loss of virtue, though we cer-
tainly accept that the latter could be a consequence of the former. Virtue is easier to main-
tain when it is well rewarded. Yet there is surely general agreement on the roles played by
changing beliefs and attitudes, particularly the acceptance of cohabitation, and of the rear-
ing of children in unstable cohabiting unions.
These slow-acting and cumulative social forces seem to us to be plausible candi-
dates to explain rising morbidity and mortality, particularly suicide, and the other deaths of
despair, which share much with suicides. As we have emphasized elsewhere, Case and Dea-
ton (2017), purely economic accounts of suicide have rarely been successful in explaining
the phenomenon. If they work at all, they work through their effects on family, on spiritual
fulfillment, and on how people perceive meaning and satisfaction in their lives in a way that
goes beyond material success. At the same time, cumulative distress, and the failure of life
to turn out as expected is consistent with people compensating through other risky behav-
iors such as abuse of alcohol, overeating, or drug use that predispose towards the outcomes
we have been discussing.
III.B A framework to interpret the data
A simple way of taking these stories to our data is to suppose that there is a negative factor,
which each birth cohort experiences as it enters the labor market. This might be the real
wage at the time of entering, but it could be a range of other economic and social factors,
including the general health of the birth cohort (Case et al. 2005); we deliberately treat this
as a latent variable that we do not specify. This is related to accounts in which workers en-

45
ter the labor market in a large birth cohort, or in bad times (see Hershbein 2012 and refer-
ences provided there). However, it is different in that we emphasize the experience of all
cohorts who entered the labor market after the early 1970s, and we focus on the cumula-
tive effect over the lifetime of an initial disadvantage.
We label birth cohorts by the year in which they are born, b, say, and assume each
experiences 𝑋𝑋𝑏𝑏 as they enter the labor market, which then characterizes their labor market
for the rest of their lives. Because of the factors outlined above, the effects are assumed to
accumulate over time, for simplicity linearly, so that the deprivation experienced by b in
year t is (𝑡𝑡 − 𝑏𝑏)𝑋𝑋𝑏𝑏 . The driving variable 𝑋𝑋 is itself trending over time, though not neces-
sarily linearly; our measurement will allow for any pattern. In this set up, various measures
of deprivation—pain, mental distress, lack of attachment to the labor market, not marrying,
suicide, addiction—will trend up with age linearly for each specific birth cohort, and the
rate at which each trends up will be higher or lower for later born cohorts as the initial con-
dition goes up or down for later born cohorts.
Figure 1.7, which inspired this way of thinking about the data, shows how this
works for deaths of despair, collectively, and for suicides, poisonings, and alcoholism sepa-
rately, and Figures 1.12, 1.13, 3.1 and 3.2 show the corresponding graphs for self-reported
health, pain, labor force participation and marriage respectively. For morbidity and mortal-
ity we see the upward slope with age for each birth cohort, which is the accumulation of the
original effect, as well as the steepening of the age-slopes for each successive cohort, which
we explain as an increase in the starting variable .
Our model for each outcome is then written as
bX

46
(1)
where i indexes an outcome—suicide, obesity, pain; t is the time of observation; b is the
birth year, so that a is age. Each outcome is a function of age, shared by all birth cohorts for
a given outcome, which will be estimated non-parametrically; is the parameter that links
the unobservable common factor 𝑋𝑋𝑏𝑏 to each outcome 𝑖𝑖. From the data underlying Figures
1.7, 1.12, 1.13, 3.1, and 3.2, as well as for other conditions, we can estimate (1) by regress-
ing each outcome on a complete set of age indicators, and a set of interaction terms be-
tween age (not age dummies) and dummies that identify each birth cohort. We assume that
the underlying cause of despair appeared after the 1945 birth cohort entered the market;
we take this to be our first cohort, and normalize the driving variable 𝑋𝑋 to zero for that co-
hort, for all outcomes. The coefficient on the birth cohort-age interaction term for birth co-
hort 𝑏𝑏 is an estimate of Plotting these estimates against b for each condition, we
should see the latent cohort factor , and we should see the same pattern, up to scale, for
every outcome.
Figure 3.3 shows the results for five-year birth cohorts born between 1945 and
1980, for white non-Hispanics aged 25 to 64, without a BA. The left panel presents esti-
mates for suicide (marked by the solid red line), with its scale on the left; the scale for
chronic pain, sciatic pain, mental distress, body mass index, and reported difficulties in so-
cializing and relaxing is given on the right. The right panel of Figure 3.3 presents estimates
for drug and alcohol poisoning (marked by the solid red line), marriage (both never mar-
ried, and not currently married) and, for males, not being in the labor force. We do not in-
clude alcoholic liver disease in this part of the analysis; the lag between behavior (heavy
(t b) ( ) ( )b biab i i i i i iy f X t b f a X aα θ α θ= + − + − = + +
bi Xθ

47
drinking) and mortality (cirrhosis, alcoholic-liver disease) does not allow us to see the dif-
ference in mortality consequences of heavy drinking between birth cohorts currently un-
der the age of 50. Instead, we include as an outcome an indicator of being at risk for heavy
drinking (using an assessment made by the Behavioral Risk Factor Surveillance System).
In the left panel, the slopes formed by plotting estimates are approximately
linear for each outcome; the difference between successive birth cohorts 𝜃𝜃𝑖𝑖(𝑋𝑋𝑐𝑐 − 𝑋𝑋𝑏𝑏) is
similar for all pairs (1950−1945) to (1980−1975), consistent with a model in which the la-
tent variable has increased, and increased linearly between birth cohorts. For these condi-
tions, we see that we can match the data by a common latent factor that increases linearly
from one cohort to the next.
In the right panel, for drug overdose, heavy drinking, marriage, and labor force de-
tachment, we see a somewhat different pattern, in which the common latent variable is
”worse” than linear, with a slope that is increasing more rapidly for cohorts born after 1965
bi Xθ
Figure 3.3 Estimates of cumulative deprivation, white non-Hispanics ages 25-64, less than BA
not married
drug mortality
never married
not in labor force
at risk for heavy drinking
0.2
.4.6
labo
r mar
ket,
mar
riage
and
hea
vy d
rinki
ng c
oeffi
cien
ts
0.5
11.
52
2.5
Dru
g an
d al
coho
l poi
soni
ng c
oeffi
cien
ts
1940 1950 1960 1970 1980year of birth
Drug mortality, labor force participation and marriage
suicide
chronic painsciatic pain
difficulty socializing
BMI
mental distress
difficulty relaxing 0.1
.2.3
mor
bidi
ty c
oeffi
cien
ts
0.2
.4.6
.8S
uici
de c
oeffi
cien
ts
1940 1950 1960 1970 1980year of birth
Suicide, pain and social isolation
48
than for those born before. This is consistent with either a non-linear cumulative effect of
deprivation on these outcomes, or the addition of a second latent factor that makes its ap-
pearance for cohorts born around and after 1965, who would have entered the market
starting in the early 1980s. It is also consistent with changing attributes in the part of each
birth cohort that does not complete a BA, a fraction that modestly decreased after the co-
hort of 1965. As was true for suicide, pain and isolation, each successive cohort is at higher
risk of poor outcomes than the cohort it succeeded.
Note that there is nothing in our procedures that ensures that the plots in Figure 3.3
must rise with age, let alone that they should do so in the same way across conditions. That
they do so is a feature of the data, specifically that the age gradient for each birth cohort is
steeper for later cohorts for each condition; the deterioration with age for each outcome
becomes worse and worse.
In a statistically inefficient but straightforward method, we can recover estimates of
by pooling across conditions and regressing the logarithms of the estimated coef-
ficients on indicators for each cohort and each condition. Results confirm a nearly linear in-
crease in 𝑋𝑋 across birth cohorts for suicide, pain and isolation and a non-linear increase for
drug overdose, heavy drinking, labor market attachment, and marriage.
One might reasonably ask what is causing what in our analysis. The use of a latent
variable model allows us to avoid taking a position on the question. That said, we turn to
the progressive deterioration of real wages as a possible driving variable. Figure 3.4 plots
the (negative of) coefficients from a regression of log real wages for men with less
than a four-year college degree against coefficients from a regression of the percent of men,
with less than a BA, not in the labor force. The cohorts born between 1945 and 1980 show
bi Xθ
bi Xθ

49
a decline in the return to experience (age) that has become more pronounced with each
successive birth cohort. Traditional accounts of the return to experience, which has been
lower for women than for men, focus on the skill content of the job and on-the-job training,
so the decline is consistent with men moving to lower and lower skilled jobs. This decline
in the return to experience closely matches the decline in attachment to the labor force. Our
data are consistent with Aaronson’s (2001) account in which the decline in real wages and
in the return to experience led to a reduction in labor force participation among less edu-
cated workers. Here we also emphasize cascading effects on marriage, health, and mortality
from deaths of despair.
What our data show is that the patterns of mortality and morbidity for white non-
Hispanics without a college degree move together over lifetimes and birth cohorts, and that
they move in tandem with other social dysfunctions, including the decline of marriage, so-
cial isolation, and detachment from the labor force. Figure 3.3 suggests that there may be
two underlying factors, not one, but they are not very different, and we do not press that
decline in return to experincelog real wages
not in labor force
0.0
5.1
.15
.2.2
5pe
rcen
t not
in la
bor f
orce
coe
ffici
ents
0.0
01.0
02.0
03lo
g re
al w
age
coef
ficie
nts
1940 1950 1960 1970 1980year of birth
Labor market outcomes, white non-Hispanic men, less than BAFigure 3.4

50
conclusion. Whether these factors (or factor) are “the cause” is more a matter of semantics
than statistics. The factor could certainly represent some force that we have not identified,
or we could try to make a case that declining real wages is more fundamental than other
forces. Better, we can see globalization and automation as the underlying deep causes. Ulti-
mately, we see our story as about the collapse of the white, high school educated, working
class after its heyday in the early 1970s, and the pathologies that accompany that decline.
Citations
Aaronson, Stephanie, 2001, “Looking ahead: young men, wage growth, and labor market participa-tion,” FEDS Working Paper No. 2001−19. Available at SSRN: https://ssrn.com/ab-stract=268853 or http://dx.doi.org/10.2139/ssrn.268853
Aguiar, Mark, Mark Bils, Kerwin Charles and Erik Hurst, 2016, “Leisure and luxuries and the labor supply of young men,” http://www.ssc.wisc.edu/~nwilliam/Econ702_files/abch.pdf, accessed February 28, 2017.
Anderson, Carol, 2016, in Politico Magazine, “What’s going on with America’s white people?” http://www.politico.com/magazine/story/2016/09/problems-white-people-america-society-class-race-214227, accessed January 10, 2017.
Arias, Elizabeth, 2016, Changes in life expectancy by race and Hispanic origin in the United States, 2013–2014. NCHS data brief, no 244. Hyattsville, MD: National Center for Health Statistics.
Autor, David, David Dorn, and Gordon Hansen, 2017, “When work disappears: manufacturing de-cline and the falling marriage-market value of men,” Cambridge, MA. NBER Working Paper No. 23173, Feb.
Barnett, Michael L., Andrew L. Olenski and Anupam B. Jena, 2017, “Opioid-prescribing patterns of emergency physicians and risk of long-term use,” NEJM, 376(7), 663–73.
Begier, Beth, Wenhui Li and Gil Maduro, 2013, “Life expectancy among non-high-school graduates,” Health Affairs, 32(4), 822.
Bound, John, Arline Geronimus, Javier Rodriguez, and Timothy Waidman. 2014. “The Implications of Differential Trends in Mortality for Social Security Policy.” University of Michigan Retirement Research Center (MRRC) Working Paper, WP 2014-314. Ann Arbor, MI. http://www.mrrc.isr.umich.edu/publications/papers/pdf/wp314.pdf
Case, Anne and Angus Deaton, 2015, “Rising morbidity and mortality in midlife among white non-Hispanics Americans in the 21st century,” PNAS, December 8, 112(49), 15078−83.
Case, Anne and Angus Deaton, 2017, “Suicide, age, and wellbeing: an empirical investigation,” in Da-vid A Wise ed. Insights in the economics of aging, Chicago. Chicago University Press for NBER, 307−34.
Case, Anne, Angela Fertig and Christina Paxson, 2005. “The lasting impact of childhood health and circumstances,” Journal of Health Economics, 24, 365-89.
51
CDC Wonder. Underlying Cause of Death 1999–2015 [January 27, 2017], https://won-der.cdc.gov/wonder/help/ucd.html.
Cherlin, Andrew J., 2009, The marriage-go-round: the state of marriage and the family in America to-day. New York. Vintage.
Cherlin, Andrew J., 2014, Labor’s love lost: the rise and fall of the working class family in America, New York. Russell Sage.
Chetty, Raj, David Grusky, Maximilian Hell, Nathanial Hendren, Robert Manduca and Jimmy Narang, 2016, “The fading American dream: trends in absolute income mobility since 1940,” NBER Working Paper 22910 (Dec.)
Chetty, Raj, Michael Stepner, Sarah Abraham, Shelby Lin, Benjamin Scuderi, Nicholas Turner, Augus-tin Bergeron and David Cutler, 2016, “The Association between income and life expectancy in the United States, 2001–2014,” 315(16) 1750–66.
Coile, Courtney C., Philip B. Levine and Robin McKnight, 2014, “Recessions, older workers, and lon-gevity: how long are recessions good for your health?” American Economic Journal: Economic Policy, 6(3), 92−119.
Currie, Janet and Hannes Schwandt, 2016, “Inequality in mortality decreased among the young while increasing for older adults, 1990−2010,” Science, 10.1126/science.aafl437.
Cutler, David M, Angus Deaton, and Adriana Lleras-Muney, 2006, “The determinants of mortality,” Journal of Economic Perspectives, 20(3), 97–120.
Cutler, David M, Wei Huang and Adriana Lleras-Muney, 2016, “Economic conditions and mortality: evidence from 200 years of data,” NBER Working Paper 2260 (Sep.)
Deaton, Angus, 2003, “Health, inequality, and economic development,” Journal of Economic Litera-ture, 41(1): 113−58.
Deaton, Angus, 2013, The great escape: health, wealth, and the origins of inequality, Princeton. Princeton U. Press.
Deaton, Angus and Christina Paxson, 2001, “Mortality, education, income, and income inequality among American cohorts,” in David A. Wise, ed., Themes in the economics of aging, Chicago, Chi-cago U. Press, 129–70.
Deaton, Angus and Christina Paxson, 2004, “Mortality, income, and income inequality over time in Britain and the United States,” in David A. Wise, ed., Perspectives on the economics of aging, Chi-cago, Chicago U. Press, 247–80.
Eberstadt, Nicholas, 2016, Men without work: America’s invisible crisis, Templeton Press. Eberstadt, Nicholas, 2017, “Our miserable 21st century,” Commentary, February 15, Elo, Irma, and Samuel H. Preston, 1996, “Educational differences in mortality: United States, 1979–
85,” Social Science and Medicine, 42(1), 47–57. Flegal, Katherine M., Barry I. Graubard, David F. Williamson, and Mitchell H. Gail, 2005, “Excess
deaths associated with underweight, overweight, and obesity,” JAMA, 293(15), 1861−7. Fuchs, Victor, 2016, “Black gains in life expectancy,” JAMA, 316(18), 1869−70. Gelman, Andrew, and Jonathan Auerbach, 2016, “Age-aggregation bias in mortality trends,” PNAS,
113(7), E816−7.nd the Gruber, Jonathan, and David A. Wise, 2007, “Introduction,” in Social security programs and retire-
ment around the world: fiscal implications of reform,” eds., Gruber, Jonathan and Wise, David A., Chicago. Chicago University Press for NBER, 1–42.
Hershbein, Brad J., 2012, “Graduating high school in a recession: Work, education, and home production,” The B.E. Journal of Economic Analysis & Policy, 12(1) (Contributions), Article 3.
Hummer, Robert A. and Elaine M. Hernandez, 2013, “The effect of educational attainment on adult

52
mortality in the United States,” Population Bulletin, 68(1), 1−16. Kochanek Kenneth D, Elizabeth Arias and Brigham A. Bastian, The effect of changes in selected age-
specific causes of death on non-Hispanic white life expectancy between 2000 and 2014. NCHS data brief, no 250. Hyattsville, MD: National Center for Health Statistics.
Krueger, Alan B., 2016, “Where have all the workers gone?” Paper for Boston Fed. https://www.bostonfed.org/-/media/Documents/economic/conf/great-recovery-2016/Alan-B-Krueger.pdf (Accessed February 28th, 2017).
Lloyd-Jones, DM. 2016. Slowing Progress in Cardiovascular Mortality Rates, You Reap What You Sow. JAMA Cardiology 1(5), 599-600
Mackenbach, Johan P, Ivana Kulhánová, Barbara Artnik, Matthias Bopp, Carme Borrell, Tom Clem-ens, Giuseppe Costa, Chris Dibben, Ramune Kalediene, Olle Lundberg, Pekka Martikainen, Gwenn Menvielle, Olof Östergren, Remigijus Prochorskas, Maica Rodríguez-Sanz, Bjørn Heine Strand, Caspar W N Looman, Rianne de Gelder, 2016, “Changes in mortality inequalities over two decades: register based study of European countries,” BMJ, 353, i1732. http://dx.doi.org/10.1136/bmj.i1732.
Meara, Ellen R, Seth Richards and David M. Cutler, 2008, “The gap gets bigger: changes in mortality and life expectancy, by education, 1981−2000,” Health Affairs, DOI 10.1377/hltaff.27.2.350
Meara, Ellen, and Jonathan Skinner, 2015, “Losing ground at midlife in America,” PNAS, 112(14), 15006−7.
Murray, Charles, 2012, Coming apart: the state of white America, 1960–2010, New York, Crown Fo-rum.
National Academies of Sciences, Engineering, and Medicine, 2015, The Growing Gap in Life Expec-tancy by Income: Implications for Federal Programs and Policy Responses. Committee on the Long-Run Macroeconomic Effects of the Aging U.S. Population-Phase II. Committee on Popula-tion, Division of Behavioral and Social Sciences and Education. Board on Mathematical Sciences and Their Applications, Division on Engineering and Physical Sciences. Washington, DC: The Na-tional Academies Press.
National Center for Health Statistics, 2016, Health, United States, 2015: with special feature on racial and ethnic health disparities. Hyattsville, MD.
Ogburn, William F, and Dorothy S Thomas, 1922, “The influence of the business cycle on certain so-cial conditions,” Journal of the American Statistical Association, 18(139), 324–30.
Olshansky, S Jay, Douglas J. Passaro, Ronald C. Hershow, Jennifer Layden, Bruce A Carnes, Jacob Brody, Leonard Hayflick, Robert N Butler, David B. Allison and David S. Ludwig, 2005, “A poten-tial decline in life expectancy in the United States in the 21st century,” NEJM, 352(11), 1138−45.
Olshansky, S Jay, Toni Antonucci, Lisa Berkman, Robert H Binstock, Axel Boersch-Supan, John T Cacioppo, Bruce A Carnes, Laura L Carstensen, Linda P Fried, Dana P Goldman, James Jackson, Martin Kohli, John Rother, Yuhui Zheng, and John Rowe, 2012, “Differences in Life Expectancy due to Race and Educational Differences Are Widening, and Many May Not Catch up.” Health Af-fairs 31 (8): 1803–13.
Pierce, Justin R, and Peter K. Schott, 2016, “Trade liberalization and mortality: evidence from U.S. counties,” Cambridge, MA. NBER Working Paper No. 22849.
Preston, Samuel H, and Irma T Elo. 1995. “Are Educational Differentials in Adult Mortality Increas-ing in the United States?” Journal of Aging and Health 7 (4): 476–96.
Quinones, Sam, 2015, Dreamland: the true tale of America’s opiate epidemic, Bloomsbury. Regidor, Enrique, Fernando Vallejo, José A Tapia Granados, Francisco J Viciana–Fernández, Luis de
la Fuente, and Gregorio Barrio, 2016, “Mortality decrease according to socioeconomic groups
53
during the economic crisis in Spain: a cohort study of 36 million people,” The Lancet, 388, Nov, 2642–52.
Rostron, Brian L, John L. Boies, and Elizabeth Arias, 2010, Education reporting and classification on death certificates in the United States (Vital Health Statistics Series 2, No. 151). Hyattsville, MD: National Center for Health Statistics.
Ruhm, Christopher, 2000, “Are recessions good for your health?” Quarterly Journal of Economics, 115(2), 617–50.
Ruhm, Christopher, 2015, “Recessions, healthy no more?” Journal of Health Economics, 42, 17–28. Ryan, Harriet, Lisa Girion, and Scott Glover, 2016, “More than 1 million OxyContin pills ended up in
the hands of criminals and addicts. What the drugmaker knew,” Los Angeles Times, July 10, 2016.
Sasson, Isaac, 2016, “Trends in life expectancy and lifespan variation by educational attainment: United States, 1990−2010,” Demography, 53: 269−93.
Sen, Amartya K., 1998, “Mortality as an indicator of economic success or failure,” Economic Journal, 108(446), 1−25.
Stevens, Ann H., Douglas L. Miller, Marianne E. Page, and Mateusz Filipski, 2015, “The best of times, the worst of times: understanding pro-cyclical mortality,” American Economic Journal: Economic Policy, 7(4), 279–311
Stiglitz, Joseph E., 2015, “When inequality kills,” Project Syndicate, Dec 7. https://www.project-syn-dicate.org/commentary/lower-life-expectancy-white-americans-by-joseph-e--stiglitz-2015-12?barrier=accessreg
Stokes Andrew and Samuel H. Preston, 2017, “Deaths attributable to diabetes in the United States: Comparison of data sources and estimation approaches. PLoS ONE 12(1): e0170219. doi:10.1371/journal.pone.0170219
Sullivan Daniel and Till von Wachter, 2009, “Job displacement and mortality: an analysis using ad-ministrative data,” Quarterly Journal of Economics, 124(3), 1265−1306.
Wuthnow, Robert, 1998, After heaven: spirituality in America since the 1950s, University of Califor-nia Press.
Xu Jiaquan, Sherry L. Murphy, Kenneth D. Kochanek and Elizabeth Arias, 2016, Mortality in the United States, 2015. NCHS data brief, no 267. Hyattsville, MD: National Center for Health Statis-tics.

54
All-cause mortality by single year of age, US white non-Hispanics and comparison countries
USW
GER
FRA
UK
CAN
AUS
SWE
600
800
1000
1200
deat
hs p
er 1
00,0
00
1990 1995 2000 2005 2010 2015year
Age 60
USW
FRA
GER
UK
CAN
AUS
SWE
300
400
500
600
700
800
deat
hs p
er 1
00,0
00
1990 1995 2000 2005 2010 2015year
Age 55
USW
FRA
GER
UK
CANAUS
SWE
200
300
400
500
deat
hs p
er 1
00,0
00
1990 1995 2000 2005 2010 2015year
Age 50
USW
FRA
UK
GER
CANAUS
SWE
100
150
200
250
300
350
deat
hs p
er 1
00,0
00
1990 1995 2000 2005 2010 2015year
Age 45
USW
SWE
GER
CANFRA
UK
AUS
4060
8010
012
014
0de
aths
per
100
,000
1990 1995 2000 2005 2010 2015year
Age 30
USW
FRA
UK
AUSCAN
SWE
GER
5010
015
020
025
0de
aths
per
100
,000
1990 1995 2000 2005 2010 2015year
Age 40
Appendix Figure 1
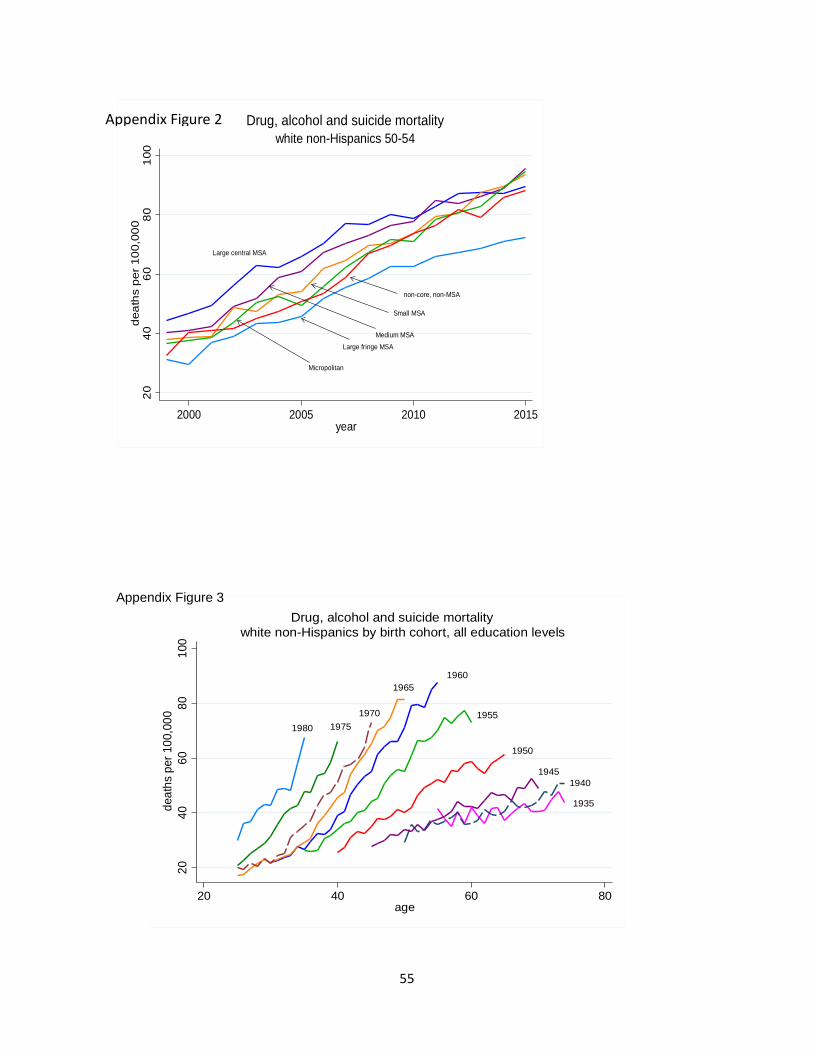
55
Large central MSA
Large fringe MSAMedium MSA
Small MSA
non-core, non-MSA
Micropolitan
2040
6080
100
deat
hs p
er 1
00,0
00
2000 2005 2010 2015year
white non-Hispanics 50-54Drug, alcohol and suicide mortalityAppendix Figure 2
1980 19751970
19651960
1955
1950
19451940
1935
2040
6080
100
deat
hs p
er 1
00,0
00
20 40 60 80age
white non-Hispanics by birth cohort, all education levelsDrug, alcohol and suicide mortality
Appendix Figure 3

56
men
women15
2025
3035
Lung
can
cer
deat
hs p
er 1
00,0
00
1990 1995 2000 2005 2010 2015Year
white non-Hispanic men and women
45-49
3040
5060
7080
Lung
can
cer
deat
hs p
er 1
00,0
00
1990 1995 2000 2005 2010 2015Year
white non-Hispanic men and women
50-54
6080
100
120
140
160
Lung
can
cer
deat
hs p
er 1
00,0
00
1990 1995 2000 2005 2010 2015Year
white non-Hispanic men and women
55-59
100
150
200
250
300
Lung
can
cer
deat
hs p
er 1
00,0
00
1990 1995 2000 2005 2010 2015Year
white non-Hispanic men and women
60-64
Lung cancer mortality rates, white non-Hispanic men and women Appendix Figure 4
black
white
120
130
140
150
160
deat
hs p
er 1
00,0
00, b
lack
(red
line
)
5052
5456
58w
hite
(blu
e lin
e)
2000 2005 2010 2015year
Heart disease mortality rates, women ages 50-54
black
white
.2.3
.4.5
fract
ion
obes
e
1995 2000 2005 2010 2015year
Obesity rates, women ages 50-54
black
white
200
250
300
350
deat
hs p
er 1
00,0
00, b
lack
(red
line
)
140
150
160
170
180
whi
te (b
lue
line)
2000 2005 2010 2015year
Heart disease mortality rates, men ages 50-54
black
white
.2.3
.4.5
fract
ion
obes
e
1995 2000 2005 2010 2015year
Obesity rates, men ages 50-54Appendix Figure 5

57
-.04
-.02
0.0
2.0
4.0
6ra
te o
f cha
nge
Cancer CLRD Heart disease Drugs, alc, suicide All-cause
HS SC BA HS SC BA HS SC BA HS SC BA HS SC BA
HS=High school or less, SC=Some college, BA=BA or more
white non-Hispanics ages 50-54Rate of change in mortality by education, 1999-2015Appendix Figure 6

58
Appendix Figure 7 White non-Hispanic mortality ages 50-54 by cause of death and education class
high school or less
some college
BA or more
02
04
06
0d
ea
ths
pe
r 1
00
,00
01990 1995 2000 2005 2010 2015
Survey year
Suicide
high school or less
some college
BA or more
02
04
06
0d
ea
ths
pe
r 1
00
,00
0
1990 1995 2000 2005 2010 2015Survey year
Drug and alcohol poisoning
BA or more
Some college
high school or less
02
04
06
0d
ea
ths
pe
r 1
00
,00
0
1990 1995 2000 2005 2010 2015Survey year
Alcoholic liver disease and cirrhosis

59
Median household income per member and all-cause mortality, white non-Hispanics by age group
Dea
ths p
er 1
00,0
00
Med
ian
inco
me
per h
ouse
hold
mem
ber $
2015
Appendix Figure 8
mortality
income
2500
026
000
2700
028
000
2900
0
200
210
220
230
1990 1995 2000 2005 2010 2015survey year
ages 40-44
mortality
income
3200
034
000
3600
038
000
4000
0
460
470
480
490
500
510
1990 1995 2000 2005 2010 2015Survey year
ages 50-54
mortality
income
2200
024
000
2600
028
000
3000
0
1400
1600
1800
2000
1990 1995 2000 2005 2010 2015Survey year
ages 65-69
mortality
income
2200
024
000
2600
028
000
145
150
155
160
165
170
1990 1995 2000 2005 2010 2015survey year
ages 35-39
mortality
income
3200
034
000
3600
038
000
4000
0
700
750
800
850
1990 1995 2000 2005 2010 2015Survey year
ages 55-59
mortality
income
2600
028
000
3000
032
000
3400
036
000
1000
1100
1200
1300
1400
1990 1995 2000 2005 2010 2015Survey year
ages 60-64
1980 1970
1960
1950
1940
1930
.05
.1.1
5.2
.25
.3pe
rcen
t not
in la
bor f
orce
25 35 45 55Age
Percent not in the labor force, white non-Hispanic men, all education groupsAppendix Figure 9