Embed Size (px)
Citation preview

1
Center Center and and
SpreadSpread
100
400
300
200
500
GraphsGraphs
100
400
300
200
500
Categorical Categorical DataData
100
400
300
200
500
Discussing Discussing DistributionDistribution
ss
100
400
300
200
500
Misc.Misc.
100
400
300
200
500
End Game

2Check Answer

3
What is x-bar = 32 What is x-bar = 32 grams and s = 2.54 grams and s = 2.54
grams?grams?

4Check Answer

5
Median and IQR Median and IQR because the data is because the data is
skewed. skewed.
Min = 3, Q1 = 35, M Min = 3, Q1 = 35, M = 47, Q3 = 65, Max = 47, Q3 = 65, Max
= 157= 157

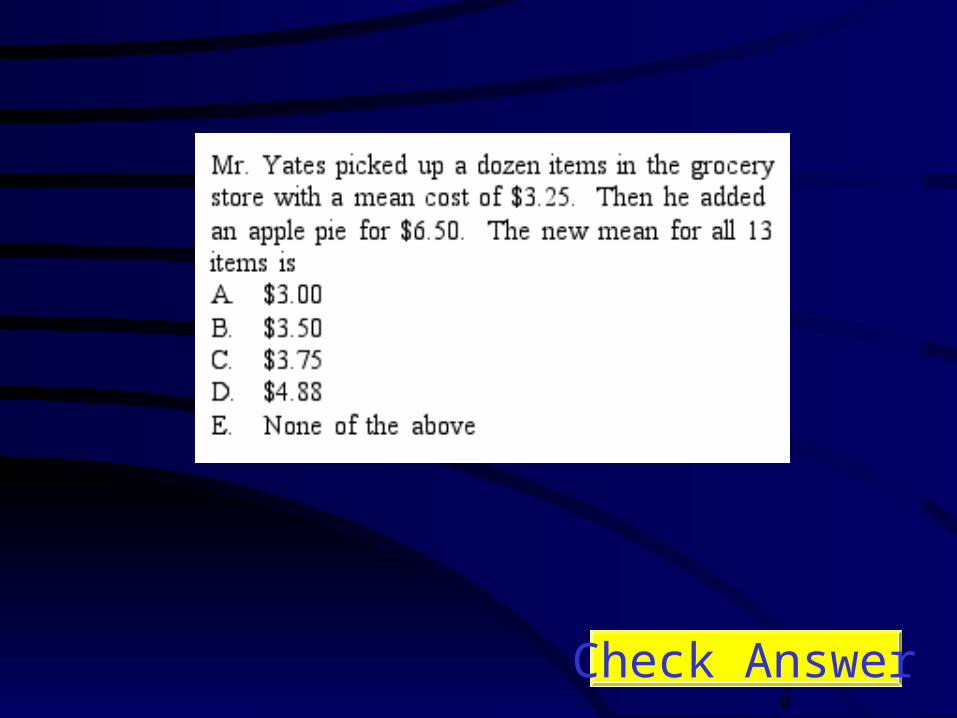
6Check Answer
7
Because the data is Because the data is skewed to the right skewed to the right
the mean will be the mean will be pulled towards the pulled towards the
larger values.larger values.

8Check Answer

9
What is C?What is C?
10
Check Answer

11
What is B?What is B?

12
Check Answer

13
What is D?What is D?

14
Check Answer

15
What is B?What is B?

16
Data of this kind can Data of this kind can be displayed using be displayed using
pie charts, bar pie charts, bar charts, or charts, or
segmented bar segmented bar chartscharts
Check Answer

17
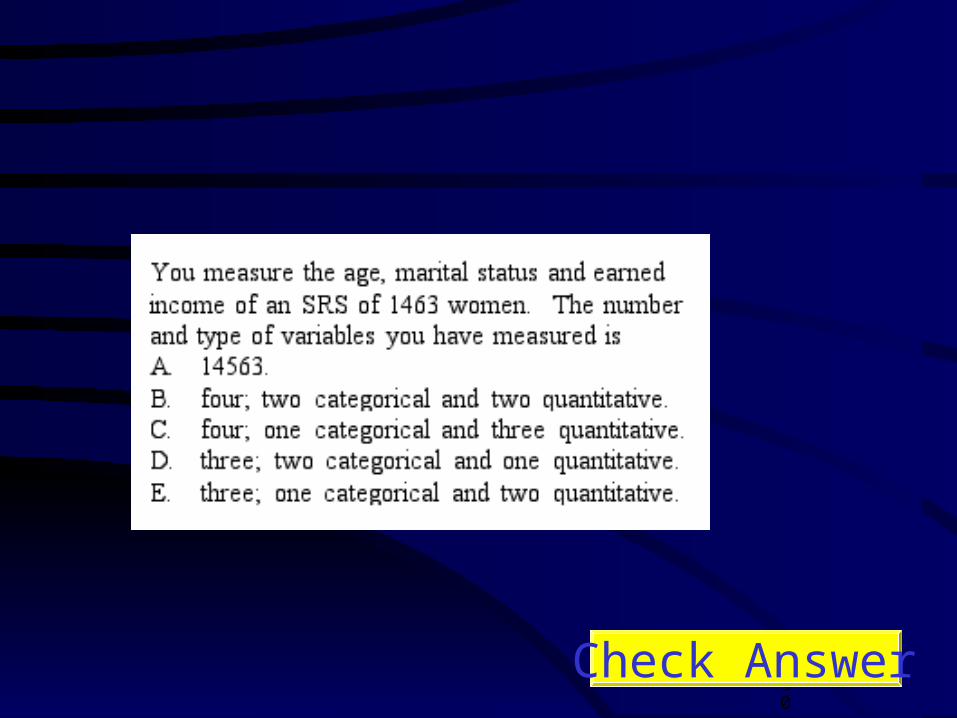
What is categorical What is categorical (qualitative) data?(qualitative) data?
300300

18
Check Answer

19
What is D?What is D?

20
Check Answer

21
What is C?What is C?

22
Check Answer

23
What is B?What is B?
24
Check Answer
25
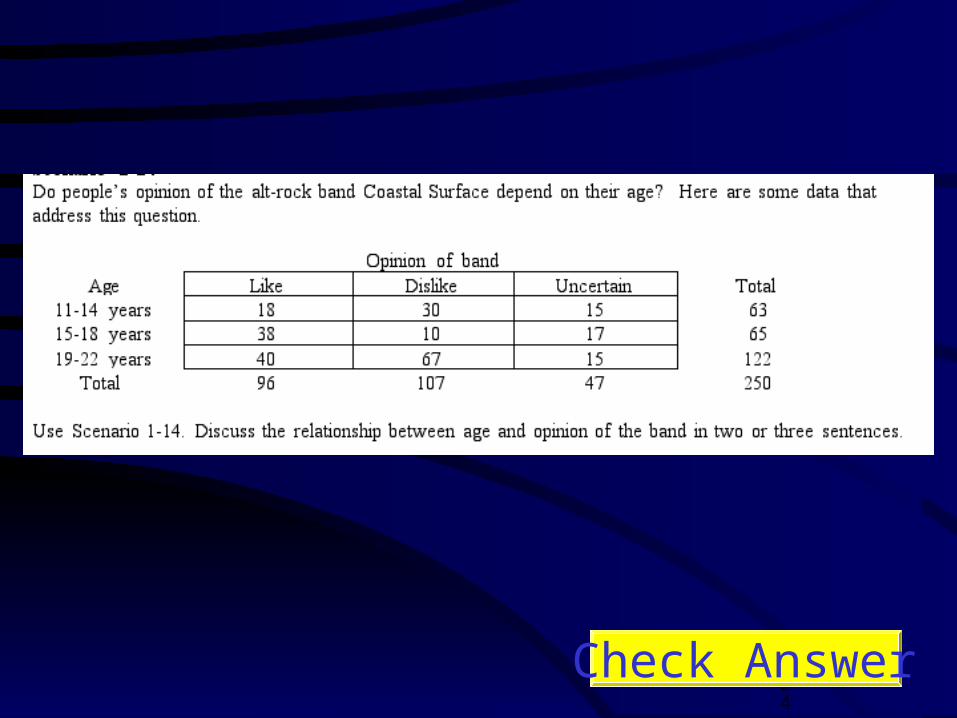
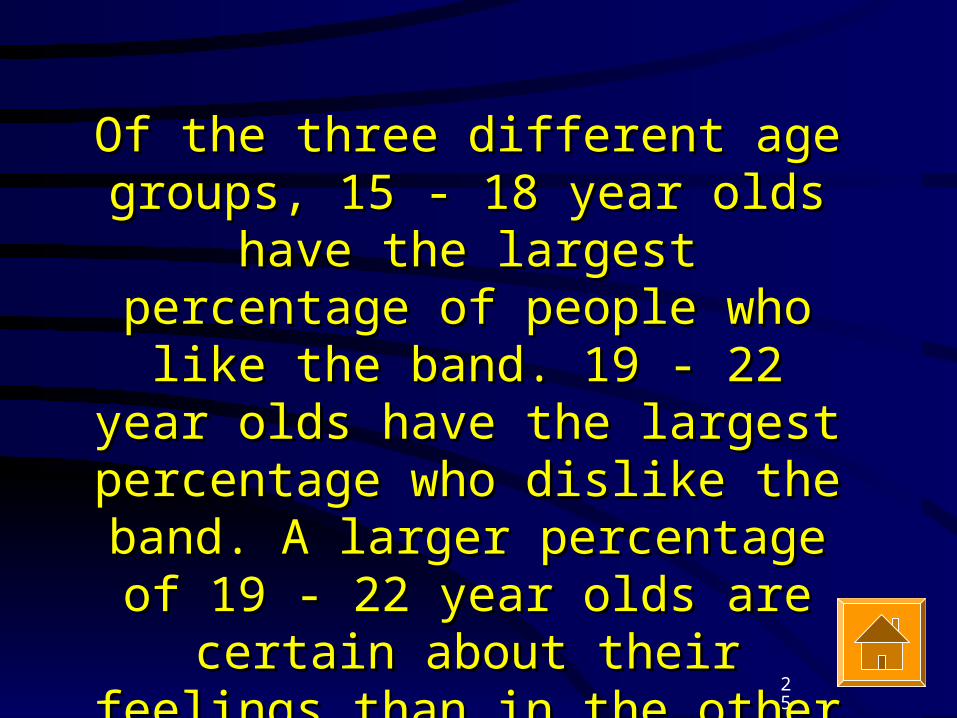
Of the three different age Of the three different age groups, 15 - 18 year olds have groups, 15 - 18 year olds have
the largest percentage of the largest percentage of people who like the band. 19 - people who like the band. 19 - 22 year olds have the largest 22 year olds have the largest percentage who dislike the percentage who dislike the
band. A larger percentage of 19 band. A larger percentage of 19 - 22 year olds are certain about - 22 year olds are certain about their feelings than in the other their feelings than in the other
two age groups.two age groups.

26
Check Answer

27
Monsters, Inc. has the largest percentage of moviegoers who prefer pepperoni pizza and the smallest percentage who enjoy meatball pizza. The Big Lebowski is the opposite of this with most people preferring meatball pizza and the fewest people preferring pepperoni pizza. While the majority of Men In Black viewers prefer pepperoni, the percentage is not as large as with Monsters, Inc.

28
Check Answer

29
1 - Virginia1 - Virginia
2 - Massachutes2 - Massachutes
3 / 4 - New York / 3 / 4 - New York / South CarolinaSouth Carolina
30
Check Answer

31
What is E?What is E?

32
Check Answer

33
The distribution of file sizes is skewed to the right with a median of approximately 2.5 megabytes. There are two gaps in the data, from 3 to approximately 4.5 an from about 6.2 to 7.5. The IQR is approximately 3 megabytes. There are no outliers.

34
Check Answer

35
The distribution of the angle of deformity is skewed to the right with a large gap between 40 and 50 degrees. The median is 25 degrees and the IQR is approximately 10 degrees. The 50 degree angle of deformity is an outlier.

36
Check Answer

37
The distribution of words recalled from rap music has a larger range than classical music, but it also has more outliers. The interquartile range of the rap music is smaller than the IQR of the classical music. The number of words recalled from rap music appears to have a roughly symmetrical distribution while classical music is skewed to the right. The median number of words recalled from classical music is less than the median number of words recalled from rap music.

38
Check Answer

39
0 2 4 6 8 10 12 14 16 18 20

40
Check Answer

41
What is E?What is E?

42
Check Answer

43
What is D?What is D?

44
Check Answer

45
What is B?What is B?

46
Check Answer

47
What is A?What is A?

48
Check Answer

49
What is D?What is D?

50
Check Answer
The units for The units for standard deviation standard deviation
are inches. The are inches. The units for variance units for variance
are:are:

51
What is inches What is inches squared?squared?