Embed Size (px)
Citation preview
317
Section 3 Floods in Thailand that caused a significant impact on trade environment, etc. of neighboring nations/regions, including Japan
1. Cause of last year’s floods in Thailand and measures to be taken in the future (1) 2011: the year that the world suffered large-scale natural disasters
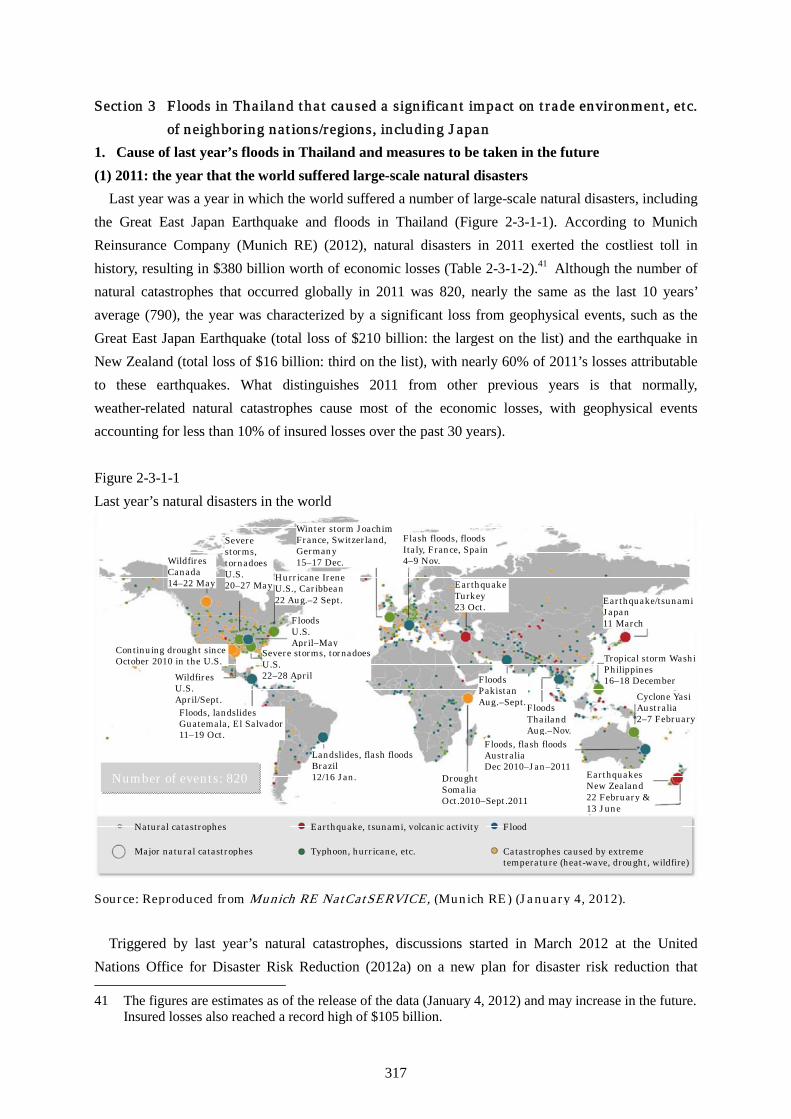
Last year was a year in which the world suffered a number of large-scale natural disasters, including the Great East Japan Earthquake and floods in Thailand (Figure 2-3-1-1). According to Munich Reinsurance Company (Munich RE) (2012), natural disasters in 2011 exerted the costliest toll in history, resulting in $380 billion worth of economic losses (Table 2-3-1-2).41 Although the number of natural catastrophes that occurred globally in 2011 was 820, nearly the same as the last 10 years’ average (790), the year was characterized by a significant loss from geophysical events, such as the Great East Japan Earthquake (total loss of $210 billion: the largest on the list) and the earthquake in New Zealand (total loss of $16 billion: third on the list), with nearly 60% of 2011’s losses attributable to these earthquakes. What distinguishes 2011 from other previous years is that normally, weather-related natural catastrophes cause most of the economic losses, with geophysical events accounting for less than 10% of insured losses over the past 30 years). Figure 2-3-1-1 Last year’s natural disasters in the world
WildfiresCanada 14–22 May
Severe storms, tornadoesU.S. 20–27 May
Winter storm JoachimFrance, Switzerland, Germany 15–17 Dec.
Hurricane Irene U.S., Caribbean 22 Aug.–2 Sept.
Flash floods, floods Italy, France, Spain4–9 Nov.
Source: Reproduced from Munich RE NatCatSERVICE, (Munich RE) (January 4, 2012).
EarthquakeTurkey 23 Oct.
Continuing drought since October 2010 in the U.S.
Floods U.S. April–May
WildfiresU.S. April/Sept.
Severe storms, tornadoesU.S. 22–28 April
Floods, landslides Guatemala, El Salvador11–19 Oct.
Number of events: 820
Landslides, flash floodsBrazil 12/16 Jan. Drought
Somalia Oct.2010–Sept.2011
Floods Pakistan Aug.–Sept.Floods
ThailandAug.–Nov.
Floods, flash floodsAustralia Dec 2010–Jan–2011
Earthquake/tsunamiJapan 11 March
Tropical storm WashiPhilippines 16–18 December
Cyclone YasiAustralia 2–7 February
EarthquakesNew Zealand22 February & 13 June
Natural catastrophes
Major natural catastrophes
Earthquake, tsunami, volcanic activity
Typhoon, hurricane, etc.
Flood
Catastrophes caused by extreme temperature (heat-wave, drought, wildfire)
Triggered by last year’s natural catastrophes, discussions started in March 2012 at the United Nations Office for Disaster Risk Reduction (2012a) on a new plan for disaster risk reduction that 41 The figures are estimates as of the release of the data (January 4, 2012) and may increase in the future.
Insured losses also reached a record high of $105 billion.
318
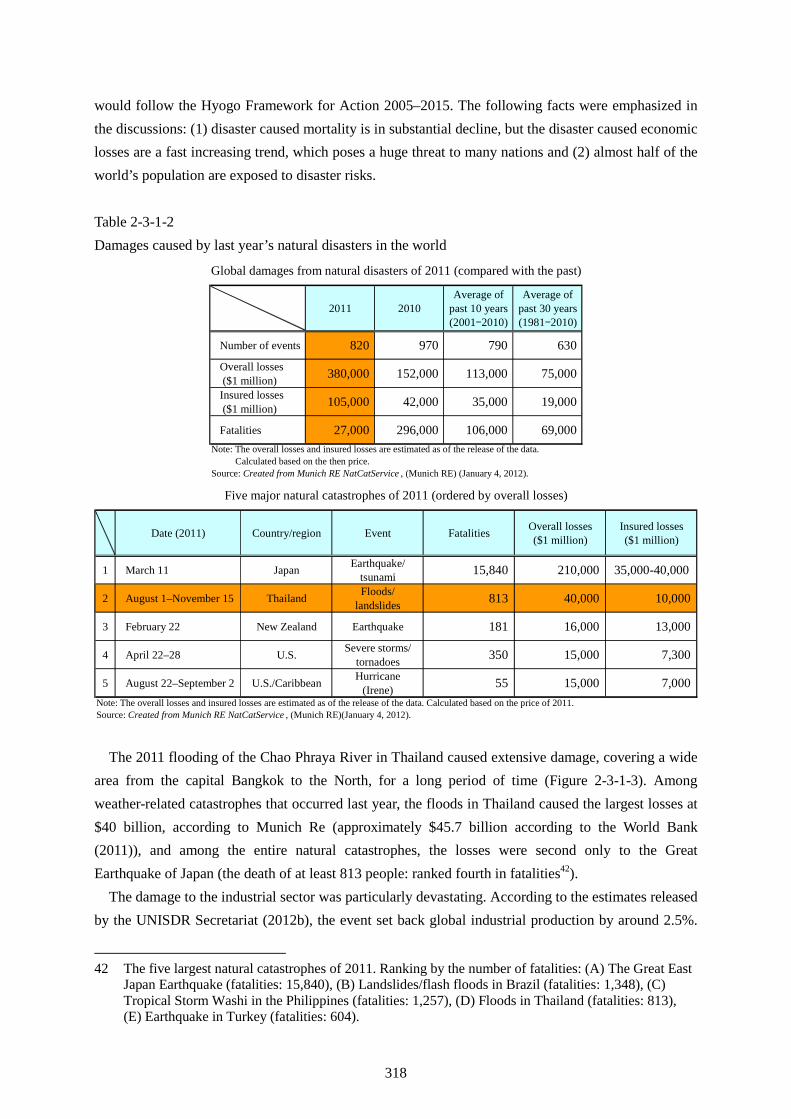
would follow the Hyogo Framework for Action 2005–2015. The following facts were emphasized in the discussions: (1) disaster caused mortality is in substantial decline, but the disaster caused economic losses are a fast increasing trend, which poses a huge threat to many nations and (2) almost half of the world’s population are exposed to disaster risks. Table 2-3-1-2 Damages caused by last year’s natural disasters in the world
2011 2010Average of
past 10 years(2001–2010)
Average of past 30 years(1981–2010)
Number of events 820 970 790 630
Overall losses ($1 million) 380,000 152,000 113,000 75,000
Insured losses ($1 million) 105,000 42,000 35,000 19,000
Fatalities 27,000 296,000 106,000 69,000Note: The overall losses and insured losses are estimated as of the release of the data.
Calculated based on the then price.Source: Created from Munich RE NatCatService , (Munich RE) (January 4, 2012).
Global damages from natural disasters of 2011 (compared with the past)
Date (2011) Country/region Event Fatalities Overall losses($1 million)
Insured losses($1 million)
1 March 11 Japan Earthquake/tsunami 15,840 210,000 35,000-40,000
2 August 1–November 15 Thailand Floods/landslides 813 40,000 10,000
3 February 22 New Zealand Earthquake 181 16,000 13,000
4 April 22–28 U.S. Severe storms/tornadoes 350 15,000 7,300
5 August 22–September 2 U.S./Caribbean Hurricane(Irene) 55 15,000 7,000
Note: The overall losses and insured losses are estimated as of the release of the data. Calculated based on the price of 2011.Source: Created from Munich RE NatCatService , (Munich RE)(January 4, 2012).
Five major natural catastrophes of 2011 (ordered by overall losses)
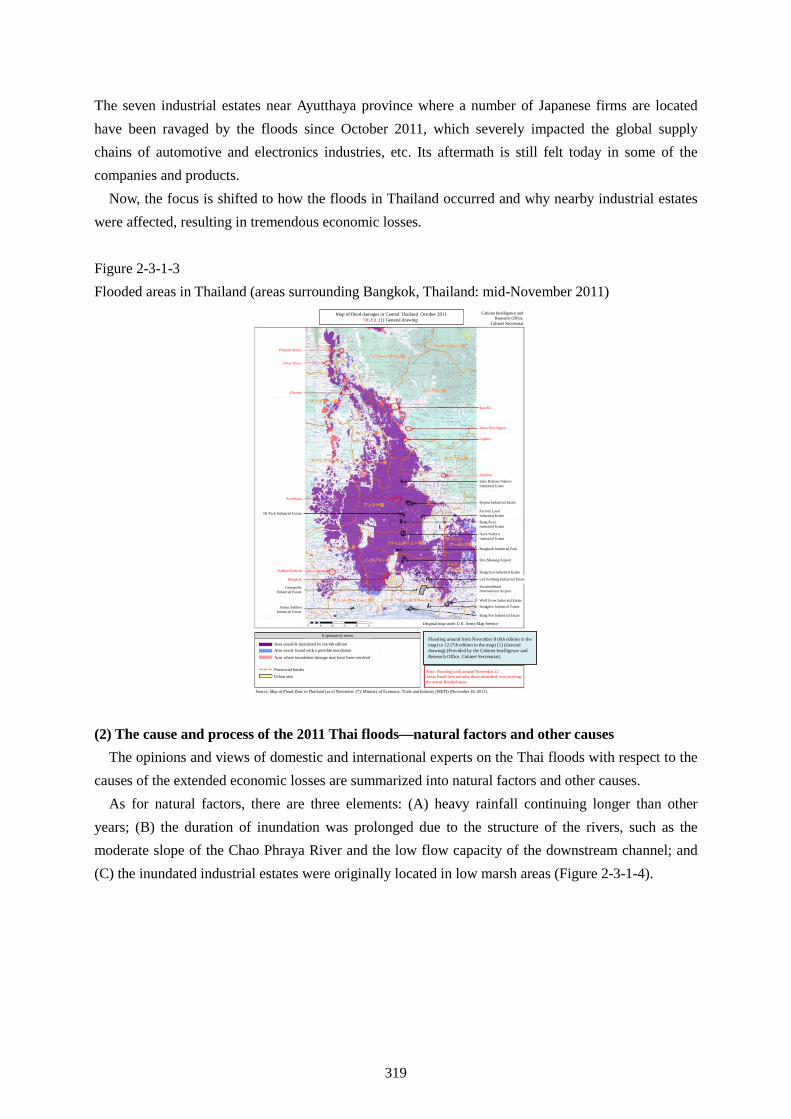
The 2011 flooding of the Chao Phraya River in Thailand caused extensive damage, covering a wide area from the capital Bangkok to the North, for a long period of time (Figure 2-3-1-3). Among weather-related catastrophes that occurred last year, the floods in Thailand caused the largest losses at $40 billion, according to Munich Re (approximately $45.7 billion according to the World Bank (2011)), and among the entire natural catastrophes, the losses were second only to the Great Earthquake of Japan (the death of at least 813 people: ranked fourth in fatalities42).
The damage to the industrial sector was particularly devastating. According to the estimates released by the UNISDR Secretariat (2012b), the event set back global industrial production by around 2.5%.
42 The five largest natural catastrophes of 2011. Ranking by the number of fatalities: (A) The Great East
Japan Earthquake (fatalities: 15,840), (B) Landslides/flash floods in Brazil (fatalities: 1,348), (C) Tropical Storm Washi in the Philippines (fatalities: 1,257), (D) Floods in Thailand (fatalities: 813), (E) Earthquake in Turkey (fatalities: 604).
319
The seven industrial estates near Ayutthaya province where a number of Japanese firms are located have been ravaged by the floods since October 2011, which severely impacted the global supply chains of automotive and electronics industries, etc. Its aftermath is still felt today in some of the companies and products.
Now, the focus is shifted to how the floods in Thailand occurred and why nearby industrial estates were affected, resulting in tremendous economic losses. Figure 2-3-1-3 Flooded areas in Thailand (areas surrounding Bangkok, Thailand: mid-November 2011)
Flooding around from November 8 (6th edition in the map) to 12 (7th edition in the map) (1) (General drawing) (Provided by the Cabinet Intelligence and Research Office, Cabinet Secretariat)
Map of flood damages in Central Thailand October 20117th Ed. (1) General drawing
Cabinet Intelligence and Research Office,
Cabinet Secretariat
Uthai Thani
Chainat
Ayutthaya
Hi-Tech Industrial Estate
Nakhon Pathom
Bangkok
GemopolisIndustrial Estate
Samut SakhonIndustrial Estate
Lopburi
Saraburi
Saha Rattana NakornIndustrial Estate
Rojena Industrial Estate
Factory Land Industrial Estate
Bang Pa-in Industrial Estate
Nava NakornIndustrial Estate
Bangkadi Industrial Park
Don Mueang Airport
Bangchan Industrial Estate
Lad Krabang Industrial Estate
SuvarnabhumiInternational Airport
Well Grow Industrial Estate
Bangplee Industrial Estate
Bang Poo Industrial Estate
Original map used: U.S. Army Map Service
Area possibly inundated by the 6th editionArea newly found with a possible inundation
Area where inundation damage may have been resolved
Provincial borderUrban area
Note: Flooding until around November 12Areas listed here are only those identified, not covering the actual flooded areas
Source: Map of Flood Zone in Thailand (as of November 17), Ministry of Economy, Trade and Industry (METI) (November 18, 2011).
Khao Phra Ngam
Ban Mi
Phayuha Khiri
Explanatory notes
(2) The cause and process of the 2011 Thai floods—natural factors and other causes The opinions and views of domestic and international experts on the Thai floods with respect to the
causes of the extended economic losses are summarized into natural factors and other causes. As for natural factors, there are three elements: (A) heavy rainfall continuing longer than other
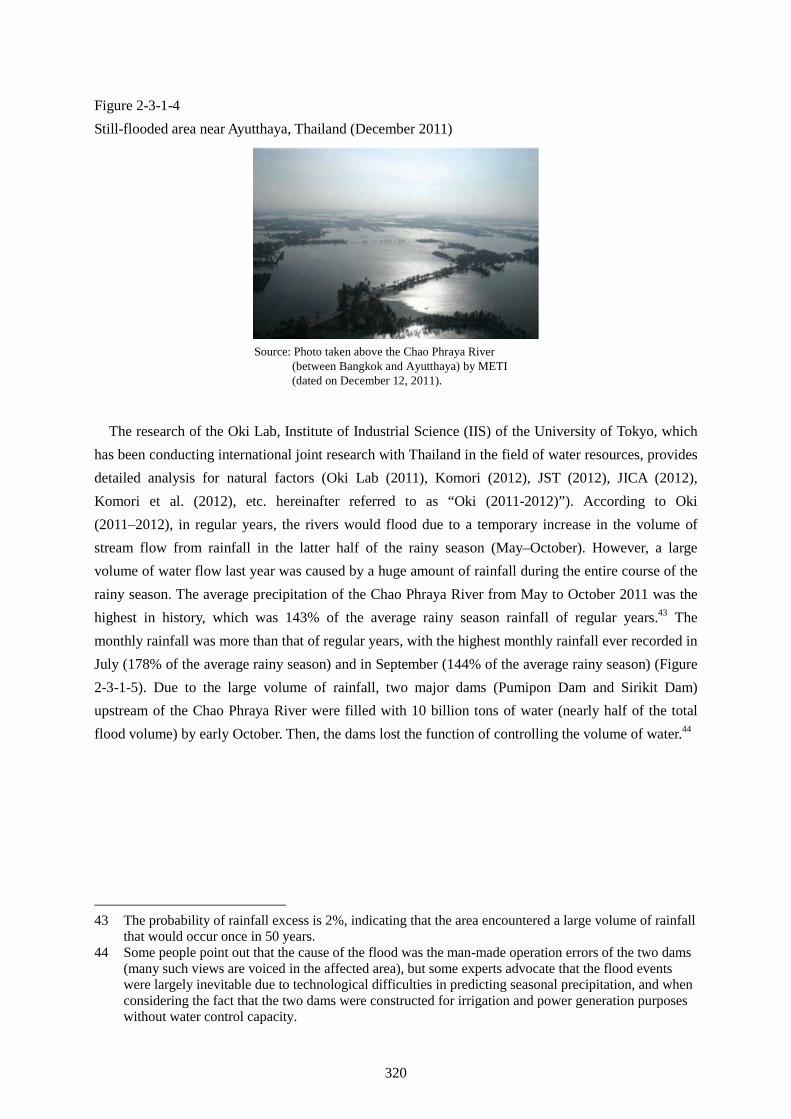
years; (B) the duration of inundation was prolonged due to the structure of the rivers, such as the moderate slope of the Chao Phraya River and the low flow capacity of the downstream channel; and (C) the inundated industrial estates were originally located in low marsh areas (Figure 2-3-1-4).
320
Figure 2-3-1-4 Still-flooded area near Ayutthaya, Thailand (December 2011)
Source: Photo taken above the Chao Phraya River (between Bangkok and Ayutthaya) by METI (dated on December 12, 2011).
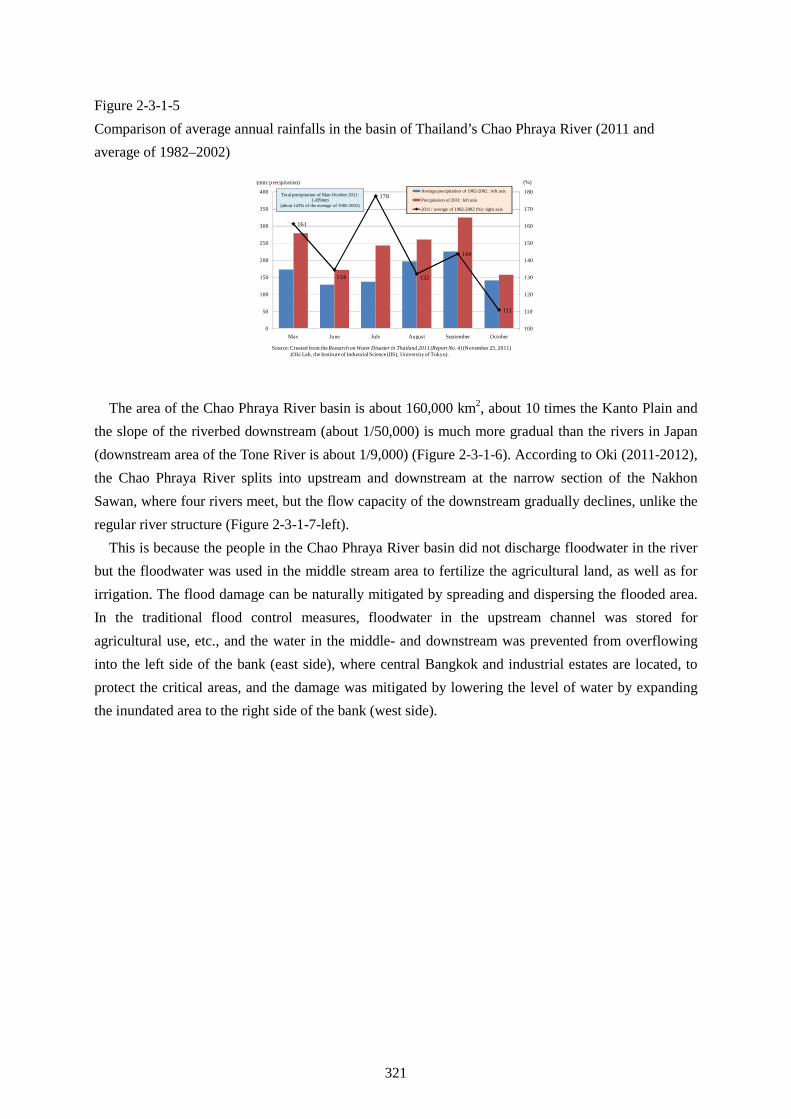
The research of the Oki Lab, Institute of Industrial Science (IIS) of the University of Tokyo, which has been conducting international joint research with Thailand in the field of water resources, provides detailed analysis for natural factors (Oki Lab (2011), Komori (2012), JST (2012), JICA (2012), Komori et al. (2012), etc. hereinafter referred to as “Oki (2011-2012)”). According to Oki (2011–2012), in regular years, the rivers would flood due to a temporary increase in the volume of stream flow from rainfall in the latter half of the rainy season (May–October). However, a large volume of water flow last year was caused by a huge amount of rainfall during the entire course of the rainy season. The average precipitation of the Chao Phraya River from May to October 2011 was the highest in history, which was 143% of the average rainy season rainfall of regular years.43 The monthly rainfall was more than that of regular years, with the highest monthly rainfall ever recorded in July (178% of the average rainy season) and in September (144% of the average rainy season) (Figure 2-3-1-5). Due to the large volume of rainfall, two major dams (Pumipon Dam and Sirikit Dam) upstream of the Chao Phraya River were filled with 10 billion tons of water (nearly half of the total flood volume) by early October. Then, the dams lost the function of controlling the volume of water.44
43 The probability of rainfall excess is 2%, indicating that the area encountered a large volume of rainfall that would occur once in 50 years.
44 Some people point out that the cause of the flood was the man-made operation errors of the two dams (many such views are voiced in the affected area), but some experts advocate that the flood events were largely inevitable due to technological difficulties in predicting seasonal precipitation, and when considering the fact that the two dams were constructed for irrigation and power generation purposes without water control capacity.
321
Figure 2-3-1-5 Comparison of average annual rainfalls in the basin of Thailand’s Chao Phraya River (2011 and average of 1982–2002)
161
134
178
132
144
111
100
110
120
130
140
150
160
170
180
0
50
100
150
200
250
300
350
400
May June July August September October
Average precipitation of 1982-2002 : left axis
Precipitation of 2011: left axis
2011 / average of 1982-2002 (%): right axis
(mm: precipitation) (%)
Source: Created from the Research on Water Disaster in Thailand 2011 (Report No. 4) (November 25, 2011)(Oki Lab, the Institute of Industrial Science (IIS), University of Tokyo).
Total precipitation of May-October 2011: 1,439mm
(about 143% of the average of 1982-2002)
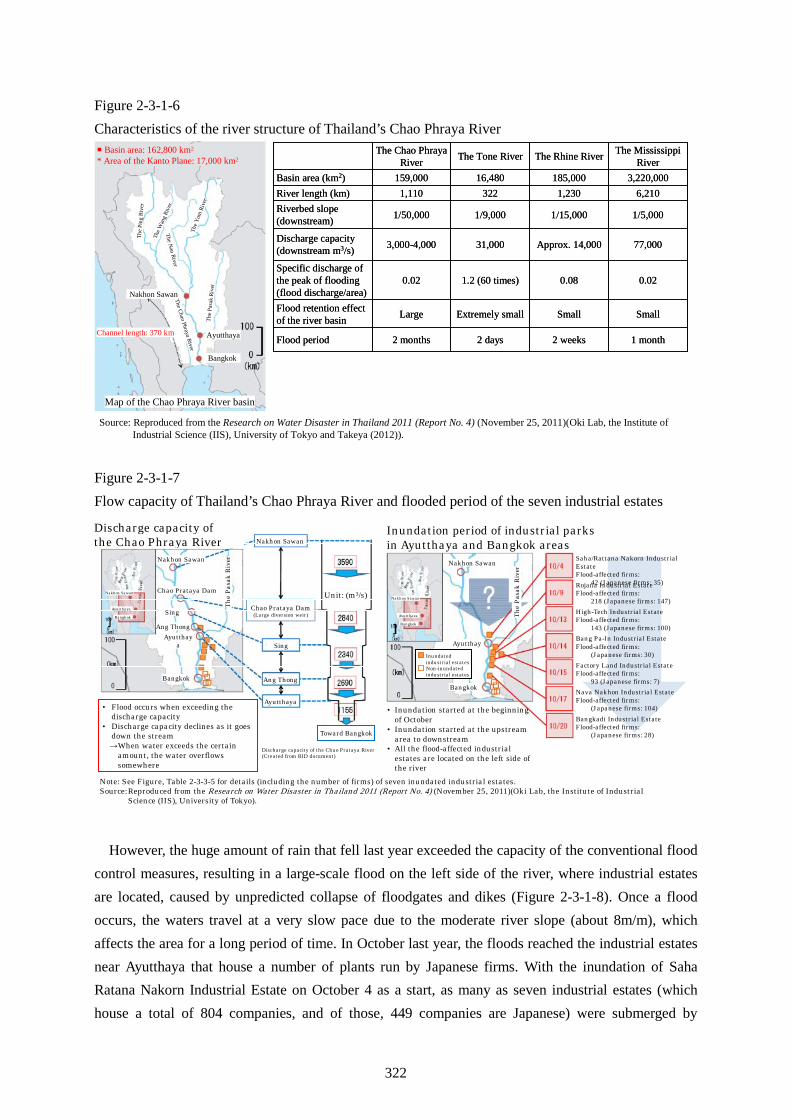
The area of the Chao Phraya River basin is about 160,000 km2, about 10 times the Kanto Plain and the slope of the riverbed downstream (about 1/50,000) is much more gradual than the rivers in Japan (downstream area of the Tone River is about 1/9,000) (Figure 2-3-1-6). According to Oki (2011-2012), the Chao Phraya River splits into upstream and downstream at the narrow section of the Nakhon Sawan, where four rivers meet, but the flow capacity of the downstream gradually declines, unlike the regular river structure (Figure 2-3-1-7-left).
This is because the people in the Chao Phraya River basin did not discharge floodwater in the river but the floodwater was used in the middle stream area to fertilize the agricultural land, as well as for irrigation. The flood damage can be naturally mitigated by spreading and dispersing the flooded area. In the traditional flood control measures, floodwater in the upstream channel was stored for agricultural use, etc., and the water in the middle- and downstream was prevented from overflowing into the left side of the bank (east side), where central Bangkok and industrial estates are located, to protect the critical areas, and the damage was mitigated by lowering the level of water by expanding the inundated area to the right side of the bank (west side).
322
Figure 2-3-1-6 Characteristics of the river structure of Thailand’s Chao Phraya River � Basin area: 162,800 km2
* Area of the Kanto Plane: 17,000 km2
The
Ping
Rive
r
The W
ang
Rive
r
The Y
omRi
ver
TheN
anRiver
Nakhon Sawan
The
Pasa
kRi
ver
Channel length: 370 km
TheChao
PhrayaRiver
Ayutthaya
Bangkok
Map of the Chao Phraya River basin
1 month2 weeks2 days2 monthsFlood period
SmallSmallExtremely smallLargeFlood retention effect of the river basin
0.020.081.2 (60 times)0.02Specific discharge of the peak of flooding (flood discharge/area)
77,000Approx. 14,00031,0003,000-4,000Discharge capacity (downstream m3/s)
1/5,0001/15,0001/9,0001/50,000Riverbed slope (downstream)
6,2101,2303221,110River length (km)3,220,000185,00016,480159,000Basin area (km2)
The Mississippi RiverThe Rhine RiverThe Tone RiverThe Chao Phraya
River
Source: Reproduced from the Research on Water Disaster in Thailand 2011 (Report No. 4) (November 25, 2011)(Oki Lab, the Institute of Industrial Science (IIS), University of Tokyo and Takeya (2012)).
Figure 2-3-1-7 Flow capacity of Thailand’s Chao Phraya River and flooded period of the seven industrial estates
Saha/Rattana Nakorn Industrial Estate Flood-affected firms:
42 (Japanese firms: 35) Rojana Industrial Estate Flood-affected firms:
218 (Japanese firms: 147)High-Tech Industrial Estate Flood-affected firms:
143 (Japanese firms: 100)Bang Pa-In Industrial Estate Flood-affected firms:
(Japanese firms: 30)Factory Land Industrial Estate Flood-affected firms:
93 (Japanese firms: 7)Nava Nakhon Industrial Estate Flood-affected firms:
(Japanese firms: 104)Bangkadi Industrial Estate Flood-affected firms:
(Japanese firms: 28)
Note: See Figure, Table 2-3-3-5 for details (including the number of firms) of seven inundated industrial estates. Source: Reproduced from the Research on Water Disaster in Thailand 2011 (Report No. 4) (November 25, 2011)(Oki Lab, the Institute of Industrial
Science (IIS), University of Tokyo).
• Inundation started at the beginning of October
• Inundation started at the upstream area to downstream
• All the flood-affected industrial estates are located on the left side of the river
Nakhon Sawan
AyutthayaInundated
industrial estatesNon-inundated industrial estates
Discharge capacity of the Chao Prataya River (Created from RID document)
Inundation period of industrial parks in Ayutthaya and Bangkok areas
Discharge capacity of the Chao Phraya River
Nakhon Sawan
Chao Prataya Dam
Sing
Ang Thong
Bangkok
Unit: (m3/s)
The
Pasa
kRi
ver
Ayutthaya
Bangkok
The
Pasa
kRi
ver
Nakhon Sawan
Chao Prataya Dam(Large diversion weir)
Sing
Ang Thong
Ayutthaya
Toward Bangkok
• Flood occurs when exceeding the discharge capacity
• Discharge capacity declines as it goes down the stream →When water exceeds the certain
amount, the water overflows somewhere
Nakhon Sawan
Ayutthaya
Bangkok
Nakhon Sawan
Ayutthaya
Bangkok
However, the huge amount of rain that fell last year exceeded the capacity of the conventional flood control measures, resulting in a large-scale flood on the left side of the river, where industrial estates are located, caused by unpredicted collapse of floodgates and dikes (Figure 2-3-1-8). Once a flood occurs, the waters travel at a very slow pace due to the moderate river slope (about 8m/m), which affects the area for a long period of time. In October last year, the floods reached the industrial estates near Ayutthaya that house a number of plants run by Japanese firms. With the inundation of Saha Ratana Nakorn Industrial Estate on October 4 as a start, as many as seven industrial estates (which house a total of 804 companies, and of those, 449 companies are Japanese) were submerged by
323
October 20 (Figure 2-3-1-7-right). It took quite some time for the waters to recede due to stagnant water. Water drainage started at the beginning of November and the drainage at the industrial estates completed in mid-December.
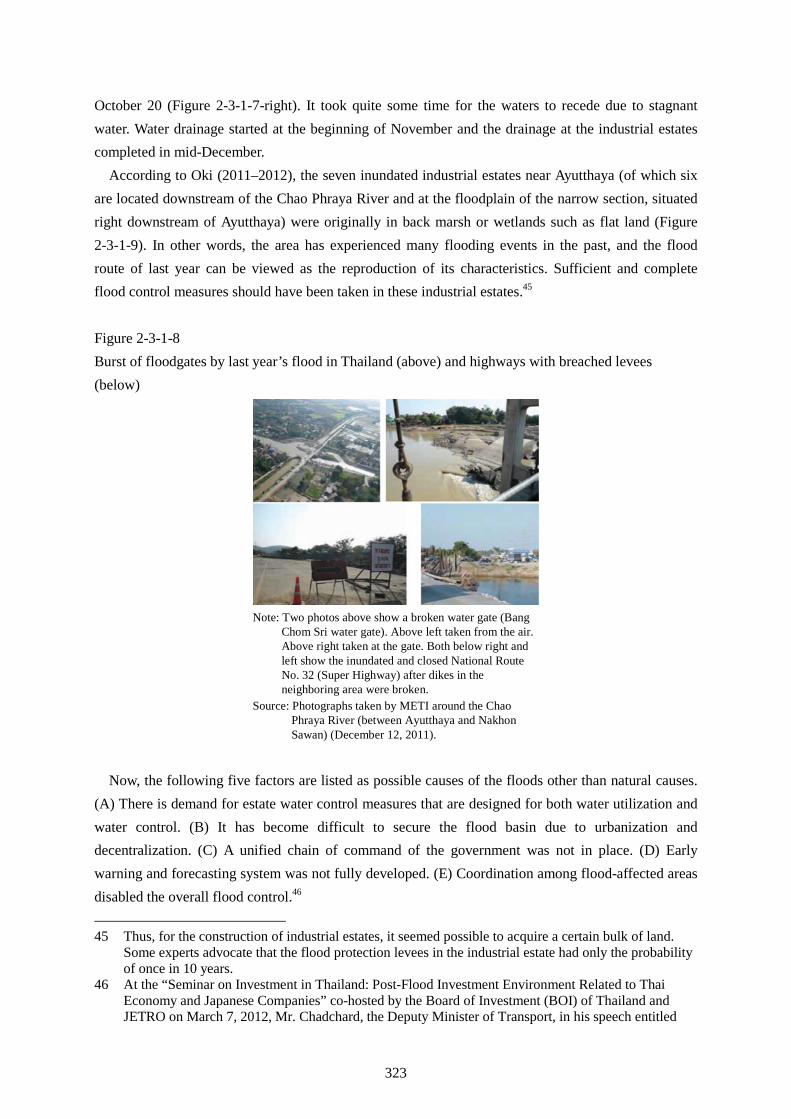
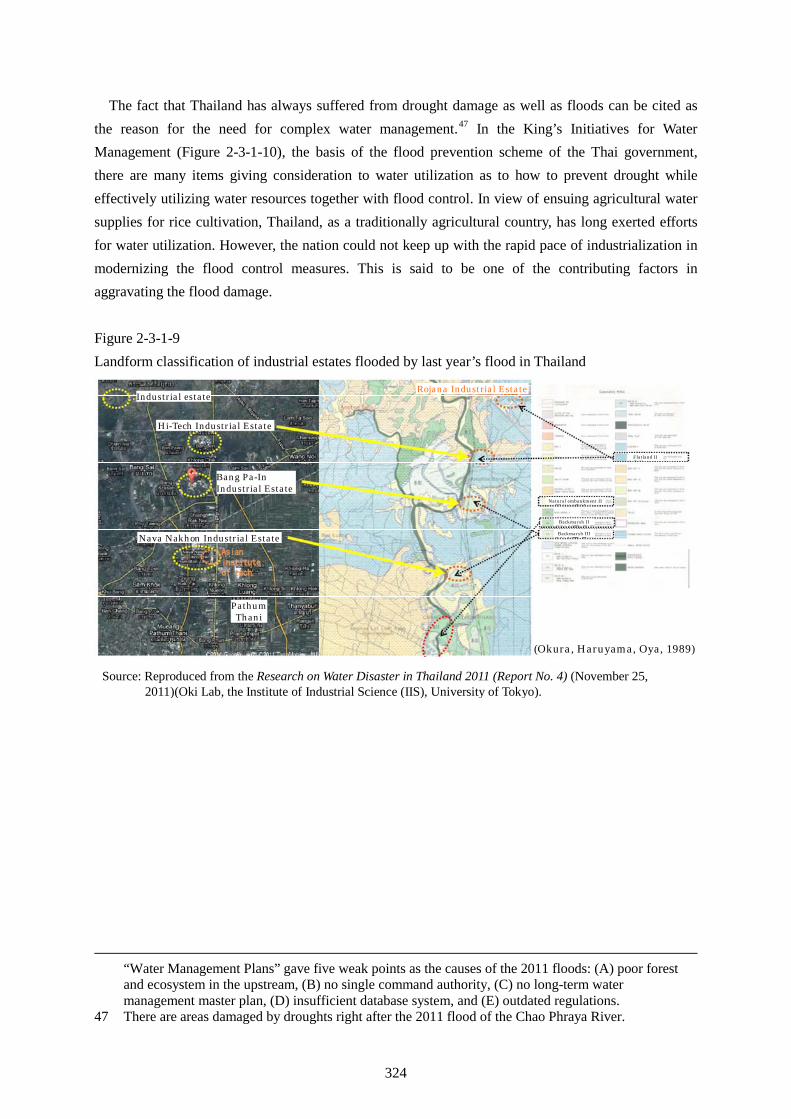
According to Oki (2011–2012), the seven inundated industrial estates near Ayutthaya (of which six are located downstream of the Chao Phraya River and at the floodplain of the narrow section, situated right downstream of Ayutthaya) were originally in back marsh or wetlands such as flat land (Figure 2-3-1-9). In other words, the area has experienced many flooding events in the past, and the flood route of last year can be viewed as the reproduction of its characteristics. Sufficient and complete flood control measures should have been taken in these industrial estates.45
Figure 2-3-1-8 Burst of floodgates by last year’s flood in Thailand (above) and highways with breached levees (below)
Note: Two photos above show a broken water gate (Bang Chom Sri water gate). Above left taken from the air. Above right taken at the gate. Both below right and left show the inundated and closed National Route No. 32 (Super Highway) after dikes in the neighboring area were broken.
Source: Photographs taken by METI around the ChaoPhraya River (between Ayutthaya and NakhonSawan) (December 12, 2011).
Now, the following five factors are listed as possible causes of the floods other than natural causes. (A) There is demand for estate water control measures that are designed for both water utilization and water control. (B) It has become difficult to secure the flood basin due to urbanization and decentralization. (C) A unified chain of command of the government was not in place. (D) Early warning and forecasting system was not fully developed. (E) Coordination among flood-affected areas disabled the overall flood control.46
45 Thus, for the construction of industrial estates, it seemed possible to acquire a certain bulk of land. Some experts advocate that the flood protection levees in the industrial estate had only the probability of once in 10 years.
46 At the “Seminar on Investment in Thailand: Post-Flood Investment Environment Related to Thai Economy and Japanese Companies” co-hosted by the Board of Investment (BOI) of Thailand and JETRO on March 7, 2012, Mr. Chadchard, the Deputy Minister of Transport, in his speech entitled
324
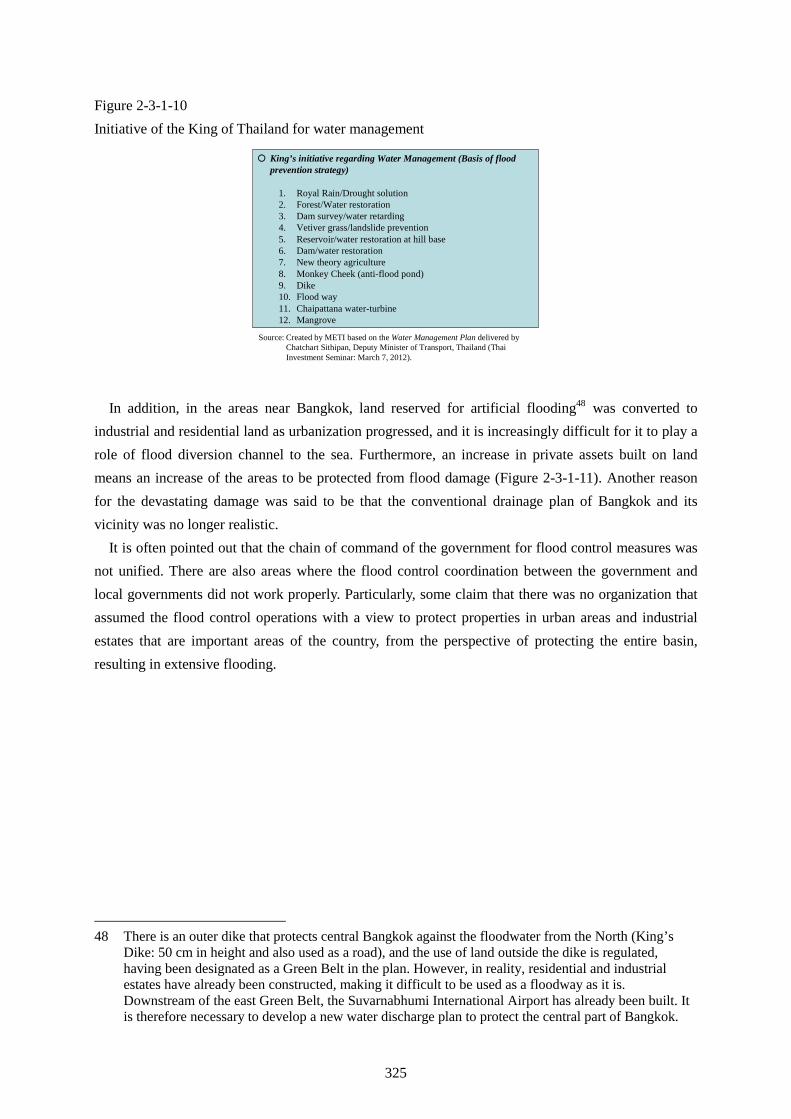
The fact that Thailand has always suffered from drought damage as well as floods can be cited as the reason for the need for complex water management.47 In the King’s Initiatives for Water Management (Figure 2-3-1-10), the basis of the flood prevention scheme of the Thai government, there are many items giving consideration to water utilization as to how to prevent drought while effectively utilizing water resources together with flood control. In view of ensuing agricultural water supplies for rice cultivation, Thailand, as a traditionally agricultural country, has long exerted efforts for water utilization. However, the nation could not keep up with the rapid pace of industrialization in modernizing the flood control measures. This is said to be one of the contributing factors in aggravating the flood damage. Figure 2-3-1-9 Landform classification of industrial estates flooded by last year’s flood in Thailand
Industrial estate
Hi-Tech Industrial Estate
Bang Pa-In Industrial Estate
Nava Nakhon Industrial Estate
Pathum Thani
Rojana Industrial Estate
Flatland II
Natural embankment II
Backmarsh II
Backmarsh III
(Okura, Haruyama, Oya, 1989)
Source: Reproduced from the Research on Water Disaster in Thailand 2011 (Report No. 4) (November 25, 2011)(Oki Lab, the Institute of Industrial Science (IIS), University of Tokyo).
“Water Management Plans” gave five weak points as the causes of the 2011 floods: (A) poor forest and ecosystem in the upstream, (B) no single command authority, (C) no long-term water management master plan, (D) insufficient database system, and (E) outdated regulations.
47 There are areas damaged by droughts right after the 2011 flood of the Chao Phraya River.
325
Figure 2-3-1-10 Initiative of the King of Thailand for water management
� King’s initiative regarding Water Management (Basis of flood prevention strategy)
1. Royal Rain/Drought solution2. Forest/Water restoration3. Dam survey/water retarding4. Vetiver grass/landslide prevention5. Reservoir/water restoration at hill base6. Dam/water restoration7. New theory agriculture8. Monkey Cheek (anti-flood pond)9. Dike10. Flood way11. Chaipattana water-turbine12. Mangrove
Source: Created by METI based on the Water Management Plan delivered by Chatchart Sithipan, Deputy Minister of Transport, Thailand (Thai Investment Seminar: March 7, 2012).
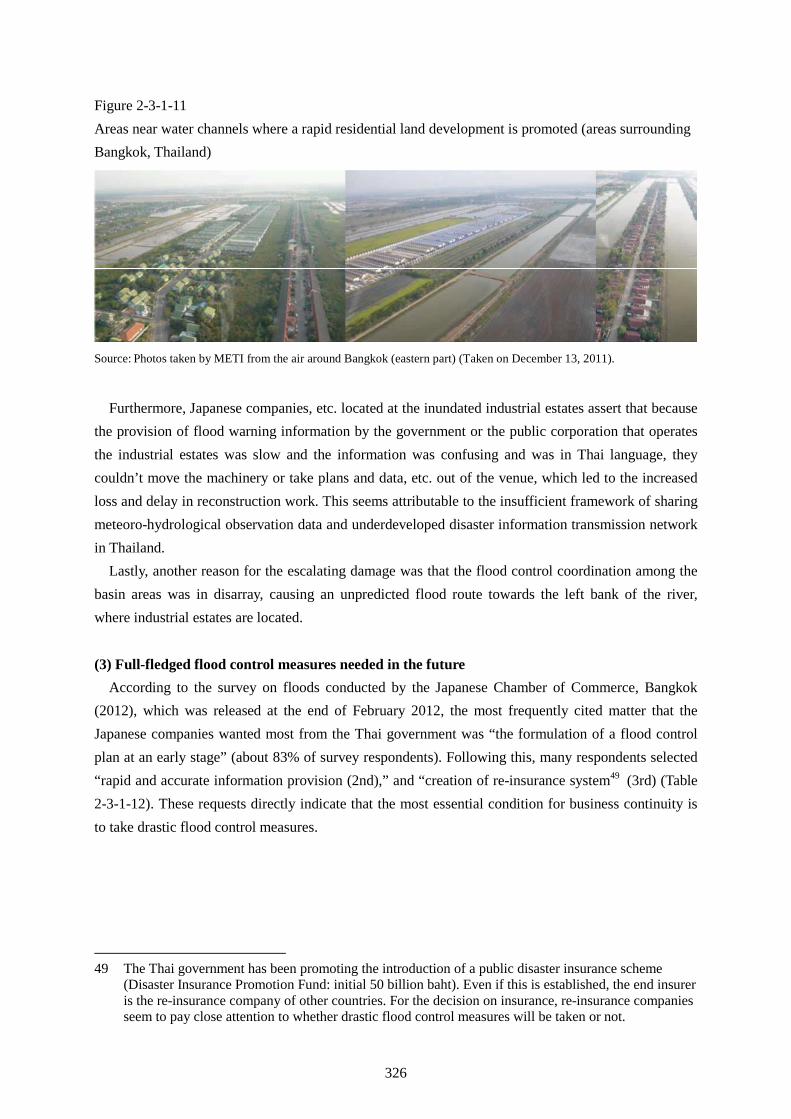
In addition, in the areas near Bangkok, land reserved for artificial flooding48 was converted to industrial and residential land as urbanization progressed, and it is increasingly difficult for it to play a role of flood diversion channel to the sea. Furthermore, an increase in private assets built on land means an increase of the areas to be protected from flood damage (Figure 2-3-1-11). Another reason for the devastating damage was said to be that the conventional drainage plan of Bangkok and its vicinity was no longer realistic.
It is often pointed out that the chain of command of the government for flood control measures was not unified. There are also areas where the flood control coordination between the government and local governments did not work properly. Particularly, some claim that there was no organization that assumed the flood control operations with a view to protect properties in urban areas and industrial estates that are important areas of the country, from the perspective of protecting the entire basin, resulting in extensive flooding.
48 There is an outer dike that protects central Bangkok against the floodwater from the North (King’s Dike: 50 cm in height and also used as a road), and the use of land outside the dike is regulated, having been designated as a Green Belt in the plan. However, in reality, residential and industrial estates have already been constructed, making it difficult to be used as a floodway as it is. Downstream of the east Green Belt, the Suvarnabhumi International Airport has already been built. It is therefore necessary to develop a new water discharge plan to protect the central part of Bangkok.
326
Figure 2-3-1-11 Areas near water channels where a rapid residential land development is promoted (areas surrounding Bangkok, Thailand)
Source: Photos taken by METI from the air around Bangkok (eastern part) (Taken on December 13, 2011).
Furthermore, Japanese companies, etc. located at the inundated industrial estates assert that because the provision of flood warning information by the government or the public corporation that operates the industrial estates was slow and the information was confusing and was in Thai language, they couldn’t move the machinery or take plans and data, etc. out of the venue, which led to the increased loss and delay in reconstruction work. This seems attributable to the insufficient framework of sharing meteoro-hydrological observation data and underdeveloped disaster information transmission network in Thailand.
Lastly, another reason for the escalating damage was that the flood control coordination among the basin areas was in disarray, causing an unpredicted flood route towards the left bank of the river, where industrial estates are located. (3) Full-fledged flood control measures needed in the future
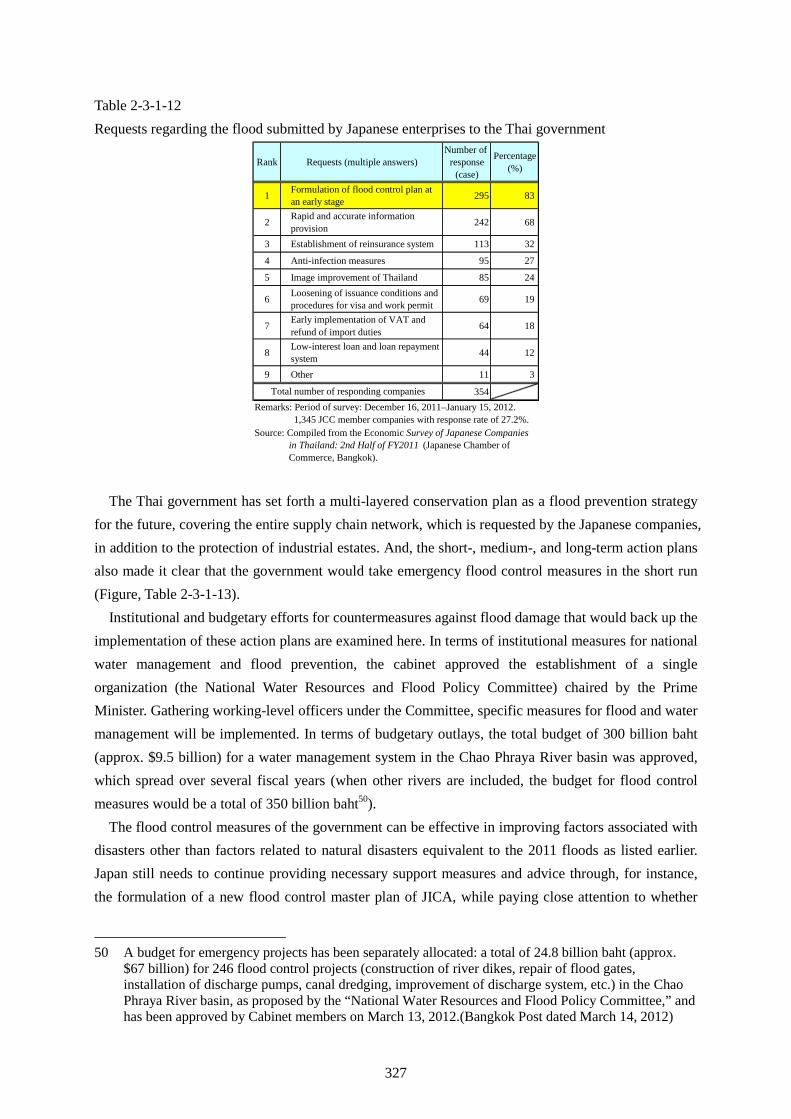
According to the survey on floods conducted by the Japanese Chamber of Commerce, Bangkok (2012), which was released at the end of February 2012, the most frequently cited matter that the Japanese companies wanted most from the Thai government was “the formulation of a flood control plan at an early stage” (about 83% of survey respondents). Following this, many respondents selected “rapid and accurate information provision (2nd),” and “creation of re-insurance system49 (3rd) (Table 2-3-1-12). These requests directly indicate that the most essential condition for business continuity is to take drastic flood control measures.
49 The Thai government has been promoting the introduction of a public disaster insurance scheme (Disaster Insurance Promotion Fund: initial 50 billion baht). Even if this is established, the end insurer is the re-insurance company of other countries. For the decision on insurance, re-insurance companies seem to pay close attention to whether drastic flood control measures will be taken or not.
327
Table 2-3-1-12 Requests regarding the flood submitted by Japanese enterprises to the Thai government
Rank Requests (multiple answers)Number of
response(case)
Percentage(%)
1 Formulation of flood control plan at an early stage 295 83
2 Rapid and accurate information provision 242 68
3 Establishment of reinsurance system 113 32
4 Anti-infection measures 95 27
5 Image improvement of Thailand 85 24
6 Loosening of issuance conditions and procedures for visa and work permit 69 19
7 Early implementation of VAT and refund of import duties 64 18
8 Low-interest loan and loan repayment system 44 12
9 Other 11 3
354Total number of responding companiesRemarks: Period of survey: December 16, 2011–January 15, 2012. 1,345 JCC member companies with response rate of 27.2%.Source: Compiled from the Economic Survey of Japanese Companies in Thailand: 2nd Half of FY2011 (Japanese Chamber of Commerce, Bangkok).
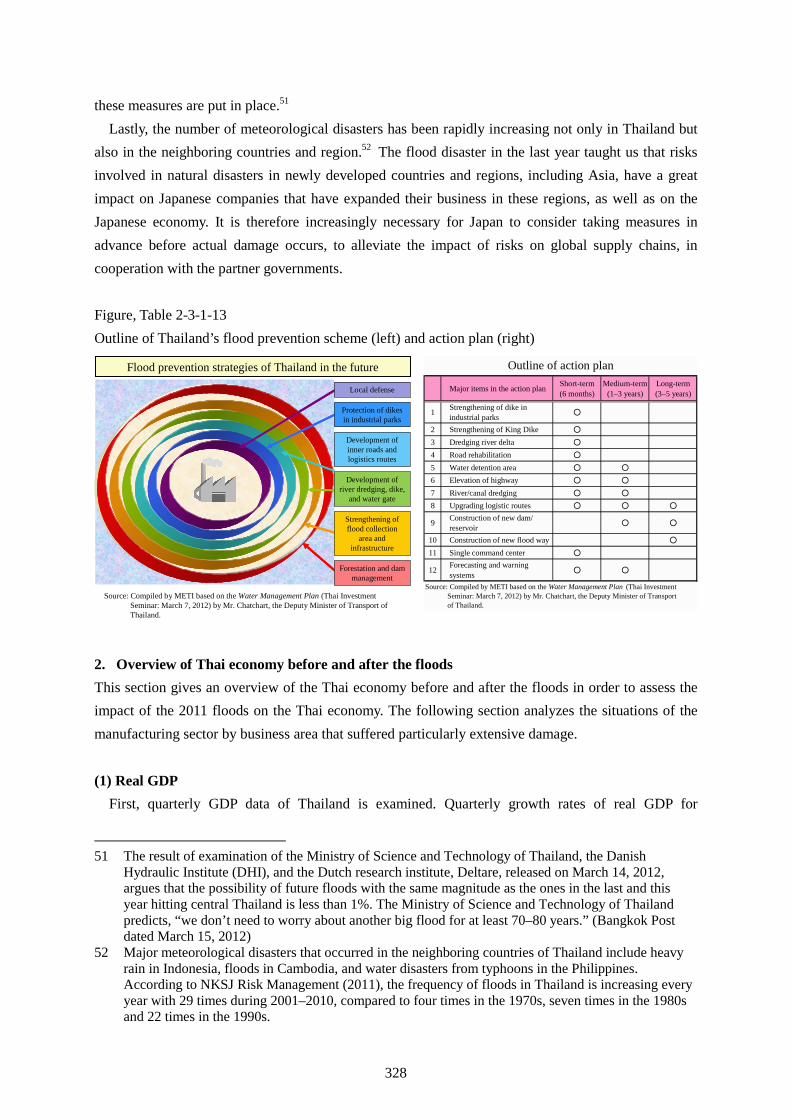
The Thai government has set forth a multi-layered conservation plan as a flood prevention strategy for the future, covering the entire supply chain network, which is requested by the Japanese companies, in addition to the protection of industrial estates. And, the short-, medium-, and long-term action plans also made it clear that the government would take emergency flood control measures in the short run (Figure, Table 2-3-1-13).
Institutional and budgetary efforts for countermeasures against flood damage that would back up the implementation of these action plans are examined here. In terms of institutional measures for national water management and flood prevention, the cabinet approved the establishment of a single organization (the National Water Resources and Flood Policy Committee) chaired by the Prime Minister. Gathering working-level officers under the Committee, specific measures for flood and water management will be implemented. In terms of budgetary outlays, the total budget of 300 billion baht (approx. $9.5 billion) for a water management system in the Chao Phraya River basin was approved, which spread over several fiscal years (when other rivers are included, the budget for flood control measures would be a total of 350 billion baht50).
The flood control measures of the government can be effective in improving factors associated with disasters other than factors related to natural disasters equivalent to the 2011 floods as listed earlier. Japan still needs to continue providing necessary support measures and advice through, for instance, the formulation of a new flood control master plan of JICA, while paying close attention to whether
50 A budget for emergency projects has been separately allocated: a total of 24.8 billion baht (approx.
$67 billion) for 246 flood control projects (construction of river dikes, repair of flood gates, installation of discharge pumps, canal dredging, improvement of discharge system, etc.) in the Chao Phraya River basin, as proposed by the “National Water Resources and Flood Policy Committee,” and has been approved by Cabinet members on March 13, 2012.(Bangkok Post dated March 14, 2012)
328
these measures are put in place.51
Lastly, the number of meteorological disasters has been rapidly increasing not only in Thailand but also in the neighboring countries and region.52 The flood disaster in the last year taught us that risks involved in natural disasters in newly developed countries and regions, including Asia, have a great impact on Japanese companies that have expanded their business in these regions, as well as on the Japanese economy. It is therefore increasingly necessary for Japan to consider taking measures in advance before actual damage occurs, to alleviate the impact of risks on global supply chains, in cooperation with the partner governments. Figure, Table 2-3-1-13 Outline of Thailand’s flood prevention scheme (left) and action plan (right)
Major items in the action plan Short-term(6 months)
Medium-term(1–3 years)
Long-term(3–5 years)
1 Strengthening of dike inindustrial parks ○
2 Strengthening of King Dike ○
3 Dredging river delta ○
4 Road rehabilitation ○
5 Water detention area ○ ○
6 Elevation of highway ○ ○
7 River/canal dredging ○ ○
8 Upgrading logistic routes ○ ○ ○
9 Construction of new dam/reservoir ○ ○
10 Construction of new flood way ○
11 Single command center ○
12 Forecasting and warningsystems ○ ○
Source: Compiled by METI based on the Water Management Plan (Thai Investment Seminar: March 7, 2012) by Mr. Chatchart, the Deputy Minister of Transport of Thailand.
Outline of action planFlood prevention strategies of Thailand in the future
Source: Compiled by METI based on the Water Management Plan (Thai Investment Seminar: March 7, 2012) by Mr. Chatchart, the Deputy Minister of Transport of Thailand.
Local defense
Protection of dikes in industrial parks
Development of inner roads and logistics routes
Development of river dredging, dike,
and water gate
Strengthening of flood collection
area and infrastructure
Forestation and dam management
2. Overview of Thai economy before and after the floods This section gives an overview of the Thai economy before and after the floods in order to assess the impact of the 2011 floods on the Thai economy. The following section analyzes the situations of the manufacturing sector by business area that suffered particularly extensive damage. (1) Real GDP
First, quarterly GDP data of Thailand is examined. Quarterly growth rates of real GDP for
51 The result of examination of the Ministry of Science and Technology of Thailand, the Danish
Hydraulic Institute (DHI), and the Dutch research institute, Deltare, released on March 14, 2012, argues that the possibility of future floods with the same magnitude as the ones in the last and this year hitting central Thailand is less than 1%. The Ministry of Science and Technology of Thailand predicts, “we don’t need to worry about another big flood for at least 70–80 years.” (Bangkok Post dated March 15, 2012)
52 Major meteorological disasters that occurred in the neighboring countries of Thailand include heavy rain in Indonesia, floods in Cambodia, and water disasters from typhoons in the Philippines. According to NKSJ Risk Management (2011), the frequency of floods in Thailand is increasing every year with 29 times during 2001–2010, compared to four times in the 1970s, seven times in the 1980s and 22 times in the 1990s.
329
October–December 2011 fell by 8.9% compared to the same period last year (original series), showing a sharp decline from the previous quarter (up by 3.7%). Compared with the same quarter of the previous year, seasonally adjusted GDP declined by 36.7%, which is a greater decline than January–March quarter of 1998 marked by the Asian financial crisis (down by 18.8%). As a result, real GDP growth rate in 2011 was up by 0.1%: a drastic decline from the high 7.8% growth in the previous year.
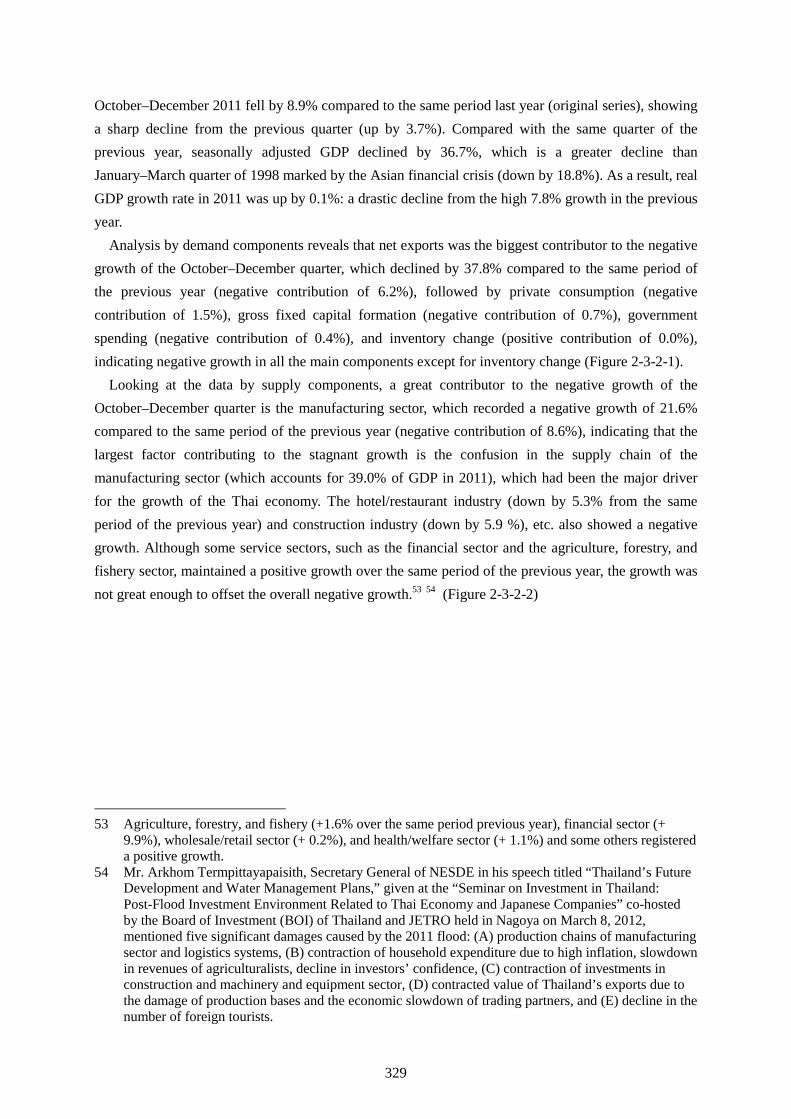
Analysis by demand components reveals that net exports was the biggest contributor to the negative growth of the October–December quarter, which declined by 37.8% compared to the same period of the previous year (negative contribution of 6.2%), followed by private consumption (negative contribution of 1.5%), gross fixed capital formation (negative contribution of 0.7%), government spending (negative contribution of 0.4%), and inventory change (positive contribution of 0.0%), indicating negative growth in all the main components except for inventory change (Figure 2-3-2-1).
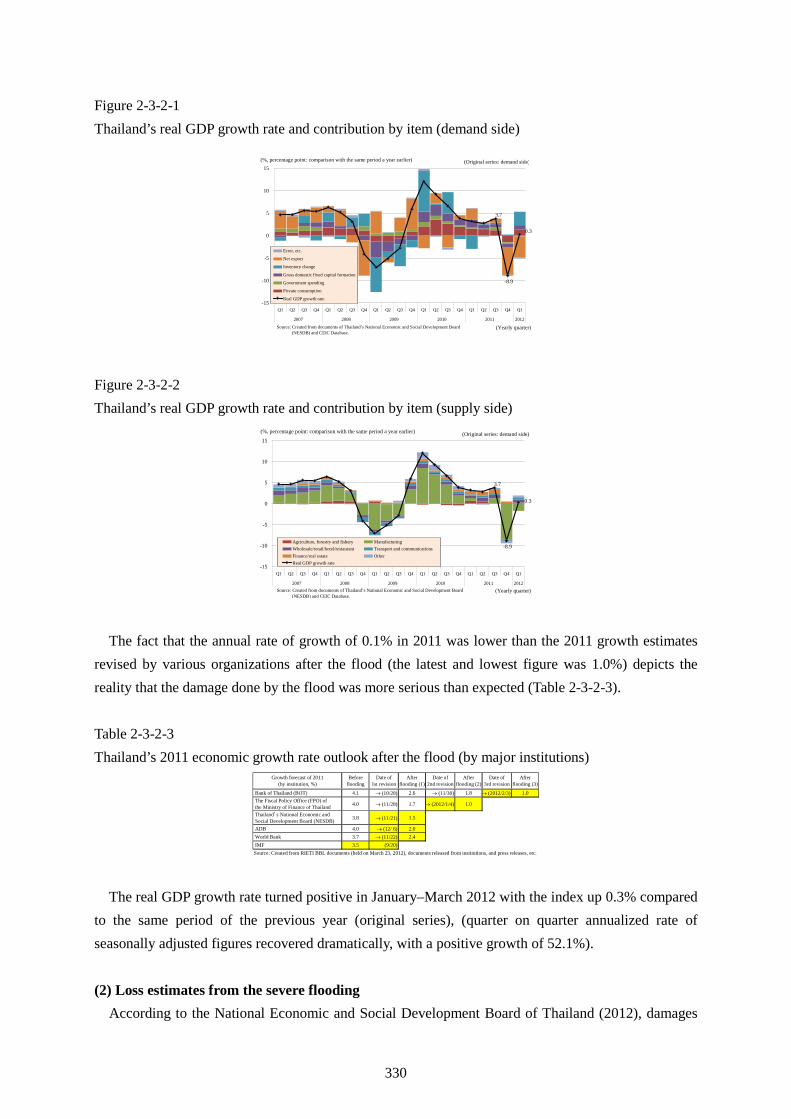
Looking at the data by supply components, a great contributor to the negative growth of the October–December quarter is the manufacturing sector, which recorded a negative growth of 21.6% compared to the same period of the previous year (negative contribution of 8.6%), indicating that the largest factor contributing to the stagnant growth is the confusion in the supply chain of the manufacturing sector (which accounts for 39.0% of GDP in 2011), which had been the major driver for the growth of the Thai economy. The hotel/restaurant industry (down by 5.3% from the same period of the previous year) and construction industry (down by 5.9 %), etc. also showed a negative growth. Although some service sectors, such as the financial sector and the agriculture, forestry, and fishery sector, maintained a positive growth over the same period of the previous year, the growth was not great enough to offset the overall negative growth.53 54 (Figure 2-3-2-2)
53 Agriculture, forestry, and fishery (+1.6% over the same period previous year), financial sector (+ 9.9%), wholesale/retail sector (+ 0.2%), and health/welfare sector (+ 1.1%) and some others registered a positive growth.
54 Mr. Arkhom Termpittayapaisith, Secretary General of NESDE in his speech titled “Thailand’s Future Development and Water Management Plans,” given at the “Seminar on Investment in Thailand: Post-Flood Investment Environment Related to Thai Economy and Japanese Companies” co-hosted by the Board of Investment (BOI) of Thailand and JETRO held in Nagoya on March 8, 2012, mentioned five significant damages caused by the 2011 flood: (A) production chains of manufacturing sector and logistics systems, (B) contraction of household expenditure due to high inflation, slowdown in revenues of agriculturalists, decline in investors’ confidence, (C) contraction of investments in construction and machinery and equipment sector, (D) contracted value of Thailand’s exports due to the damage of production bases and the economic slowdown of trading partners, and (E) decline in the number of foreign tourists.
330
Figure 2-3-2-1 Thailand’s real GDP growth rate and contribution by item (demand side)
3.7
-8.9
0.3
-15
-10
-5
0
5
10
15
Q1 Q2 Q3 Q4 Q1 Q2 Q3 Q4 Q1 Q2 Q3 Q4 Q1 Q2 Q3 Q4 Q1 Q2 Q3 Q4 Q1
2007 2008 2009 2010 2011 2012
Error, etc.
Net export
Inventory change
Gross domestic fixed capital formation
Government spending
Private consumption
Real GDP growth rate
Source: Created from documents of Thailand’s National Economic and Social Development Board(NESDB) and CEIC Database.
(%, percentage point: comparison with the same period a year earlier) (Original series: demand side)
(Yearly quarter)
Figure 2-3-2-2 Thailand’s real GDP growth rate and contribution by item (supply side)
3.7
-8.9
0.3
-15
-10
-5
0
5
10
15
Q1 Q2 Q3 Q4 Q1 Q2 Q3 Q4 Q1 Q2 Q3 Q4 Q1 Q2 Q3 Q4 Q1 Q2 Q3 Q4 Q1
2007 2008 2009 2010 2011 2012
Agriculture, forestry and fishery ManufacturingWholesale/retail/hotel/restaurant Transport and communicationsFinance/real estate OtherReal GDP growth rate
Source: Created from documents of Thailand’s National Economic and Social Development Board(NESDB) and CEIC Database.
(Original series: demand side)
(Yearly quarter)
(%, percentage point: comparison with the same period a year earlier)
The fact that the annual rate of growth of 0.1% in 2011 was lower than the 2011 growth estimates revised by various organizations after the flood (the latest and lowest figure was 1.0%) depicts the reality that the damage done by the flood was more serious than expected (Table 2-3-2-3). Table 2-3-2-3 Thailand’s 2011 economic growth rate outlook after the flood (by major institutions)
Growth forecast of 2011(by institution, %)
Beforeflooding
Date of1st revision
Afterflooding (1)
Date of2nd revision
Afterflooding (2)
Date of3rd revision
Afterflooding (3)
Bank of Thailand (BOT) 4.1 → (10/28) 2.6 → (11/30) 1.8 → (2012/2/3) 1.0 The Fiscal Policy Office (FPO) of the Ministry of Finance of Thailand 4.0 → (11/28) 1.7 → (2012/1/4) 1.0
Thailand’s National Economic and Social Development Board (NESDB) 3.8 → (11/21) 1.5
ADB 4.0 → (12/ 6) 2.0 World Bank 3.7 → (11/22) 2.4 IMF 3.5 (9/20)Source: Created from RIETI BBL documents (held on March 23, 2012), documents released from institutions, and press releases, etc.
The real GDP growth rate turned positive in January–March 2012 with the index up 0.3% compared to the same period of the previous year (original series), (quarter on quarter annualized rate of seasonally adjusted figures recovered dramatically, with a positive growth of 52.1%). (2) Loss estimates from the severe flooding
According to the National Economic and Social Development Board of Thailand (2012), damages
331
caused by the flooding to agriculture, manufacturing, and service sectors have reduced GDP (current market price basis) by approximately 328 billion baht (approximately ¥886 billion55), and pushed down the annual growth rate by 3.7% (thus, the originally estimated growth of 3.8% dropped to 0.1% growth). The damage to the manufacturing sector was particularly large, accounting for about 70% of the overall reduction in added value with 227 billion baht (approximately ¥ 613 billion).
According to the estimates of the World Bank (2011), mentioned earlier, the amount of damage (amount of damage to physical assets: about 630 billion baht) and the amount of loss (amount of loss in production and income: about 795 billion baht) caused by the floods as of December 1, 2011 was 1.425 trillion baht (about $45.7 billion, about ¥3.848 trillion) in total, of which the damage to manufacturing sector is estimated to be 1 trillion baht (about $32 billion, about ¥2.7 trillion) [the funds necessary for reconstruction are estimated to be 798 billion baht (about ¥2.155 trillion) in total].
According to the estimates of the Federation of Thai Industries (FTI) released in November 2011, the economic impact of the floods56 was 1.12 trillion baht (about ¥3.24 trillion), of which the manufacturing sector reported 475 billion baht (about ¥1.283 trillion) in loss. In particular, the seven inundated industrial estates marked a loss of 237 billion baht (about ¥640 billion).
Figures range widely depending on the timing/scope of the estimates and estimation method, etc.; nonetheless, as far as industry is concerned, the manufacturing sector incurred a much larger loss than originally projected.
(3) Production
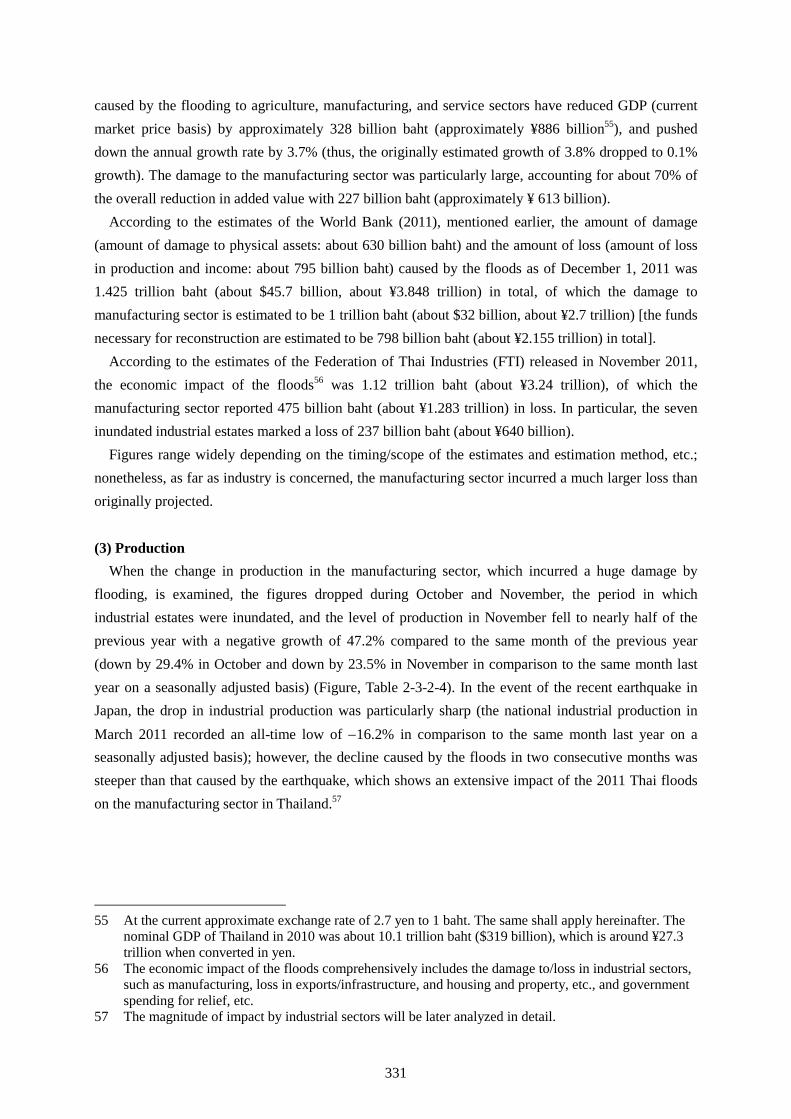
When the change in production in the manufacturing sector, which incurred a huge damage by flooding, is examined, the figures dropped during October and November, the period in which industrial estates were inundated, and the level of production in November fell to nearly half of the previous year with a negative growth of 47.2% compared to the same month of the previous year (down by 29.4% in October and down by 23.5% in November in comparison to the same month last year on a seasonally adjusted basis) (Figure, Table 2-3-2-4). In the event of the recent earthquake in Japan, the drop in industrial production was particularly sharp (the national industrial production in March 2011 recorded an all-time low of −16.2% in comparison to the same month last year on a seasonally adjusted basis); however, the decline caused by the floods in two consecutive months was steeper than that caused by the earthquake, which shows an extensive impact of the 2011 Thai floods on the manufacturing sector in Thailand.57
55 At the current approximate exchange rate of 2.7 yen to 1 baht. The same shall apply hereinafter. The nominal GDP of Thailand in 2010 was about 10.1 trillion baht ($319 billion), which is around ¥27.3 trillion when converted in yen.
56 The economic impact of the floods comprehensively includes the damage to/loss in industrial sectors, such as manufacturing, loss in exports/infrastructure, and housing and property, etc., and government spending for relief, etc.
57 The magnitude of impact by industrial sectors will be later analyzed in detail.
332
Figure, Table 2-3-2-4 Thailand’s manufacturing production index and trends before and after the flood
-50
-40
-30
-20
-10
0
10
20
30
40
50
1 2 3 4 5 6 7 8 9 101112 1 2 3 4 5 6 7 8 9 101112 1 2 3 4 5 6 7 8 9 101112 1 2 3 4 5 6 7 8 9 101112 1 2 3
2008 2009 2010 2011 2012
40
45
50
55
60
65
70
75
80
85
90Capacity utilization ratio (original series): right axis
Manufacturing production index (seasonally adjusted: Comparison with the previous month): left axis
Manufacturing production index (original series: comparison with the same period a year earlier): lefti
Manufacturing Production Index of Thailand (after 2008)
Source: Created from documents of the Office of Industrial Economics (OIE) of Thailand.
(%)
(Month/Year)
(%) Original series(comparison withthe same montha year earlier)
(%)
Seasonally adjusted(comparison with
the previous month)(%)
Capacity utilizationratio
(original series)(%)
7 -0.7 -4.1 63.1
8 6.8 6.2 65.0
9 -0.3 -3.8 65.5
10 -30.1 -29.4 46.4
11 -47.2 -23.5 40.5
12 -25.3 40.4 51.9
1 -15.0 16.3 58.5
2 -3.2 10.2 62.5
3 -3.2 -4.3 68.1Note: Shaded columns indicate month recording a decline in the seasonally adjusted figures from the previous month.Source: Created from the documents of the Office of Industrial Economics (OIE) of Thailand.
Year/month
2011
2012
It is clear that the production level rapidly recovered after mid-December 2011 when the drainage of the industrial estates completed, due to the reconstruction work exerted by all concerned parties. The negative growth compared to the same month last year was dramatically narrowed (recovered to −3.2% in March 2012) and the month-to-month comparison increased for three consecutive months from December 2011 to February 2012. The capacity utilization ratio temporarily fell to nearly 40% due to operation suspension and production adjustment caused by direct and indirect flood damages. But it returned to over 60% of the period before the floods.58 With this, the level of production expanded by about 80% from the lowest production level recorded in November 2011, and as of February 2012, which recorded the latest peak, the production already recovered to about 93.4% of August 2011, the highest level before the extensive flood damage. Recovery activities of disaster-stricken companies are still under way, and the production is expected to continue expanding for some time in the future. (4) Trade
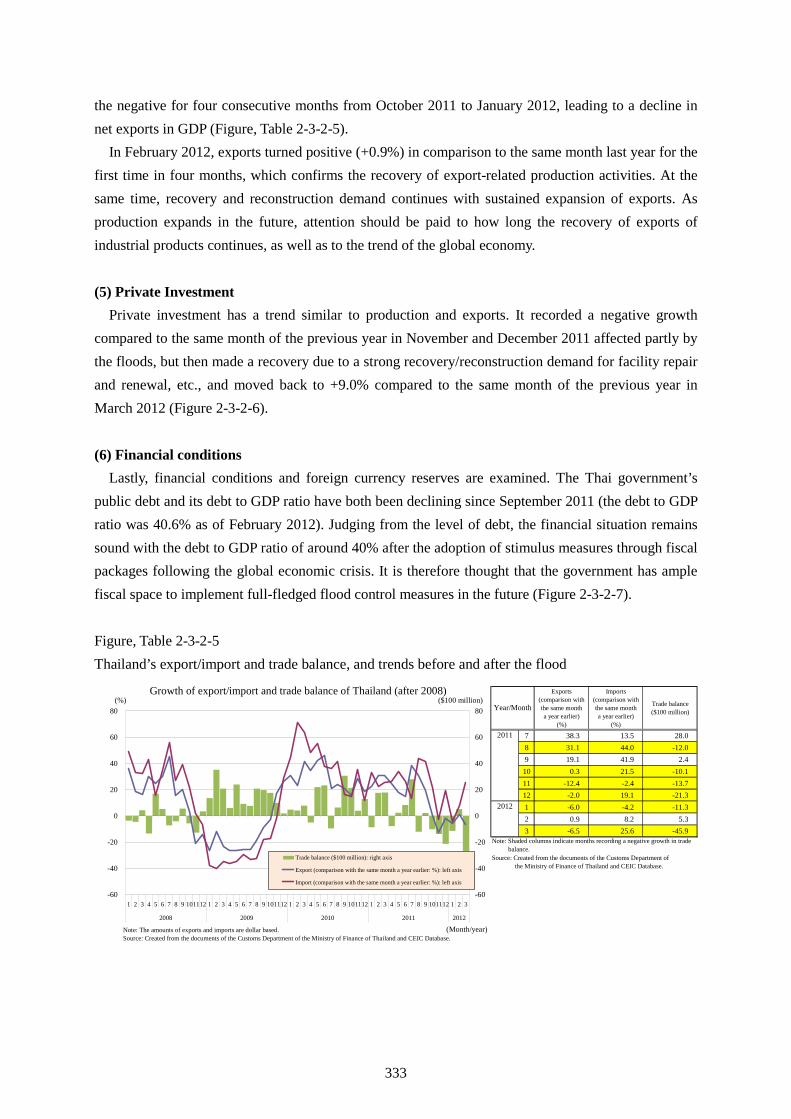
The floods made a significant impact on trade, in addition to the decline in the level of domestic production. Exports registered a negative growth compared to the corresponding month the previous year for three consecutive months from November 2011 to January 2012 due to the decline in the amount of exports of major industrial products affected mainly by the floods and the global economic downturn. On the other hand, imports did not decline much due to an increase in the amount of imports of consumer products and transportation machinery, etc., reflecting sluggish domestic production, and due to an increase in the amount of imports of machinery, reflecting reconstruction demand during the latter half of the period. Thus, imports recorded no huge negative growth; instead, huge positive growth has even been observed in some months. As a result, trade balance remained in 58 The capacity utilization ratio of October–November 2011 was lower than the lowest level (49.8%)
recorded at the time of the Global Financial Crisis (February 2009).
333
the negative for four consecutive months from October 2011 to January 2012, leading to a decline in net exports in GDP (Figure, Table 2-3-2-5).
In February 2012, exports turned positive (+0.9%) in comparison to the same month last year for the first time in four months, which confirms the recovery of export-related production activities. At the same time, recovery and reconstruction demand continues with sustained expansion of exports. As production expands in the future, attention should be paid to how long the recovery of exports of industrial products continues, as well as to the trend of the global economy. (5) Private Investment
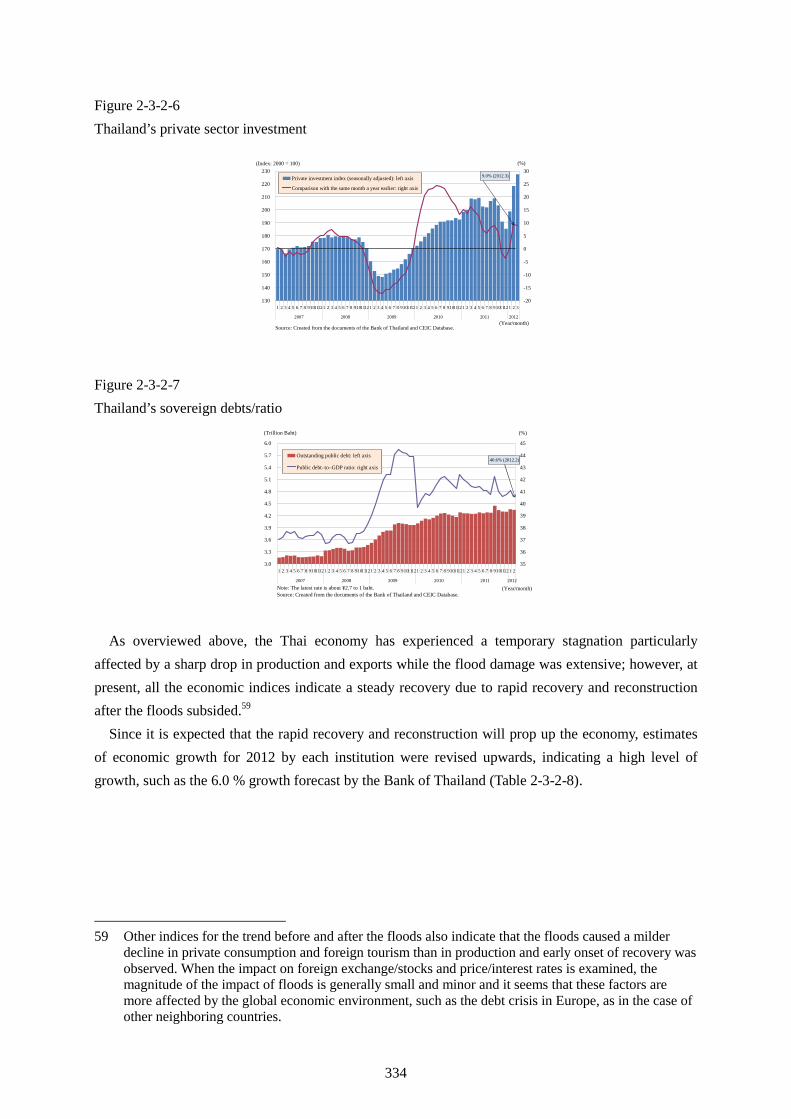
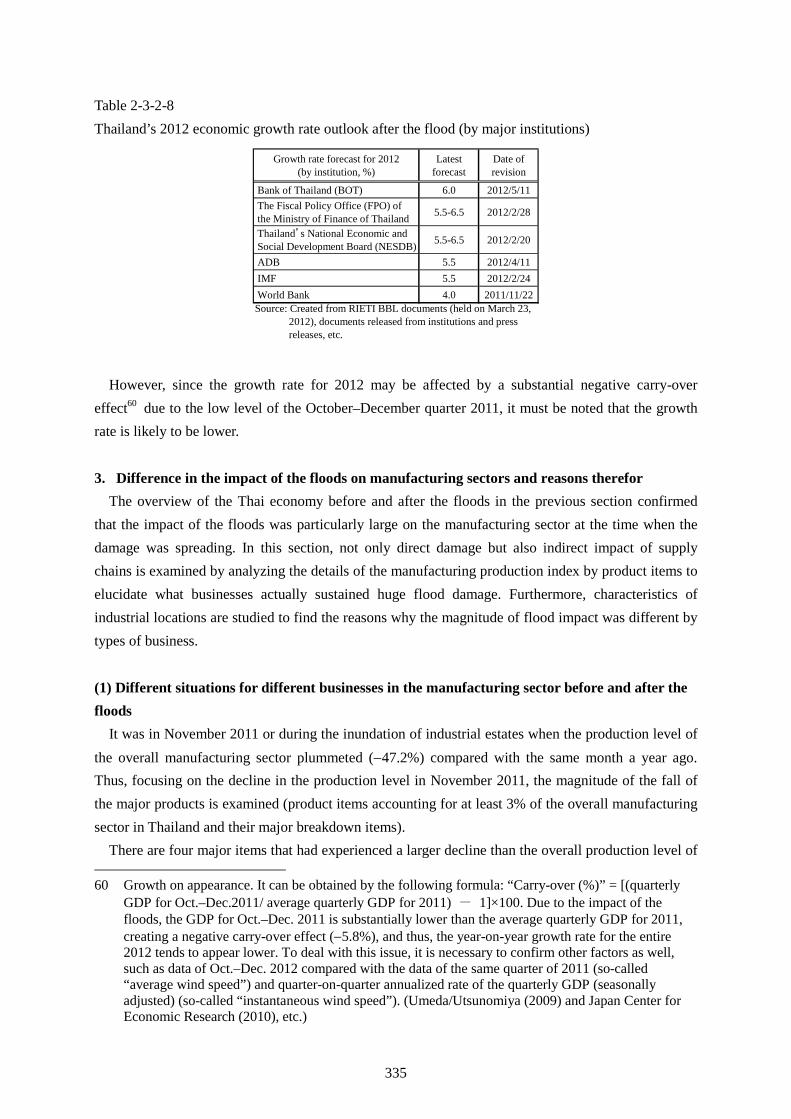
Private investment has a trend similar to production and exports. It recorded a negative growth compared to the same month of the previous year in November and December 2011 affected partly by the floods, but then made a recovery due to a strong recovery/reconstruction demand for facility repair and renewal, etc., and moved back to +9.0% compared to the same month of the previous year in March 2012 (Figure 2-3-2-6). (6) Financial conditions
Lastly, financial conditions and foreign currency reserves are examined. The Thai government’s public debt and its debt to GDP ratio have both been declining since September 2011 (the debt to GDP ratio was 40.6% as of February 2012). Judging from the level of debt, the financial situation remains sound with the debt to GDP ratio of around 40% after the adoption of stimulus measures through fiscal packages following the global economic crisis. It is therefore thought that the government has ample fiscal space to implement full-fledged flood control measures in the future (Figure 2-3-2-7). Figure, Table 2-3-2-5 Thailand’s export/import and trade balance, and trends before and after the flood
-60
-40
-20
0
20
40
60
80
1 2 3 4 5 6 7 8 9 101112 1 2 3 4 5 6 7 8 9 101112 1 2 3 4 5 6 7 8 9 101112 1 2 3 4 5 6 7 8 9 101112 1 2 3
2008 2009 2010 2011 2012
-60
-40
-20
0
20
40
60
80
Trade balance ($100 million): right axis
Export (comparison with the same month a year earlier: %): left axis
Import (comparison with the same month a year earlier: %): left axis
Growth of export/import and trade balance of Thailand (after 2008)
Note: The amounts of exports and imports are dollar based.Source: Created from the documents of the Customs Department of the Ministry of Finance of Thailand and CEIC Database.
(%)
(Month/year)
($100 million)Exports
(comparison withthe same montha year earlier)
(%)
Imports(comparison withthe same montha year earlier)
(%)
Trade balance($100 million)
7 38.3 13.5 28.08 31.1 44.0 -12.09 19.1 41.9 2.410 0.3 21.5 -10.111 -12.4 -2.4 -13.712 -2.0 19.1 -21.31 -6.0 -4.2 -11.32 0.9 8.2 5.33 -6.5 25.6 -45.9
Source: Created from the documents of the Customs Department of the Ministry of Finance of Thailand and CEIC Database.
Year/Month
2011
2012
Note: Shaded columns indicate months recording a negative growth in trade balance.
334
Figure 2-3-2-6 Thailand’s private sector investment
9.0% (2012.3)
130
140
150
160
170
180
190
200
210
220
230
1 2 3 4 5 6 7 8 91011121 2 3 4 5 6 7 8 91011121 2 3 4 5 6 7 8 91011121 2 3 4 5 6 7 8 91011121 2 3 4 5 6 7 8 91011121 2 3
2007 2008 2009 2010 2011 2012
-20
-15
-10
-5
0
5
10
15
20
25
30Private investment index (seasonally adjusted): left axis
Comparison with the same month a year earlier: right axis
Source: Created from the documents of the Bank of Thailand and CEIC Database.
(Index: 2000 = 100) (%)
(Year/month)
Figure 2-3-2-7 Thailand’s sovereign debts/ratio
40.6% (2012.2)
3.0
3.3
3.6
3.9
4.2
4.5
4.8
5.1
5.4
5.7
6.0
1 2 3 4 5 6 7 8 91011121 2 3 4 5 6 7 8 91011121 2 3 4 5 6 7 8 91011121 2 3 4 5 6 7 8 91011121 2 3 4 5 6 7 8 91011121 2
2007 2008 2009 2010 2011 2012
35
36
37
38
39
40
41
42
43
44
45
Outstanding public debt: left axis
Public debt–to–GDP ratio: right axis
(Trillion Baht) (%)
Note: The latest rate is about ¥2.7 to 1 baht.Source: Created from the documents of the Bank of Thailand and CEIC Database.
(Year/month)
As overviewed above, the Thai economy has experienced a temporary stagnation particularly affected by a sharp drop in production and exports while the flood damage was extensive; however, at present, all the economic indices indicate a steady recovery due to rapid recovery and reconstruction after the floods subsided.59
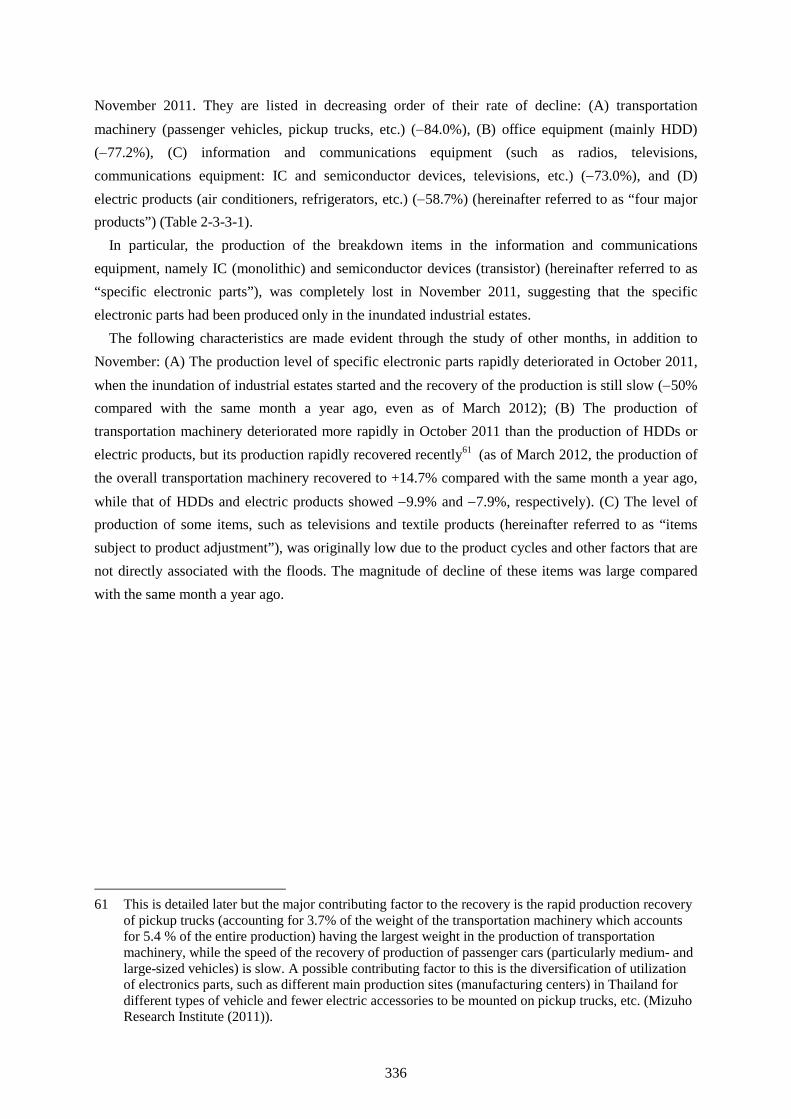
Since it is expected that the rapid recovery and reconstruction will prop up the economy, estimates of economic growth for 2012 by each institution were revised upwards, indicating a high level of growth, such as the 6.0 % growth forecast by the Bank of Thailand (Table 2-3-2-8).
59 Other indices for the trend before and after the floods also indicate that the floods caused a milder decline in private consumption and foreign tourism than in production and early onset of recovery was observed. When the impact on foreign exchange/stocks and price/interest rates is examined, the magnitude of the impact of floods is generally small and minor and it seems that these factors are more affected by the global economic environment, such as the debt crisis in Europe, as in the case of other neighboring countries.
335
Table 2-3-2-8 Thailand’s 2012 economic growth rate outlook after the flood (by major institutions)
Growth rate forecast for 2012(by institution, %)
Latestforecast
Date ofrevision
Bank of Thailand (BOT) 6.0 2012/5/11 The Fiscal Policy Office (FPO) of the Ministry of Finance of Thailand 5.5-6.5 2012/2/28
Thailand’s National Economic and Social Development Board (NESDB) 5.5-6.5 2012/2/20
ADB 5.5 2012/4/11 IMF 5.5 2012/2/24 World Bank 4.0 2011/11/22Source: Created from RIETI BBL documents (held on March 23,
2012), documents released from institutions and pressreleases, etc.
However, since the growth rate for 2012 may be affected by a substantial negative carry-over effect60 due to the low level of the October–December quarter 2011, it must be noted that the growth rate is likely to be lower. 3. Difference in the impact of the floods on manufacturing sectors and reasons therefor
The overview of the Thai economy before and after the floods in the previous section confirmed that the impact of the floods was particularly large on the manufacturing sector at the time when the damage was spreading. In this section, not only direct damage but also indirect impact of supply chains is examined by analyzing the details of the manufacturing production index by product items to elucidate what businesses actually sustained huge flood damage. Furthermore, characteristics of industrial locations are studied to find the reasons why the magnitude of flood impact was different by types of business. (1) Different situations for different businesses in the manufacturing sector before and after the floods
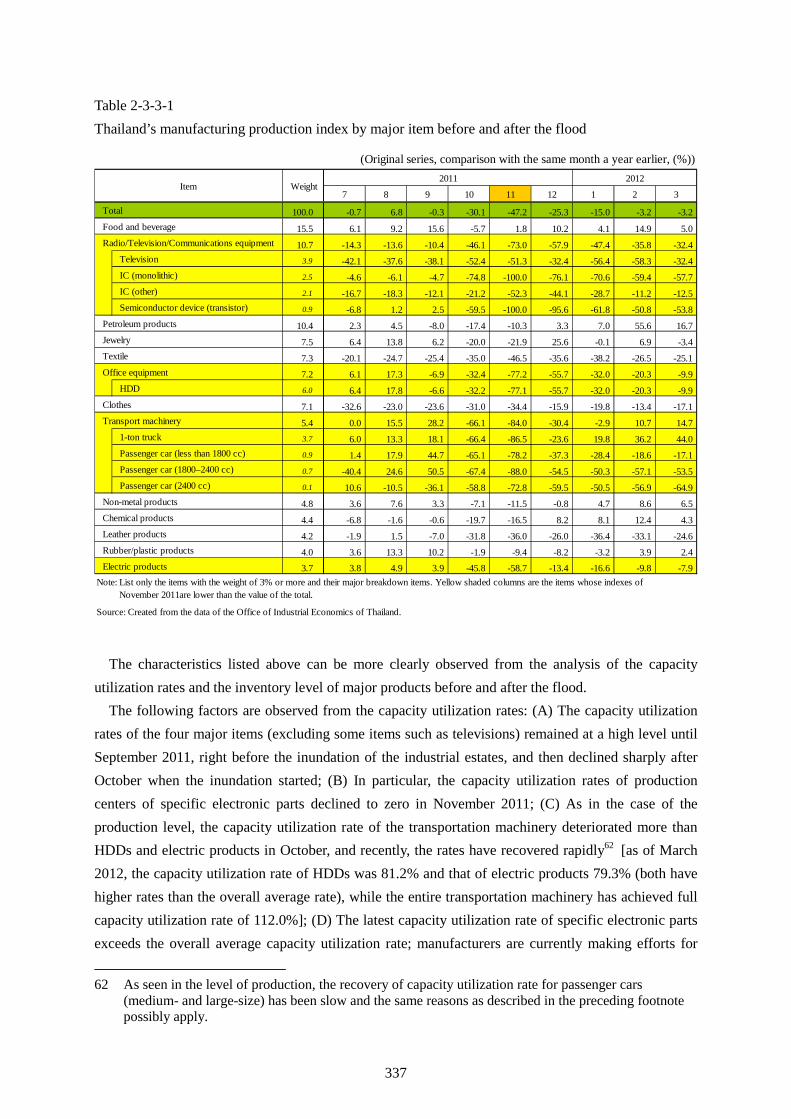
It was in November 2011 or during the inundation of industrial estates when the production level of the overall manufacturing sector plummeted (−47.2%) compared with the same month a year ago. Thus, focusing on the decline in the production level in November 2011, the magnitude of the fall of the major products is examined (product items accounting for at least 3% of the overall manufacturing sector in Thailand and their major breakdown items).
There are four major items that had experienced a larger decline than the overall production level of 60 Growth on appearance. It can be obtained by the following formula: “Carry-over (%)” = [(quarterly
GDP for Oct.–Dec.2011/ average quarterly GDP for 2011) - 1]×100. Due to the impact of the floods, the GDP for Oct.–Dec. 2011 is substantially lower than the average quarterly GDP for 2011, creating a negative carry-over effect (−5.8%), and thus, the year-on-year growth rate for the entire 2012 tends to appear lower. To deal with this issue, it is necessary to confirm other factors as well, such as data of Oct.–Dec. 2012 compared with the data of the same quarter of 2011 (so-called “average wind speed”) and quarter-on-quarter annualized rate of the quarterly GDP (seasonally adjusted) (so-called “instantaneous wind speed”). (Umeda/Utsunomiya (2009) and Japan Center for Economic Research (2010), etc.)
336
November 2011. They are listed in decreasing order of their rate of decline: (A) transportation machinery (passenger vehicles, pickup trucks, etc.) (−84.0%), (B) office equipment (mainly HDD) (−77.2%), (C) information and communications equipment (such as radios, televisions, communications equipment: IC and semiconductor devices, televisions, etc.) (−73.0%), and (D) electric products (air conditioners, refrigerators, etc.) (−58.7%) (hereinafter referred to as “four major products”) (Table 2-3-3-1).
In particular, the production of the breakdown items in the information and communications equipment, namely IC (monolithic) and semiconductor devices (transistor) (hereinafter referred to as “specific electronic parts”), was completely lost in November 2011, suggesting that the specific electronic parts had been produced only in the inundated industrial estates.
The following characteristics are made evident through the study of other months, in addition to November: (A) The production level of specific electronic parts rapidly deteriorated in October 2011, when the inundation of industrial estates started and the recovery of the production is still slow (−50% compared with the same month a year ago, even as of March 2012); (B) The production of transportation machinery deteriorated more rapidly in October 2011 than the production of HDDs or electric products, but its production rapidly recovered recently61 (as of March 2012, the production of the overall transportation machinery recovered to +14.7% compared with the same month a year ago, while that of HDDs and electric products showed −9.9% and −7.9%, respectively). (C) The level of production of some items, such as televisions and textile products (hereinafter referred to as “items subject to product adjustment”), was originally low due to the product cycles and other factors that are not directly associated with the floods. The magnitude of decline of these items was large compared with the same month a year ago.
61 This is detailed later but the major contributing factor to the recovery is the rapid production recovery of pickup trucks (accounting for 3.7% of the weight of the transportation machinery which accounts for 5.4 % of the entire production) having the largest weight in the production of transportation machinery, while the speed of the recovery of production of passenger cars (particularly medium- and large-sized vehicles) is slow. A possible contributing factor to this is the diversification of utilization of electronics parts, such as different main production sites (manufacturing centers) in Thailand for different types of vehicle and fewer electric accessories to be mounted on pickup trucks, etc. (Mizuho Research Institute (2011)).
337
Table 2-3-3-1 Thailand’s manufacturing production index by major item before and after the flood
7 8 9 10 11 12 1 2 3
100.0 -0.7 6.8 -0.3 -30.1 -47.2 -25.3 -15.0 -3.2 -3.2
15.5 6.1 9.2 15.6 -5.7 1.8 10.2 4.1 14.9 5.0
10.7 -14.3 -13.6 -10.4 -46.1 -73.0 -57.9 -47.4 -35.8 -32.4Television 3.9 -42.1 -37.6 -38.1 -52.4 -51.3 -32.4 -56.4 -58.3 -32.4IC (monolithic) 2.5 -4.6 -6.1 -4.7 -74.8 -100.0 -76.1 -70.6 -59.4 -57.7IC (other) 2.1 -16.7 -18.3 -12.1 -21.2 -52.3 -44.1 -28.7 -11.2 -12.5Semiconductor device (transistor) 0.9 -6.8 1.2 2.5 -59.5 -100.0 -95.6 -61.8 -50.8 -53.8
10.4 2.3 4.5 -8.0 -17.4 -10.3 3.3 7.0 55.6 16.7
7.5 6.4 13.8 6.2 -20.0 -21.9 25.6 -0.1 6.9 -3.4
7.3 -20.1 -24.7 -25.4 -35.0 -46.5 -35.6 -38.2 -26.5 -25.1
7.2 6.1 17.3 -6.9 -32.4 -77.2 -55.7 -32.0 -20.3 -9.9HDD 6.0 6.4 17.8 -6.6 -32.2 -77.1 -55.7 -32.0 -20.3 -9.9
7.1 -32.6 -23.0 -23.6 -31.0 -34.4 -15.9 -19.8 -13.4 -17.1
5.4 0.0 15.5 28.2 -66.1 -84.0 -30.4 -2.9 10.7 14.71-ton truck 3.7 6.0 13.3 18.1 -66.4 -86.5 -23.6 19.8 36.2 44.0Passenger car (less than 1800 cc) 0.9 1.4 17.9 44.7 -65.1 -78.2 -37.3 -28.4 -18.6 -17.1Passenger car (1800–2400 cc) 0.7 -40.4 24.6 50.5 -67.4 -88.0 -54.5 -50.3 -57.1 -53.5Passenger car (2400 cc) 0.1 10.6 -10.5 -36.1 -58.8 -72.8 -59.5 -50.5 -56.9 -64.9
4.8 3.6 7.6 3.3 -7.1 -11.5 -0.8 4.7 8.6 6.5
4.4 -6.8 -1.6 -0.6 -19.7 -16.5 8.2 8.1 12.4 4.3
4.2 -1.9 1.5 -7.0 -31.8 -36.0 -26.0 -36.4 -33.1 -24.6
4.0 3.6 13.3 10.2 -1.9 -9.4 -8.2 -3.2 3.9 2.4
3.7 3.8 4.9 3.9 -45.8 -58.7 -13.4 -16.6 -9.8 -7.9
(Original series, comparison with the same month a year earlier, (%))
Item Weight2011 2012
Non-metal products
Chemical products
Leather products
Rubber/plastic products
Electric products
Total
Food and beverage
Radio/Television/Communications equipment
Note: List only the items with the weight of 3% or more and their major breakdown items. Yellow shaded columns are the items whose indexes of November 2011are lower than the value of the total.
Petroleum products
Jewelry
Textile
Source: Created from the data of the Office of Industrial Economics of Thailand.
Office equipment
Clothes
Transport machinery
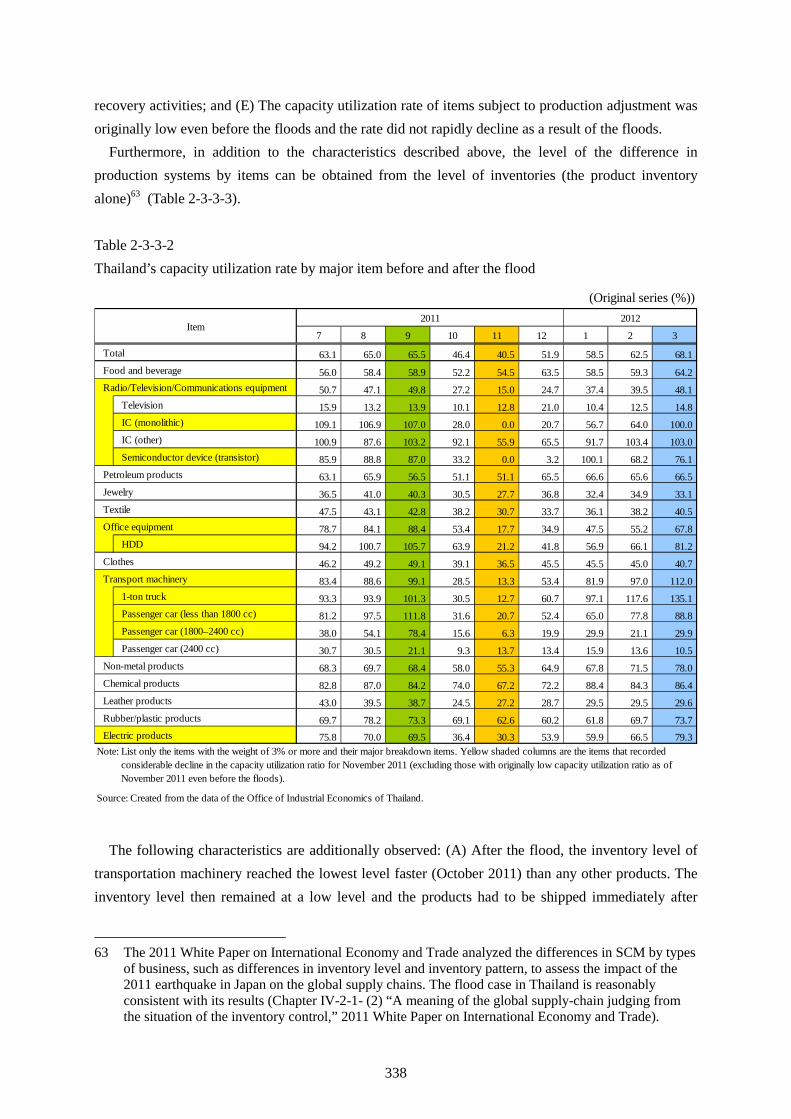
The characteristics listed above can be more clearly observed from the analysis of the capacity utilization rates and the inventory level of major products before and after the flood.
The following factors are observed from the capacity utilization rates: (A) The capacity utilization rates of the four major items (excluding some items such as televisions) remained at a high level until September 2011, right before the inundation of the industrial estates, and then declined sharply after October when the inundation started; (B) In particular, the capacity utilization rates of production centers of specific electronic parts declined to zero in November 2011; (C) As in the case of the production level, the capacity utilization rate of the transportation machinery deteriorated more than HDDs and electric products in October, and recently, the rates have recovered rapidly62 [as of March 2012, the capacity utilization rate of HDDs was 81.2% and that of electric products 79.3% (both have higher rates than the overall average rate), while the entire transportation machinery has achieved full capacity utilization rate of 112.0%]; (D) The latest capacity utilization rate of specific electronic parts exceeds the overall average capacity utilization rate; manufacturers are currently making efforts for
62 As seen in the level of production, the recovery of capacity utilization rate for passenger cars
(medium- and large-size) has been slow and the same reasons as described in the preceding footnote possibly apply.
338
recovery activities; and (E) The capacity utilization rate of items subject to production adjustment was originally low even before the floods and the rate did not rapidly decline as a result of the floods.
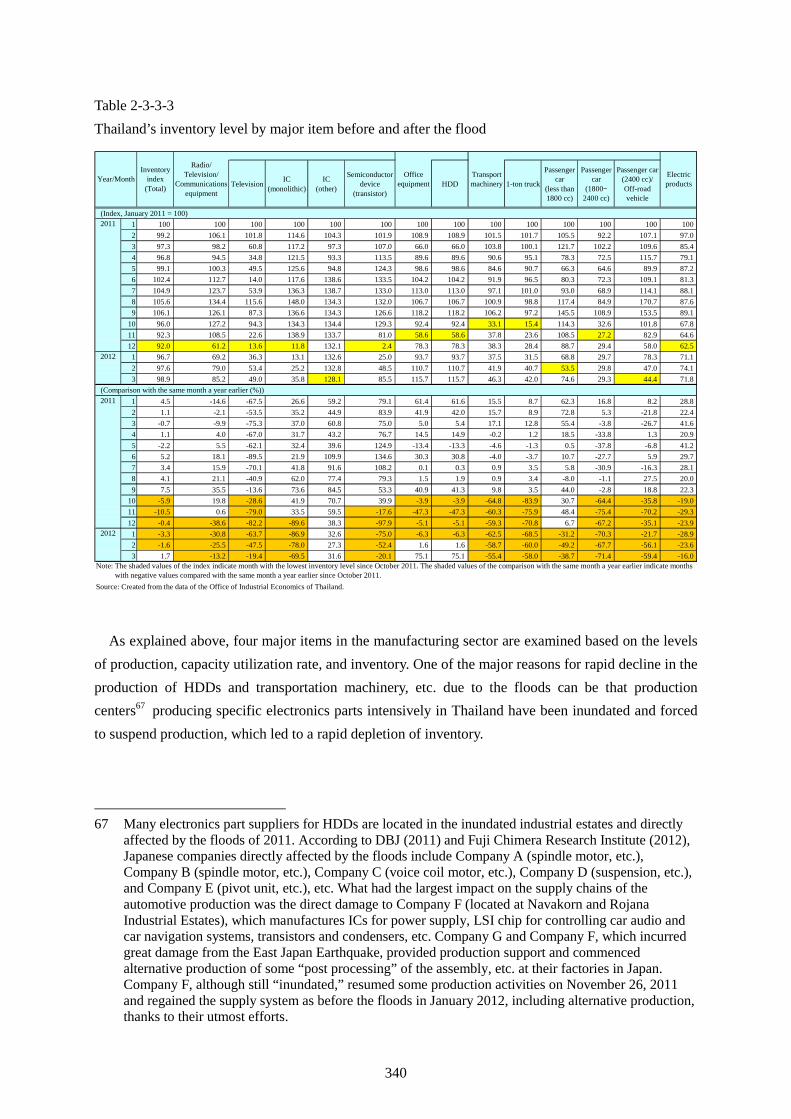
Furthermore, in addition to the characteristics described above, the level of the difference in production systems by items can be obtained from the level of inventories (the product inventory alone)63 (Table 2-3-3-3). Table 2-3-3-2 Thailand’s capacity utilization rate by major item before and after the flood
7 8 9 10 11 12 1 2 3
63.1 65.0 65.5 46.4 40.5 51.9 58.5 62.5 68.1
56.0 58.4 58.9 52.2 54.5 63.5 58.5 59.3 64.2
50.7 47.1 49.8 27.2 15.0 24.7 37.4 39.5 48.1Television 15.9 13.2 13.9 10.1 12.8 21.0 10.4 12.5 14.8IC (monolithic) 109.1 106.9 107.0 28.0 0.0 20.7 56.7 64.0 100.0IC (other) 100.9 87.6 103.2 92.1 55.9 65.5 91.7 103.4 103.0Semiconductor device (transistor) 85.9 88.8 87.0 33.2 0.0 3.2 100.1 68.2 76.1
63.1 65.9 56.5 51.1 51.1 65.5 66.6 65.6 66.5
36.5 41.0 40.3 30.5 27.7 36.8 32.4 34.9 33.1
47.5 43.1 42.8 38.2 30.7 33.7 36.1 38.2 40.5
78.7 84.1 88.4 53.4 17.7 34.9 47.5 55.2 67.8HDD 94.2 100.7 105.7 63.9 21.2 41.8 56.9 66.1 81.2
46.2 49.2 49.1 39.1 36.5 45.5 45.5 45.0 40.7
83.4 88.6 99.1 28.5 13.3 53.4 81.9 97.0 112.01-ton truck 93.3 93.9 101.3 30.5 12.7 60.7 97.1 117.6 135.1Passenger car (less than 1800 cc) 81.2 97.5 111.8 31.6 20.7 52.4 65.0 77.8 88.8Passenger car (1800–2400 cc) 38.0 54.1 78.4 15.6 6.3 19.9 29.9 21.1 29.9Passenger car (2400 cc) 30.7 30.5 21.1 9.3 13.7 13.4 15.9 13.6 10.5
68.3 69.7 68.4 58.0 55.3 64.9 67.8 71.5 78.0
82.8 87.0 84.2 74.0 67.2 72.2 88.4 84.3 86.4
43.0 39.5 38.7 24.5 27.2 28.7 29.5 29.5 29.6
69.7 78.2 73.3 69.1 62.6 60.2 61.8 69.7 73.7
75.8 70.0 69.5 36.4 30.3 53.9 59.9 66.5 79.3Note: List only the items with the weight of 3% or more and their major breakdown items. Yellow shaded columns are the items that recorded considerable decline in the capacity utilization ratio for November 2011 (excluding those with originally low capacity utilization ratio as of November 2011 even before the floods).
Source: Created from the data of the Office of Industrial Economics of Thailand.
Non-metal products
Rubber/plastic products
Electric products
Chemical products
Leather products
Textile
Office equipment
Clothes
Transport machinery
Radio/Television/Communications equipment
Petroleum products
Jewelry
Total
Food and beverage
(Original series (%))
Item2011 2012
The following characteristics are additionally observed: (A) After the flood, the inventory level of transportation machinery reached the lowest level faster (October 2011) than any other products. The inventory level then remained at a low level and the products had to be shipped immediately after
63 The 2011 White Paper on International Economy and Trade analyzed the differences in SCM by types
of business, such as differences in inventory level and inventory pattern, to assess the impact of the 2011 earthquake in Japan on the global supply chains. The flood case in Thailand is reasonably consistent with its results (Chapter IV-2-1- (2) “A meaning of the global supply-chain judging from the situation of the inventory control,” 2011 White Paper on International Economy and Trade).
339
production (for some automobile types, the lowest level was reached in the recent month); (B) The next product whose inventory level reached the lowest level was HDDs64 (November 2011). The inventory has gradually increased for shipment since then until today65; (C) Other products of the major four products have reached the lowest level of inventory in December 2011 (the inventory level of electric products has not improved much and the products had been shipped immediately after production as in the case of transportation machinery); (D) The inventory level of specific electronic parts fell rapidly in December 2011 to around 10% of the beginning of the year due to the complete production shutdown in November 2011 and the inventory was then completely depleted.66 The inventory of monolithic IC has yet to be sufficiently restored (in other words, there was a risk of failing to fulfill the responsibility of supplying specific parts).
64 Recent inventory level of office equipment compared to the same month a year ago is the same level as that of HDDs, but this is because no inventory level of products other than HDDs has been measured (there used to be an inventory level for printers).
65 The inventory level of HDDs already recorded a positive growth in February 2012 compared with the same month a year ago, and it is difficult to find reasons why the supply is still tight in the market. Nonetheless, either or both of the following factors appear to be the cause: (A) products are delivered after certain level of inventory is secured since many products are intended for exports and/or (B) HDD manufacturers that escaped direct damage have intentionally held up inventory and restricted the shipment and created a tight supply situation to maintain the high price level.
66 It is also clear from the inventory ratio that supply and demand for specific electronics parts became stringent rapidly at around the flooding of industrial estates (for example, monolithic IC took a nose-dive from 420% in October 2011 compared to the same month a year ago to −100% in November 2011).
340
Table 2-3-3-3 Thailand’s inventory level by major item before and after the flood
Television IC(monolithic)
IC(other)
Semiconductordevice
(transistor)HDD 1-ton truck
Passengercar
(less than1800 cc)
Passengercar
(1800–2400 cc)
Passenger car(2400 cc)/Off-roadvehicle
1 100 100 100 100 100 100 100 100 100 100 100 100 100 1002 99.2 106.1 101.8 114.6 104.3 101.9 108.9 108.9 101.5 101.7 105.5 92.2 107.1 97.03 97.3 98.2 60.8 117.2 97.3 107.0 66.0 66.0 103.8 100.1 121.7 102.2 109.6 85.44 96.8 94.5 34.8 121.5 93.3 113.5 89.6 89.6 90.6 95.1 78.3 72.5 115.7 79.15 99.1 100.3 49.5 125.6 94.8 124.3 98.6 98.6 84.6 90.7 66.3 64.6 89.9 87.26 102.4 112.7 14.0 117.6 138.6 133.5 104.2 104.2 91.9 96.5 80.3 72.3 109.1 81.37 104.9 123.7 53.9 136.3 138.7 133.0 113.0 113.0 97.1 101.0 93.0 68.9 114.1 88.18 105.6 134.4 115.6 148.0 134.3 132.0 106.7 106.7 100.9 98.8 117.4 84.9 170.7 87.69 106.1 126.1 87.3 136.6 134.3 126.6 118.2 118.2 106.2 97.2 145.5 108.9 153.5 89.1
10 96.0 127.2 94.3 134.3 134.4 129.3 92.4 92.4 33.1 15.4 114.3 32.6 101.8 67.811 92.3 108.5 22.6 138.9 133.7 81.0 58.6 58.6 37.8 23.6 108.5 27.2 82.9 64.612 92.0 61.2 13.6 11.8 132.1 2.4 78.3 78.3 38.3 28.4 88.7 29.4 58.0 62.51 96.7 69.2 36.3 13.1 132.6 25.0 93.7 93.7 37.5 31.5 68.8 29.7 78.3 71.12 97.6 79.0 53.4 25.2 132.8 48.5 110.7 110.7 41.9 40.7 53.5 29.8 47.0 74.13 98.9 85.2 49.0 35.8 128.1 85.5 115.7 115.7 46.3 42.0 74.6 29.3 44.4 71.8
1 4.5 -14.6 -67.5 26.6 59.2 79.1 61.4 61.6 15.5 8.7 62.3 16.8 8.2 28.82 1.1 -2.1 -53.5 35.2 44.9 83.9 41.9 42.0 15.7 8.9 72.8 5.3 -21.8 22.43 -0.7 -9.9 -75.3 37.0 60.8 75.0 5.0 5.4 17.1 12.8 55.4 -3.8 -26.7 41.64 1.1 4.0 -67.0 31.7 43.2 76.7 14.5 14.9 -0.2 1.2 18.5 -33.8 1.3 20.95 -2.2 5.5 -62.1 32.4 39.6 124.9 -13.4 -13.3 -4.6 -1.3 0.5 -37.8 -6.8 41.26 5.2 18.1 -89.5 21.9 109.9 134.6 30.3 30.8 -4.0 -3.7 10.7 -27.7 5.9 29.77 3.4 15.9 -70.1 41.8 91.6 108.2 0.1 0.3 0.9 3.5 5.8 -30.9 -16.3 28.18 4.1 21.1 -40.9 62.0 77.4 79.3 1.5 1.9 0.9 3.4 -8.0 -1.1 27.5 20.09 7.5 35.5 -13.6 73.6 84.5 53.3 40.9 41.3 9.8 3.5 44.0 -2.8 18.8 22.3
10 -5.9 19.8 -28.6 41.9 70.7 39.9 -3.9 -3.9 -64.8 -83.9 30.7 -64.4 -35.8 -19.011 -10.5 0.6 -79.0 33.5 59.5 -17.6 -47.3 -47.3 -60.3 -75.9 48.4 -75.4 -70.2 -29.312 -0.4 -38.6 -82.2 -89.6 38.3 -97.9 -5.1 -5.1 -59.3 -70.8 6.7 -67.2 -35.1 -23.91 -3.3 -30.8 -63.7 -86.9 32.6 -75.0 -6.3 -6.3 -62.5 -68.5 -31.2 -70.3 -21.7 -28.92 -1.6 -25.5 -47.5 -78.0 27.3 -52.4 1.6 1.6 -58.7 -60.0 -49.2 -67.7 -56.1 -23.63 1.7 -13.2 -19.4 -69.5 31.6 -20.1 75.1 75.1 -55.4 -58.0 -38.7 -71.4 -59.4 -16.0
Note: The shaded values of the index indicate month with the lowest inventory level since October 2011. The shaded values of the comparison with the same month a year earlier indicate months with negative values compared with the same month a year earlier since October 2011.Source: Created from the data of the Office of Industrial Economics of Thailand.
(Index, January 2011 = 100)2011
2012
(Comparison with the same month a year earlier (%))2011
2012
Year/MonthInventory
index(Total)
Radio/Television/
Communicationsequipment
Officeequipment
Transportmachinery
Electricproducts
As explained above, four major items in the manufacturing sector are examined based on the levels of production, capacity utilization rate, and inventory. One of the major reasons for rapid decline in the production of HDDs and transportation machinery, etc. due to the floods can be that production centers67 producing specific electronics parts intensively in Thailand have been inundated and forced to suspend production, which led to a rapid depletion of inventory.
67 Many electronics part suppliers for HDDs are located in the inundated industrial estates and directly affected by the floods of 2011. According to DBJ (2011) and Fuji Chimera Research Institute (2012), Japanese companies directly affected by the floods include Company A (spindle motor, etc.), Company B (spindle motor, etc.), Company C (voice coil motor, etc.), Company D (suspension, etc.), and Company E (pivot unit, etc.), etc. What had the largest impact on the supply chains of the automotive production was the direct damage to Company F (located at Navakorn and Rojana Industrial Estates), which manufactures ICs for power supply, LSI chip for controlling car audio and car navigation systems, transistors and condensers, etc. Company G and Company F, which incurred great damage from the East Japan Earthquake, provided production support and commenced alternative production of some “post processing” of the assembly, etc. at their factories in Japan. Company F, although still “inundated,” resumed some production activities on November 26, 2011 and regained the supply system as before the floods in January 2012, including alternative production, thanks to their utmost efforts.
341
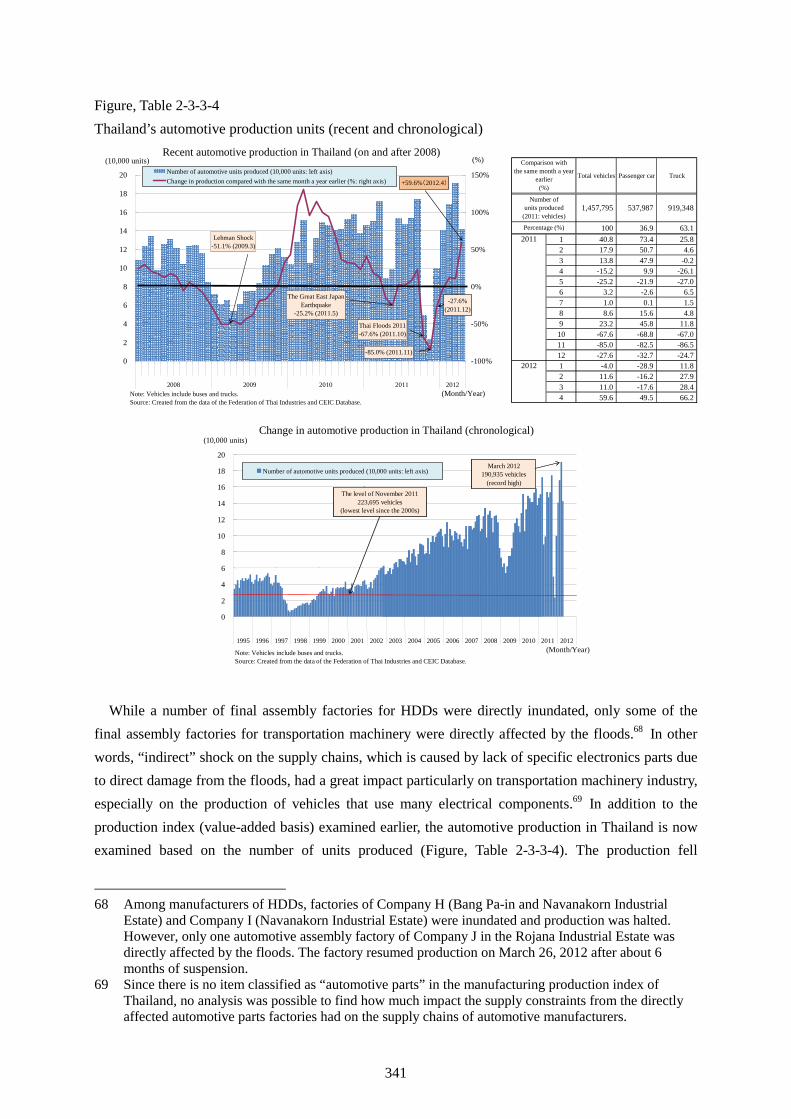
Figure, Table 2-3-3-4 Thailand’s automotive production units (recent and chronological)
Total vehicles Passenger car Truck
1,457,795 537,987 919,348
100 36.9 63.11 40.8 73.4 25.82 17.9 50.7 4.63 13.8 47.9 -0.24 -15.2 9.9 -26.15 -25.2 -21.9 -27.06 3.2 -2.6 6.57 1.0 0.1 1.58 8.6 15.6 4.89 23.2 45.8 11.810 -67.6 -68.8 -67.011 -85.0 -82.5 -86.512 -27.6 -32.7 -24.71 -4.0 -28.9 11.82 11.6 -16.2 27.93 11.0 -17.6 28.44 59.6 49.5 66.2
2012
Comparison withthe same month a year
earlier(%)
Number ofunits produced
(2011: vehicles)
Percentage (%)
2011Lehman Shock-51.1% (2009.3)
The Great East JapanEarthquake
-25.2% (2011.5)
Thai Floods 2011-67.6% (2011.10)
-85.0% (2011.11)
-27.6%(2011.12)
+59.6%(2012.4)
0
2
4
6
8
10
12
14
16
18
20
2008 2009 2010 2011 2012
-100%
-50%
0%
50%
100%
150%Number of automotive units produced (10,000 units: left axis)Change in production compared with the same month a year earlier (%: right axis)
Note: Vehicles include buses and trucks.Source: Created from the data of the Federation of Thai Industries and CEIC Database.
(10,000 units) (%)Recent automotive production in Thailand (on and after 2008)
(Month/Year)
0
2
4
6
8
10
12
14
16
18
20
1995 1996 1997 1998 1999 2000 2001 2002 2003 2004 2005 2006 2007 2008 2009 2010 2011 2012
Number of automotive units produced (10,000 units: left axis)
(10,000 units)Change in automotive production in Thailand (chronological)
Note: Vehicles include buses and trucks.Source: Created from the data of the Federation of Thai Industries and CEIC Database.
March 2012190,935 vehicles
(record high)The level of November 2011
223,695 vehicles(lowest level since the 2000s)
(Month/Year)
While a number of final assembly factories for HDDs were directly inundated, only some of the final assembly factories for transportation machinery were directly affected by the floods.68 In other words, “indirect” shock on the supply chains, which is caused by lack of specific electronics parts due to direct damage from the floods, had a great impact particularly on transportation machinery industry, especially on the production of vehicles that use many electrical components.69 In addition to the production index (value-added basis) examined earlier, the automotive production in Thailand is now examined based on the number of units produced (Figure, Table 2-3-3-4). The production fell
68 Among manufacturers of HDDs, factories of Company H (Bang Pa-in and Navanakorn Industrial
Estate) and Company I (Navanakorn Industrial Estate) were inundated and production was halted. However, only one automotive assembly factory of Company J in the Rojana Industrial Estate was directly affected by the floods. The factory resumed production on March 26, 2012 after about 6 months of suspension.
69 Since there is no item classified as “automotive parts” in the manufacturing production index of Thailand, no analysis was possible to find how much impact the supply constraints from the directly affected automotive parts factories had on the supply chains of automotive manufacturers.
342
compared to the same month a year ago by 67.6% and by 85.0% in October and November 2011, respectively. The magnitude of the drop was larger than at the time of the global financial crisis, and the number of units produced in November (approximately 24,000 vehicles) plunged to the lowest level since 2000. It then rapidly rebounded, attaining the highest production level in history in March 2012. This rapid return is propelled mainly by the production of pickup trucks but the recovery of the production of passenger cars is much slower.
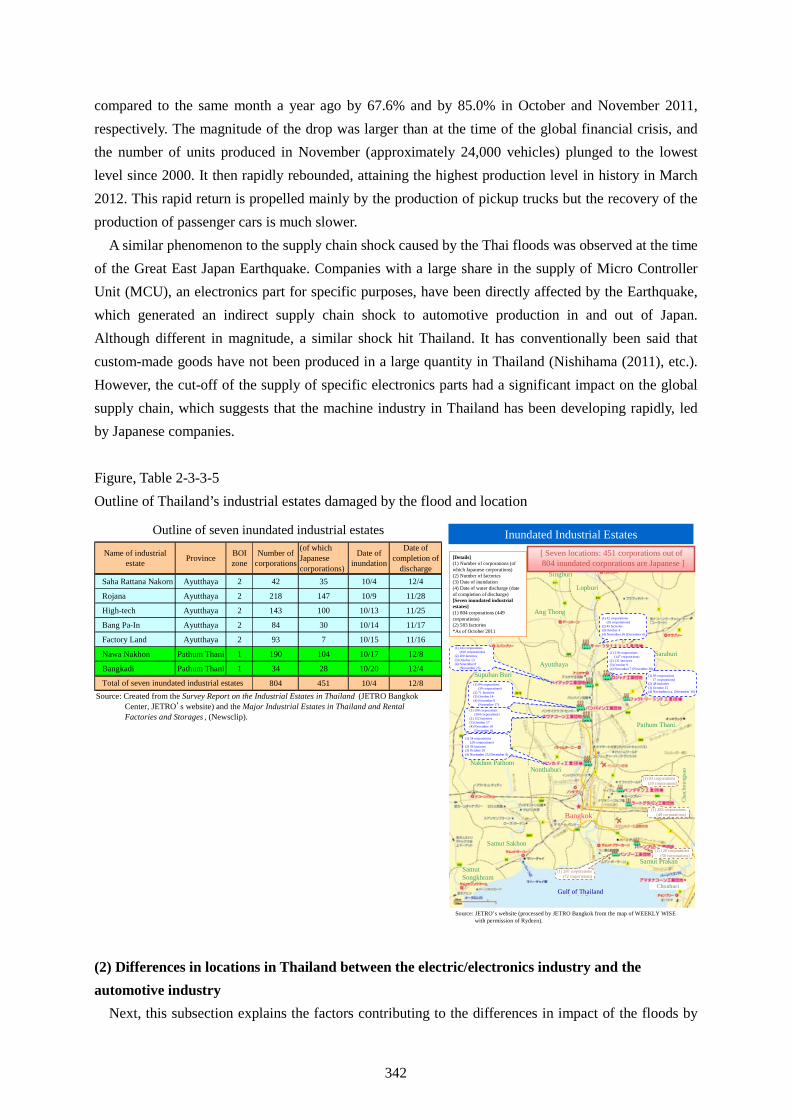
A similar phenomenon to the supply chain shock caused by the Thai floods was observed at the time of the Great East Japan Earthquake. Companies with a large share in the supply of Micro Controller Unit (MCU), an electronics part for specific purposes, have been directly affected by the Earthquake, which generated an indirect supply chain shock to automotive production in and out of Japan. Although different in magnitude, a similar shock hit Thailand. It has conventionally been said that custom-made goods have not been produced in a large quantity in Thailand (Nishihama (2011), etc.). However, the cut-off of the supply of specific electronics parts had a significant impact on the global supply chain, which suggests that the machine industry in Thailand has been developing rapidly, led by Japanese companies. Figure, Table 2-3-3-5 Outline of Thailand’s industrial estates damaged by the flood and location
Inundated Industrial Estates
Source: JETRO’s website (processed by JETRO Bangkok from the map of WEEKLY WISEwith permission of Rydeen).
[Details](1) Number of corporations (of which Japanese corporations)(2) Number of factories(3) Date of inundation(4) Date of water discharge (date of completion of discharge)[Seven inundated industrial estates](1) 804 corporations (449 corporations)(2) 583 factories *As of October 2011
Supuhan Buri
Nakhon Pathom
Samut Sakhon
SamutSongkhram
Singburi
Lopburi
Ang Thong
AyutthayaSaraburi
Pathum Thani
Nonthaburi
Bangkok
Chac
hoen
gsao
Samut Prakan
ChonburiGulf of Thailand
[ Seven locations: 451 corporations out of 804 inundated corporations are Japanese ]
(1) 143 corporations (100 corporations)
(2) 100 factories(3) October 13(4) November 8
(November 25)
(1) 84 corporations (30 corporations)
(2) 71 factories(3) October 14(4) November 8
(November 17)
(1) 190 corporations (104 corporations)
(2) 152 factories(3) October 17(4) November 18
(December 8)
(1) 34 corporations (28 corporations)
(2) 36 factories(3) October 20(4) November 25 (December 4)
(1) 42 corporations (35 corporations)
(2) 45 factories(3) October 4(4) November 30 (December 4)
(1) 218 corporations (147 corporations)
(2) 131 factories(3) October 9(4) November 7 (November 28)
(1) 93 corporations (7 corporations)
(2) 48 factories(3) October 15(4) November/n.a. (November 16)
(1) 83 corporations (20 corporations)
(1) 283 corporations (49 corporations)
(1) 120 corporations (50 corporations)
(1) 287 corporations (72 corporations)
Name of industrialestate Province BOI
zoneNumber of
corporations
(of whichJapanesecorporations)
Date ofinundation
Date ofcompletion of
dischargeSaha Rattana Nakorn Ayutthaya 2 42 35 10/4 12/4
Rojana Ayutthaya 2 218 147 10/9 11/28
High-tech Ayutthaya 2 143 100 10/13 11/25
Bang Pa-In Ayutthaya 2 84 30 10/14 11/17
Factory Land Ayutthaya 2 93 7 10/15 11/16
Nawa Nakhon Pathum Thani 1 190 104 10/17 12/8
Bangkadi Pathum Thani 1 34 28 10/20 12/4
804 451 10/4 12/8Total of seven inundated industrial estates
Outline of seven inundated industrial estates
Source: Created from the Survey Report on the Industrial Estates in Thailand (JETRO Bangkok Center, JETRO’s website) and the Major Industrial Estates in Thailand and Rental Factories and Storages , (Newsclip).
(2) Differences in locations in Thailand between the electric/electronics industry and the automotive industry
Next, this subsection explains the factors contributing to the differences in impact of the floods by
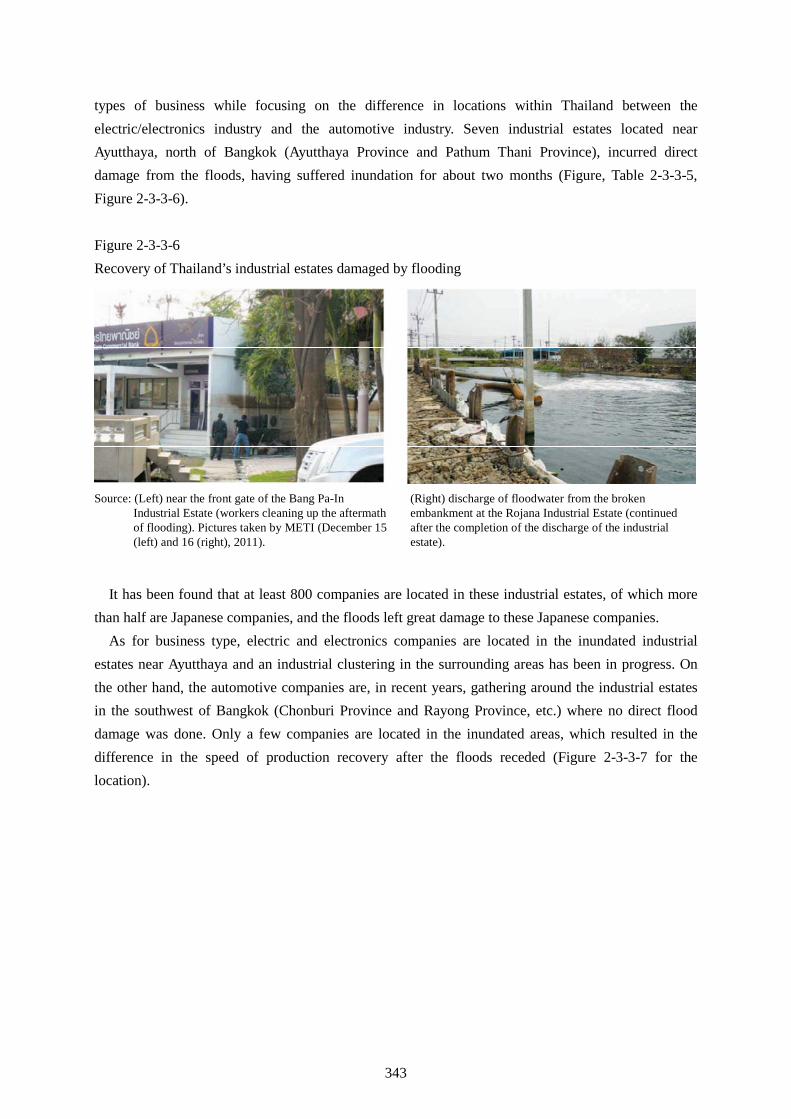
343
types of business while focusing on the difference in locations within Thailand between the electric/electronics industry and the automotive industry. Seven industrial estates located near Ayutthaya, north of Bangkok (Ayutthaya Province and Pathum Thani Province), incurred direct damage from the floods, having suffered inundation for about two months (Figure, Table 2-3-3-5, Figure 2-3-3-6). Figure 2-3-3-6 Recovery of Thailand’s industrial estates damaged by flooding
Source: (Left) near the front gate of the Bang Pa-In Industrial Estate (workers cleaning up the aftermath of flooding). Pictures taken by METI (December 15 (left) and 16 (right), 2011).
(Right) discharge of floodwater from the broken embankment at the Rojana Industrial Estate (continued after the completion of the discharge of the industrial estate).
It has been found that at least 800 companies are located in these industrial estates, of which more than half are Japanese companies, and the floods left great damage to these Japanese companies.
As for business type, electric and electronics companies are located in the inundated industrial estates near Ayutthaya and an industrial clustering in the surrounding areas has been in progress. On the other hand, the automotive companies are, in recent years, gathering around the industrial estates in the southwest of Bangkok (Chonburi Province and Rayong Province, etc.) where no direct flood damage was done. Only a few companies are located in the inundated areas, which resulted in the difference in the speed of production recovery after the floods receded (Figure 2-3-3-7 for the location).
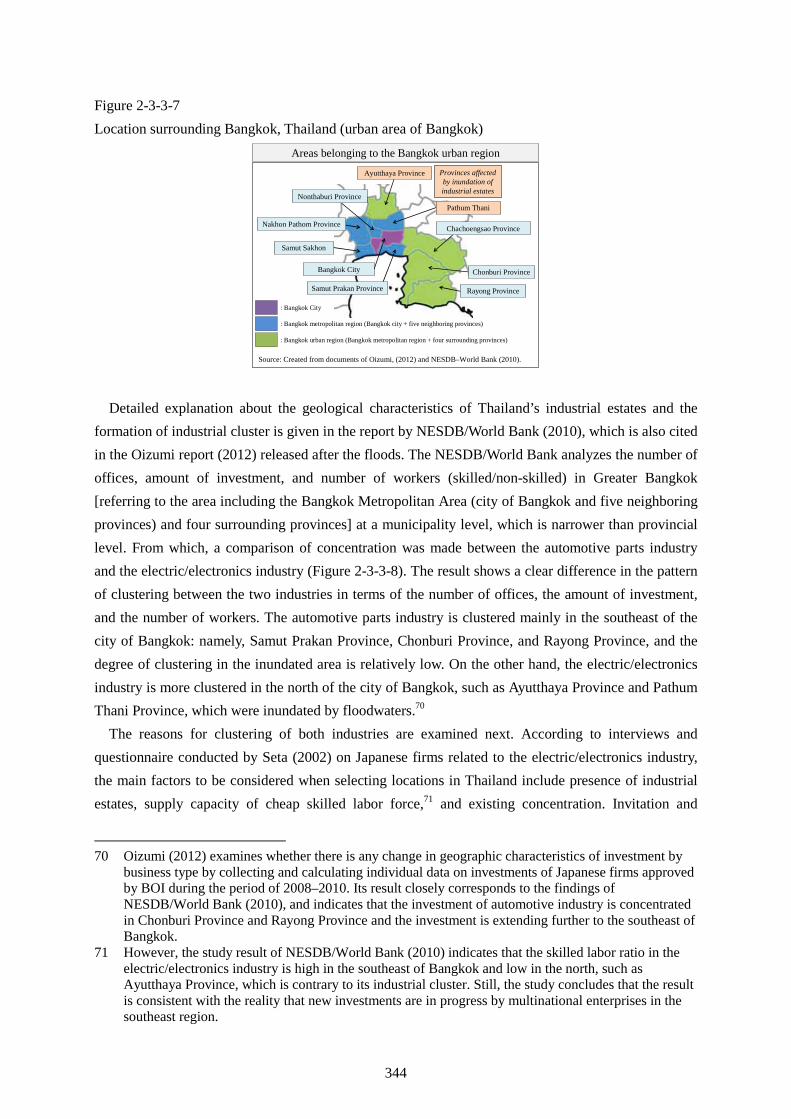
344
Figure 2-3-3-7 Location surrounding Bangkok, Thailand (urban area of Bangkok)
Nakhon Pathom Province
Pathum Thani
Ayutthaya Province
Chachoengsao Province
Chonburi Province
Rayong Province
Nonthaburi Province
Samut Sakhon
Bangkok City
Samut Prakan Province
Areas belonging to the Bangkok urban region Provinces affected by inundation of industrial estates
: Bangkok City
: Bangkok metropolitan region (Bangkok city + five neighboring provinces)
: Bangkok urban region (Bangkok metropolitan region + four surrounding provinces)
Source: Created from documents of Oizumi, (2012) and NESDB–World Bank (2010).
Detailed explanation about the geological characteristics of Thailand’s industrial estates and the formation of industrial cluster is given in the report by NESDB/World Bank (2010), which is also cited in the Oizumi report (2012) released after the floods. The NESDB/World Bank analyzes the number of offices, amount of investment, and number of workers (skilled/non-skilled) in Greater Bangkok [referring to the area including the Bangkok Metropolitan Area (city of Bangkok and five neighboring provinces) and four surrounding provinces] at a municipality level, which is narrower than provincial level. From which, a comparison of concentration was made between the automotive parts industry and the electric/electronics industry (Figure 2-3-3-8). The result shows a clear difference in the pattern of clustering between the two industries in terms of the number of offices, the amount of investment, and the number of workers. The automotive parts industry is clustered mainly in the southeast of the city of Bangkok: namely, Samut Prakan Province, Chonburi Province, and Rayong Province, and the degree of clustering in the inundated area is relatively low. On the other hand, the electric/electronics industry is more clustered in the north of the city of Bangkok, such as Ayutthaya Province and Pathum Thani Province, which were inundated by floodwaters.70
The reasons for clustering of both industries are examined next. According to interviews and questionnaire conducted by Seta (2002) on Japanese firms related to the electric/electronics industry, the main factors to be considered when selecting locations in Thailand include presence of industrial estates, supply capacity of cheap skilled labor force,71 and existing concentration. Invitation and
70 Oizumi (2012) examines whether there is any change in geographic characteristics of investment by
business type by collecting and calculating individual data on investments of Japanese firms approved by BOI during the period of 2008–2010. Its result closely corresponds to the findings of NESDB/World Bank (2010), and indicates that the investment of automotive industry is concentrated in Chonburi Province and Rayong Province and the investment is extending further to the southeast of Bangkok.
71 However, the study result of NESDB/World Bank (2010) indicates that the skilled labor ratio in the electric/electronics industry is high in the southeast of Bangkok and low in the north, such as Ayutthaya Province, which is contrary to its industrial cluster. Still, the study concludes that the result is consistent with the reality that new investments are in progress by multinational enterprises in the southeast region.
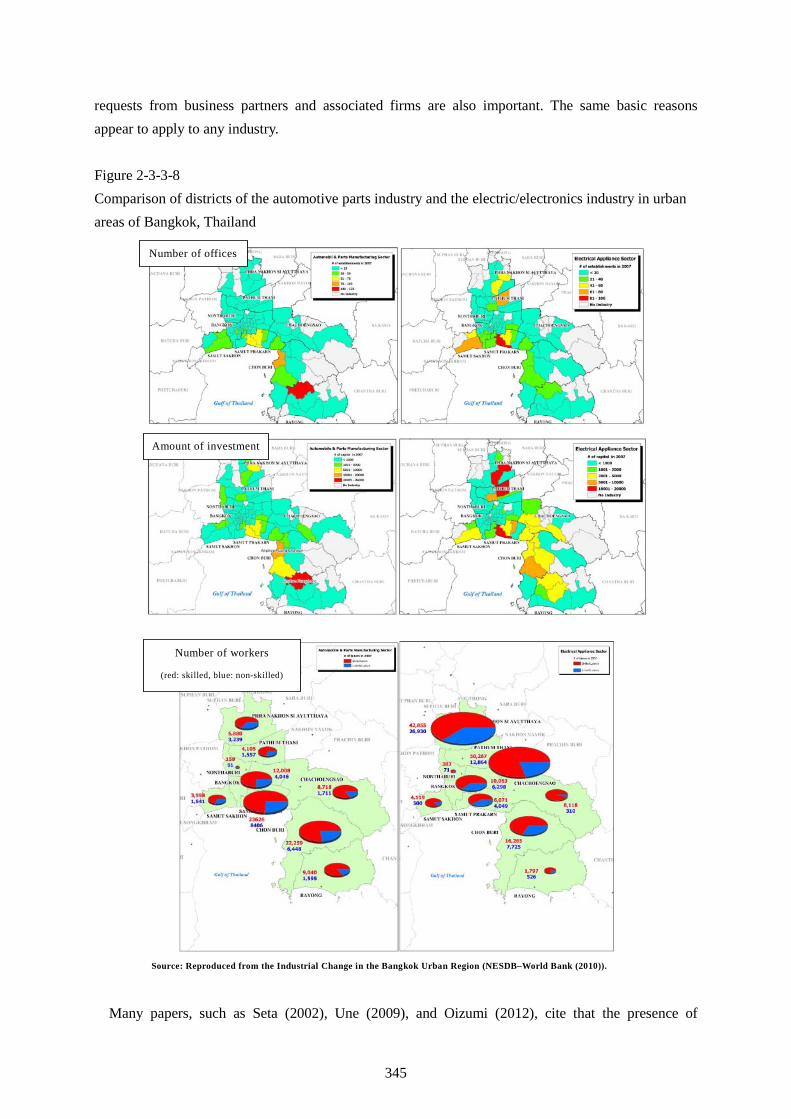
345
requests from business partners and associated firms are also important. The same basic reasons appear to apply to any industry. Figure 2-3-3-8 Comparison of districts of the automotive parts industry and the electric/electronics industry in urban areas of Bangkok, Thailand
Source: Reproduced from the Industrial Change in the Bangkok Urban Region (NESDB–World Bank (2010)).
Number of offices
Amount of investment
Number of workers
(red: skilled, blue: non-skilled)
Many papers, such as Seta (2002), Une (2009), and Oizumi (2012), cite that the presence of
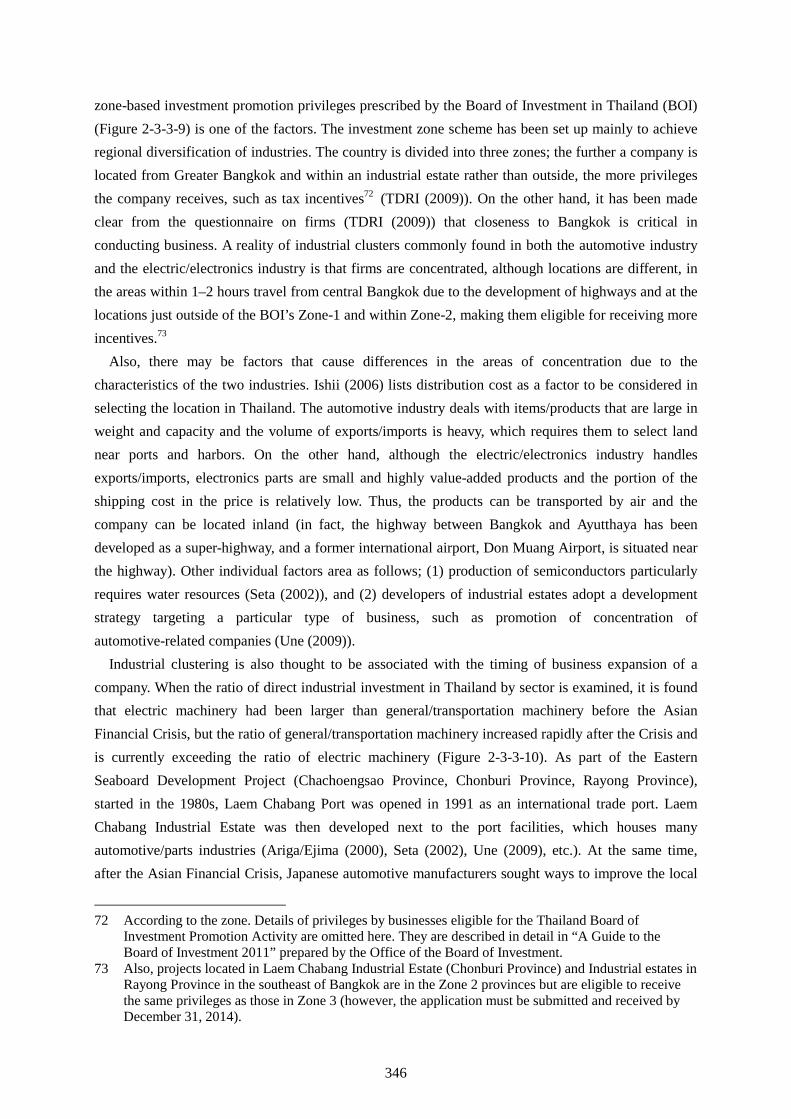
346
zone-based investment promotion privileges prescribed by the Board of Investment in Thailand (BOI) (Figure 2-3-3-9) is one of the factors. The investment zone scheme has been set up mainly to achieve regional diversification of industries. The country is divided into three zones; the further a company is located from Greater Bangkok and within an industrial estate rather than outside, the more privileges the company receives, such as tax incentives72 (TDRI (2009)). On the other hand, it has been made clear from the questionnaire on firms (TDRI (2009)) that closeness to Bangkok is critical in conducting business. A reality of industrial clusters commonly found in both the automotive industry and the electric/electronics industry is that firms are concentrated, although locations are different, in the areas within 1–2 hours travel from central Bangkok due to the development of highways and at the locations just outside of the BOI’s Zone-1 and within Zone-2, making them eligible for receiving more incentives.73
Also, there may be factors that cause differences in the areas of concentration due to the characteristics of the two industries. Ishii (2006) lists distribution cost as a factor to be considered in selecting the location in Thailand. The automotive industry deals with items/products that are large in weight and capacity and the volume of exports/imports is heavy, which requires them to select land near ports and harbors. On the other hand, although the electric/electronics industry handles exports/imports, electronics parts are small and highly value-added products and the portion of the shipping cost in the price is relatively low. Thus, the products can be transported by air and the company can be located inland (in fact, the highway between Bangkok and Ayutthaya has been developed as a super-highway, and a former international airport, Don Muang Airport, is situated near the highway). Other individual factors area as follows; (1) production of semiconductors particularly requires water resources (Seta (2002)), and (2) developers of industrial estates adopt a development strategy targeting a particular type of business, such as promotion of concentration of automotive-related companies (Une (2009)).
Industrial clustering is also thought to be associated with the timing of business expansion of a company. When the ratio of direct industrial investment in Thailand by sector is examined, it is found that electric machinery had been larger than general/transportation machinery before the Asian Financial Crisis, but the ratio of general/transportation machinery increased rapidly after the Crisis and is currently exceeding the ratio of electric machinery (Figure 2-3-3-10). As part of the Eastern Seaboard Development Project (Chachoengsao Province, Chonburi Province, Rayong Province), started in the 1980s, Laem Chabang Port was opened in 1991 as an international trade port. Laem Chabang Industrial Estate was then developed next to the port facilities, which houses many automotive/parts industries (Ariga/Ejima (2000), Seta (2002), Une (2009), etc.). At the same time, after the Asian Financial Crisis, Japanese automotive manufacturers sought ways to improve the local
72 According to the zone. Details of privileges by businesses eligible for the Thailand Board of
Investment Promotion Activity are omitted here. They are described in detail in “A Guide to the Board of Investment 2011” prepared by the Office of the Board of Investment.
73 Also, projects located in Laem Chabang Industrial Estate (Chonburi Province) and Industrial estates in Rayong Province in the southeast of Bangkok are in the Zone 2 provinces but are eligible to receive the same privileges as those in Zone 3 (however, the application must be submitted and received by December 31, 2014).
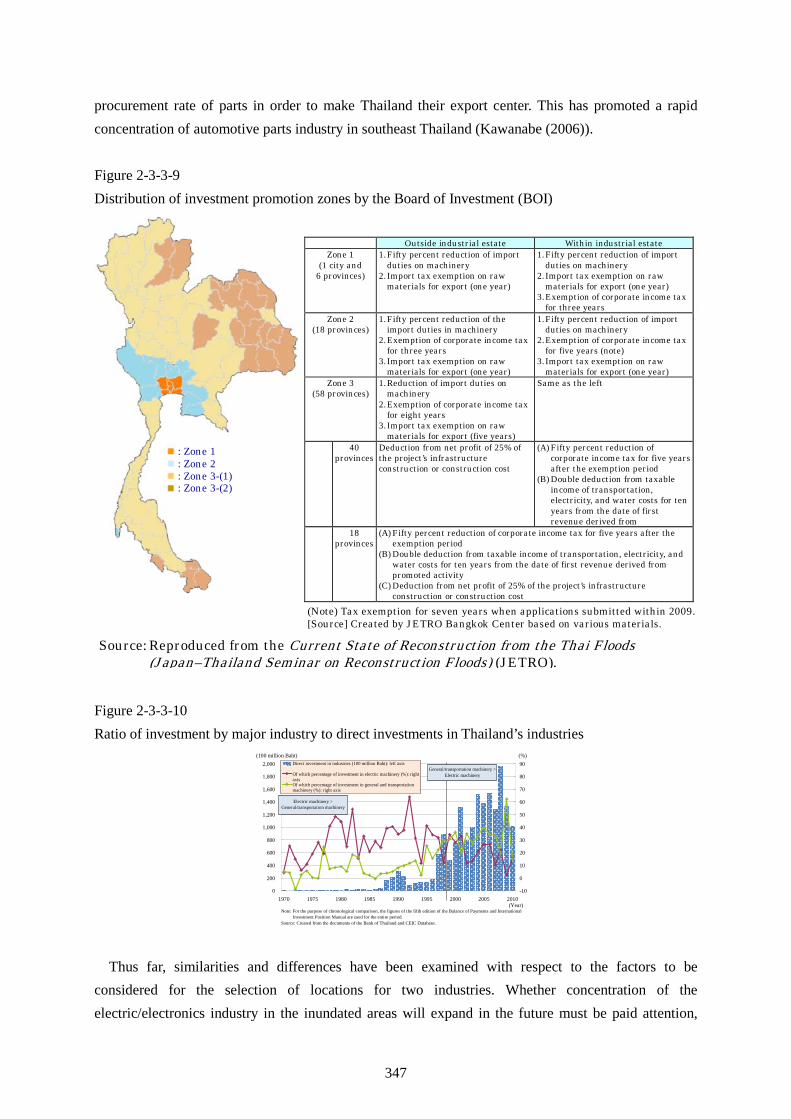
347
procurement rate of parts in order to make Thailand their export center. This has promoted a rapid concentration of automotive parts industry in southeast Thailand (Kawanabe (2006)). Figure 2-3-3-9 Distribution of investment promotion zones by the Board of Investment (BOI)
: Zone 1: Zone 2 : Zone 3-(1) : Zone 3-(2)
Outside industrial estate Within industrial estate Zone 1
(1 city and 6 provinces)
1. Fifty percent reduction of import duties on machinery
2. Import tax exemption on raw materials for export (one year)
1. Fifty percent reduction of import duties on machinery
2. Import tax exemption on raw materials for export (one year)
3. Exemption of corporate income tax for three years
Zone 2 (18 provinces)
1. Fifty percent reduction of the import duties in machinery
2. Exemption of corporate income tax for three years
3.Import tax exemption on raw materials for export (one year)
1. Fifty percent reduction of import duties on machinery
2. Exemption of corporate income tax for five years (note)
3.Import tax exemption on raw materials for export (one year)
Zone 3 (58 provinces)
1. Reduction of import duties on machinery
2. Exemption of corporate income tax for eight years
3. Import tax exemption on raw materials for export (five years)
Same as the left
40 provinces
Deduction from net profit of 25% of the project’s infrastructure construction or construction cost
(A) Fifty percent reduction of corporate income tax for five years after the exemption period
(B) Double deduction from taxable income of transportation, electricity, and water costs for ten years from the date of first revenue derived from
18 provinces
(A) Fifty percent reduction of corporate income tax for five years after the exemption period
(B) Double deduction from taxable income of transportation, electricity, and water costs for ten years from the date of first revenue derived from promoted activity
(C) Deduction from net profit of 25% of the project’s infrastructure construction or construction cost
(Note) Tax exemption for seven years when applications submitted within 2009.[Source] Created by JETRO Bangkok Center based on various materials.
Source: Reproduced from the Current State of Reconstruction from the Thai Floods (Japan–Thailand Seminar on Reconstruction Floods) (JETRO).
Figure 2-3-3-10 Ratio of investment by major industry to direct investments in Thailand’s industries
0
200
400
600
800
1,000
1,200
1,400
1,600
1,800
2,000
1970 1975 1980 1985 1990 1995 2000 2005 2010-10
0
10
20
30
40
50
60
70
80
90Direct investment in industries (100 million Baht): left axis
Of which percentage of investment in electric machinery (%): rightaxisOf which percentage of investment in general and transportationmachinery (%): right axis
Note: For the purpose of chronological comparison, the figures of the fifth edition of the Balance of Payments and International Investment Position Manual are used for the entire period.Source: Created from the documents of the Bank of Thailand and CEIC Database.
(100 million Baht) (%)
General/transportation machinery >Electric machinery
Electric machinery >General/transportation machinery
(Year)
Thus far, similarities and differences have been examined with respect to the factors to be considered for the selection of locations for two industries. Whether concentration of the electric/electronics industry in the inundated areas will expand in the future must be paid attention,
348
together with the effect of the expansion of favorable treatment74, which was decided in March 2012 in order to prevent the decline in investment in the two disaster affected provinces. 4. Change of Thai export items and the impact of the floods on industries in neighboring
nations/regions This section analyzes the composition and change of export items of Thailand, including major
industrial export goods like HDDs and pickup trucks, and Thailand’s comparative advantages of exports by items. Furthermore, the structure of intermediary goods trade of machinery and others between Thailand and its major trading partners is examined by using trade data classified by business type (RIETI-TID). Lastly, the actual flood impact of the decline in production/exports from Thailand under such a structure on Japan and neighboring nations/regions is studied, focusing on automotive production of each nation/region. Some examples of alternative production in each nation/region are also presented. (1) Change in the composition of major export items and trend of the comparative advantage of Thailand
First, major export items75 of Thailand in 2010 are roughly examined (extracting the top 30 items based on the four-digit HS code76) (Table 2-3-4-1).
Total exports reached about $200 billion and six items out of the top 10 and 14 items out of the top 30 are classified in machinery. When compared with 2000, the total exports nearly tripled, and the growth of the following items is particularly large: computer-related products (HDDs, etc.) (up 6.5 times from 2000), automobile-related items, such as passenger vehicles (up by 33.0 times from 2000), cargo vehicles (pickup trucks, etc.) (up by 4.2 times from 2000), and automotive parts (up by 8.2 times from 2000), and household electric appliances/general machine-related products, such as air conditioners (up by 3.2 times from 2000), digital cameras (up by 10.5 times from 2000), printers (up by 109.1 times from 2000), and refrigerators (up by 4.5 times from 2000). It is clear from this that these items have rapidly become major export items through the 2000s.
74 Secretary General Achaka of the BOI stated that the decision was made on the expansion of favorable treatment because the investment had been sluggish in Ayutthaya and Pathum Thani while investments in the southeast such as Chonburi and Rayong where no flood damage was done had been recently increasing (accounting for nearly 50% of the entire applications submitted in January-February 2012). (NNA dated on March 30, 2012)
75 Total exports of 2011 increased by about 17.2% from 2010; however, because the degree of impact of floods on items is different, analysis was made on 2010 in order to observe the situation at a recent normal time.
76 It should be noted that there are categories where items included in the classification based on the four-digit HS cade are different between 2000 (HS1996) and 2010 (HS2007). Since the names of the items may also have changed, this paper uniformly adopts the names listed in the 2010 classification (HS2007).
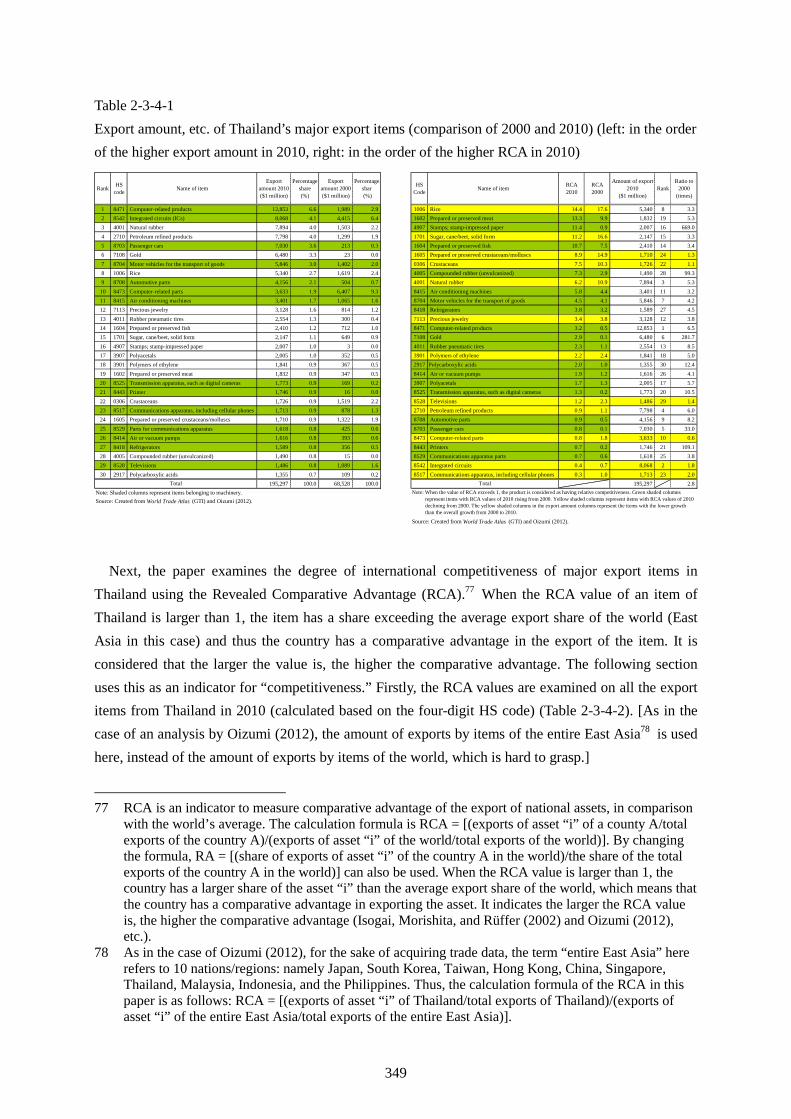
349
Table 2-3-4-1 Export amount, etc. of Thailand’s major export items (comparison of 2000 and 2010) (left: in the order of the higher export amount in 2010, right: in the order of the higher RCA in 2010)
Rank HScode Name of item
Exportamount 2010($1 million)
Percentageshare(%)
Exportamount 2000($1 million)
Percentageshar (%)
1 8471 Computer-related products 12,853 6.6 1,989 2.92 8542 Integrated circuits (ICs) 8,068 4.1 4,415 6.43 4001 Natural rubber 7,894 4.0 1,503 2.24 2710 Petroleum refined products 7,798 4.0 1,299 1.95 8703 Passenger cars 7,030 3.6 213 0.36 7108 Gold 6,480 3.3 23 0.07 8704 Motor vehicles for the transport of goods 5,846 3.0 1,402 2.08 1006 Rice 5,340 2.7 1,619 2.49 8708 Automotive parts 4,156 2.1 504 0.710 8473 Computer-related parts 3,633 1.9 6,407 9.311 8415 Air conditioning machines 3,401 1.7 1,065 1.612 7113 Precious jewelry 3,128 1.6 814 1.213 4011 Rubber pneumatic tires 2,554 1.3 300 0.414 1604 Prepared or preserved fish 2,410 1.2 712 1.015 1701 Sugar, cane/beet, solid form 2,147 1.1 649 0.916 4907 Stamps; stamp-impressed paper 2,007 1.0 3 0.017 3907 Polyacetals 2,005 1.0 352 0.518 3901 Polymers of ethylene 1,841 0.9 367 0.519 1602 Prepared or preserved meat 1,832 0.9 347 0.520 8525 Transmission apparatus, such as digital cameras 1,773 0.9 169 0.221 8443 Printer 1,746 0.9 16 0.022 0306 Crustaceans 1,726 0.9 1,519 2.223 8517 Communications apparatus, including cellular phones 1,713 0.9 878 1.324 1605 Prepared or preserved crustaceans/molluscs 1,710 0.9 1,322 1.925 8529 Parts for communications apparatus 1,618 0.8 425 0.626 8414 Air or vacuum pumps 1,616 0.8 393 0.627 8418 Refrigerators 1,589 0.8 356 0.528 4005 Compounded rubber (unvulcanized) 1,490 0.8 15 0.029 8528 Televisions 1,486 0.8 1,089 1.630 2917 Polycarboxylic acids 1,355 0.7 109 0.2
195,297 100.0 68,528 100.0Total
Source: Created from World Trade Atlas (GTI) and Oizumi (2012).Note: Shaded columns represent items belonging to machinery.
HSCode Name of item RCA
2010RCA2000
Amount of export2010
($1 million)Rank
Ratio to2000
(times)
1006 Rice 14.4 17.6 5,340 8 3.31602 Prepared or preserved meat 13.3 9.9 1,832 19 5.34907 Stamps; stamp-impressed paper 11.4 0.9 2,007 16 669.01701 Sugar, cane/beet, solid form 11.2 16.6 2,147 15 3.31604 Prepared or preserved fish 10.7 7.5 2,410 14 3.41605 Prepared or preserved crustaceans/molluscs 8.9 14.9 1,710 24 1.30306 Crustaceans 7.5 10.3 1,726 22 1.14005 Compounded rubber (unvulcanized) 7.3 2.9 1,490 28 99.34001 Natural rubber 6.2 10.9 7,894 3 5.38415 Air conditioning machines 5.8 4.4 3,401 11 3.28704 Motor vehicles for the transport of goods 4.5 4.1 5,846 7 4.28418 Refrigerators 3.8 3.2 1,589 27 4.57113 Precious jewelry 3.4 3.8 3,128 12 3.88471 Computer-related products 3.2 0.5 12,853 1 6.57108 Gold 2.9 0.1 6,480 6 281.74011 Rubber pneumatic tires 2.3 1.1 2,554 13 8.53901 Polymers of ethylene 2.2 2.4 1,841 18 5.02917 Polycarboxylic acids 2.0 1.0 1,355 30 12.48414 Air or vacuum pumps 1.9 1.2 1,616 26 4.13907 Polyacetals 1.7 1.3 2,005 17 5.78525 Transmission apparatus, such as digital cameras 1.3 0.2 1,773 20 10.58528 Televisions 1.2 2.3 1,486 29 1.42710 Petroleum refined products 0.9 1.1 7,798 4 6.08708 Automotive parts 0.9 0.5 4,156 9 8.28703 Passenger cars 0.8 0.1 7,030 5 33.08473 Computer-related parts 0.8 1.8 3,633 10 0.68443 Printers 0.7 0.2 1,746 21 109.18529 Communications apparatus parts 0.7 0.6 1,618 25 3.88542 Integrated circuits 0.4 0.7 8,068 2 1.88517 Communications apparatus, including cellular phones 0.3 1.0 1,713 23 2.0
195,297 2.8TotalNote: When the value of RCA exceeds 1, the product is considered as having relative competitiveness. Green shaded columns represent items with RCA values of 2010 rising from 2000. Yellow shaded columns represent items with RCA values of 2010 declining from 2000. The yellow shaded columns in the export amount columns represent the items with the lower growth than the overall growth from 2000 to 2010.
Source: Created from World Trade Atlas (GTI) and Oizumi (2012).
Next, the paper examines the degree of international competitiveness of major export items in Thailand using the Revealed Comparative Advantage (RCA).77 When the RCA value of an item of Thailand is larger than 1, the item has a share exceeding the average export share of the world (East Asia in this case) and thus the country has a comparative advantage in the export of the item. It is considered that the larger the value is, the higher the comparative advantage. The following section uses this as an indicator for “competitiveness.” Firstly, the RCA values are examined on all the export items from Thailand in 2010 (calculated based on the four-digit HS code) (Table 2-3-4-2). [As in the case of an analysis by Oizumi (2012), the amount of exports by items of the entire East Asia78 is used here, instead of the amount of exports by items of the world, which is hard to grasp.]
77 RCA is an indicator to measure comparative advantage of the export of national assets, in comparison
with the world’s average. The calculation formula is RCA = [(exports of asset “i” of a county A/total exports of the country A)/(exports of asset “i” of the world/total exports of the world)]. By changing the formula, RA = [(share of exports of asset “i” of the country A in the world)/the share of the total exports of the country A in the world)] can also be used. When the RCA value is larger than 1, the country has a larger share of the asset “i” than the average export share of the world, which means that the country has a comparative advantage in exporting the asset. It indicates the larger the RCA value is, the higher the comparative advantage (Isogai, Morishita, and Rüffer (2002) and Oizumi (2012), etc.).
78 As in the case of Oizumi (2012), for the sake of acquiring trade data, the term “entire East Asia” here refers to 10 nations/regions: namely Japan, South Korea, Taiwan, Hong Kong, China, Singapore, Thailand, Malaysia, Indonesia, and the Philippines. Thus, the calculation formula of the RCA in this paper is as follows: RCA = [(exports of asset “i” of Thailand/total exports of Thailand)/(exports of asset “i” of the entire East Asia/total exports of the entire East Asia)].
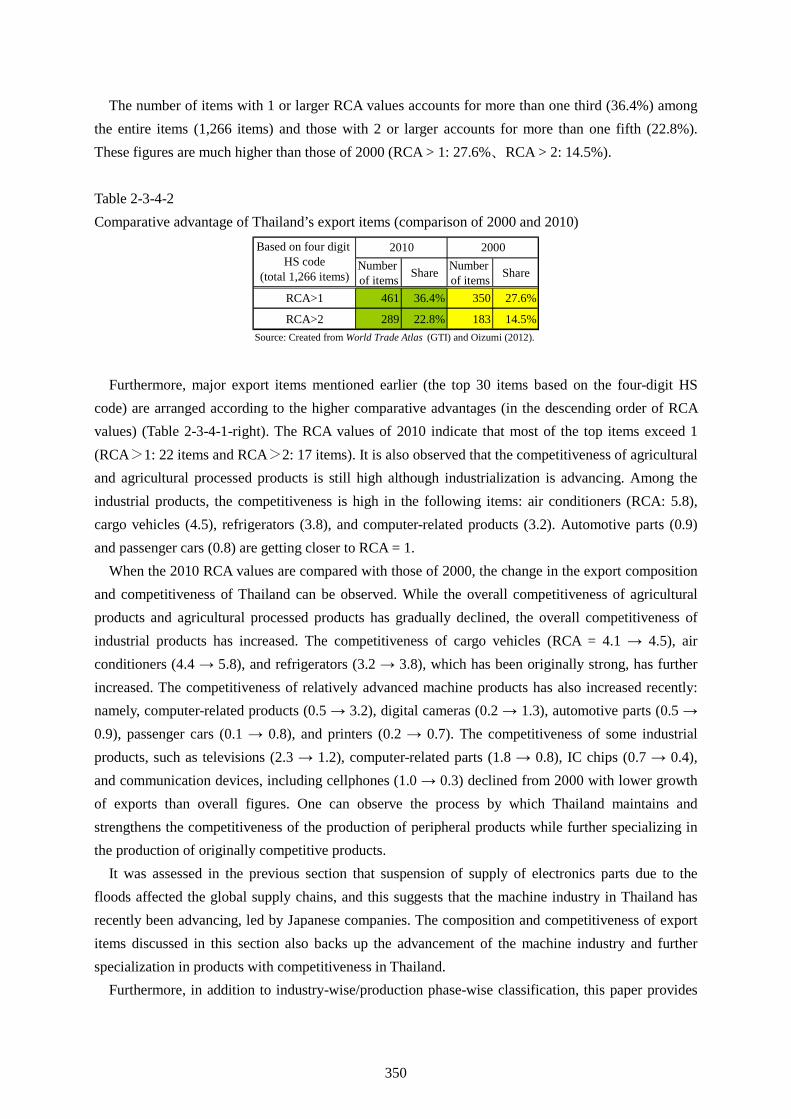
350
The number of items with 1 or larger RCA values accounts for more than one third (36.4%) among the entire items (1,266 items) and those with 2 or larger accounts for more than one fifth (22.8%). These figures are much higher than those of 2000 (RCA > 1: 27.6%、RCA > 2: 14.5%). Table 2-3-4-2 Comparative advantage of Thailand’s export items (comparison of 2000 and 2010)
Number of items Share Number
of items Share
RCA>1 461 36.4% 350 27.6%
RCA>2 289 22.8% 183 14.5%
2010 2000Based on four digit HS code
(total 1,266 items)
Source: Created from World Trade Atlas (GTI) and Oizumi (2012).
Furthermore, major export items mentioned earlier (the top 30 items based on the four-digit HS code) are arranged according to the higher comparative advantages (in the descending order of RCA values) (Table 2-3-4-1-right). The RCA values of 2010 indicate that most of the top items exceed 1 (RCA>1: 22 items and RCA>2: 17 items). It is also observed that the competitiveness of agricultural and agricultural processed products is still high although industrialization is advancing. Among the industrial products, the competitiveness is high in the following items: air conditioners (RCA: 5.8), cargo vehicles (4.5), refrigerators (3.8), and computer-related products (3.2). Automotive parts (0.9) and passenger cars (0.8) are getting closer to RCA = 1.
When the 2010 RCA values are compared with those of 2000, the change in the export composition and competitiveness of Thailand can be observed. While the overall competitiveness of agricultural products and agricultural processed products has gradually declined, the overall competitiveness of industrial products has increased. The competitiveness of cargo vehicles (RCA = 4.1 → 4.5), air conditioners (4.4 → 5.8), and refrigerators (3.2 → 3.8), which has been originally strong, has further increased. The competitiveness of relatively advanced machine products has also increased recently: namely, computer-related products (0.5 → 3.2), digital cameras (0.2 → 1.3), automotive parts (0.5 →0.9), passenger cars (0.1 → 0.8), and printers (0.2 → 0.7). The competitiveness of some industrial products, such as televisions (2.3 → 1.2), computer-related parts (1.8 → 0.8), IC chips (0.7 → 0.4), and communication devices, including cellphones (1.0 → 0.3) declined from 2000 with lower growth of exports than overall figures. One can observe the process by which Thailand maintains and strengthens the competitiveness of the production of peripheral products while further specializing in the production of originally competitive products.
It was assessed in the previous section that suspension of supply of electronics parts due to the floods affected the global supply chains, and this suggests that the machine industry in Thailand has recently been advancing, led by Japanese companies. The composition and competitiveness of export items discussed in this section also backs up the advancement of the machine industry and further specialization in products with competitiveness in Thailand.
Furthermore, in addition to industry-wise/production phase-wise classification, this paper provides
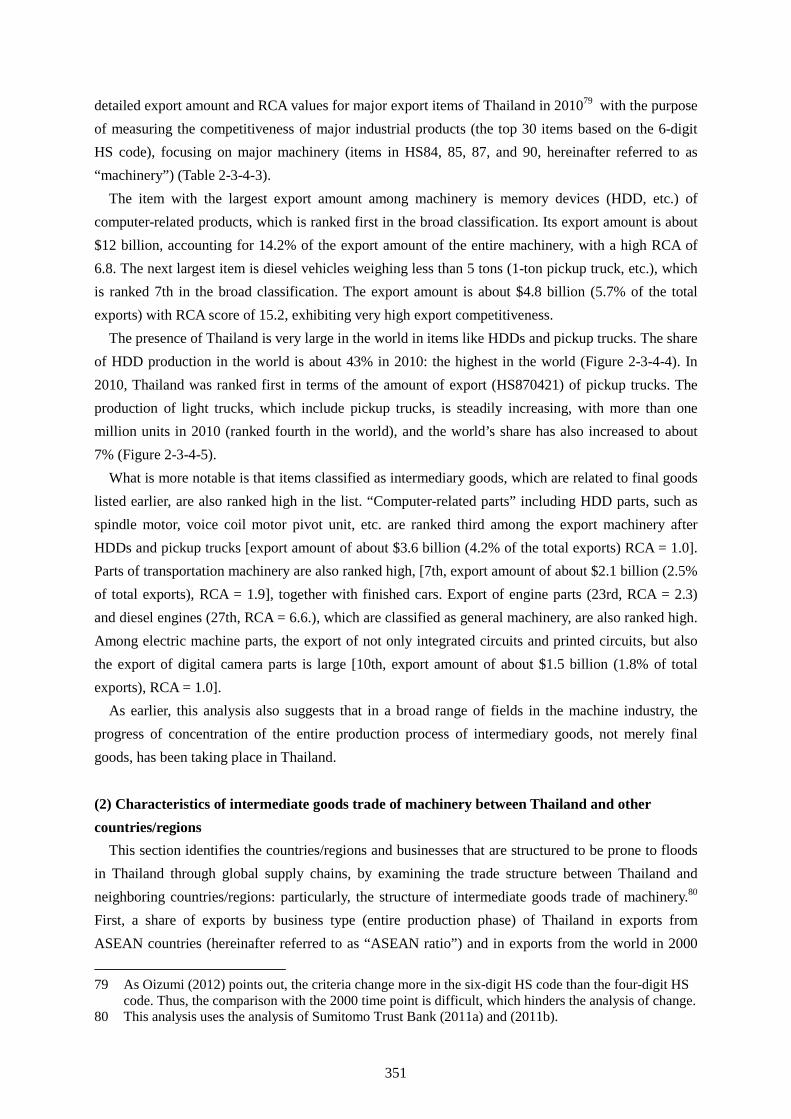
351
detailed export amount and RCA values for major export items of Thailand in 201079 with the purpose of measuring the competitiveness of major industrial products (the top 30 items based on the 6-digit HS code), focusing on major machinery (items in HS84, 85, 87, and 90, hereinafter referred to as “machinery”) (Table 2-3-4-3).
The item with the largest export amount among machinery is memory devices (HDD, etc.) of computer-related products, which is ranked first in the broad classification. Its export amount is about $12 billion, accounting for 14.2% of the export amount of the entire machinery, with a high RCA of 6.8. The next largest item is diesel vehicles weighing less than 5 tons (1-ton pickup truck, etc.), which is ranked 7th in the broad classification. The export amount is about $4.8 billion (5.7% of the total exports) with RCA score of 15.2, exhibiting very high export competitiveness.
The presence of Thailand is very large in the world in items like HDDs and pickup trucks. The share of HDD production in the world is about 43% in 2010: the highest in the world (Figure 2-3-4-4). In 2010, Thailand was ranked first in terms of the amount of export (HS870421) of pickup trucks. The production of light trucks, which include pickup trucks, is steadily increasing, with more than one million units in 2010 (ranked fourth in the world), and the world’s share has also increased to about 7% (Figure 2-3-4-5).
What is more notable is that items classified as intermediary goods, which are related to final goods listed earlier, are also ranked high in the list. “Computer-related parts” including HDD parts, such as spindle motor, voice coil motor pivot unit, etc. are ranked third among the export machinery after HDDs and pickup trucks [export amount of about $3.6 billion (4.2% of the total exports) RCA = 1.0]. Parts of transportation machinery are also ranked high, [7th, export amount of about $2.1 billion (2.5% of total exports), RCA = 1.9], together with finished cars. Export of engine parts (23rd, RCA = 2.3) and diesel engines (27th, RCA = 6.6.), which are classified as general machinery, are also ranked high. Among electric machine parts, the export of not only integrated circuits and printed circuits, but also the export of digital camera parts is large [10th, export amount of about $1.5 billion (1.8% of total exports), RCA = 1.0].
As earlier, this analysis also suggests that in a broad range of fields in the machine industry, the progress of concentration of the entire production process of intermediary goods, not merely final goods, has been taking place in Thailand. (2) Characteristics of intermediate goods trade of machinery between Thailand and other countries/regions
This section identifies the countries/regions and businesses that are structured to be prone to floods in Thailand through global supply chains, by examining the trade structure between Thailand and neighboring countries/regions: particularly, the structure of intermediate goods trade of machinery.80 First, a share of exports by business type (entire production phase) of Thailand in exports from ASEAN countries (hereinafter referred to as “ASEAN ratio”) and in exports from the world in 2000
79 As Oizumi (2012) points out, the criteria change more in the six-digit HS code than the four-digit HS
code. Thus, the comparison with the 2000 time point is difficult, which hinders the analysis of change. 80 This analysis uses the analysis of Sumitomo Trust Bank (2011a) and (2011b).
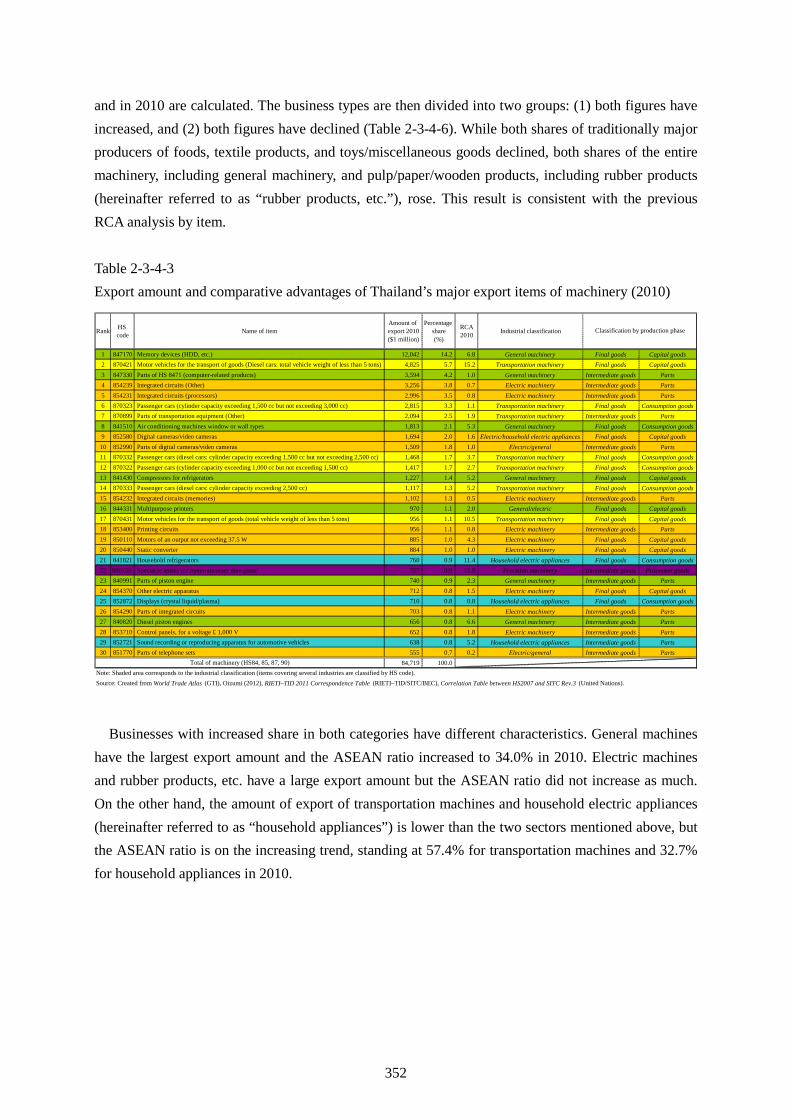
352
and in 2010 are calculated. The business types are then divided into two groups: (1) both figures have increased, and (2) both figures have declined (Table 2-3-4-6). While both shares of traditionally major producers of foods, textile products, and toys/miscellaneous goods declined, both shares of the entire machinery, including general machinery, and pulp/paper/wooden products, including rubber products (hereinafter referred to as “rubber products, etc.”), rose. This result is consistent with the previous RCA analysis by item. Table 2-3-4-3 Export amount and comparative advantages of Thailand’s major export items of machinery (2010)
Rank HS code Name of item
Amount of export 2010($1 million)
Percentage share(%)
RCA2010 Industrial classification
1 847170 Memory devices (HDD, etc.) 12,042 14.2 6.8 General machinery Final goods Capital goods2 870421 Motor vehicles for the transport of goods (Diesel cars: total vehicle weight of less than 5 tons) 4,825 5.7 15.2 Transportation machinery Final goods Capital goods3 847330 Parts of HS 8471 (computer-related products) 3,594 4.2 1.0 General machinery Intermediate goods Parts4 854239 Integrated circuits (Other) 3,256 3.8 0.7 Electric machinery Intermediate goods Parts5 854231 Integrated circuits (processors) 2,996 3.5 0.8 Electric machinery Intermediate goods Parts6 870323 Passenger cars (cylinder capacity exceeding 1,500 cc but not exceeding 3,000 cc) 2,815 3.3 1.1 Transportation machinery Final goods Consumption goods7 870899 Parts of transportation equipment (Other) 2,094 2.5 1.9 Transportation machinery Intermediate goods Parts8 841510 Air conditioning machines window or wall types 1,813 2.1 5.3 General machinery Final goods Consumption goods9 852580 Digital cameras/video cameras 1,694 2.0 1.6 Electric/household electric appliances Final goods Capital goods10 852990 Parts of digital cameras/video cameras 1,509 1.8 1.0 Electric/general Intermediate goods Parts11 870332 Passenger cars (diesel cars: cylinder capacity exceeding 1,500 cc but not exceeding 2,500 cc) 1,468 1.7 3.7 Transportation machinery Final goods Consumption goods12 870322 Passenger cars (cylinder capacity exceeding 1,000 cc but not exceeding 1,500 cc) 1,417 1.7 2.7 Transportation machinery Final goods Consumption goods13 841430 Compressors for refrigerators 1,227 1.4 5.2 General machinery Final goods Capital goods14 870333 Passenger cars (diesel cars: cylinder capacity exceeding 2,500 cc) 1,117 1.3 5.2 Transportation machinery Final goods Consumption goods15 854232 Integrated circuits (memories) 1,102 1.3 0.5 Electric machinery Intermediate goods Parts16 844331 Multipurpose printers 970 1.1 2.0 General/electric Final goods Capital goods17 870431 Motor vehicles for the transport of goods (total vehicle weight of less than 5 tons) 956 1.1 10.5 Transportation machinery Final goods Capital goods18 853400 Printing circuits 956 1.1 0.8 Electric machinery Intermediate goods Parts19 850110 Motors of an output not exceeding 37.5 W 885 1.0 4.3 Electric machinery Final goods Capital goods20 850440 Static converter 884 1.0 1.0 Electric machinery Final goods Capital goods21 841821 Household refrigerators 760 0.9 11.4 Household electric appliances Final goods Consumption goods22 900150 Spectacle lenses (of materials other than glass) 757 0.9 11.8 Precision machinery Intermediate goods Processed goods23 840991 Parts of piston engine 740 0.9 2.3 General machinery Intermediate goods Parts24 854370 Other electric apparatus 712 0.8 1.5 Electric machinery Final goods Capital goods25 852872 Displays (crystal liquid/plasma) 710 0.8 0.8 Household electric appliances Final goods Consumption goods26 854290 Parts of integrated circuits 703 0.8 1.1 Electric machinery Intermediate goods Parts27 840820 Diesel piston engines 656 0.8 6.6 General machinery Intermediate goods Parts28 853710 Control panels, for a voltage £ 1,000 V 652 0.8 1.8 Electric machinery Intermediate goods Parts29 852721 Sound recording or reproducing apparatus for automotive vehicles 638 0.8 5.2 Household electric appliances Intermediate goods Parts30 851770 Parts of telephone sets 555 0.7 0.2 Electric/general Intermediate goods Parts
84,719 100.0Total of machinery (HS84, 85, 87, 90)
Classification by production phase
Note: Shaded area corresponds to the industrial classification (items covering several industries are classified by HS code).Source: Created from World Trade Atlas (GTI), Oizumi (2012), RIETI–TID 2011 Correspondence Table (RIETI–TID/SITC/BEC), Correlation Table between HS2007 and SITC Rev.3 (United Nations).
Businesses with increased share in both categories have different characteristics. General machines have the largest export amount and the ASEAN ratio increased to 34.0% in 2010. Electric machines and rubber products, etc. have a large export amount but the ASEAN ratio did not increase as much. On the other hand, the amount of export of transportation machines and household electric appliances (hereinafter referred to as “household appliances”) is lower than the two sectors mentioned above, but the ASEAN ratio is on the increasing trend, standing at 57.4% for transportation machines and 32.7% for household appliances in 2010.
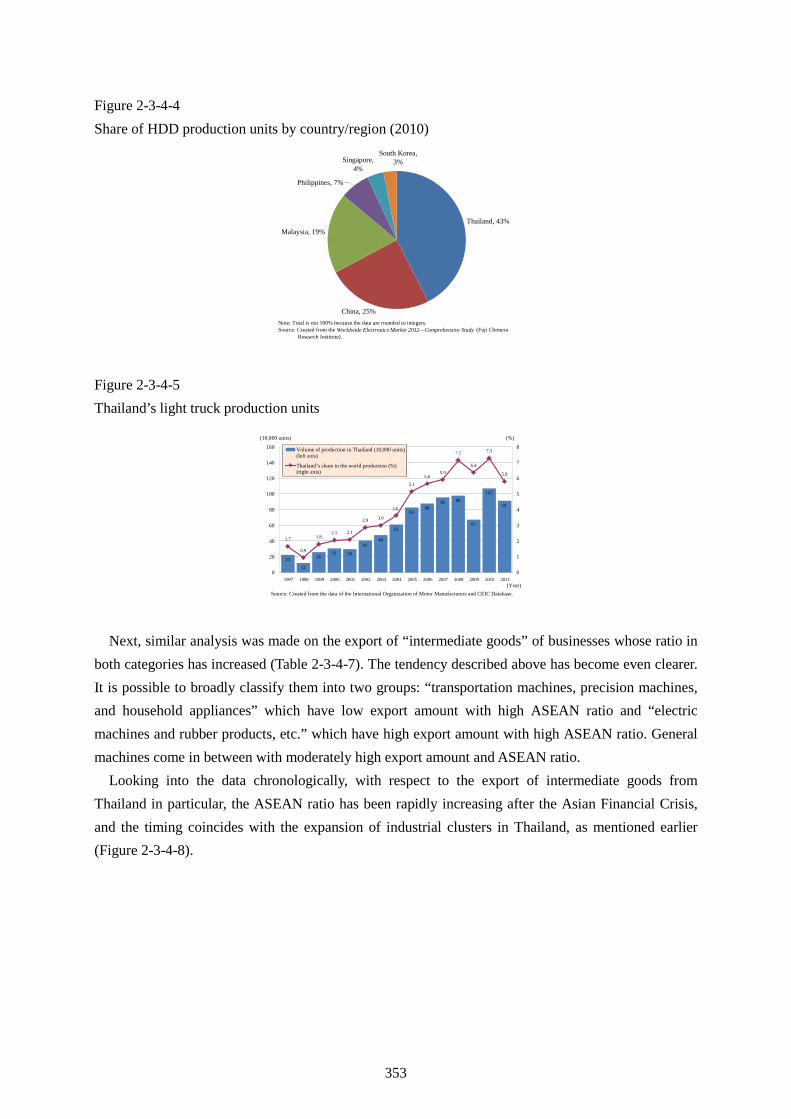
353
Figure 2-3-4-4 Share of HDD production units by country/region (2010)
South Korea,3%Singapore,
4%
Philippines, 7%
China, 25%
Malaysia, 19%Thailand, 43%
Note: Total is not 100% because the data are rounded to integers.Source: Created from the Worldwide Electronics Market 2012—Comprehensive Study (Fuji Chimera Research Institute).
Figure 2-3-4-5 Thailand’s light truck production units
23
12
2631 30
4148
61
8388
96 98
67
107
91
1.7
0.9
1.82.1 2.1
2.9 3.0
5.1
5.65.9
7.2
6.4
7.3
5.8
3.6
0
20
40
60
80
100
120
140
160
1997 1998 1999 2000 2001 2002 2003 2004 2005 2006 2007 2008 2009 2010 20110
1
2
3
4
5
6
7
8Volume of production in Thailand (10,000 units)(left axis)
Thailand’s share in the world production (%)(right axis)
(10,000 units) (%)
Source: Created from the data of the International Organization of Motor Manufacturers and CEIC Database.(Year)
Next, similar analysis was made on the export of “intermediate goods” of businesses whose ratio in both categories has increased (Table 2-3-4-7). The tendency described above has become even clearer. It is possible to broadly classify them into two groups: “transportation machines, precision machines, and household appliances” which have low export amount with high ASEAN ratio and “electric machines and rubber products, etc.” which have high export amount with high ASEAN ratio. General machines come in between with moderately high export amount and ASEAN ratio.
Looking into the data chronologically, with respect to the export of intermediate goods from Thailand in particular, the ASEAN ratio has been rapidly increasing after the Asian Financial Crisis, and the timing coincides with the expansion of industrial clusters in Thailand, as mentioned earlier (Figure 2-3-4-8).
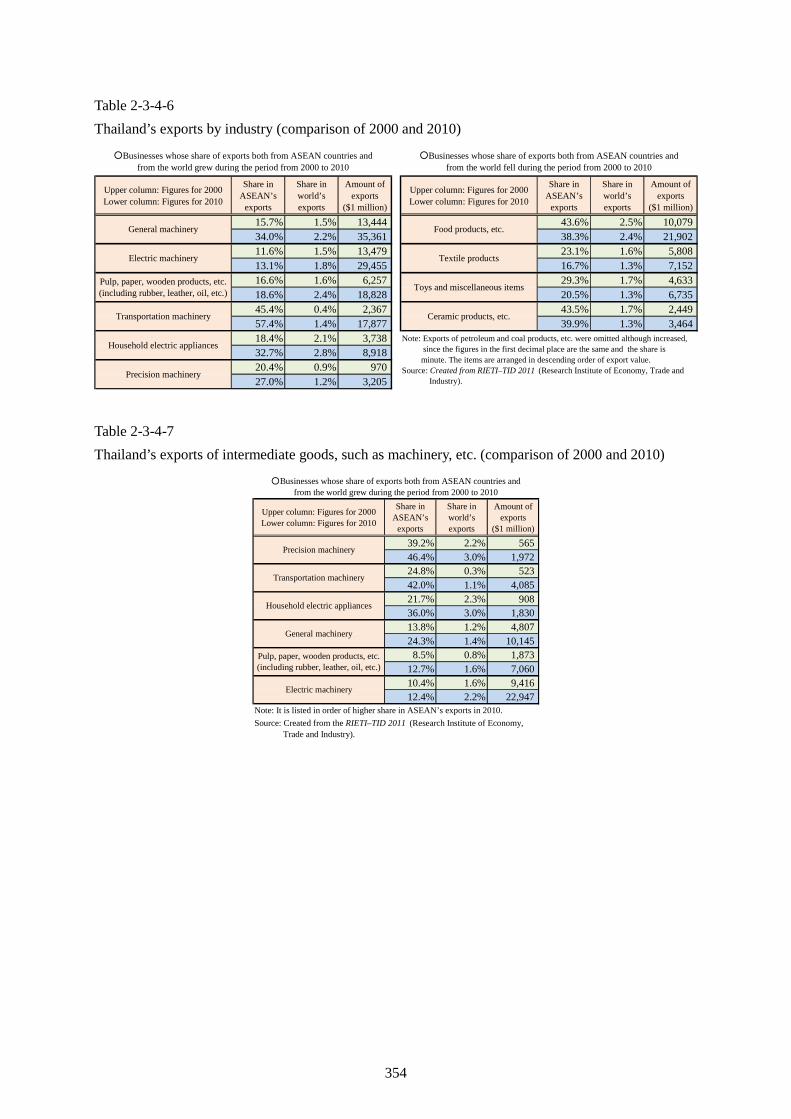
354
Table 2-3-4-6 Thailand’s exports by industry (comparison of 2000 and 2010)
Upper column: Figures for 2000Lower column: Figures for 2010
Share inASEAN’s
exports
Share inworld’sexports
Amount ofexports
($1 million)
Upper column: Figures for 2000Lower column: Figures for 2010
Share inASEAN’s
exports
Share inworld’sexports
Amount ofexports
($1 million)
15.7% 1.5% 13,444 43.6% 2.5% 10,07934.0% 2.2% 35,361 38.3% 2.4% 21,90211.6% 1.5% 13,479 23.1% 1.6% 5,80813.1% 1.8% 29,455 16.7% 1.3% 7,15216.6% 1.6% 6,257 29.3% 1.7% 4,63318.6% 2.4% 18,828 20.5% 1.3% 6,73545.4% 0.4% 2,367 43.5% 1.7% 2,44957.4% 1.4% 17,877 39.9% 1.3% 3,46418.4% 2.1% 3,73832.7% 2.8% 8,91820.4% 0.9% 97027.0% 1.2% 3,205
○Businesses whose share of exports both from ASEAN countries andfrom the world grew during the period from 2000 to 2010
General machinery
Electric machinery
Pulp, paper, wooden products, etc.(including rubber, leather, oil, etc.)
○Businesses whose share of exports both from ASEAN countries andfrom the world fell during the period from 2000 to 2010
Food products, etc.
Textile products
Toys and miscellaneous items
Ceramic products, etc.
Note: Exports of petroleum and coal products, etc. were omitted although increased, since the figures in the first decimal place are the same and the share is minute. The items are arranged in descending order of export value.Source: Created from RIETI–TID 2011 (Research Institute of Economy, Trade and Industry).
Household electric appliances
Precision machinery
Transportation machinery
Table 2-3-4-7 Thailand’s exports of intermediate goods, such as machinery, etc. (comparison of 2000 and 2010)
Upper column: Figures for 2000Lower column: Figures for 2010
Share inASEAN’s
exports
Share inworld’sexports
Amount ofexports
($1 million)
39.2% 2.2% 56546.4% 3.0% 1,97224.8% 0.3% 52342.0% 1.1% 4,08521.7% 2.3% 90836.0% 3.0% 1,83013.8% 1.2% 4,80724.3% 1.4% 10,145
8.5% 0.8% 1,87312.7% 1.6% 7,06010.4% 1.6% 9,41612.4% 2.2% 22,947
Note: It is listed in order of higher share in ASEAN’s exports in 2010.Source: Created from the RIETI–TID 2011 (Research Institute of Economy, Trade and Industry).
Precision machinery
Household electric appliances
○Businesses whose share of exports both from ASEAN countries andfrom the world grew during the period from 2000 to 2010
General machinery
Electric machinery
Pulp, paper, wooden products, etc.(including rubber, leather, oil, etc.)
Transportation machinery
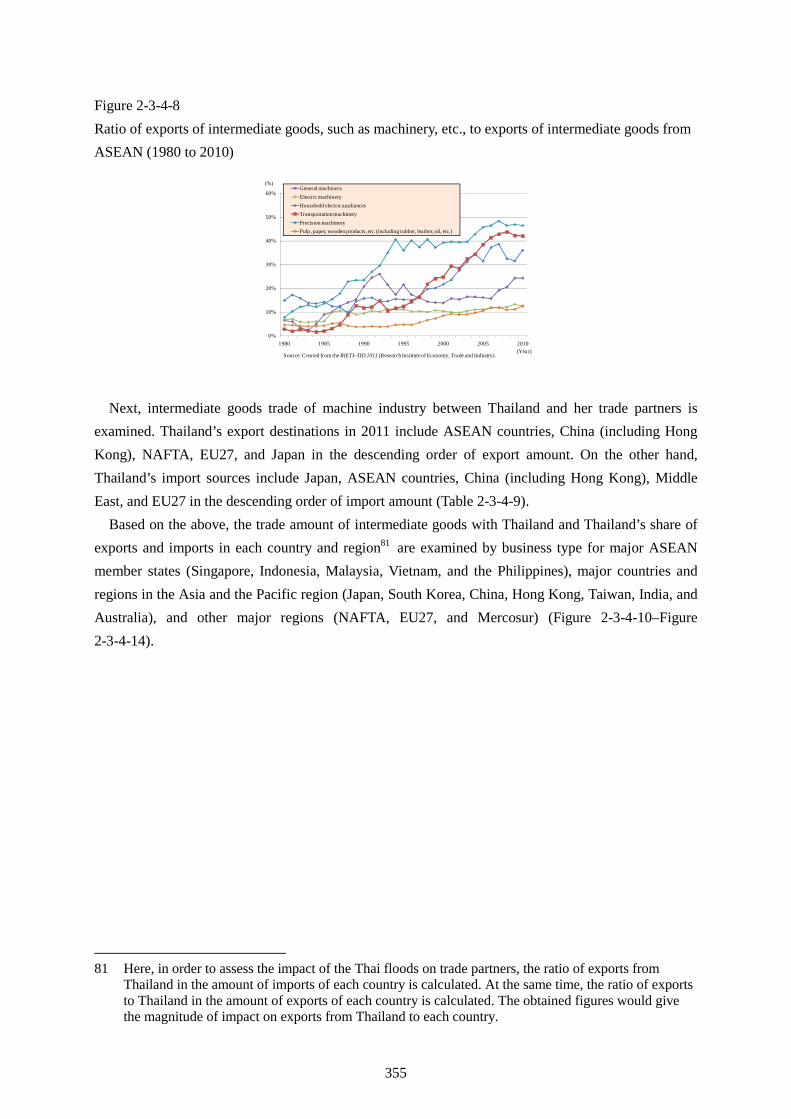
355
Figure 2-3-4-8 Ratio of exports of intermediate goods, such as machinery, etc., to exports of intermediate goods from ASEAN (1980 to 2010)
0%
10%
20%
30%
40%
50%
60%
1980 1985 1990 1995 2000 2005 2010
General machineryElectric machineryHousehold electric appliancesTransportation machineryPrecision machineryPulp, paper, wooden products, etc. (including rubber, leather, oil, etc.)
Source: Created from the RIETI–TID 2011 (Research Institute of Economy, Trade and Industry).(Year)
(%)
Next, intermediate goods trade of machine industry between Thailand and her trade partners is examined. Thailand’s export destinations in 2011 include ASEAN countries, China (including Hong Kong), NAFTA, EU27, and Japan in the descending order of export amount. On the other hand, Thailand’s import sources include Japan, ASEAN countries, China (including Hong Kong), Middle East, and EU27 in the descending order of import amount (Table 2-3-4-9).
Based on the above, the trade amount of intermediate goods with Thailand and Thailand’s share of exports and imports in each country and region81 are examined by business type for major ASEAN member states (Singapore, Indonesia, Malaysia, Vietnam, and the Philippines), major countries and regions in the Asia and the Pacific region (Japan, South Korea, China, Hong Kong, Taiwan, India, and Australia), and other major regions (NAFTA, EU27, and Mercosur) (Figure 2-3-4-10–Figure 2-3-4-14).
81 Here, in order to assess the impact of the Thai floods on trade partners, the ratio of exports from Thailand in the amount of imports of each country is calculated. At the same time, the ratio of exports to Thailand in the amount of exports of each country is calculated. The obtained figures would give the magnitude of impact on exports from Thailand to each country.
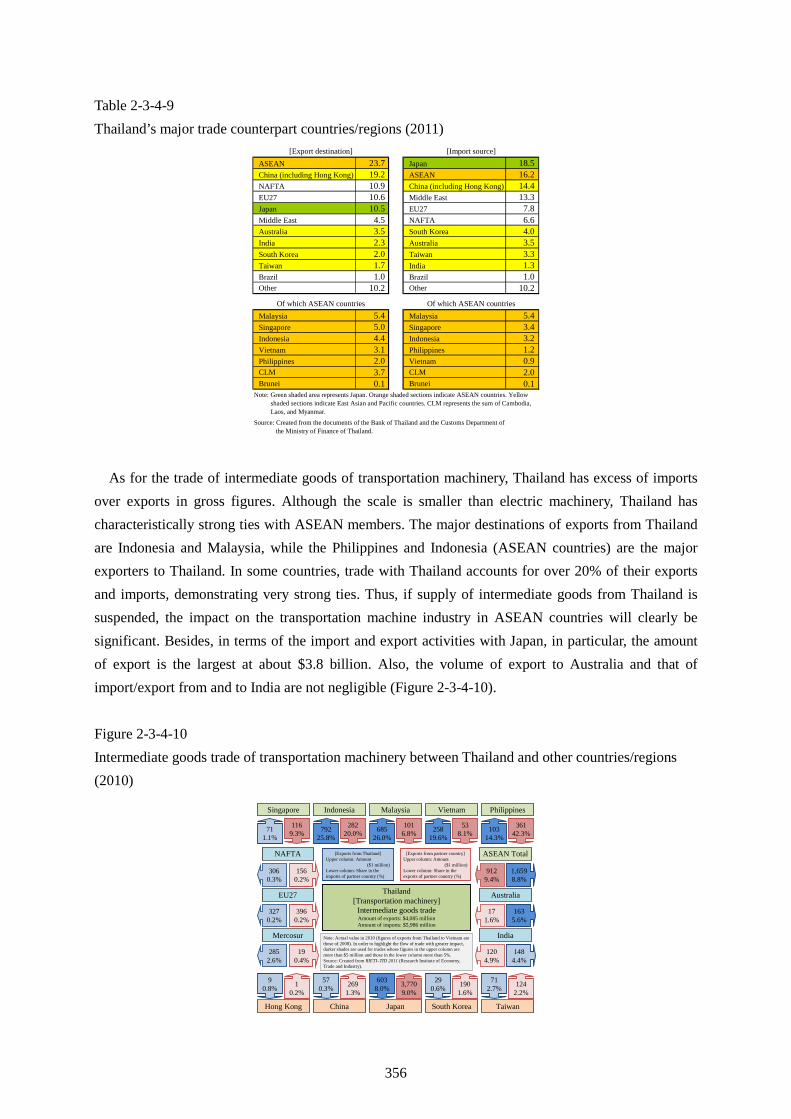
356
Table 2-3-4-9 Thailand’s major trade counterpart countries/regions (2011)
ASEAN 23.7 Japan 18.5China (including Hong Kong) 19.2 ASEAN 16.2NAFTA 10.9 China (including Hong Kong) 14.4EU27 10.6 Middle East 13.3Japan 10.5 EU27 7.8Middle East 4.5 NAFTA 6.6Australia 3.5 South Korea 4.0India 2.3 Australia 3.5South Korea 2.0 Taiwan 3.3Taiwan 1.7 India 1.3Brazil 1.0 Brazil 1.0Other 10.2 Other 10.2
Malaysia 5.4 Malaysia 5.4Singapore 5.0 Singapore 3.4Indonesia 4.4 Indonesia 3.2Vietnam 3.1 Philippines 1.2Philippines 2.0 Vietnam 0.9CLM 3.7 CLM 2.0Brunei 0.1 Brunei 0.1
[Export destination] [Import source]
Source: Created from the documents of the Bank of Thailand and the Customs Department of the Ministry of Finance of Thailand.
Note: Green shaded area represents Japan. Orange shaded sections indicate ASEAN countries. Yellow shaded sections indicate East Asian and Pacific countries. CLM represents the sum of Cambodia, Laos, and Myanmar.
Of which ASEAN countries Of which ASEAN countries
As for the trade of intermediate goods of transportation machinery, Thailand has excess of imports over exports in gross figures. Although the scale is smaller than electric machinery, Thailand has characteristically strong ties with ASEAN members. The major destinations of exports from Thailand are Indonesia and Malaysia, while the Philippines and Indonesia (ASEAN countries) are the major exporters to Thailand. In some countries, trade with Thailand accounts for over 20% of their exports and imports, demonstrating very strong ties. Thus, if supply of intermediate goods from Thailand is suspended, the impact on the transportation machine industry in ASEAN countries will clearly be significant. Besides, in terms of the import and export activities with Japan, in particular, the amount of export is the largest at about $3.8 billion. Also, the volume of export to Australia and that of import/export from and to India are not negligible (Figure 2-3-4-10). Figure 2-3-4-10 Intermediate goods trade of transportation machinery between Thailand and other countries/regions (2010)
Singapore Indonesia PhilippinesVietnamMalaysia
Hong Kong
NAFTA
Thailand [Transportation machinery]
Intermediate goods tradeAmount of exports: $4,085 millionAmount of imports: $5,986 million
711.1%
1169.3%
10.2%
10314.3%
25819.6%
68526.0%
79225.8%
90.8%
36142.3%
538.1%
1016.8%
28220.0%
712.7%
290.6%
6038.0%
570.3% 124
2.2%190
1.6%3,7709.0%
2691.3%
China Japan South Korea Taiwan
EU27 Australia
IndiaMercosur
1560.2%
3060.3%
171.6%
1204.9%
1635.6%
1484.4%
2852.6%
3270.2%
3960.2%
190.4%
Note: Actual value in 2010 (figures of exports from Thailand to Vietnam are those of 2008). In order to highlight the flow of trade with greater impact, darker shades are used for trades whose figures in the upper column are more than $5 million and those in the lower column more than 5%.Source: Created from RIETI–TID 2011 (Research Institute of Economy, Trade and Industry).
[Exports from Thailand] Upper column: Amount
($1 million) Lower column: Share in the imports of partner country (%)
[Exports from partner country] Upper column: Amount
($1 million) Lower column: Share in the exports of partner country (%)
ASEAN Total
9129.4%
1,6598.8%
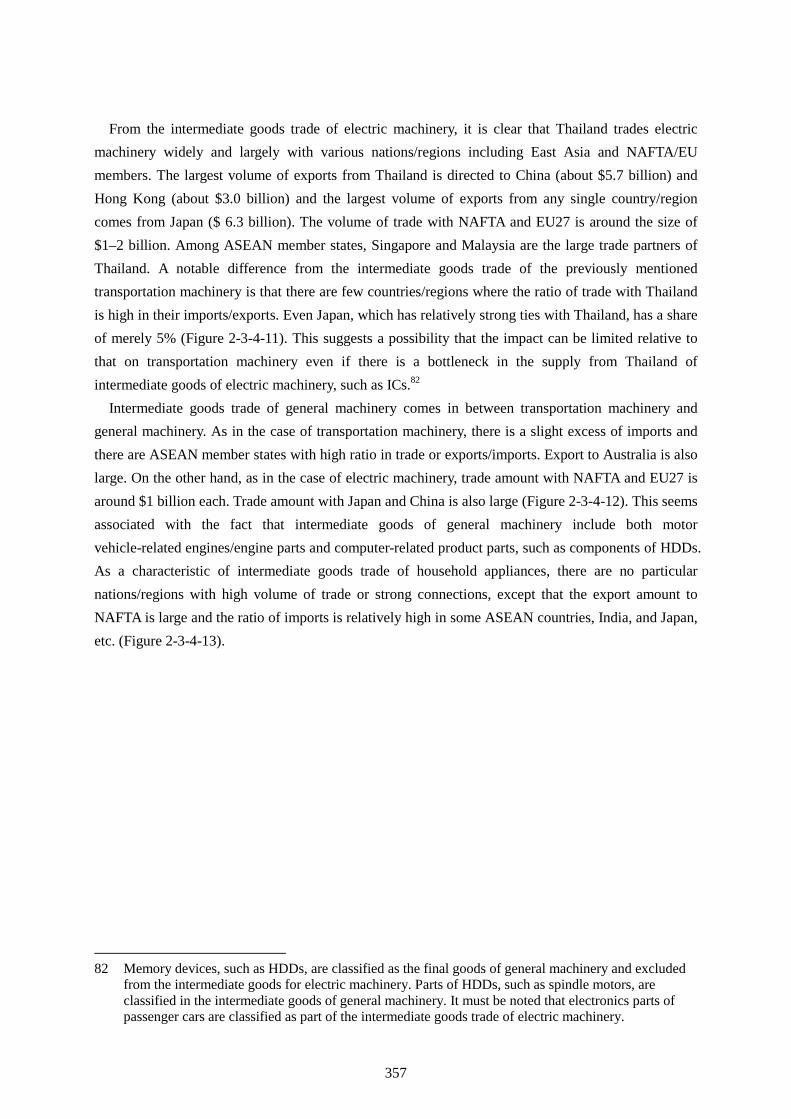
357
From the intermediate goods trade of electric machinery, it is clear that Thailand trades electric
machinery widely and largely with various nations/regions including East Asia and NAFTA/EU members. The largest volume of exports from Thailand is directed to China (about $5.7 billion) and Hong Kong (about $3.0 billion) and the largest volume of exports from any single country/region comes from Japan ($ 6.3 billion). The volume of trade with NAFTA and EU27 is around the size of $1–2 billion. Among ASEAN member states, Singapore and Malaysia are the large trade partners of Thailand. A notable difference from the intermediate goods trade of the previously mentioned transportation machinery is that there are few countries/regions where the ratio of trade with Thailand is high in their imports/exports. Even Japan, which has relatively strong ties with Thailand, has a share of merely 5% (Figure 2-3-4-11). This suggests a possibility that the impact can be limited relative to that on transportation machinery even if there is a bottleneck in the supply from Thailand of intermediate goods of electric machinery, such as ICs.82
Intermediate goods trade of general machinery comes in between transportation machinery and general machinery. As in the case of transportation machinery, there is a slight excess of imports and there are ASEAN member states with high ratio in trade or exports/imports. Export to Australia is also large. On the other hand, as in the case of electric machinery, trade amount with NAFTA and EU27 is around $1 billion each. Trade amount with Japan and China is also large (Figure 2-3-4-12). This seems associated with the fact that intermediate goods of general machinery include both motor vehicle-related engines/engine parts and computer-related product parts, such as components of HDDs. As a characteristic of intermediate goods trade of household appliances, there are no particular nations/regions with high volume of trade or strong connections, except that the export amount to NAFTA is large and the ratio of imports is relatively high in some ASEAN countries, India, and Japan, etc. (Figure 2-3-4-13).
82 Memory devices, such as HDDs, are classified as the final goods of general machinery and excluded from the intermediate goods for electric machinery. Parts of HDDs, such as spindle motors, are classified in the intermediate goods of general machinery. It must be noted that electronics parts of passenger cars are classified as part of the intermediate goods trade of electric machinery.
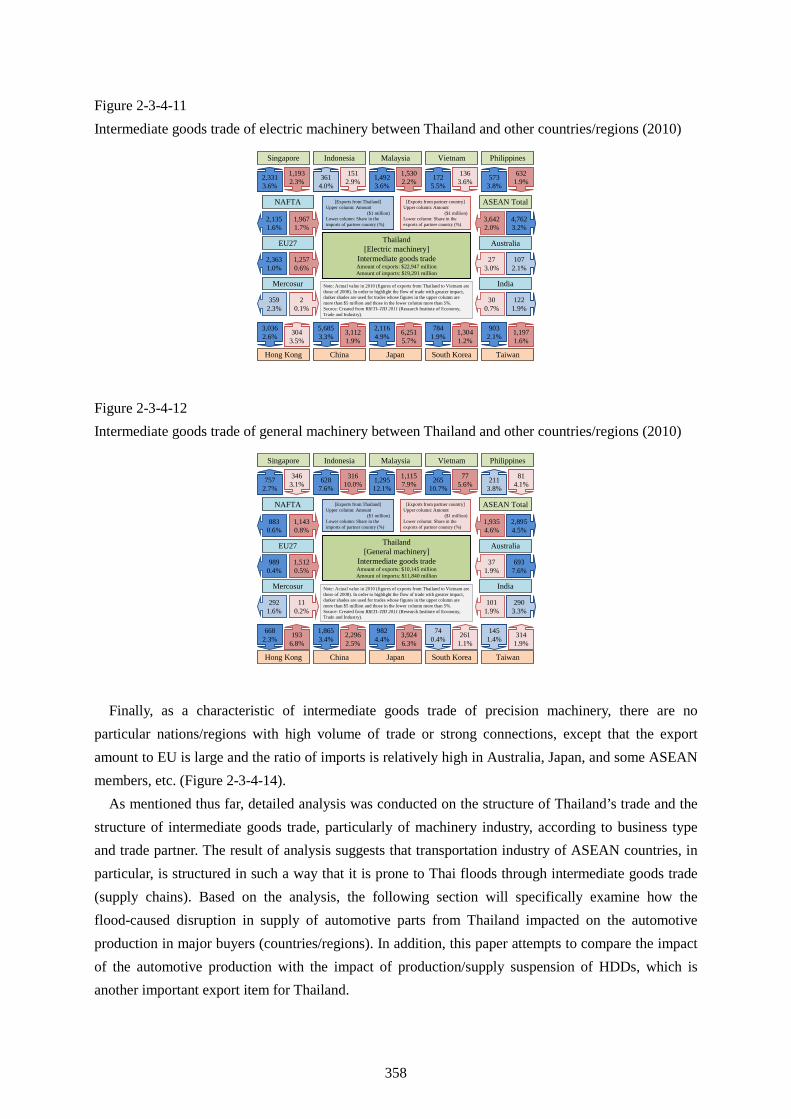
358
Figure 2-3-4-11 Intermediate goods trade of electric machinery between Thailand and other countries/regions (2010)
Thailand[Electric machinery]
Intermediate goods tradeAmount of exports: $22,947 million Amount of imports: $19,291 million
2,3313.6%
1,1932.3%
3043.5%
5733.8%
1725.5%
1,4923.6%
3614.0%
3,0362.6%
6321.9%
1363.6%
1,5302.2%
1512.9%
9032.1%
7841.9%
2,1164.9%
5,6853.3% 1,197
1.6%1,3041.2%
6,2515.7%
3,1121.9%
1,9671.7%
2,1351.6%
273.0%
300.7%
1072.1%
1221.9%
3592.3%
2,3631.0%
1,2570.6%
20.1%
3,6422.0%
4,7623.2%
Singapore Indonesia PhilippinesVietnamMalaysia
Hong Kong
NAFTA
China Japan South Korea Taiwan
EU27 Australia
IndiaMercosur
ASEAN Total
Note: Actual value in 2010 (figures of exports from Thailand to Vietnam are those of 2008). In order to highlight the flow of trade with greater impact, darker shades are used for trades whose figures in the upper column are more than $5 million and those in the lower column more than 5%.Source: Created from RIETI–TID 2011 (Research Institute of Economy, Trade and Industry).
[Exports from Thailand] Upper column: Amount
($1 million) Lower column: Share in the imports of partner country (%)
[Exports from partner country] Upper column: Amount
($1 million) Lower column: Share in the exports of partner country (%)
Figure 2-3-4-12 Intermediate goods trade of general machinery between Thailand and other countries/regions (2010)
Thailand [General machinery]
Intermediate goods tradeAmount of exports: $10,145 millionAmount of imports: $11,840 million
7572.7%
3463.1%
1936.8%
2113.8%
26510.7%
1,29512.1%
6287.6%
6682.3%
814.1%
775.6%
1,1157.9%
31610.0%
1451.4%
740.4%
9824.4%
1,8653.4% 314
1.9%261
1.1%3,9246.3%
2,2962.5%
1,1430.8%
8830.6%
371.9%
1011.9%
6937.6%
2903.3%
2921.6%
9890.4%
1,5120.5%
110.2%
1,9354.6%
2,8954.5%
Singapore Indonesia PhilippinesVietnamMalaysia
Hong Kong
NAFTA
China Japan South Korea Taiwan
EU27 Australia
IndiaMercosur
ASEAN Total
Note: Actual value in 2010 (figures of exports from Thailand to Vietnam are those of 2008). In order to highlight the flow of trade with greater impact, darker shades are used for trades whose figures in the upper column are more than $5 million and those in the lower column more than 5%.Source: Created from RIETI–TID 2011 (Research Institute of Economy, Trade and Industry).
[Exports from Thailand] Upper column: Amount
($1 million) Lower column: Share in the imports of partner country (%)
[Exports from partner country] Upper column: Amount
($1 million) Lower column: Share in the exports of partner country (%)
Finally, as a characteristic of intermediate goods trade of precision machinery, there are no particular nations/regions with high volume of trade or strong connections, except that the export amount to EU is large and the ratio of imports is relatively high in Australia, Japan, and some ASEAN members, etc. (Figure 2-3-4-14).
As mentioned thus far, detailed analysis was conducted on the structure of Thailand’s trade and the structure of intermediate goods trade, particularly of machinery industry, according to business type and trade partner. The result of analysis suggests that transportation industry of ASEAN countries, in particular, is structured in such a way that it is prone to Thai floods through intermediate goods trade (supply chains). Based on the analysis, the following section will specifically examine how the flood-caused disruption in supply of automotive parts from Thailand impacted on the automotive production in major buyers (countries/regions). In addition, this paper attempts to compare the impact of the automotive production with the impact of production/supply suspension of HDDs, which is another important export item for Thailand.
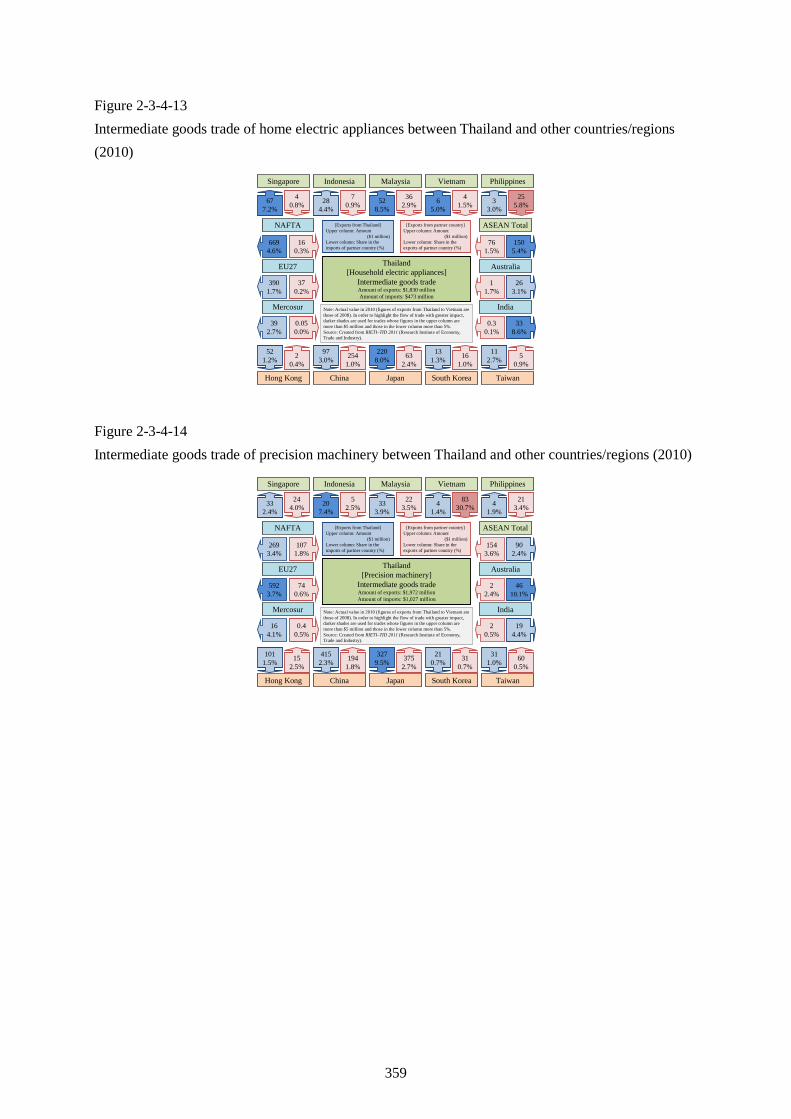
359
Figure 2-3-4-13 Intermediate goods trade of home electric appliances between Thailand and other countries/regions (2010)
Thailand[Household electric appliances]
Intermediate goods tradeAmount of exports: $1,830 millionAmount of imports: $473 million
677.2%
40.8%
20.4%
33.0%
65.0%
528.5%
284.4%
521.2%
255.8%
41.5%
362.9%
70.9%
112.7%
131.3%
2208.0%
973.0% 5
0.9%16
1.0%63
2.4%254
1.0%
160.3%
6694.6%
11.7%
0.30.1%
263.1%
338.6%
392.7%
3901.7%
370.2%
0.050.0%
761.5%
1505.4%
Singapore Indonesia PhilippinesVietnamMalaysia
Hong Kong
NAFTA
China Japan South Korea Taiwan
EU27 Australia
IndiaMercosur
ASEAN Total
Note: Actual value in 2010 (figures of exports from Thailand to Vietnam are those of 2008). In order to highlight the flow of trade with greater impact, darker shades are used for trades whose figures in the upper column are more than $5 million and those in the lower column more than 5%.Source: Created from RIETI–TID 2011 (Research Institute of Economy, Trade and Industry).
[Exports from Thailand] Upper column: Amount
($1 million) Lower column: Share in the imports of partner country (%)
[Exports from partner country] Upper column: Amount
($1 million) Lower column: Share in the exports of partner country (%)
Figure 2-3-4-14 Intermediate goods trade of precision machinery between Thailand and other countries/regions (2010)
Thailand[Precision machinery]
Intermediate goods tradeAmount of exports: $1,972 millionAmount of imports: $1,027 million
332.4%
244.0%
152.5%
41.9%
41.4%
333.9%
207.4%
1011.5%
213.4%
8330.7%
223.5%
52.5%
311.0%
210.7%
3279.5%
4152.3% 60
0.5%31
0.7%375
2.7%194
1.8%
1071.8%
2693.4%
22.4%
20.5%
4610.1%
194.4%
164.1%
5923.7%
740.6%
0.40.5%
1543.6%
902.4%
Singapore Indonesia PhilippinesVietnamMalaysia
Hong Kong
NAFTA
China Japan South Korea Taiwan
EU27 Australia
IndiaMercosur
ASEAN Total
Note: Actual value in 2010 (figures of exports from Thailand to Vietnam are those of 2008). In order to highlight the flow of trade with greater impact, darker shades are used for trades whose figures in the upper column are more than $5 million and those in the lower column more than 5%.Source: Created from RIETI–TID 2011 (Research Institute of Economy, Trade and Industry).
[Exports from Thailand] Upper column: Amount
($1 million) Lower column: Share in the imports of partner country (%)
[Exports from partner country] Upper column: Amount
($1 million) Lower column: Share in the exports of partner country (%)
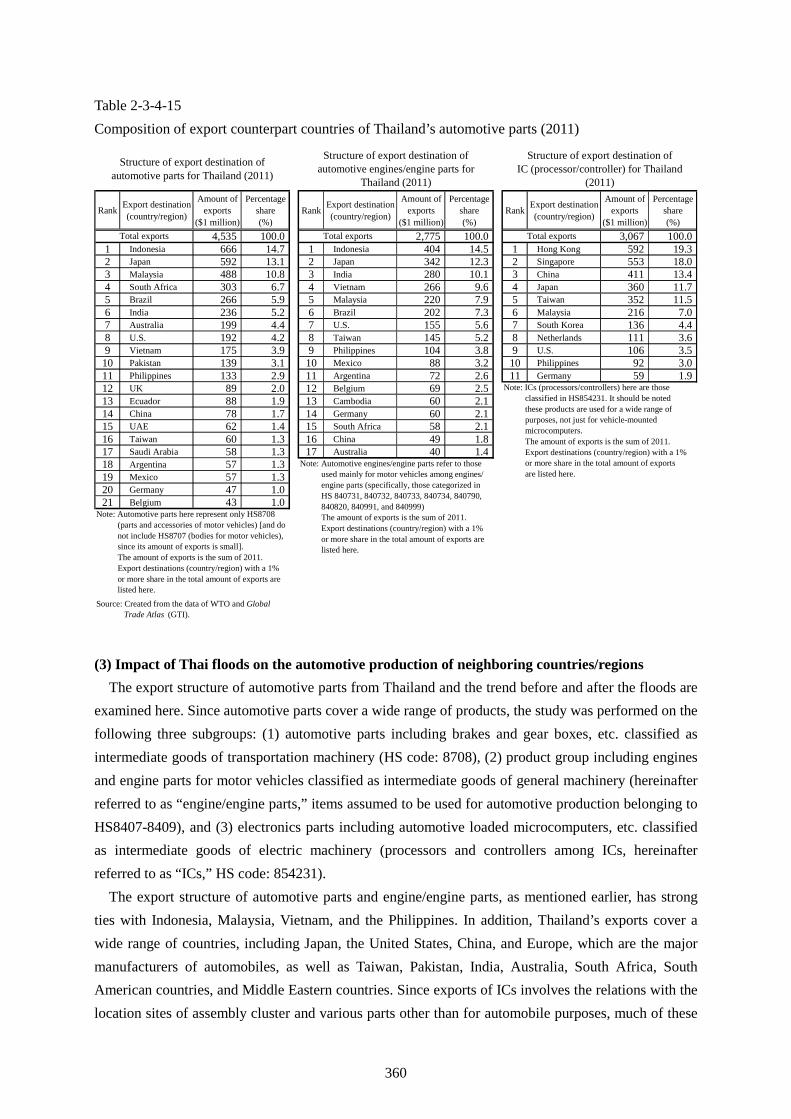
360
Table 2-3-4-15 Composition of export counterpart countries of Thailand’s automotive parts (2011)
Rank Export destination(country/region)
Amount ofexports
($1 million)
Percentageshare(%)
Rank Export destination(country/region)
Amount ofexports
($1 million)
Percentageshare(%)
Rank Export destination(country/region)
Amount ofexports
($1 million)
Percentageshare(%)
4,535 100.0 2,775 100.0 3,067 100.01 Indonesia 666 14.7 1 Indonesia 404 14.5 1 Hong Kong 592 19.32 Japan 592 13.1 2 Japan 342 12.3 2 Singapore 553 18.03 Malaysia 488 10.8 3 India 280 10.1 3 China 411 13.44 South Africa 303 6.7 4 Vietnam 266 9.6 4 Japan 360 11.75 Brazil 266 5.9 5 Malaysia 220 7.9 5 Taiwan 352 11.56 India 236 5.2 6 Brazil 202 7.3 6 Malaysia 216 7.07 Australia 199 4.4 7 U.S. 155 5.6 7 South Korea 136 4.48 U.S. 192 4.2 8 Taiwan 145 5.2 8 Netherlands 111 3.69 Vietnam 175 3.9 9 Philippines 104 3.8 9 U.S. 106 3.510 Pakistan 139 3.1 10 Mexico 88 3.2 10 Philippines 92 3.011 Philippines 133 2.9 11 Argentina 72 2.6 11 Germany 59 1.912 UK 89 2.0 12 Belgium 69 2.513 Ecuador 88 1.9 13 Cambodia 60 2.114 China 78 1.7 14 Germany 60 2.115 UAE 62 1.4 15 South Africa 58 2.116 Taiwan 60 1.3 16 China 49 1.817 Saudi Arabia 58 1.3 17 Australia 40 1.418 Argentina 57 1.319 Mexico 57 1.320 Germany 47 1.021 Belgium 43 1.0
Note: Automotive engines/engine parts refer to those used mainly for motor vehicles among engines/ engine parts (specifically, those categorized in HS 840731, 840732, 840733, 840734, 840790, 840820, 840991, and 840999) The amount of exports is the sum of 2011. Export destinations (country/region) with a 1% or more share in the total amount of exports are listed here.
Note: Automotive parts here represent only HS8708 (parts and accessories of motor vehicles) [and do not include HS8707 (bodies for motor vehicles), since its amount of exports is small]. The amount of exports is the sum of 2011. Export destinations (country/region) with a 1% or more share in the total amount of exports are listed here.
Source: Created from the data of WTO and Global Trade Atlas (GTI).
Structure of export destination ofautomotive parts for Thailand (2011)
Structure of export destination ofautomotive engines/engine parts for
Thailand (2011)
Structure of export destination ofIC (processor/controller) for Thailand
(2011)
Total exports Total exports Total exports
Note: ICs (processors/controllers) here are those classified in HS854231. It should be noted these products are used for a wide range of purposes, not just for vehicle-mounted microcomputers. The amount of exports is the sum of 2011. Export destinations (country/region) with a 1% or more share in the total amount of exports are listed here.
(3) Impact of Thai floods on the automotive production of neighboring countries/regions The export structure of automotive parts from Thailand and the trend before and after the floods are
examined here. Since automotive parts cover a wide range of products, the study was performed on the following three subgroups: (1) automotive parts including brakes and gear boxes, etc. classified as intermediate goods of transportation machinery (HS code: 8708), (2) product group including engines and engine parts for motor vehicles classified as intermediate goods of general machinery (hereinafter referred to as “engine/engine parts,” items assumed to be used for automotive production belonging to HS8407-8409), and (3) electronics parts including automotive loaded microcomputers, etc. classified as intermediate goods of electric machinery (processors and controllers among ICs, hereinafter referred to as “ICs,” HS code: 854231).
The export structure of automotive parts and engine/engine parts, as mentioned earlier, has strong ties with Indonesia, Malaysia, Vietnam, and the Philippines. In addition, Thailand’s exports cover a wide range of countries, including Japan, the United States, China, and Europe, which are the major manufacturers of automobiles, as well as Taiwan, Pakistan, India, Australia, South Africa, South American countries, and Middle Eastern countries. Since exports of ICs involves the relations with the location sites of assembly cluster and various parts other than for automobile purposes, much of these
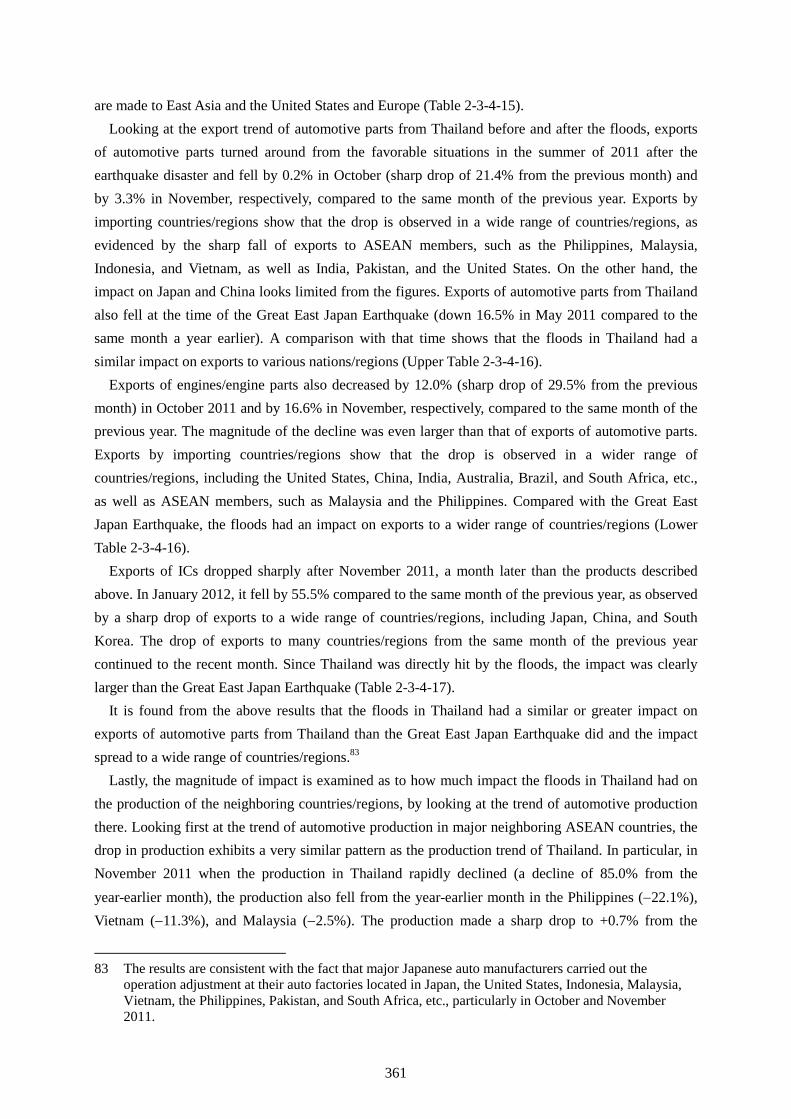
361
are made to East Asia and the United States and Europe (Table 2-3-4-15). Looking at the export trend of automotive parts from Thailand before and after the floods, exports
of automotive parts turned around from the favorable situations in the summer of 2011 after the earthquake disaster and fell by 0.2% in October (sharp drop of 21.4% from the previous month) and by 3.3% in November, respectively, compared to the same month of the previous year. Exports by importing countries/regions show that the drop is observed in a wide range of countries/regions, as evidenced by the sharp fall of exports to ASEAN members, such as the Philippines, Malaysia, Indonesia, and Vietnam, as well as India, Pakistan, and the United States. On the other hand, the impact on Japan and China looks limited from the figures. Exports of automotive parts from Thailand also fell at the time of the Great East Japan Earthquake (down 16.5% in May 2011 compared to the same month a year earlier). A comparison with that time shows that the floods in Thailand had a similar impact on exports to various nations/regions (Upper Table 2-3-4-16).
Exports of engines/engine parts also decreased by 12.0% (sharp drop of 29.5% from the previous month) in October 2011 and by 16.6% in November, respectively, compared to the same month of the previous year. The magnitude of the decline was even larger than that of exports of automotive parts. Exports by importing countries/regions show that the drop is observed in a wider range of countries/regions, including the United States, China, India, Australia, Brazil, and South Africa, etc., as well as ASEAN members, such as Malaysia and the Philippines. Compared with the Great East Japan Earthquake, the floods had an impact on exports to a wider range of countries/regions (Lower Table 2-3-4-16).
Exports of ICs dropped sharply after November 2011, a month later than the products described above. In January 2012, it fell by 55.5% compared to the same month of the previous year, as observed by a sharp drop of exports to a wide range of countries/regions, including Japan, China, and South Korea. The drop of exports to many countries/regions from the same month of the previous year continued to the recent month. Since Thailand was directly hit by the floods, the impact was clearly larger than the Great East Japan Earthquake (Table 2-3-4-17).
It is found from the above results that the floods in Thailand had a similar or greater impact on exports of automotive parts from Thailand than the Great East Japan Earthquake did and the impact spread to a wide range of countries/regions.83
Lastly, the magnitude of impact is examined as to how much impact the floods in Thailand had on the production of the neighboring countries/regions, by looking at the trend of automotive production there. Looking first at the trend of automotive production in major neighboring ASEAN countries, the drop in production exhibits a very similar pattern as the production trend of Thailand. In particular, in November 2011 when the production in Thailand rapidly declined (a decline of 85.0% from the year-earlier month), the production also fell from the year-earlier month in the Philippines (−22.1%), Vietnam (−11.3%), and Malaysia (−2.5%). The production made a sharp drop to +0.7% from the
83 The results are consistent with the fact that major Japanese auto manufacturers carried out the
operation adjustment at their auto factories located in Japan, the United States, Indonesia, Malaysia, Vietnam, the Philippines, Pakistan, and South Africa, etc., particularly in October and November 2011.
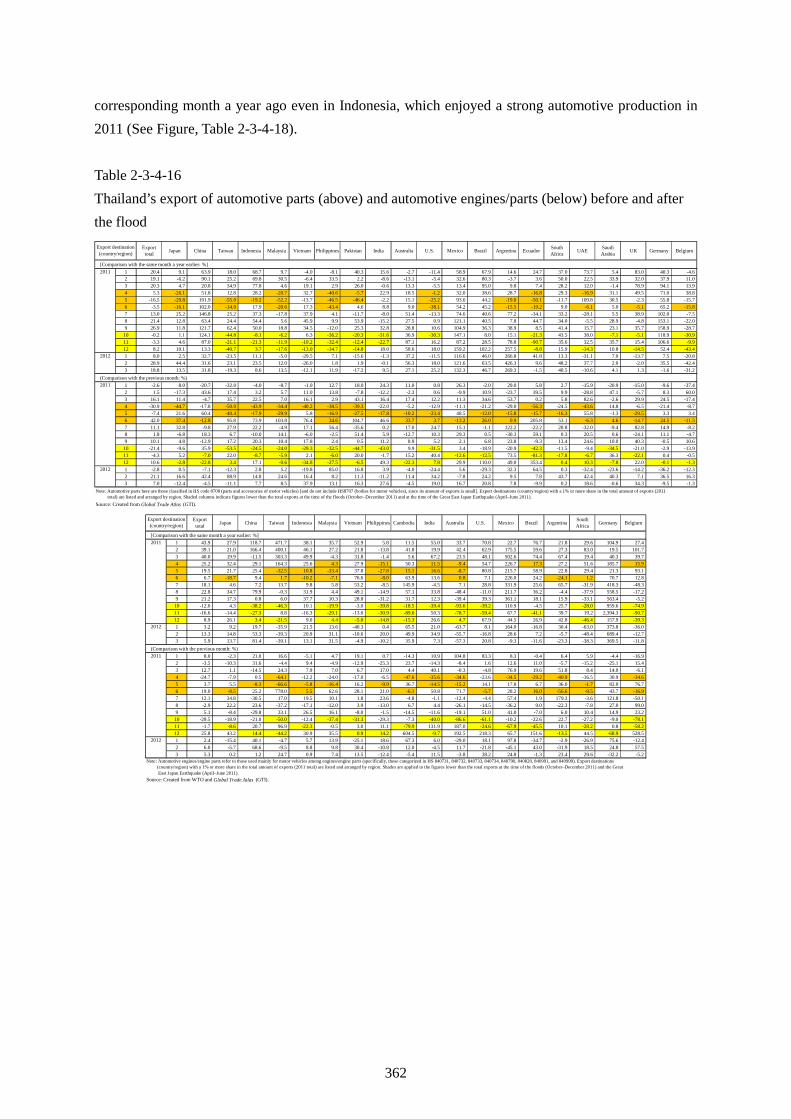
362
corresponding month a year ago even in Indonesia, which enjoyed a strong automotive production in 2011 (See Figure, Table 2-3-4-18). Table 2-3-4-16 Thailand’s export of automotive parts (above) and automotive engines/parts (below) before and after the flood
Exporttotal Japan China Taiwan Indonesia Malaysia Vietnam Philippines Cambodia India Australia U.S. Mexico Brazil Argentina South
Africa Germany Belgium
1 43.9 27.9 118.7 471.7 38.1 35.7 52.9 5.8 11.5 55.0 33.7 70.8 22.7 76.7 21.8 29.6 104.9 27.42 39.1 21.0 166.4 400.1 46.1 27.2 21.8 -13.8 41.8 19.9 42.4 62.9 175.5 59.6 27.3 83.0 19.5 101.73 40.0 19.9 -11.5 303.3 49.9 -4.3 31.8 -1.4 5.6 67.2 23.5 48.1 502.6 74.4 67.4 19.4 40.3 39.74 25.2 32.4 29.1 164.3 25.6 4.3 27.9 -15.1 50.3 11.5 -9.4 54.7 226.7 17.3 27.2 51.6 185.7 15.95 19.5 21.7 25.4 -32.5 10.8 -33.4 37.8 -27.8 15.1 16.6 -8.7 80.8 215.7 58.9 22.8 29.4 21.3 93.16 6.7 -18.7 9.4 1.7 -10.2 -7.1 76.6 -8.0 63.9 13.6 0.8 7.1 226.0 24.2 -24.1 1.2 70.7 12.87 18.1 4.6 7.2 13.7 9.8 5.8 53.2 -8.5 145.9 -4.5 7.1 28.8 331.9 25.6 65.7 -31.9 418.3 -48.38 22.8 34.7 79.9 -0.3 31.9 4.4 49.1 -14.9 57.1 33.8 -48.4 -11.0 211.7 36.2 -4.4 -37.9 558.5 -17.29 21.2 17.3 0.8 6.0 37.7 10.3 28.8 -31.2 31.7 12.3 -39.4 39.3 361.1 18.1 15.9 -33.1 563.4 -5.2
10 -12.0 4.3 -38.2 -46.3 10.1 -19.9 -3.0 -39.8 -18.5 -39.4 -93.6 -39.2 110.9 -4.5 25.7 -28.0 959.6 -74.911 -16.6 -14.4 -27.3 8.8 -16.3 -29.1 -13.0 -30.9 -89.0 50.3 -78.7 -59.4 67.7 -41.1 39.7 19.2 2,394.3 -90.712 8.9 26.1 3.4 -21.5 9.0 4.4 -5.0 -14.8 -15.3 26.6 4.7 67.9 44.5 26.9 42.8 -46.4 157.9 -39.31 3.2 9.2 19.7 -35.9 21.5 13.6 -40.3 0.4 65.5 21.0 -63.7 8.1 164.0 -16.8 30.4 -63.0 373.8 -36.02 13.3 14.8 53.3 -39.3 20.9 31.1 -10.6 20.0 49.9 34.9 -55.7 -16.8 28.6 7.2 -5.7 -48.4 689.4 -12.73 5.9 13.7 81.4 -39.1 13.1 31.5 -4.9 -10.2 35.9 7.3 -57.3 20.8 -9.3 -11.6 -23.3 -38.3 369.5 -11.8
1 8.0 -2.3 21.0 16.6 -5.1 4.7 19.1 0.7 -14.3 10.9 104.8 83.3 8.3 -0.4 6.4 5.9 -4.4 -16.92 -3.5 -10.3 31.6 -4.4 9.4 -4.9 -12.9 -25.3 23.7 -14.3 -8.4 1.6 12.6 11.0 -5.7 -15.2 -25.1 15.43 12.7 1.1 -14.5 24.3 7.9 7.0 6.7 17.0 4.4 40.1 -0.3 -4.8 76.9 19.6 51.8 8.4 14.0 -6.14 -24.7 -7.9 0.5 -64.1 -12.2 -24.0 -17.0 -6.5 -47.6 -35.6 -34.6 -23.6 -34.5 -29.2 -40.9 -16.5 30.9 -34.65 3.7 5.5 -8.3 -66.6 -5.8 -16.4 16.2 -9.9 36.7 -14.5 -15.2 14.1 17.8 6.7 36.0 -1.7 82.0 76.76 19.0 -8.5 25.2 778.0 5.5 62.6 28.1 21.0 -6.1 50.8 71.7 -5.7 28.2 16.0 -56.6 -9.5 43.7 -16.97 12.1 34.8 -30.5 17.0 19.5 10.1 1.8 23.6 -4.8 -1.1 -12.4 -4.4 57.4 1.9 179.3 -3.6 121.8 -50.18 -2.9 22.2 23.6 -37.2 -17.1 -12.0 3.9 -13.0 6.7 4.4 -26.1 -14.5 -36.2 9.0 -22.3 -7.8 27.0 99.09 5.1 -8.4 -29.8 33.1 26.5 16.1 -8.0 -1.5 -14.5 -11.6 -19.1 51.0 41.0 -7.0 6.0 10.4 14.9 23.2
10 -29.5 -18.9 -21.0 -50.0 -12.4 -37.4 -31.3 -29.3 -7.3 -40.0 -86.6 -61.1 -10.2 -22.6 22.7 -27.2 -9.0 -78.111 -1.7 -8.6 20.7 96.9 -22.3 -0.5 3.0 11.1 -79.9 131.9 187.0 -24.6 -67.9 -45.5 10.1 -28.2 0.8 -58.212 25.8 43.2 14.4 -44.2 30.9 35.5 0.9 14.2 604.5 -9.7 192.5 218.3 65.7 151.6 -13.5 44.5 -68.9 528.51 2.4 -15.4 40.1 -4.7 5.7 13.9 -25.1 18.6 67.3 6.0 -29.0 18.1 97.8 -34.7 -2.9 -26.9 75.6 -12.42 6.0 -5.7 68.6 -9.5 8.8 9.8 30.4 -10.8 12.0 -4.5 11.7 -21.8 -45.1 43.0 -31.9 18.5 24.8 57.53 5.3 0.2 1.2 24.7 0.9 7.4 13.5 -12.4 -5.4 11.5 -3.8 38.2 24.8 -1.3 23.4 29.6 -32.2 -5.2
2012
(Comparison with the previous month: %)
Export destination(country/region)
[Comparison with the same month a year earlier: %]2011
2011
2012
Note: Automotive engines/engine parts refer to those used mainly for motor vehicles among engines/engine parts (specifically, those categorized in HS 840731, 840732, 840733, 840734, 840790, 840820, 840991, and 840999). Export destinations (country/region) with a 1% or more share in the total amount of exports (2011 total) are listed and arranged by region. Shades are applied to the figures lower than the total exports at the time of the floods (October–December 2011) and the Great East Japan Earthquake (April–June 2011).Source: Created from WTO and Global Trade Atlas (GTI).
Exporttotal Japan China Taiwan Indonesia Malaysia Vietnam Philippines Pakistan India Australia U.S. Mexico Brazil Argentina Ecuador South
Africa UAE SaudiArabia UK Germany Belgium
1 20.4 9.1 63.9 18.0 68.7 9.7 -4.0 -8.1 40.3 15.6 -2.7 -11.4 58.9 67.9 14.6 24.7 37.0 73.7 5.4 83.0 40.3 -4.62 19.1 -6.2 90.1 25.2 69.8 30.5 -6.4 33.5 2.2 -8.6 -13.1 -5.4 32.6 80.3 -3.7 3.6 50.0 22.5 33.9 32.0 37.9 11.03 20.3 4.7 20.8 34.9 77.8 4.6 19.1 2.9 26.0 -0.6 13.3 -5.5 13.4 95.0 9.8 7.4 28.2 12.0 -1.4 78.9 94.1 13.94 5.3 -26.1 51.8 12.8 28.2 -20.7 32.7 -40.6 -5.7 22.9 18.5 -1.2 32.0 38.6 28.7 -16.8 29.3 -16.9 31.1 49.5 71.0 38.85 -16.5 -29.8 191.9 -55.0 -19.2 -52.2 -13.7 -46.5 -46.4 -2.2 15.1 -25.2 93.6 44.2 -19.0 -50.1 -11.7 109.8 30.5 -2.3 55.8 -15.76 -3.5 -16.1 102.0 -14.0 17.9 -20.6 17.3 -43.4 4.6 8.8 9.0 -38.1 54.2 45.2 -15.5 -19.2 9.0 -6.1 5.0 -5.1 65.2 -15.87 13.0 25.2 146.8 25.2 37.3 -17.8 37.9 4.1 -11.7 -8.0 51.4 -13.3 74.6 40.6 77.2 -34.1 33.2 -28.1 5.5 38.9 102.0 -7.58 21.4 12.8 63.4 24.4 54.4 5.6 45.9 9.9 53.9 -15.2 27.5 0.9 121.1 40.5 7.8 44.7 34.0 -5.5 28.9 -4.8 153.1 -22.09 26.9 11.8 121.7 62.4 50.0 18.8 34.5 -12.0 25.3 32.8 28.8 10.6 104.9 36.3 38.9 8.5 41.4 15.7 23.1 35.7 158.9 -28.710 -0.2 1.1 124.1 -44.8 -8.1 -6.2 6.3 -36.2 -20.3 -31.6 36.9 -30.3 147.1 8.0 15.1 -21.3 43.5 38.0 -7.1 -5.1 118.9 -30.911 -3.3 4.6 87.0 -21.1 -21.3 -11.9 -10.2 -32.4 -12.4 -22.7 87.1 16.2 87.2 28.5 78.8 -90.7 35.6 32.5 35.7 15.4 106.6 -9.912 8.2 10.1 13.3 -40.7 3.7 -17.6 -13.0 -34.7 -14.8 18.0 58.6 18.0 159.2 102.2 257.5 -8.8 15.9 -14.3 10.8 -14.5 52.4 -43.41 8.0 2.5 32.7 -23.5 11.1 -5.0 -29.5 7.1 -15.6 -1.3 37.2 -11.5 116.6 46.0 266.8 41.8 13.3 -31.1 7.0 -13.7 7.5 -20.82 28.9 44.4 31.6 23.1 23.5 12.0 -26.0 1.8 1.9 -0.1 56.3 18.0 121.6 63.5 426.3 9.6 48.2 37.7 2.0 -2.0 35.5 -42.43 18.8 13.5 31.8 -19.3 8.6 13.5 -12.1 11.9 -17.2 9.5 27.1 25.2 132.3 46.7 269.3 -1.5 40.5 -10.6 4.1 1.3 -1.6 -31.2
1 -2.6 8.0 -20.7 -32.0 -4.0 -8.7 -1.0 12.7 18.0 24.3 11.0 0.8 26.3 -2.0 29.0 5.8 2.7 -15.9 -20.9 -15.0 -9.6 -37.42 1.5 -17.3 43.6 17.4 3.2 5.7 11.0 13.8 -7.8 -12.2 -2.3 0.6 -9.9 10.9 -23.7 39.5 9.9 -28.8 47.1 -5.7 8.3 60.03 16.1 11.4 -4.7 35.7 22.5 7.0 16.1 2.9 43.1 16.4 17.4 12.2 11.3 34.6 53.7 0.2 5.8 82.6 -2.6 29.9 24.5 -17.44 -30.9 -44.7 -17.8 -50.0 -43.9 -34.4 -40.2 -38.5 -39.3 -22.0 -5.2 -12.9 -11.1 -21.2 -29.0 -56.3 -24.5 -43.6 14.8 -6.5 -21.4 -8.75 -7.4 21.6 60.4 -40.4 -17.9 -29.9 5.8 -16.9 -27.5 -17.8 -10.2 -23.4 48.5 -12.0 -15.8 -15.7 -16.3 55.8 -1.3 -29.5 3.3 3.46 42.0 37.4 -12.8 95.8 73.9 103.8 76.4 34.6 104.7 46.6 33.7 3.7 -13.2 26.0 0.9 205.8 53.1 -6.3 4.6 -14.7 24.5 -11.57 11.1 32.8 -9.8 27.9 22.2 -4.9 17.1 56.4 -35.6 0.2 17.0 24.7 15.1 -1.1 122.2 -22.2 20.8 -32.0 -9.4 82.8 14.9 -8.28 1.8 -6.8 18.3 6.7 -10.0 14.1 -6.0 -2.5 51.4 5.9 -12.7 10.3 29.3 0.5 -30.3 59.1 0.3 20.5 0.6 -24.1 11.1 -4.79 10.1 4.8 -12.9 17.2 20.3 10.4 17.8 2.4 0.5 11.2 8.9 5.2 2.1 6.8 23.8 -9.3 13.4 24.6 10.0 40.3 -0.5 10.610 -21.4 -9.6 35.9 -53.5 -24.5 -24.0 -29.3 -32.5 -44.7 -43.0 9.9 -31.5 3.4 -18.9 -20.9 -42.3 -11.5 -9.4 -34.5 -21.0 -2.9 -13.911 -4.3 5.2 -7.0 22.0 -8.7 -5.9 2.1 -6.0 20.0 -1.7 15.2 40.4 -12.6 -12.5 73.5 -81.3 -17.8 -6.7 36.3 -22.1 0.4 -0.512 10.6 -2.8 -22.8 3.4 17.1 -0.6 -34.8 -27.5 -6.5 49.3 -22.3 7.8 29.9 110.0 49.0 353.4 0.4 10.3 -7.8 22.0 -0.1 -1.31 -2.8 0.5 -7.1 -12.3 2.8 5.2 -19.8 85.0 16.8 3.9 -4.0 -24.4 5.6 -29.3 32.3 64.5 0.3 -32.4 -23.6 -14.2 -36.2 -12.32 21.1 16.6 42.4 88.9 14.8 24.6 16.4 8.2 11.3 -11.2 11.4 34.2 -7.8 24.2 9.5 7.8 43.7 42.4 40.3 7.1 36.5 16.33 7.0 -12.4 -4.5 -11.1 7.7 8.5 37.9 13.1 16.3 27.6 -4.5 19.0 16.7 20.8 7.8 -9.9 0.2 18.6 -0.6 34.3 -9.5 -1.3
2012
(Comparison with the previous month: %)
Export destination(country/region)
[Comparison with the same month a year earlier: %]2011
2011
2012
Note: Automotive parts here are those classified in HS code 8708 (parts and accessories of motor vehicles) [and do not include HS8707 (bodies for motor vehicles), since its amount of exports is small]. Export destinations (country/region) with a 1% or more share in the total amount of exports (2011 total) are listed and arranged by region. Shaded columns indicate figures lower than the total exports at the time of the floods (October–December 2011) and at the time of the Great East Japan Earthquake (April–June 2011).Source: Created from Global Trade Atlas (GTI).
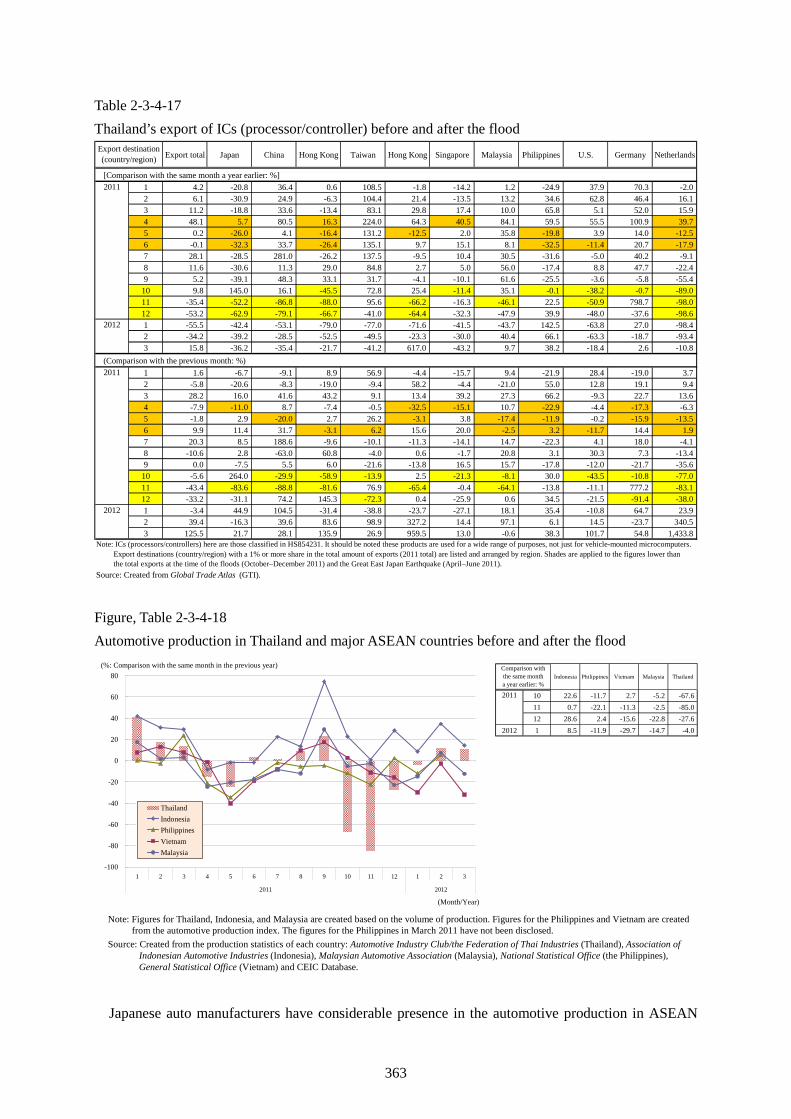
363
Table 2-3-4-17 Thailand’s export of ICs (processor/controller) before and after the flood
Export total Japan China Hong Kong Taiwan Hong Kong Singapore Malaysia Philippines U.S. Germany Netherlands
2011 1 4.2 -20.8 36.4 0.6 108.5 -1.8 -14.2 1.2 -24.9 37.9 70.3 -2.02 6.1 -30.9 24.9 -6.3 104.4 21.4 -13.5 13.2 34.6 62.8 46.4 16.13 11.2 -18.8 33.6 -13.4 83.1 29.8 17.4 10.0 65.8 5.1 52.0 15.94 48.1 5.7 80.5 16.3 224.0 64.3 40.5 84.1 59.5 55.5 100.9 39.75 0.2 -26.0 4.1 -16.4 131.2 -12.5 2.0 35.8 -19.8 3.9 14.0 -12.56 -0.1 -32.3 33.7 -26.4 135.1 9.7 15.1 8.1 -32.5 -11.4 20.7 -17.97 28.1 -28.5 281.0 -26.2 137.5 -9.5 10.4 30.5 -31.6 -5.0 40.2 -9.18 11.6 -30.6 11.3 29.0 84.8 2.7 5.0 56.0 -17.4 8.8 47.7 -22.49 5.2 -39.1 48.3 33.1 31.7 -4.1 -10.1 61.6 -25.5 -3.6 -5.8 -55.4
10 9.8 145.0 16.1 -45.5 72.8 25.4 -11.4 35.1 -0.1 -38.2 -0.7 -89.011 -35.4 -52.2 -86.8 -88.0 95.6 -66.2 -16.3 -46.1 22.5 -50.9 798.7 -98.012 -53.2 -62.9 -79.1 -66.7 -41.0 -64.4 -32.3 -47.9 39.9 -48.0 -37.6 -98.6
2012 1 -55.5 -42.4 -53.1 -79.0 -77.0 -71.6 -41.5 -43.7 142.5 -63.8 27.0 -98.42 -34.2 -39.2 -28.5 -52.5 -49.5 -23.3 -30.0 40.4 66.1 -63.3 -18.7 -93.43 15.8 -36.2 -35.4 -21.7 -41.2 617.0 -43.2 9.7 38.2 -18.4 2.6 -10.8
2011 1 1.6 -6.7 -9.1 8.9 56.9 -4.4 -15.7 9.4 -21.9 28.4 -19.0 3.72 -5.8 -20.6 -8.3 -19.0 -9.4 58.2 -4.4 -21.0 55.0 12.8 19.1 9.43 28.2 16.0 41.6 43.2 9.1 13.4 39.2 27.3 66.2 -9.3 22.7 13.64 -7.9 -11.0 8.7 -7.4 -0.5 -32.5 -15.1 10.7 -22.9 -4.4 -17.3 -6.35 -1.8 2.9 -20.0 2.7 26.2 -3.1 3.8 -17.4 -11.9 -0.2 -15.9 -13.56 9.9 11.4 31.7 -3.1 6.2 15.6 20.0 -2.5 3.2 -11.7 14.4 1.97 20.3 8.5 188.6 -9.6 -10.1 -11.3 -14.1 14.7 -22.3 4.1 18.0 -4.18 -10.6 2.8 -63.0 60.8 -4.0 0.6 -1.7 20.8 3.1 30.3 7.3 -13.49 0.0 -7.5 5.5 6.0 -21.6 -13.8 16.5 15.7 -17.8 -12.0 -21.7 -35.6
10 -5.6 264.0 -29.9 -58.9 -13.9 2.5 -21.3 -8.1 30.0 -43.5 -10.8 -77.011 -43.4 -83.6 -88.8 -81.6 76.9 -65.4 -0.4 -64.1 -13.8 -11.1 777.2 -83.112 -33.2 -31.1 74.2 145.3 -72.3 0.4 -25.9 0.6 34.5 -21.5 -91.4 -38.0
2012 1 -3.4 44.9 104.5 -31.4 -38.8 -23.7 -27.1 18.1 35.4 -10.8 64.7 23.92 39.4 -16.3 39.6 83.6 98.9 327.2 14.4 97.1 6.1 14.5 -23.7 340.53 125.5 21.7 28.1 135.9 26.9 959.5 13.0 -0.6 38.3 101.7 54.8 1,433.8
Source: Created from Global Trade Atlas (GTI).
Export destination(country/region)
[Comparison with the same month a year earlier: %]
(Comparison with the previous month: %)
Note: ICs (processors/controllers) here are those classified in HS854231. It should be noted these products are used for a wide range of purposes, not just for vehicle-mounted microcomputers. Export destinations (country/region) with a 1% or more share in the total amount of exports (2011 total) are listed and arranged by region. Shades are applied to the figures lower than the total exports at the time of the floods (October–December 2011) and the Great East Japan Earthquake (April–June 2011).
Figure, Table 2-3-4-18 Automotive production in Thailand and major ASEAN countries before and after the flood
Indonesia Philippines Vietnam Malaysia Thailand
10 22.6 -11.7 2.7 -5.2 -67.611 0.7 -22.1 -11.3 -2.5 -85.012 28.6 2.4 -15.6 -22.8 -27.6
2012 1 8.5 -11.9 -29.7 -14.7 -4.0
Comparison withthe same montha year earlier: %
2011
-100
-80
-60
-40
-20
0
20
40
60
80
1 2 3 4 5 6 7 8 9 10 11 12 1 2 3
2011 2012
ThailandIndonesiaPhilippinesVietnamMalaysia
(%: Comparison with the same month in the previous year)
(Month/Year)
Note: Figures for Thailand, Indonesia, and Malaysia are created based on the volume of production. Figures for the Philippines and Vietnam are created from the automotive production index. The figures for the Philippines in March 2011 have not been disclosed.
Source: Created from the production statistics of each country: Automotive Industry Club/the Federation of Thai Industries (Thailand), Association of Indonesian Automotive Industries (Indonesia), Malaysian Automotive Association (Malaysia), National Statistical Office (the Philippines), General Statistical Office (Vietnam) and CEIC Database.
Japanese auto manufacturers have considerable presence in the automotive production in ASEAN
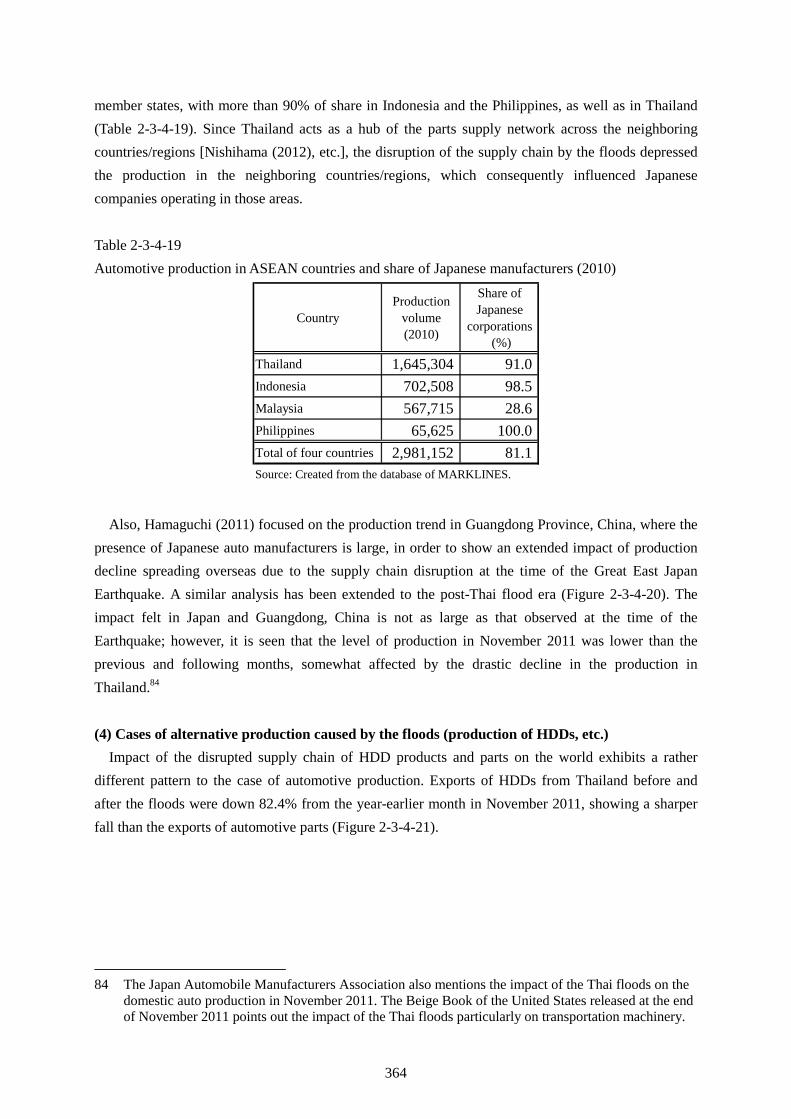
364
member states, with more than 90% of share in Indonesia and the Philippines, as well as in Thailand (Table 2-3-4-19). Since Thailand acts as a hub of the parts supply network across the neighboring countries/regions [Nishihama (2012), etc.], the disruption of the supply chain by the floods depressed the production in the neighboring countries/regions, which consequently influenced Japanese companies operating in those areas. Table 2-3-4-19 Automotive production in ASEAN countries and share of Japanese manufacturers (2010)
CountryProduction
volume(2010)
Share ofJapanese
corporations (%)
Thailand 1,645,304 91.0Indonesia 702,508 98.5Malaysia 567,715 28.6Philippines 65,625 100.0Total of four countries 2,981,152 81.1Source: Created from the database of MARKLINES.
Also, Hamaguchi (2011) focused on the production trend in Guangdong Province, China, where the presence of Japanese auto manufacturers is large, in order to show an extended impact of production decline spreading overseas due to the supply chain disruption at the time of the Great East Japan Earthquake. A similar analysis has been extended to the post-Thai flood era (Figure 2-3-4-20). The impact felt in Japan and Guangdong, China is not as large as that observed at the time of the Earthquake; however, it is seen that the level of production in November 2011 was lower than the previous and following months, somewhat affected by the drastic decline in the production in Thailand.84
(4) Cases of alternative production caused by the floods (production of HDDs, etc.) Impact of the disrupted supply chain of HDD products and parts on the world exhibits a rather
different pattern to the case of automotive production. Exports of HDDs from Thailand before and after the floods were down 82.4% from the year-earlier month in November 2011, showing a sharper fall than the exports of automotive parts (Figure 2-3-4-21).
84 The Japan Automobile Manufacturers Association also mentions the impact of the Thai floods on the domestic auto production in November 2011. The Beige Book of the United States released at the end of November 2011 points out the impact of the Thai floods particularly on transportation machinery.
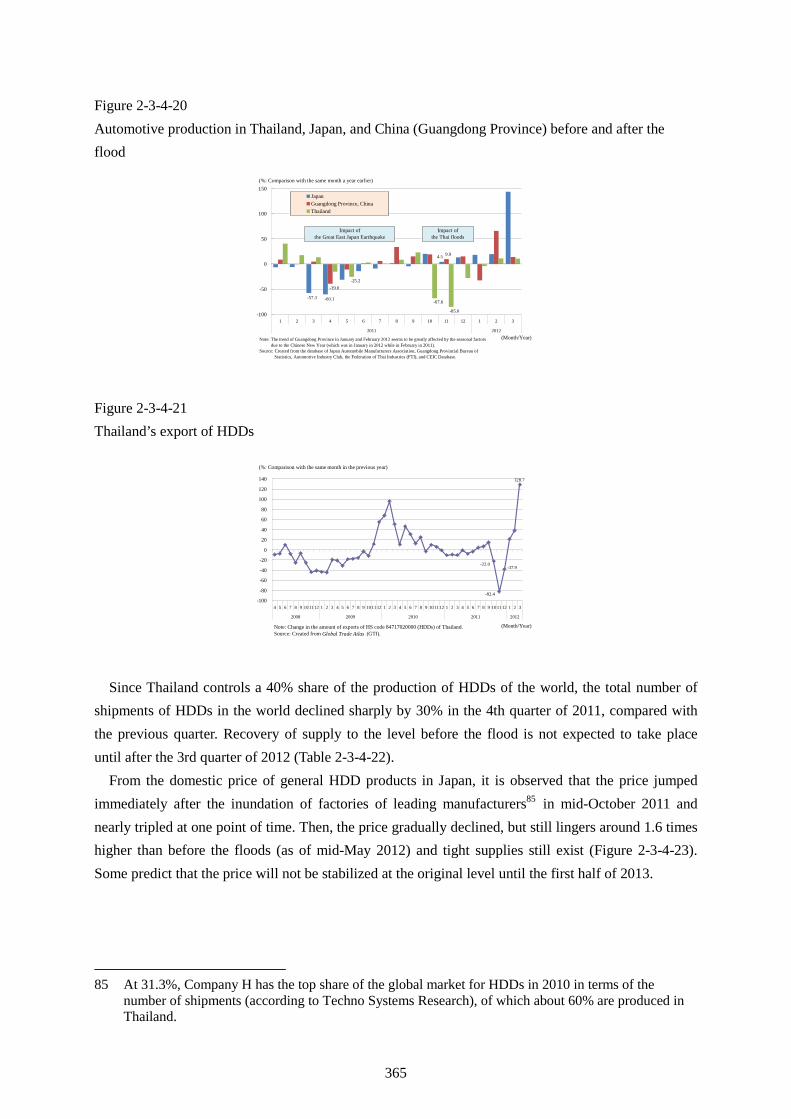
365
Figure 2-3-4-20 Automotive production in Thailand, Japan, and China (Guangdong Province) before and after the flood
-57.3 -60.1
4.5
-39.0
9.9
-25.2
-67.6
-85.0-100
-50
0
50
100
150
1 2 3 4 5 6 7 8 9 10 11 12 1 2 3
2011 2012
JapanGuangdong Province, ChinaThailand
Impact ofthe Great East Japan Earthquake
Impact ofthe Thai floods
Note: The trend of Guangdong Province in January and February 2012 seems to be greatly affected by the seasonal factors due to the Chinese New Year (which was in January in 2012 while in February in 2011).Source: Created from the database of Japan Automobile Manufacturers Association, Guangdong Provincial Bureau of Statistics, Automotive Industry Club, the Federation of Thai Industries (FTI), and CEIC Database.
(%: Comparison with the same month a year earlier)
(Month/Year)
Figure 2-3-4-21 Thailand’s export of HDDs
-22.0
-82.4
-37.9
128.7
-100
-80
-60
-40
-20
0
20
40
60
80
100
120
140
4 5 6 7 8 9 101112 1 2 3 4 5 6 7 8 9 101112 1 2 3 4 5 6 7 8 9 101112 1 2 3 4 5 6 7 8 9 1011 12 1 2 3
2008 2009 2010 2011 2012
Note: Change in the amount of exports of HS code 84717020000 (HDDs) of Thailand.Source: Created from Global Trade Atlas (GTI).
(%: Comparison with the same month in the previous year)
(Month/Year)
Since Thailand controls a 40% share of the production of HDDs of the world, the total number of shipments of HDDs in the world declined sharply by 30% in the 4th quarter of 2011, compared with the previous quarter. Recovery of supply to the level before the flood is not expected to take place until after the 3rd quarter of 2012 (Table 2-3-4-22).
From the domestic price of general HDD products in Japan, it is observed that the price jumped immediately after the inundation of factories of leading manufacturers85 in mid-October 2011 and nearly tripled at one point of time. Then, the price gradually declined, but still lingers around 1.6 times higher than before the floods (as of mid-May 2012) and tight supplies still exist (Figure 2-3-4-23). Some predict that the price will not be stabilized at the original level until the first half of 2013.
85 At 31.3%, Company H has the top share of the global market for HDDs in 2010 in terms of the number of shipments (according to Techno Systems Research), of which about 60% are produced in Thailand.
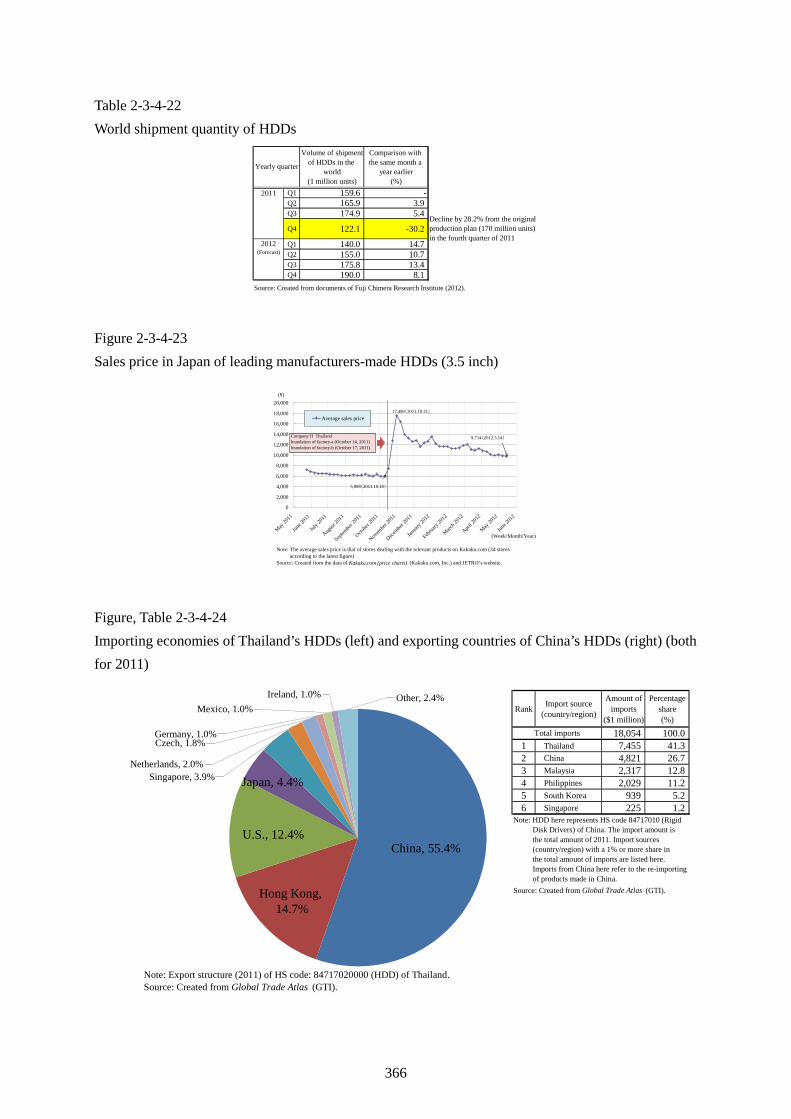
366
Table 2-3-4-22 World shipment quantity of HDDs
Volume of shipment of HDDs in the
world(1 million units)
Comparison with the same month a
year earlier(%)
Q1 159.6 -Q2 165.9 3.9Q3 174.9 5.4
Q4 122.1 -30.2
Q1 140.0 14.7Q2 155.0 10.7Q3 175.8 13.4Q4 190.0 8.1
Decline by 28.2% from the original production plan (170 million units) in the fourth quarter of 2011
Source: Created from documents of Fuji Chimera Research Institute (2012).
Yearly quarter
2011
2012(Forecast)
Figure 2-3-4-23 Sales price in Japan of leading manufacturers-made HDDs (3.5 inch)
5,908(2011.10.10)
17,490(2011.10.31)
9,714(2012.5.14)
0
2,000
4,000
6,000
8,000
10,000
12,000
14,000
16,000
18,000
20,000
May20
11
June 20
11
July 20
11
August
2011
Septem
ber 20
11
Octobe
r 2011
Novem
ber 20
11
December
2011
Janua
ry20
12
Februa
ry20
12
March 20
12
April 20
12
May20
12
June 20
12
Average sales price
(¥)
(Week/Month/Year)
Note: The average sales price is that of stores dealing with the relevant products on Kakaku.com (34 stores according to the latest figure)Source: Created from the data of Kakaku.com (price charts) (Kakaku.com, Inc.) and JETRO’s website.
Company H ThailandInundation of factory-a (October 14, 2011)Inundation of factory-b (October 17, 2011)
Figure, Table 2-3-4-24 Importing economies of Thailand’s HDDs (left) and exporting countries of China’s HDDs (right) (both for 2011)
China, 55.4%
Hong Kong, 14.7%
U.S., 12.4%
Japan, 4.4%Singapore, 3.9%Netherlands, 2.0%
Czech, 1.8%Germany, 1.0%
Mexico, 1.0%Ireland, 1.0% Other, 2.4%
Note: Export structure (2011) of HS code: 84717020000 (HDD) of Thailand.Source: Created from Global Trade Atlas (GTI).
Rank Import source(country/region)
Amount ofimports
($1 million)
Percentageshare(%)
18,054 100.01 Thailand 7,455 41.32 China 4,821 26.73 Malaysia 2,317 12.84 Philippines 2,029 11.25 South Korea 939 5.26 Singapore 225 1.2
Source: Created from Global Trade Atlas (GTI).
Total imports
Note: HDD here represents HS code 84717010 (Rigid Disk Drivers) of China. The import amount is the total amount of 2011. Import sources (country/region) with a 1% or more share in the total amount of imports are listed here. Imports from China here refer to the re-importing of products made in China.
367
As described above, the production disruption of HDDs in Thailand had a considerable impact on the global market, including Japan, which can be clearly observed by end consumers in the form of hike in the product price. And the impact is still felt today. Looking at the trade structure of HDDs of Thailand, Thailand exports about 70% of its HDD products to China, including Hong Kong, and China imports about 40% of its HDDs from Thailand, indicating a strong tie between the two countries (Figure, Table 2-3-4-24).
Now, the impact on global supply chains is examined focusing on HDDs, from the import trend of HDDs of China before and after the floods. China’s imports of HDDs fell by 21.0% in October 2011 from the previous month but the overall imports remained positive with an increase of 6.8% compared to the same month a year earlier. In the following month of November, imports of China from Thailand continued to fall sharply, while the imports from other countries/regions such as South Korea, the Philippines, and Malaysia, increased drastically, in addition to an increase in reimport of Chinese products; thus, the decline of imports almost reached the bottom (November 2011: −1.2% compared to the previous month and +9.4% compared to the same month of the previous year). Imports from countries/regions other than Thailand continued increasing; the latest overall figures of imports exceed the level before the floods, with the continued increase in the imports from countries/regions other than Thailand, in addition to the recovery of imports from Thailand (Figure, Table 2-3-4-25).
This result corresponds to the case where major manufacturers of HDDs and components that suffered flood inundation resorted to alternative production by running full operations at the production bases of their companies in countries other than Thailand. The HDD-related products exhibit a different characteristic from the automotive production, in the aspect that the alternative production was actively carried out in many areas.
Furthermore, the export trend of personal computers from China before and after the floods is also examined. Although the export trend of the last half of 2011 is difficult to assess since it is affected by various factors in addition to the impact of supply shortage of HDDs due to Thai floods, such as the continuation of adjustment aspect in the production cycle, the global economy, such as the European debt crisis situation, and competition with tablet devices, etc., it registered −1.3% in December 2011 compared to the same month a year ago (Figure 2-3-4-26). It is also assumed that the floods had a certain impact on the production of personal computers in the world through global supply chains from the following facts: (1) one of the major Chinese manufacturers attributed to its lower profit in the 2011 October–December period to the floods in Thailand and (2) IHS iSuppli (2011) lowered the projected shipments of personal computers of the world in the 2011 January–March period by 3.8 million units (to 84.2 million units, reduction of about 4.3%) from the original forecast (August 2011) due to the shortage of HDDs.
Lastly, it should be noted that Japan carried out alternative production in a wide range of fields and a number of Thai employees of inundated Japanese factories were temporarily dispatched to Japan with a view to maintaining supply chains and early reconstruction in the post-flood period.
According to the questionnaire survey (2012) conducted by the Japan Bank for International Cooperation (JBIC), among respondents (165 companies) having production bases in Thailand, about 60% (99 companies) were forced to cut production due to floods, of which about 70% (70 companies)
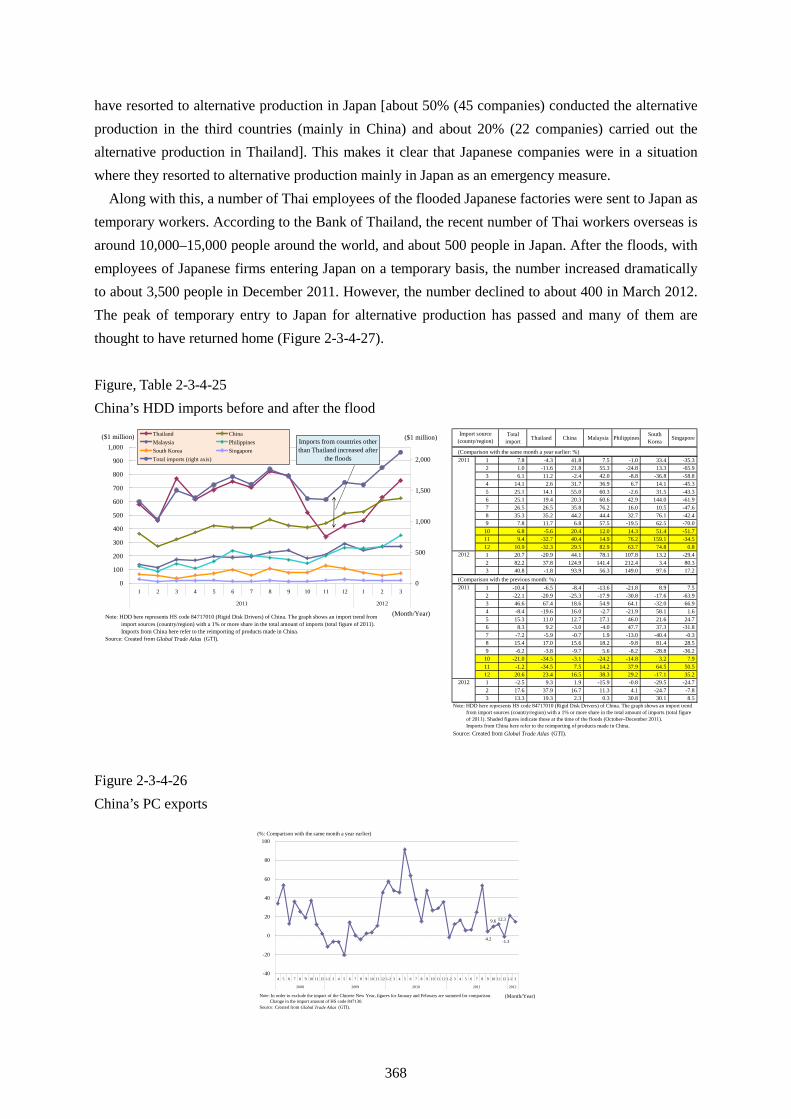
368
have resorted to alternative production in Japan [about 50% (45 companies) conducted the alternative production in the third countries (mainly in China) and about 20% (22 companies) carried out the alternative production in Thailand]. This makes it clear that Japanese companies were in a situation where they resorted to alternative production mainly in Japan as an emergency measure.
Along with this, a number of Thai employees of the flooded Japanese factories were sent to Japan as temporary workers. According to the Bank of Thailand, the recent number of Thai workers overseas is around 10,000–15,000 people around the world, and about 500 people in Japan. After the floods, with employees of Japanese firms entering Japan on a temporary basis, the number increased dramatically to about 3,500 people in December 2011. However, the number declined to about 400 in March 2012. The peak of temporary entry to Japan for alternative production has passed and many of them are thought to have returned home (Figure 2-3-4-27). Figure, Table 2-3-4-25 China’s HDD imports before and after the flood
0
100
200
300
400
500
600
700
800
900
1,000
1 2 3 4 5 6 7 8 9 10 11 12 1 2 3
2011 2012
0
500
1,000
1,500
2,000
Thailand ChinaMalaysia PhilippinesSouth Korea SingaporeTotal imports (right axis)
Note: HDD here represents HS code 84717010 (Rigid Disk Drivers) of China. The graph shows an import trend fromimport sources (country/region) with a 1% or more share in the total amount of imports (total figure of 2011).
Imports from China here refer to the reimporting of products made in China.Source: Created from Global Trade Atlas (GTI).
($1 million) ($1 million)Imports from countries otherthan Thailand increased after
the floods
(Month/Year)
Totalimport Thailand China Malaysia Philippines South
Korea Singapore
1 7.8 -4.3 41.8 7.5 -1.0 33.4 -35.32 1.0 -11.6 21.8 55.3 -24.8 13.3 -65.93 6.1 11.2 -2.4 42.0 -8.8 -36.8 -58.84 14.1 2.6 31.7 36.9 6.7 14.1 -45.35 25.1 14.1 55.0 60.3 -2.6 31.5 -43.36 25.1 19.4 20.3 60.6 42.9 144.0 -61.97 26.5 26.5 35.8 76.2 16.0 10.5 -47.68 35.3 35.2 44.2 44.4 32.7 76.1 -42.49 7.8 11.7 6.8 57.5 -19.5 62.5 -70.010 6.8 -5.6 20.4 12.0 14.3 51.4 -51.711 9.4 -32.7 40.4 14.9 76.2 159.1 -34.512 10.9 -32.3 29.5 82.9 63.7 74.8 0.81 20.7 -20.9 44.1 78.1 107.8 13.2 -29.42 82.2 37.8 124.9 141.4 212.4 3.4 80.33 40.8 -1.8 93.9 56.3 149.0 97.6 17.2
1 -10.4 -6.5 -8.4 -13.6 -21.8 8.9 7.52 -22.1 -20.9 -25.3 -17.9 -30.8 -17.6 -63.93 46.6 67.4 18.6 54.9 64.1 -32.0 66.94 -8.4 -19.6 16.0 -2.7 -21.9 58.1 1.65 15.3 11.0 12.7 17.1 46.0 21.6 24.76 8.3 9.2 -3.0 -4.0 47.7 37.3 -31.87 -7.2 -5.9 -0.7 1.9 -13.0 -40.4 -0.38 15.4 17.0 15.6 18.2 -9.8 81.4 28.59 -6.2 -3.8 -9.7 5.6 -8.2 -28.8 -36.210 -21.0 -34.5 -3.1 -24.2 -14.8 3.2 7.911 -1.2 -34.5 7.5 14.2 37.9 64.5 50.512 20.6 23.4 16.5 38.3 29.2 -17.1 35.21 -2.5 9.3 1.9 -15.9 -0.8 -29.5 -24.72 17.6 37.9 16.7 11.3 4.1 -24.7 -7.83 13.3 19.3 2.3 0.3 30.8 30.1 8.5
2011
2012
Note: HDD here represents HS code 84717010 (Rigid Disk Drivers) of China. The graph shows an import trend from import sources (country/region) with a 1% or more share in the total amount of imports (total figure of 2011). Shaded figures indicate those at the time of the floods (October–December 2011). Imports from China here refer to the reimporting of products made in China.Source: Created from Global Trade Atlas (GTI).
2012
(Comparison with the previous month: %)
Import source(county/region)
(Comparison with the same month a year earlier: %)2011
Figure 2-3-4-26 China’s PC exports
4.2
9.6 12.3
-1.3
-40
-20
0
20
40
60
80
100
4 5 6 7 8 9 10 11 12 1-2 3 4 5 6 7 8 9 10 11 12 1-2 3 4 5 6 7 8 9 10 11 12 1-2 3 4 5 6 7 8 9 10 11 12 1-2 3
2008 2009 2010 2011 2012
Note: In order to exclude the impact of the Chinese New Year, figures for January and February are summed for comparison. Change in the import amount of HS code 847130.Source: Created from Global Trade Atlas (GTI).
(%: Comparison with the same month a year earlier)
(Month/Year)
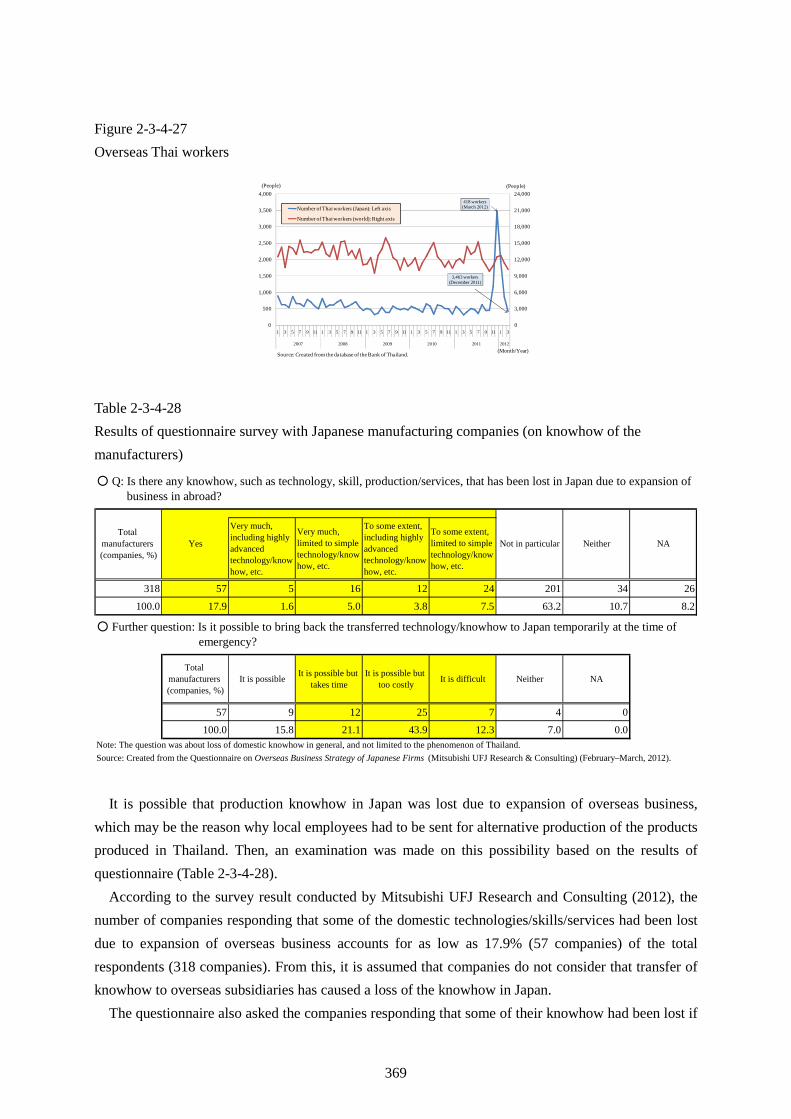
369
Figure 2-3-4-27 Overseas Thai workers
418 workers (March 2012)
3,463 workers (December 2011)
0
3,000
6,000
9,000
12,000
15,000
18,000
21,000
24,000
0
500
1,000
1,500
2,000
2,500
3,000
3,500
4,000
1 3 5 7 9 11 1 3 5 7 9 11 1 3 5 7 9 11 1 3 5 7 9 11 1 3 5 7 9 11 1 3
2007 2008 2009 2010 2011 2012
Number of Thai workers (Japan): Left axis
Number of Thai workers (world): Right axis
(People) (People)
Source: Created from the database of the Bank of Thailand.(Month/Year)
Table 2-3-4-28 Results of questionnaire survey with Japanese manufacturing companies (on knowhow of the manufacturers)
Very much, including highly advanced technology/knowhow, etc.
Very much, limited to simple technology/knowhow, etc.
To some extent, including highly advanced technology/knowhow, etc.
To some extent, limited to simple technology/knowhow, etc.
318 57 5 16 12 24 201 34 26
100.0 17.9 1.6 5.0 3.8 7.5 63.2 10.7 8.2
Total manufacturers (companies, %)
It is possible It is possible but takes time
It is possible but too costly It is difficult Neither NA
57 9 12 25 7 4 0
100.0 15.8 21.1 43.9 12.3 7.0 0.0Note: The question was about loss of domestic knowhow in general, and not limited to the phenomenon of Thailand.Source: Created from the Questionnaire on Overseas Business Strategy of Japanese Firms (Mitsubishi UFJ Research & Consulting) (February–March, 2012).
YesTotal
manufacturers (companies, %)
Not in particular
○ Q: Is there any knowhow, such as technology, skill, production/services, that has been lost in Japan due to expansion of business in abroad?
○ Further question: Is it possible to bring back the transferred technology/knowhow to Japan temporarily at the time of emergency?
Neither NA
It is possible that production knowhow in Japan was lost due to expansion of overseas business, which may be the reason why local employees had to be sent for alternative production of the products produced in Thailand. Then, an examination was made on this possibility based on the results of questionnaire (Table 2-3-4-28).
According to the survey result conducted by Mitsubishi UFJ Research and Consulting (2012), the number of companies responding that some of the domestic technologies/skills/services had been lost due to expansion of overseas business accounts for as low as 17.9% (57 companies) of the total respondents (318 companies). From this, it is assumed that companies do not consider that transfer of knowhow to overseas subsidiaries has caused a loss of the knowhow in Japan.
The questionnaire also asked the companies responding that some of their knowhow had been lost if
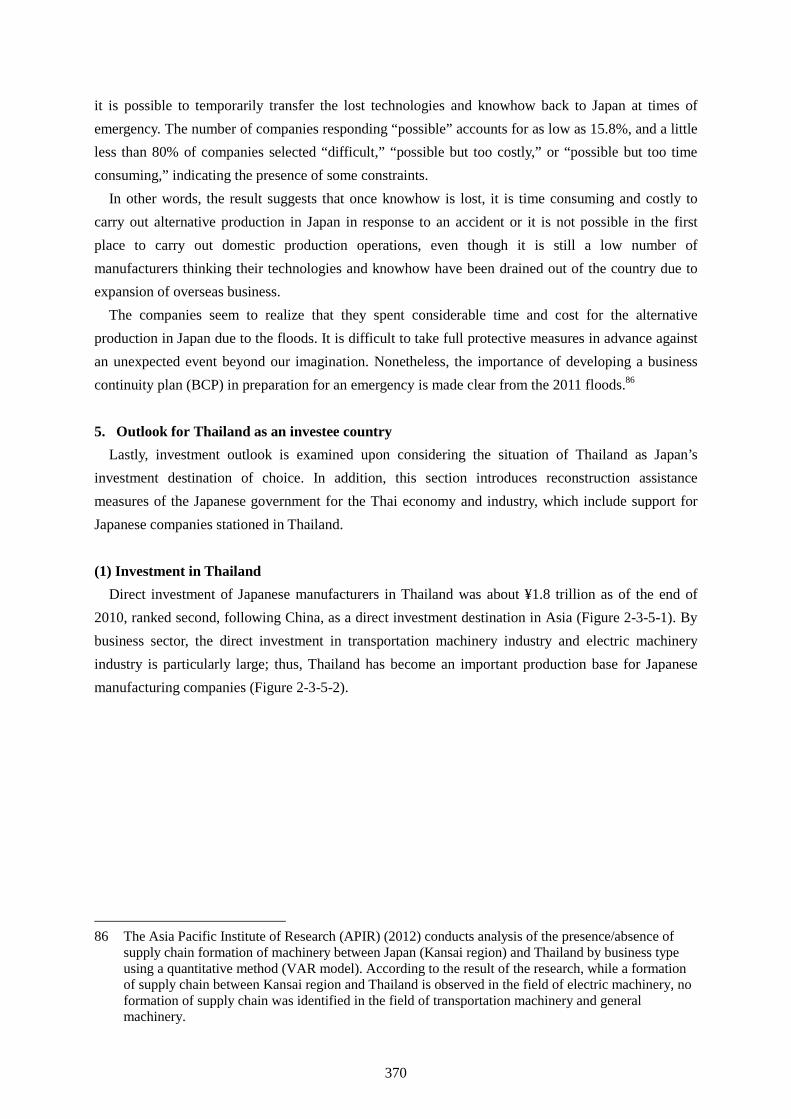
370
it is possible to temporarily transfer the lost technologies and knowhow back to Japan at times of emergency. The number of companies responding “possible” accounts for as low as 15.8%, and a little less than 80% of companies selected “difficult,” “possible but too costly,” or “possible but too time consuming,” indicating the presence of some constraints.
In other words, the result suggests that once knowhow is lost, it is time consuming and costly to carry out alternative production in Japan in response to an accident or it is not possible in the first place to carry out domestic production operations, even though it is still a low number of manufacturers thinking their technologies and knowhow have been drained out of the country due to expansion of overseas business.
The companies seem to realize that they spent considerable time and cost for the alternative production in Japan due to the floods. It is difficult to take full protective measures in advance against an unexpected event beyond our imagination. Nonetheless, the importance of developing a business continuity plan (BCP) in preparation for an emergency is made clear from the 2011 floods.86
5. Outlook for Thailand as an investee country Lastly, investment outlook is examined upon considering the situation of Thailand as Japan’s
investment destination of choice. In addition, this section introduces reconstruction assistance measures of the Japanese government for the Thai economy and industry, which include support for Japanese companies stationed in Thailand. (1) Investment in Thailand
Direct investment of Japanese manufacturers in Thailand was about ¥1.8 trillion as of the end of 2010, ranked second, following China, as a direct investment destination in Asia (Figure 2-3-5-1). By business sector, the direct investment in transportation machinery industry and electric machinery industry is particularly large; thus, Thailand has become an important production base for Japanese manufacturing companies (Figure 2-3-5-2).
86 The Asia Pacific Institute of Research (APIR) (2012) conducts analysis of the presence/absence of supply chain formation of machinery between Japan (Kansai region) and Thailand by business type using a quantitative method (VAR model). According to the result of the research, while a formation of supply chain between Kansai region and Thailand is observed in the field of electric machinery, no formation of supply chain was identified in the field of transportation machinery and general machinery.
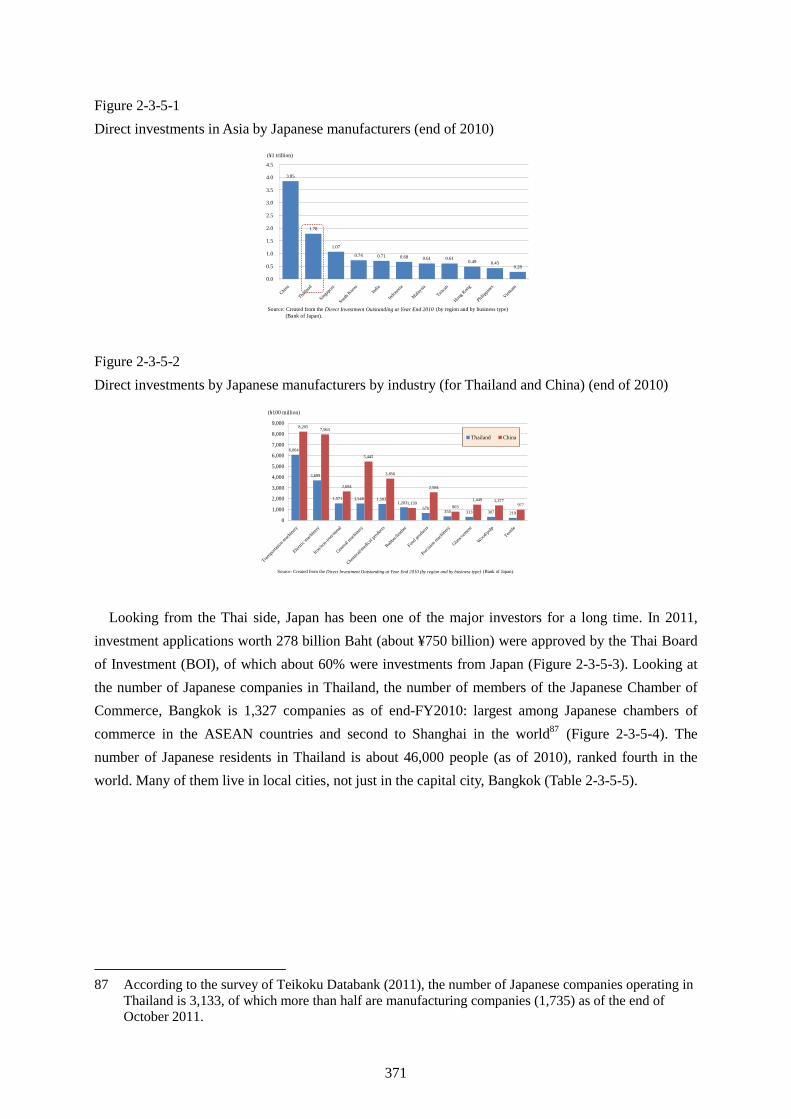
371
Figure 2-3-5-1 Direct investments in Asia by Japanese manufacturers (end of 2010)
3.85
1.78
1.07
0.74 0.71 0.68 0.61 0.610.49 0.43
0.28
0.0
0.5
1.0
1.5
2.0
2.5
3.0
3.5
4.0
4.5
China
Thaila
nd
Singapo
re
South
Korea
India
Indon
esia
Malaysi
a
Taiwan
Hong Kon
g
Philip
pines
Vietna
m
(¥1 trillion)
Source: Created from the Direct Investment Outstanding at Year End 2010 (by region and by business type) (Bank of Japan).
Figure 2-3-5-2 Direct investments by Japanese manufacturers by industry (for Thailand and China) (end of 2010)
670350 313 307 219
8,205 7,963
2,684
5,445
3,856
1,139
2,584
8031,449 1,377
977
6,064
3,699
1,571 1,548 1,5031,203
0
1,000
2,000
3,000
4,000
5,000
6,000
7,000
8,000
9,000
Transpo
rtatio
n machine
ry
Electric
machine
ry
Iron/n
on-ir
on/m
etal
Genera
l mach
inery
Chemica
l/med
ical p
roduc
ts
Rubbe
r/leath
er
Food pro
ducts
Precisi
onmach
inery
Glass/c
emen
t
Woo
d/pulp
Textile
Thailand China
Source: Created from the Direct Investment Outstanding at Year End 2010 (by region and by business type) (Bank of Japan).
(¥100 million)
Looking from the Thai side, Japan has been one of the major investors for a long time. In 2011, investment applications worth 278 billion Baht (about ¥750 billion) were approved by the Thai Board of Investment (BOI), of which about 60% were investments from Japan (Figure 2-3-5-3). Looking at the number of Japanese companies in Thailand, the number of members of the Japanese Chamber of Commerce, Bangkok is 1,327 companies as of end-FY2010: largest among Japanese chambers of commerce in the ASEAN countries and second to Shanghai in the world87 (Figure 2-3-5-4). The number of Japanese residents in Thailand is about 46,000 people (as of 2010), ranked fourth in the world. Many of them live in local cities, not just in the capital city, Bangkok (Table 2-3-5-5).
87 According to the survey of Teikoku Databank (2011), the number of Japanese companies operating in Thailand is 3,133, of which more than half are manufacturing companies (1,735) as of the end of October 2011.
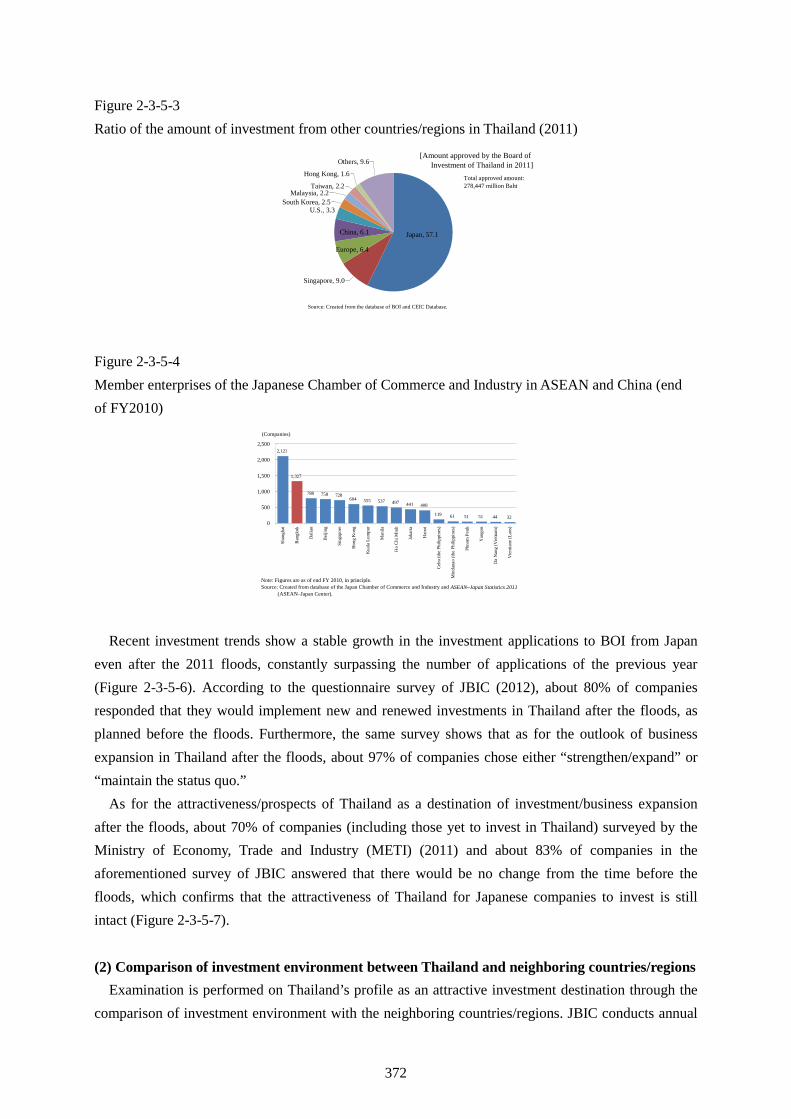
372
Figure 2-3-5-3 Ratio of the amount of investment from other countries/regions in Thailand (2011)
U.S., 3.3
Taiwan, 2.2
Hong Kong, 1.6
Others, 9.6
South Korea, 2.5
Japan, 57.1
Singapore, 9.0
Europe, 6.4
China, 6.1
Malaysia, 2.2
Source: Created from the database of BOI and CEIC Database.
[Amount approved by the Board of Investment of Thailand in 2011]
Total approved amount: 278,447 million Baht
Figure 2-3-5-4 Member enterprises of the Japanese Chamber of Commerce and Industry in ASEAN and China (end of FY2010)
2,121
1,327
788 758 728604 555 537 497 441 408
119 61 51 51 44 320
500
1,000
1,500
2,000
2,500
Shan
ghai
Ban
gkok
Dal
ian
Bei
jing
Sing
apor
e
Hon
gK
ong
Kua
laLu
mpu
r
Man
ila
Ho
Chi
Min
h
Jaka
rta
Han
oi
Ceb
u(th
ePh
ilipp
ines
)
Min
dana
o(th
ePh
ilipp
ines
)
Phno
mPe
nh
Yan
gon
Da
Nan
g(V
ietn
am)
Vie
ntia
ne(L
aos)
Note: Figures are as of end FY 2010, in principle.Source: Created from database of the Japan Chamber of Commerce and Industry and ASEAN–Japan Statistics 2011
(ASEAN–Japan Center).
(Companies)
Recent investment trends show a stable growth in the investment applications to BOI from Japan even after the 2011 floods, constantly surpassing the number of applications of the previous year (Figure 2-3-5-6). According to the questionnaire survey of JBIC (2012), about 80% of companies responded that they would implement new and renewed investments in Thailand after the floods, as planned before the floods. Furthermore, the same survey shows that as for the outlook of business expansion in Thailand after the floods, about 97% of companies chose either “strengthen/expand” or “maintain the status quo.”
As for the attractiveness/prospects of Thailand as a destination of investment/business expansion after the floods, about 70% of companies (including those yet to invest in Thailand) surveyed by the Ministry of Economy, Trade and Industry (METI) (2011) and about 83% of companies in the aforementioned survey of JBIC answered that there would be no change from the time before the floods, which confirms that the attractiveness of Thailand for Japanese companies to invest is still intact (Figure 2-3-5-7). (2) Comparison of investment environment between Thailand and neighboring countries/regions
Examination is performed on Thailand’s profile as an attractive investment destination through the comparison of investment environment with the neighboring countries/regions. JBIC conducts annual
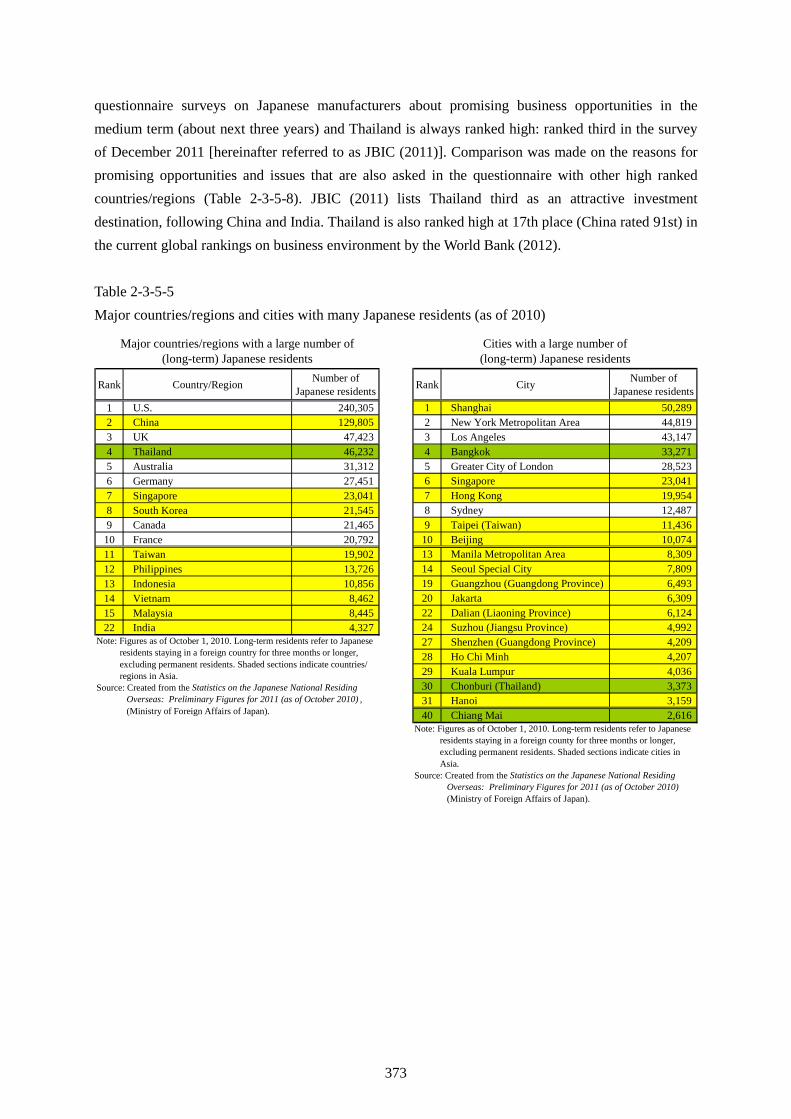
373
questionnaire surveys on Japanese manufacturers about promising business opportunities in the medium term (about next three years) and Thailand is always ranked high: ranked third in the survey of December 2011 [hereinafter referred to as JBIC (2011)]. Comparison was made on the reasons for promising opportunities and issues that are also asked in the questionnaire with other high ranked countries/regions (Table 2-3-5-8). JBIC (2011) lists Thailand third as an attractive investment destination, following China and India. Thailand is also ranked high at 17th place (China rated 91st) in the current global rankings on business environment by the World Bank (2012). Table 2-3-5-5 Major countries/regions and cities with many Japanese residents (as of 2010)
Rank City Number ofJapanese residents
1 Shanghai 50,2892 New York Metropolitan Area 44,8193 Los Angeles 43,1474 Bangkok 33,2715 Greater City of London 28,5236 Singapore 23,0417 Hong Kong 19,9548 Sydney 12,4879 Taipei (Taiwan) 11,43610 Beijing 10,07413 Manila Metropolitan Area 8,30914 Seoul Special City 7,80919 Guangzhou (Guangdong Province) 6,49320 Jakarta 6,30922 Dalian (Liaoning Province) 6,12424 Suzhou (Jiangsu Province) 4,99227 Shenzhen (Guangdong Province) 4,20928 Ho Chi Minh 4,20729 Kuala Lumpur 4,03630 Chonburi (Thailand) 3,37331 Hanoi 3,15940 Chiang Mai 2,616
Note: Figures as of October 1, 2010. Long-term residents refer to Japanese residents staying in a foreign county for three months or longer, excluding permanent residents. Shaded sections indicate cities in Asia.Source: Created from the Statistics on the Japanese National Residing Overseas: Preliminary Figures for 2011 (as of October 2010) (Ministry of Foreign Affairs of Japan).
Cities with a large number of(long-term) Japanese residents
Rank Country/Region Number ofJapanese residents
1 U.S. 240,3052 China 129,8053 UK 47,4234 Thailand 46,2325 Australia 31,3126 Germany 27,4517 Singapore 23,0418 South Korea 21,5459 Canada 21,46510 France 20,79211 Taiwan 19,90212 Philippines 13,72613 Indonesia 10,85614 Vietnam 8,46215 Malaysia 8,44522 India 4,327
Note: Figures as of October 1, 2010. Long-term residents refer to Japanese residents staying in a foreign country for three months or longer, excluding permanent residents. Shaded sections indicate countries/ regions in Asia.Source: Created from the Statistics on the Japanese National Residing Overseas: Preliminary Figures for 2011 (as of October 2010) ,
(Ministry of Foreign Affairs of Japan).
Major countries/regions with a large number of(long-term) Japanese residents
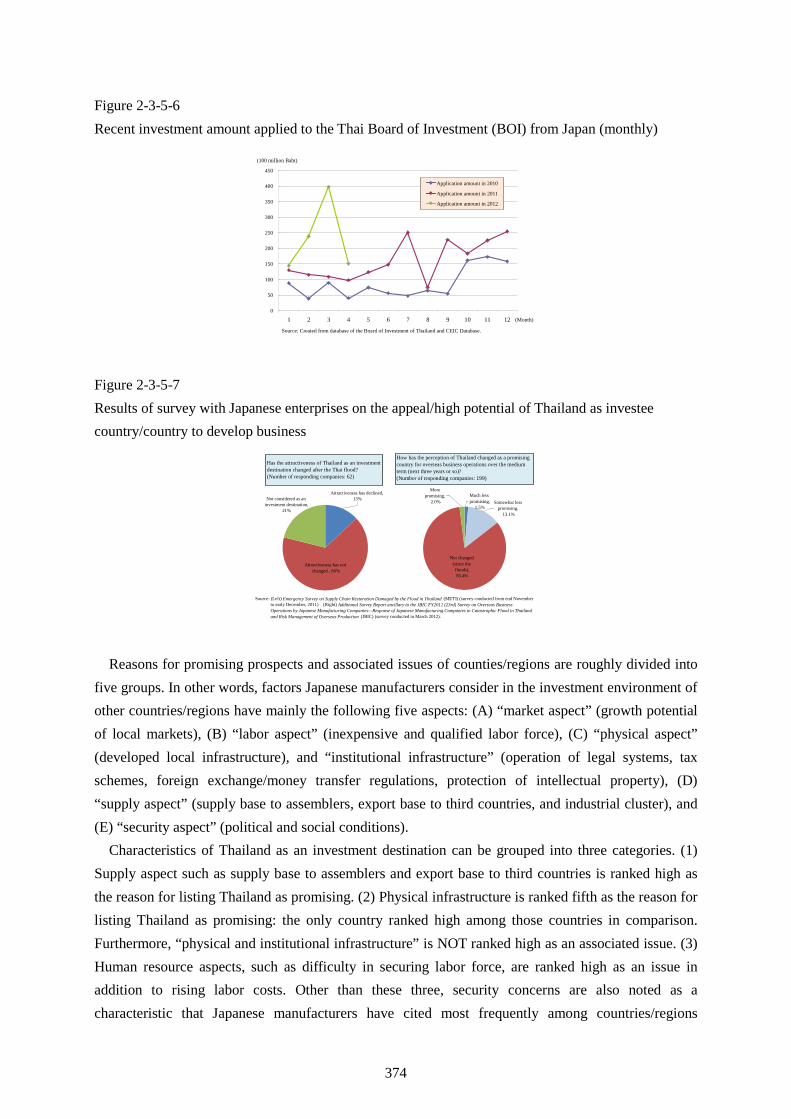
374
Figure 2-3-5-6 Recent investment amount applied to the Thai Board of Investment (BOI) from Japan (monthly)
0
50
100
150
200
250
300
350
400
450
1 2 3 4 5 6 7 8 9 10 11 12
Application amount in 2010
Application amount in 2011
Application amount in 2012
Source: Created from database of the Board of Investment of Thailand and CEIC Database.
(Month)
(100 million Baht)
Figure 2-3-5-7 Results of survey with Japanese enterprises on the appeal/high potential of Thailand as investee country/country to develop business
Not considered as an investment destination,
21%
Attractiveness has declined, 13%
Attractiveness has not changed , 66%
Somewhat less promising,
13.1%
Much less promising,
1.5%
Not changed (since the
floods), 83.4%
More promising,
2.0%
Has the attractiveness of Thailand as an investment destination changed after the Thai flood? (Number of responding companies: 62)
How has the perception of Thailand changed as a promising country for overseas business operations over the medium term (next three years or so)? (Number of responding companies: 199)
Source: (Left) Emergency Survey on Supply Chain Restoration Damaged by the Flood in Thailand (METI) (survey conducted from end November to early December, 2011) (Right) Additional Survey Report ancillary to the JBIC FY2011 (23rd) Survey on Overseas Business
Operations by Japanese Manufacturing Companies—Response of Japanese Manufacturing Companies to Catastrophic Flood in Thailand and Risk Management of Overseas Production (JBIC) (survey conducted in March 2012).
Reasons for promising prospects and associated issues of counties/regions are roughly divided into five groups. In other words, factors Japanese manufacturers consider in the investment environment of other countries/regions have mainly the following five aspects: (A) “market aspect” (growth potential of local markets), (B) “labor aspect” (inexpensive and qualified labor force), (C) “physical aspect” (developed local infrastructure), and “institutional infrastructure” (operation of legal systems, tax schemes, foreign exchange/money transfer regulations, protection of intellectual property), (D) “supply aspect” (supply base to assemblers, export base to third countries, and industrial cluster), and (E) “security aspect” (political and social conditions).
Characteristics of Thailand as an investment destination can be grouped into three categories. (1) Supply aspect such as supply base to assemblers and export base to third countries is ranked high as the reason for listing Thailand as promising. (2) Physical infrastructure is ranked fifth as the reason for listing Thailand as promising: the only country ranked high among those countries in comparison. Furthermore, “physical and institutional infrastructure” is NOT ranked high as an associated issue. (3) Human resource aspects, such as difficulty in securing labor force, are ranked high as an issue in addition to rising labor costs. Other than these three, security concerns are also noted as a characteristic that Japanese manufacturers have cited most frequently among countries/regions
375
compared in the survey. Among these characteristics, the superiority of Thailand in terms of “supply aspect” is a highly
relevant characteristic considering the development of clustering of automotive and electronics industries, as described earlier. Furthermore, one third of the companies, which cited Thailand as promising in the survey by JBIC, listed Thailand’s base of export to third countries as an attractive factor: top rated among countries/regions compared in the survey. This seems to be one of the significant factors contributing to the development of the machine industry cluster in Thailand, which is also evidenced by high utilization rate of FTAs between third countries, for which Japanese countries use Thailand as one of the hubs (Figure 2-3-5-9).
The superiority of “physical and institutional infrastructure” seems to be the “relative superiority over the neighboring manufacturing countries/regions.” The WEF report (2011) on country- and region-wise indexes for competitiveness provides an index for the development of infrastructure, and Thailand is ranked 42nd in the latest ranking, which is lower than Singapore (3rd) and Malaysia (26th). However, Thailand is still promising compared to other promising countries/regions, such as Indonesia, Vietnam, and India.
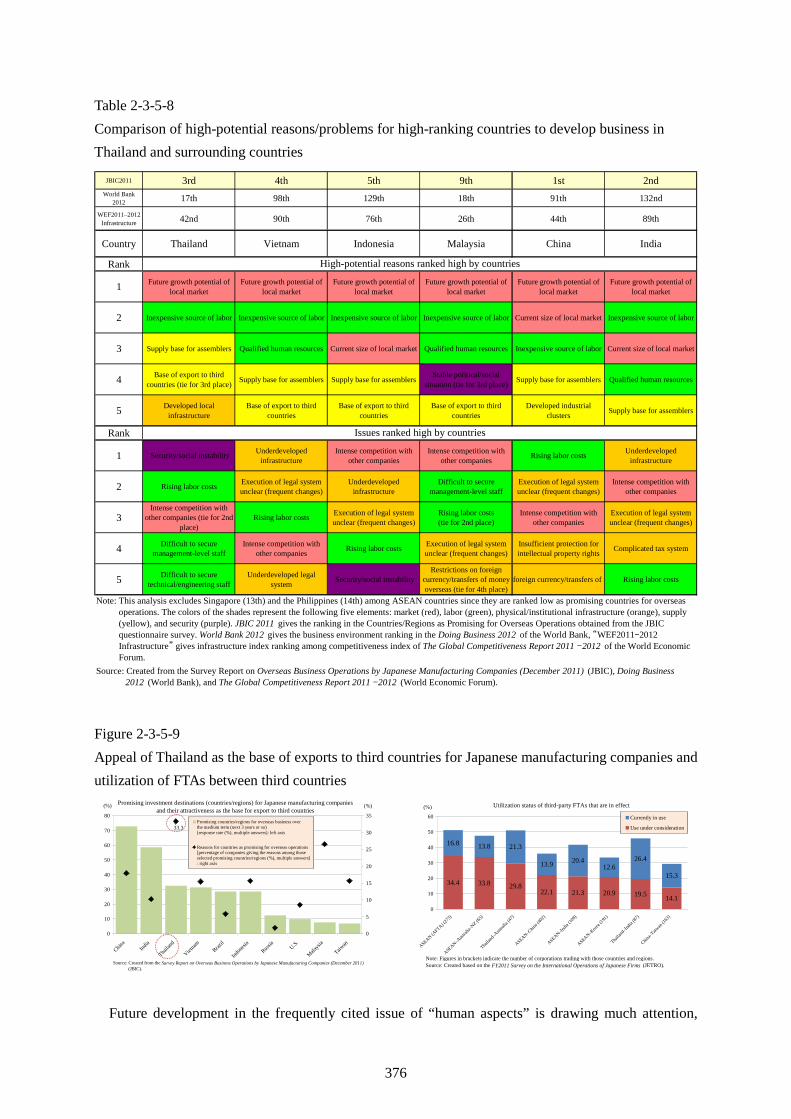
376
Table 2-3-5-8 Comparison of high-potential reasons/problems for high-ranking countries to develop business in Thailand and surrounding countries
JBIC2011 3rd 4th 5th 9th 1st 2ndWorld Bank
2012 17th 98th 129th 18th 91th 132nd
WEF2011–2012Infrastructure 42nd 90th 76th 26th 44th 89th
Country Thailand Vietnam Indonesia Malaysia China India
Rank
1 Future growth potential oflocal market
Future growth potential oflocal market
Future growth potential oflocal market
Future growth potential oflocal market
Future growth potential oflocal market
Future growth potential oflocal market
2 Inexpensive source of labor Inexpensive source of labor Inexpensive source of labor Inexpensive source of labor Current size of local market Inexpensive source of labor
3 Supply base for assemblers Qualified human resources Current size of local market Qualified human resources Inexpensive source of labor Current size of local market
4 Base of export to thirdcountries (tie for 3rd place) Supply base for assemblers Supply base for assemblers Stable political/social
situation (tie for 3rd place) Supply base for assemblers Qualified human resources
5 Developed localinfrastructure
Base of export to thirdcountries
Base of export to thirdcountries
Base of export to thirdcountries
Developed industrialclusters Supply base for assemblers
Rank
1 Security/social instability Underdevelopedinfrastructure
Intense competition withother companies
Intense competition withother companies Rising labor costs Underdeveloped
infrastructure
2 Rising labor costs Execution of legal systemunclear (frequent changes)
Underdevelopedinfrastructure
Difficult to securemanagement-level staff
Execution of legal systemunclear (frequent changes)
Intense competition withother companies
3Intense competition with
other companies (tie for 2ndplace)
Rising labor costs Execution of legal systemunclear (frequent changes)
Rising labor costs(tie for 2nd place)
Intense competition withother companies
Execution of legal systemunclear (frequent changes)
4 Difficult to securemanagement-level staff
Intense competition withother companies Rising labor costs Execution of legal system
unclear (frequent changes)Insufficient protection forintellectual property rights Complicated tax system
5 Difficult to securetechnical/engineering staff
Underdeveloped legalsystem Security/social instability
Restrictions on foreigncurrency/transfers of moneyoverseas (tie for 4th place)
foreign currency/transfers of money overseasRising labor costs
Source: Created from the Survey Report on Overseas Business Operations by Japanese Manufacturing Companies (December 2011) (JBIC), Doing Business 2012 (World Bank), and The Global Competitiveness Report 2011 – 2012 (World Economic Forum).
High-potential reasons ranked high by countries
Issues ranked high by countries
Note: This analysis excludes Singapore (13th) and the Philippines (14th) among ASEAN countries since they are ranked low as promising countries for overseas operations. The colors of the shades represent the following five elements: market (red), labor (green), physical/institutional infrastructure (orange), supply (yellow), and security (purple). JBIC 2011 gives the ranking in the Countries/Regions as Promising for Overseas Operations obtained from the JBIC questionnaire survey. World Bank 2012 gives the business environment ranking in the Doing Business 2012 of the World Bank, “WEF2011–2012 Infrastructure” gives infrastructure index ranking among competitiveness index of The Global Competitiveness Report 2011 – 2012 of the World Economic Forum.
Figure 2-3-5-9 Appeal of Thailand as the base of exports to third countries for Japanese manufacturing companies and utilization of FTAs between third countries
33.3
0
10
20
30
40
50
60
70
80
ChinaIndia
Thaila
nd
Vietna
mBraz
il
Indon
esia
Russia
U.S.
Malaysi
a
Taiwan
0
5
10
15
20
25
30
35Promising countries/regions for overseas business over the medium term (next 3 years or so) [response rate (%), multiple answers]: left axis
Reasons for countries as promising for overseas operations[percentage of companies giving the reasons among those selected promising countries/regions (%), multiple answers]: right axis
Source: Created from the Survey Report on Overseas Business Operations by Japanese Manufacturing Companies (December 2011) (JBIC).
(%) (%)Promising investment destinations (countries/regions) for Japanese manufacturing companiesand their attractiveness as the base for export to third countries
34.4 33.8 29.822.1 21.3 20.9 19.5 14.1
16.8 13.8 21.3
13.9 20.412.6
26.4
15.3
0
10
20
30
40
50
60
ASEAN(A
FTA) (273)
ASEAN–A
ustral
ia–NZ (65
)
Thailan
d–Aust
ralia
(47)
ASEAN–Chin
a (402)
ASEAN–India
(108)
ASEAN–Kore
a (191)
Thailan
d–Ind
ia(87
)
China–T
aiwan
(163)
Currently in use
Use under consideration
Note: Figures in brackets indicate the number of corporations trading with those countries and regions.Source: Created based on the FY2011 Survey on the International Operations of Japanese Firms (JETRO).
Utilization status of third-party FTAs that are in effect(%)
Future development in the frequently cited issue of “human aspects” is drawing much attention,
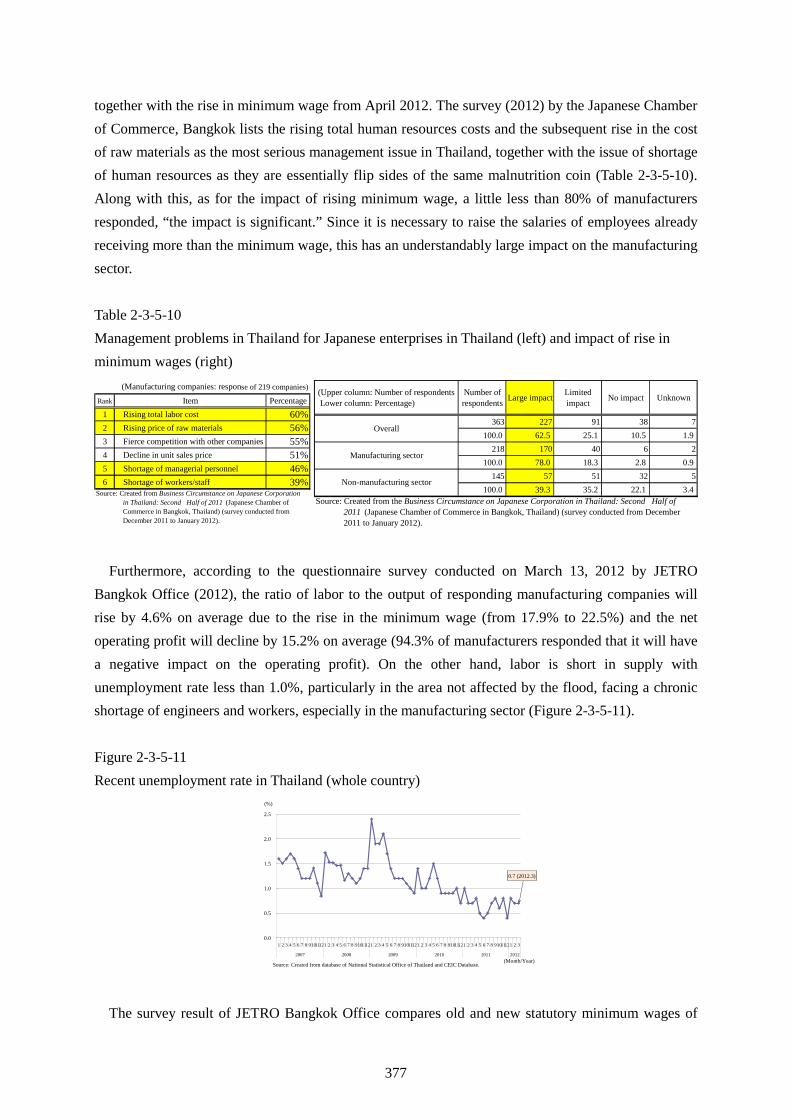
377
together with the rise in minimum wage from April 2012. The survey (2012) by the Japanese Chamber of Commerce, Bangkok lists the rising total human resources costs and the subsequent rise in the cost of raw materials as the most serious management issue in Thailand, together with the issue of shortage of human resources as they are essentially flip sides of the same malnutrition coin (Table 2-3-5-10). Along with this, as for the impact of rising minimum wage, a little less than 80% of manufacturers responded, “the impact is significant.” Since it is necessary to raise the salaries of employees already receiving more than the minimum wage, this has an understandably large impact on the manufacturing sector. Table 2-3-5-10 Management problems in Thailand for Japanese enterprises in Thailand (left) and impact of rise in minimum wages (right)
(Upper column: Number of respondents Lower column: Percentage)
Number ofrespondents Large impact Limited
impact No impact Unknown
363 227 91 38 7100.0 62.5 25.1 10.5 1.9
218 170 40 6 2100.0 78.0 18.3 2.8 0.9
145 57 51 32 5100.0 39.3 35.2 22.1 3.4
Source: Created from the Business Circumstance on Japanese Corporation in Thailand: Second Half of2011 (Japanese Chamber of Commerce in Bangkok, Thailand) (survey conducted from December
2011 to January 2012).
Non-manufacturing sector
Overall
Manufacturing sector
Rank Item Percentage1 Rising total labor cost 60%2 Rising price of raw materials 56%3 Fierce competition with other companies 55%4 Decline in unit sales price 51%5 Shortage of managerial personnel 46%6 Shortage of workers/staff 39%
Source: Created from Business Circumstance on Japanese Corporation in Thailand: Second Half of 2011 (Japanese Chamber of Commerce in Bangkok, Thailand) (survey conducted from December 2011 to January 2012).
(Manufacturing companies: response of 219 companies)
Furthermore, according to the questionnaire survey conducted on March 13, 2012 by JETRO Bangkok Office (2012), the ratio of labor to the output of responding manufacturing companies will rise by 4.6% on average due to the rise in the minimum wage (from 17.9% to 22.5%) and the net operating profit will decline by 15.2% on average (94.3% of manufacturers responded that it will have a negative impact on the operating profit). On the other hand, labor is short in supply with unemployment rate less than 1.0%, particularly in the area not affected by the flood, facing a chronic shortage of engineers and workers, especially in the manufacturing sector (Figure 2-3-5-11). Figure 2-3-5-11 Recent unemployment rate in Thailand (whole country)
0.7 (2012.3)
0.0
0.5
1.0
1.5
2.0
2.5
1 2 3 4 5 6 7 8 91011121 2 3 4 5 6 7 8 91011121 2 3 4 5 6 7 8 91011121 2 3 4 5 6 7 8 91011121 2 3 4 5 6 7 8 91011121 2 3
2007 2008 2009 2010 2011 2012
(%)
Source: Created from database of National Statistical Office of Thailand and CEIC Database.(Month/Year)
The survey result of JETRO Bangkok Office compares old and new statutory minimum wages of
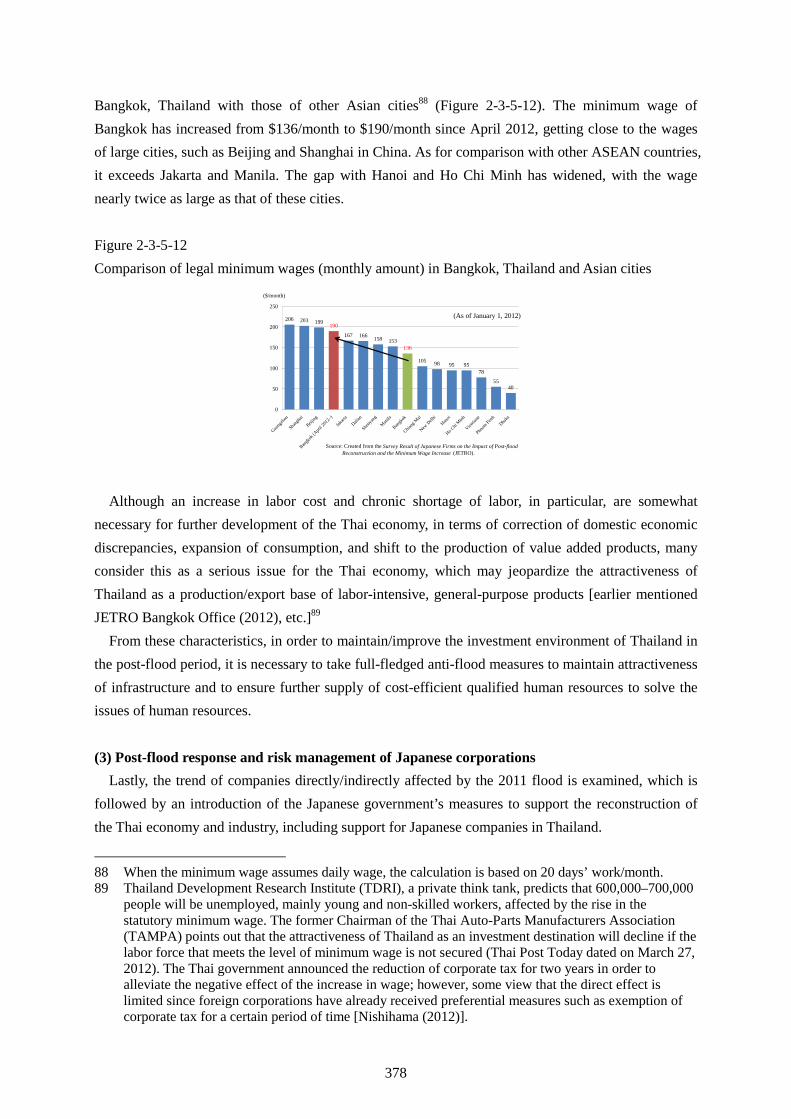
378
Bangkok, Thailand with those of other Asian cities88 (Figure 2-3-5-12). The minimum wage of Bangkok has increased from $136/month to $190/month since April 2012, getting close to the wages of large cities, such as Beijing and Shanghai in China. As for comparison with other ASEAN countries, it exceeds Jakarta and Manila. The gap with Hanoi and Ho Chi Minh has widened, with the wage nearly twice as large as that of these cities. Figure 2-3-5-12 Comparison of legal minimum wages (monthly amount) in Bangkok, Thailand and Asian cities
206 203 199
167 166 158 153
105 98 95 9578
5540
190
136
0
50
100
150
200
250
Guang
zhou
Shang
hai
Beijing
Bangk
ok(A
pril 2
012–
)
Jakart
aDali
an
Sheny
ang
Manila
Bangk
ok
Chiang
Mai
NewDelh
iHan
oi
Ho ChiMinh
Vientia
ne
Phnom
PenhDha
ka
(As of January 1, 2012)
Source: Created from the Survey Result of Japanese Firms on the Impact of Post-flood Reconstruction and the Minimum Wage Increase (JETRO).
($/month)
Although an increase in labor cost and chronic shortage of labor, in particular, are somewhat necessary for further development of the Thai economy, in terms of correction of domestic economic discrepancies, expansion of consumption, and shift to the production of value added products, many consider this as a serious issue for the Thai economy, which may jeopardize the attractiveness of Thailand as a production/export base of labor-intensive, general-purpose products [earlier mentioned JETRO Bangkok Office (2012), etc.]89
From these characteristics, in order to maintain/improve the investment environment of Thailand in the post-flood period, it is necessary to take full-fledged anti-flood measures to maintain attractiveness of infrastructure and to ensure further supply of cost-efficient qualified human resources to solve the issues of human resources. (3) Post-flood response and risk management of Japanese corporations
Lastly, the trend of companies directly/indirectly affected by the 2011 flood is examined, which is followed by an introduction of the Japanese government’s measures to support the reconstruction of the Thai economy and industry, including support for Japanese companies in Thailand.
88 When the minimum wage assumes daily wage, the calculation is based on 20 days’ work/month. 89 Thailand Development Research Institute (TDRI), a private think tank, predicts that 600,000–700,000
people will be unemployed, mainly young and non-skilled workers, affected by the rise in the statutory minimum wage. The former Chairman of the Thai Auto-Parts Manufacturers Association (TAMPA) points out that the attractiveness of Thailand as an investment destination will decline if the labor force that meets the level of minimum wage is not secured (Thai Post Today dated on March 27, 2012). The Thai government announced the reduction of corporate tax for two years in order to alleviate the negative effect of the increase in wage; however, some view that the direct effect is limited since foreign corporations have already received preferential measures such as exemption of corporate tax for a certain period of time [Nishihama (2012)].
379
According to the questionnaire survey conducted by JETRO Bangkok Office (2012), as for the prospect of the business scale compared with before the flood, about 40% of the directly affected manufacturers (less than 10% answered unknown) and about 20% of the indirectly affected manufacturers answered that they would reduce the business scale and that the magnitude of reduction would be 60% of that before the flood (Table 2-3-5-13). This result indicates a severe outlook unlike the overall impression of post-flood investment in Thailand. The questionnaire also asks about the reasons for the business reduction, and some companies listed inevitable reasons, such as “major customers have shifted to the competitor,” while others chose risk diversification by gradually reducing the production ratio in Thailand, such as “production at the alternative site will not return to Thailand in view of future risk hedge.” This corresponds to the result of the study conducted by METI (2011) mentioned earlier that only a little more than 20% of manufacturers based on Thailand and less than 10% of manufacturers based on other sites answered that they would return to the original procurement contractors from the alternative procurement contractors after the reconstruction is achieved (Figure 2-3-5-14).
About 80% of Japanese corporations answered that they would continue the business at the same location that had suffered direct damage, which is overwhelmingly more than corporations that responded that they would move the factories to other places in Thailand (less than 20%). However, the survey result of JETRO Bangkok Office reveals that some companies have no other choice to remain at the same location due to financial constraints: no money to move the factory to areas free from flood risk. Companies that chose to move out of Thailand said that they would do so with an aim for risk diversification since they have other production base(s) in Thailand. This survey did not identify any corporation that made a decision to take a risk of abandoning the conventional supply chain by completely withdrawing from Thailand after the floods [the survey of the earlier-mentioned Japanese Chamber of Commerce, Bangkok (2012) also shows a similar result].
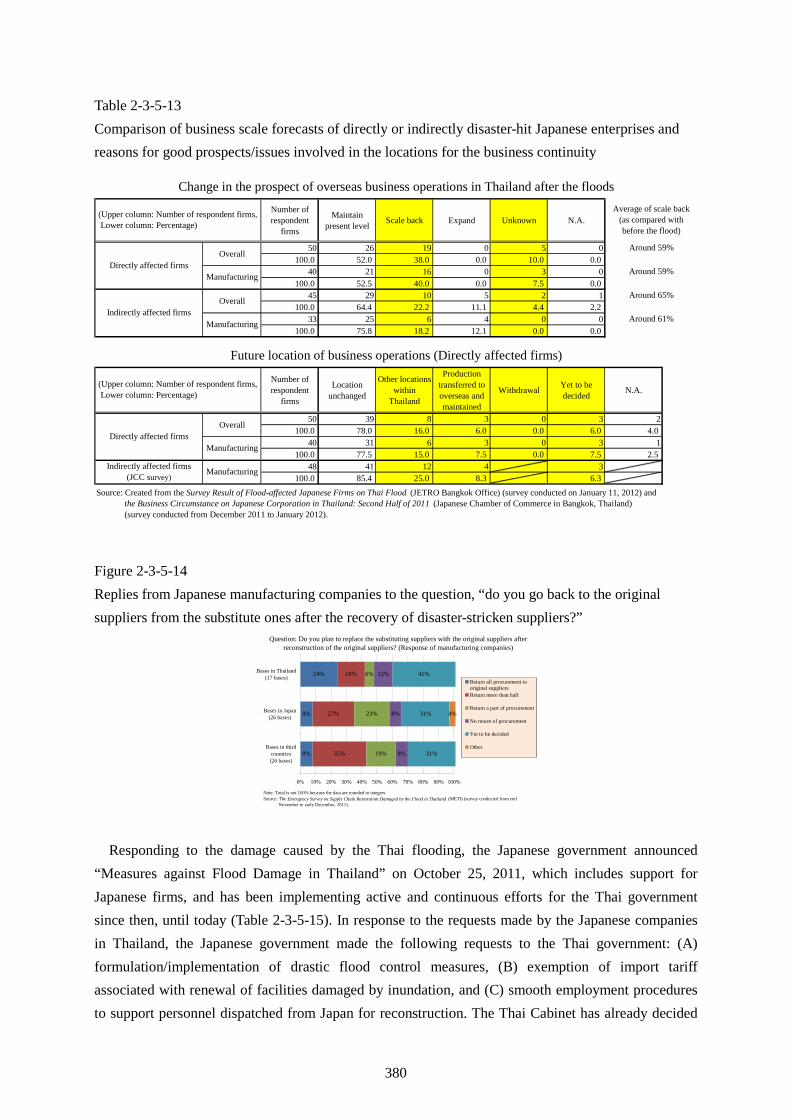
380
Table 2-3-5-13 Comparison of business scale forecasts of directly or indirectly disaster-hit Japanese enterprises and reasons for good prospects/issues involved in the locations for the business continuity
Number ofrespondent
firms
Maintainpresent level Scale back Expand Unknown N.A.
50 26 19 0 5 0100.0 52.0 38.0 0.0 10.0 0.0
40 21 16 0 3 0100.0 52.5 40.0 0.0 7.5 0.0
45 29 10 5 2 1100.0 64.4 22.2 11.1 4.4 2.2
33 25 6 4 0 0100.0 75.8 18.2 12.1 0.0 0.0
Number ofrespondent
firms
Locationunchanged
Other locationswithin
Thailand
Productiontransferred tooverseas andmaintained
Withdrawal Yet to bedecided N.A.
50 39 8 3 0 3 2100.0 78.0 16.0 6.0 0.0 6.0 4.0
40 31 6 3 0 3 1100.0 77.5 15.0 7.5 0.0 7.5 2.5
48 41 12 4 3100.0 85.4 25.0 8.3 6.3
(Upper column: Number of respondent firms, Lower column: Percentage)
OverallDirectly affected firms
Manufacturing
Around 59%
Future location of business operations (Directly affected firms)
Change in the prospect of overseas business operations in Thailand after the floods
Overall
Manufacturing
Overall
ManufacturingIndirectly affected firms
Average of scale back(as compared withbefore the flood)
Directly affected firms
Source: Created from the Survey Result of Flood-affected Japanese Firms on Thai Flood (JETRO Bangkok Office) (survey conducted on January 11, 2012) and the Business Circumstance on Japanese Corporation in Thailand: Second Half of 2011 (Japanese Chamber of Commerce in Bangkok, Thailand) (survey conducted from December 2011 to January 2012).
ManufacturingIndirectly affected firms(JCC survey)
Around 59%
Around 65%
Around 61%
(Upper column: Number of respondent firms, Lower column: Percentage)
Figure 2-3-5-14 Replies from Japanese manufacturing companies to the question, “do you go back to the original suppliers from the substitute ones after the recovery of disaster-stricken suppliers?”
8%
8%
24%
35%
27%
18%
19%
23%
6%
8%
8%
12%
31%
31%
41%
4%
0% 10% 20% 30% 40% 50% 60% 70% 80% 90% 100%
Bases in thirdcountries(26 bases)
Bases in Japan(26 bases)
Bases in Thailand(17 bases)
Return all procurement tooriginal suppliersReturn more than half
Return a part of procurement
No return of procurement
Yet to be decided
Other
Question: Do you plan to replace the substituting suppliers with the original suppliers afterreconstruction of the original suppliers? (Response of manufacturing companies)
Note: Total is not 100% because the data are rounded to integers.Source: The Emergency Survey on Supply Chain Restoration Damaged by the Flood in Thailand (METI) (survey conducted from end November to early December, 2011).
Responding to the damage caused by the Thai flooding, the Japanese government announced “Measures against Flood Damage in Thailand” on October 25, 2011, which includes support for Japanese firms, and has been implementing active and continuous efforts for the Thai government since then, until today (Table 2-3-5-15). In response to the requests made by the Japanese companies in Thailand, the Japanese government made the following requests to the Thai government: (A) formulation/implementation of drastic flood control measures, (B) exemption of import tariff associated with renewal of facilities damaged by inundation, and (C) smooth employment procedures to support personnel dispatched from Japan for reconstruction. The Thai Cabinet has already decided
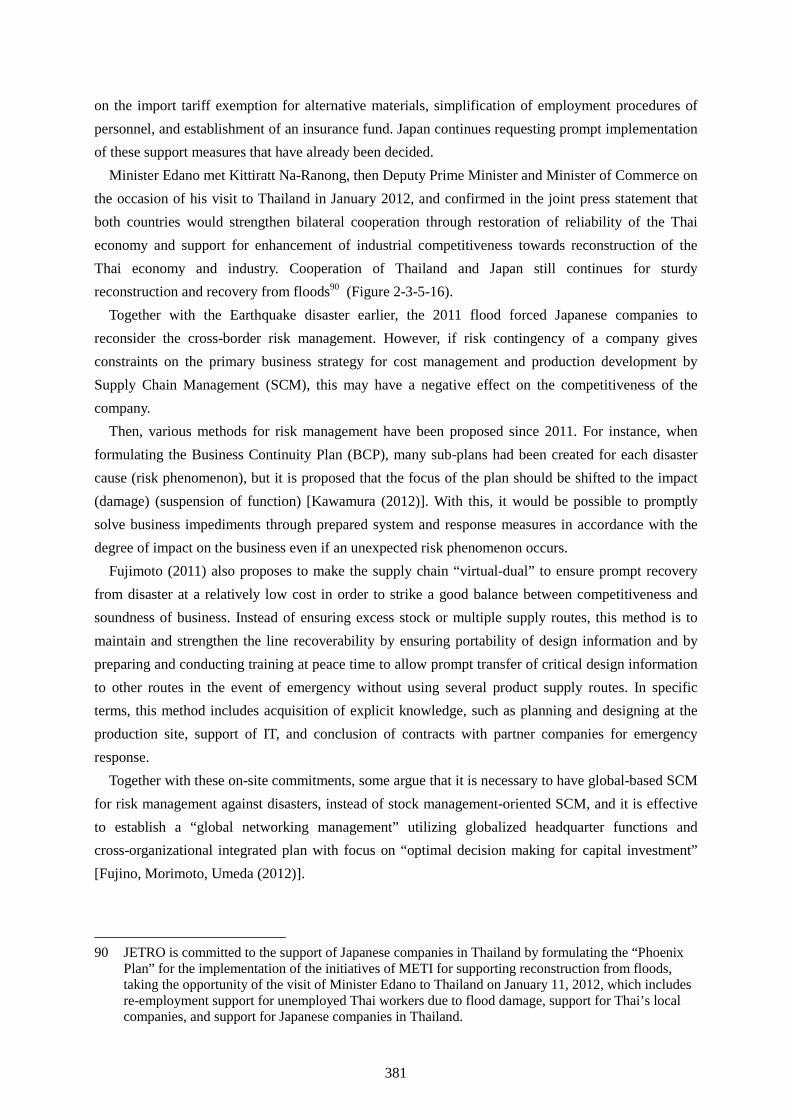
381
on the import tariff exemption for alternative materials, simplification of employment procedures of personnel, and establishment of an insurance fund. Japan continues requesting prompt implementation of these support measures that have already been decided.
Minister Edano met Kittiratt Na-Ranong, then Deputy Prime Minister and Minister of Commerce on the occasion of his visit to Thailand in January 2012, and confirmed in the joint press statement that both countries would strengthen bilateral cooperation through restoration of reliability of the Thai economy and support for enhancement of industrial competitiveness towards reconstruction of the Thai economy and industry. Cooperation of Thailand and Japan still continues for sturdy reconstruction and recovery from floods90 (Figure 2-3-5-16).
Together with the Earthquake disaster earlier, the 2011 flood forced Japanese companies to reconsider the cross-border risk management. However, if risk contingency of a company gives constraints on the primary business strategy for cost management and production development by Supply Chain Management (SCM), this may have a negative effect on the competitiveness of the company.
Then, various methods for risk management have been proposed since 2011. For instance, when formulating the Business Continuity Plan (BCP), many sub-plans had been created for each disaster cause (risk phenomenon), but it is proposed that the focus of the plan should be shifted to the impact (damage) (suspension of function) [Kawamura (2012)]. With this, it would be possible to promptly solve business impediments through prepared system and response measures in accordance with the degree of impact on the business even if an unexpected risk phenomenon occurs.
Fujimoto (2011) also proposes to make the supply chain “virtual-dual” to ensure prompt recovery from disaster at a relatively low cost in order to strike a good balance between competitiveness and soundness of business. Instead of ensuring excess stock or multiple supply routes, this method is to maintain and strengthen the line recoverability by ensuring portability of design information and by preparing and conducting training at peace time to allow prompt transfer of critical design information to other routes in the event of emergency without using several product supply routes. In specific terms, this method includes acquisition of explicit knowledge, such as planning and designing at the production site, support of IT, and conclusion of contracts with partner companies for emergency response.
Together with these on-site commitments, some argue that it is necessary to have global-based SCM for risk management against disasters, instead of stock management-oriented SCM, and it is effective to establish a “global networking management” utilizing globalized headquarter functions and cross-organizational integrated plan with focus on “optimal decision making for capital investment” [Fujino, Morimoto, Umeda (2012)].
90 JETRO is committed to the support of Japanese companies in Thailand by formulating the “Phoenix Plan” for the implementation of the initiatives of METI for supporting reconstruction from floods, taking the opportunity of the visit of Minister Edano to Thailand on January 11, 2012, which includes re-employment support for unemployed Thai workers due to flood damage, support for Thai’s local companies, and support for Japanese companies in Thailand.
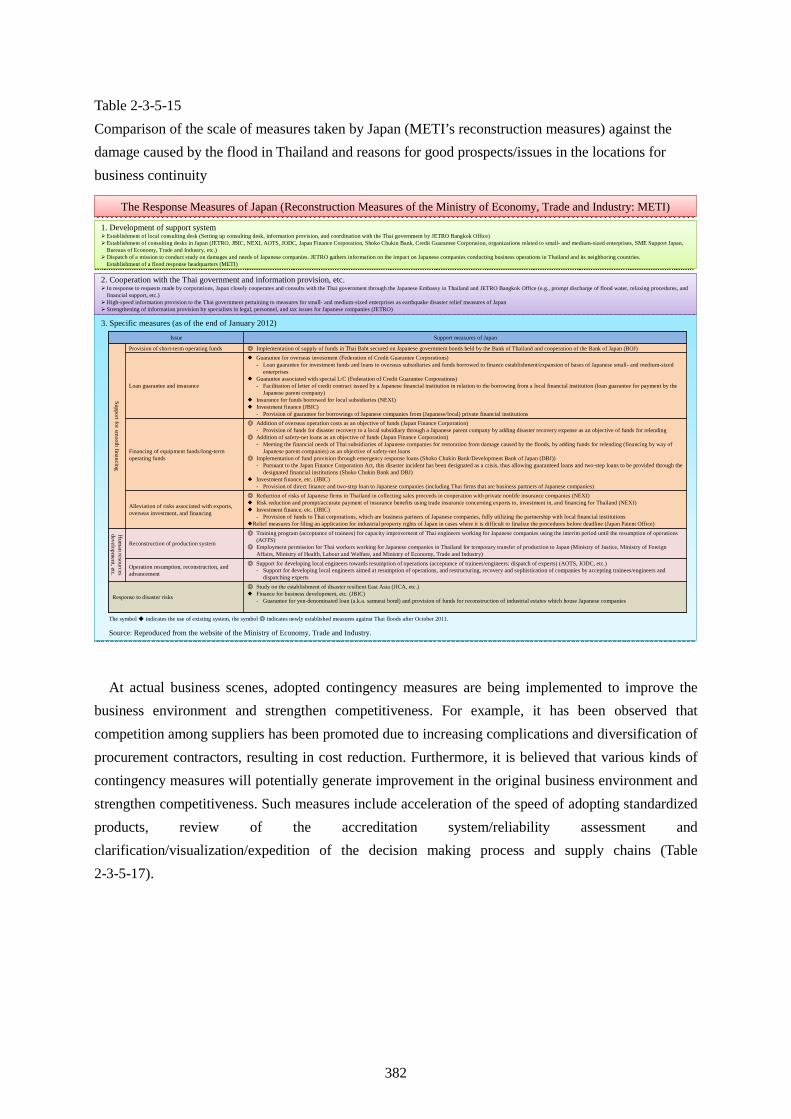
382
Table 2-3-5-15 Comparison of the scale of measures taken by Japan (METI’s reconstruction measures) against the damage caused by the flood in Thailand and reasons for good prospects/issues in the locations for business continuity
The Response Measures of Japan (Reconstruction Measures of the Ministry of Economy, Trade and Industry: METI)The Response Measures of Japan (Reconstruction Measures of the Ministry of Economy, Trade and Industry: METI)
1. Development of support system�Establishment of local consulting desk (Setting up consulting desk, information provision, and coordination with the Thai government by JETRO Bangkok Office)�Establishment of consulting desks in Japan (JETRO, JBIC, NEXI, AOTS, JODC, Japan Finance Corporation, Shoko Chukin Bank, Credit Guarantee Corporation, organizations related to small- and medium-sized enterprises, SME Support Japan,
Bureaus of Economy, Trade and Industry, etc.)�Dispatch of a mission to conduct study on damages and needs of Japanese companies. JETRO gathers information on the impact on Japanese companies conducting business operations in Thailand and its neighboring countries.
Establishment of a flood response headquarters (METI)
3. Specific measures (as of the end of January 2012)3. Specific measures (as of the end of January 2012)
2. Cooperation with the Thai government and information provision, etc. � In response to requests made by corporations, Japan closely cooperates and consults with the Thai government through the Japanese Embassy in Thailand and JETRO Bangkok Office (e.g., prompt discharge of flood water, relaxing procedures, and
financial support, etc.)�High-speed information provision to the Thai government pertaining to measures for small- and medium-sized enterprises as earthquake disaster relief measures of Japan�Strengthening of information provision by specialists in legal, personnel, and tax issues for Japanese companies (JETRO)
◎ Study on the establishment of disaster resilient East Asia (JICA, etc.)� Finance for business development, etc. (JBIC)
- Guarantee for yen-denominated loan (a.k.a. samurai bond) and provision of funds for reconstruction of industrial estates which house Japanese companies Response to disaster risks
◎ Support for developing local engineers towards resumption of operations (acceptance of trainees/engineers: dispatch of experts) (AOTS, JODC, etc.)- Support for developing local engineers aimed at resumption of operations, and restructuring, recovery and sophistication of companies by accepting trainees/engineers and
dispatching experts
Operation resumption, reconstruction, and advancement
◎ Training program (acceptance of trainees) for capacity improvement of Thai engineers working for Japanese companies using the interim period until the resumption of operations (AOTS)
◎ Employment permission for Thai workers working for Japanese companies in Thailand for temporary transfer of production to Japan (Ministry of Justice, Ministry of Foreign Affairs, Ministry of Health, Labour and Welfare, and Ministry of Economy, Trade and Industry)
Reconstruction of production system
Hum
anresources
development,etc.
◎ Reduction of risks of Japanese firms in Thailand in collecting sales proceeds in cooperation with private nonlife insurance companies (NEXI)� Risk reduction and prompt/accurate payment of insurance benefits using trade insurance concerning exports to, investment in, and financing for Thailand (NEXI)� Investment finance, etc. (JBIC)
- Provision of funds to Thai corporations, which are business partners of Japanese companies, fully utilizing the partnership with local financial institutions�Relief measures for filing an application for industrial property rights of Japan in cases where it is difficult to finalize the procedures before deadline (Japan Patent Office)
Alleviation of risks associated with exports, overseas investment, and financing
◎ Addition of overseas operation costs as an objective of funds (Japan Finance Corporation)- Provision of funds for disaster recovery to a local subsidiary through a Japanese parent company by adding disaster recovery expense as an objective of funds for relending
◎ Addition of safety-net loans as an objective of funds (Japan Finance Corporation)- Meeting the financial needs of Thai subsidiaries of Japanese companies for restoration from damage caused by the floods, by adding funds for relending (financing by way of
Japanese parent companies) as an objective of safety-net loans◎ Implementation of fund provision through emergency response loans (Shoko Chukin Bank/Development Bank of Japan (DBJ))
- Pursuant to the Japan Finance Corporation Act, this disaster incident has been designated as a crisis, thus allowing guaranteed loans and two-step loans to be provided through the designated financial institutions (Shoko Chukin Bank and DBJ)
� Investment finance, etc. (JBIC)- Provision of direct finance and two-step loan to Japanese companies (including Thai firms that are business partners of Japanese companies)
Financing of equipment funds/long-term operating funds
� Guarantee for overseas investment (Federation of Credit Guarantee Corporations)- Loan guarantee for investment funds and loans to overseas subsidiaries and funds borrowed to finance establishment/expansion of bases of Japanese small- and medium-sized
enterprises� Guarantee associated with special L/C (Federation of Credit Guarantee Corporations)
- Facilitation of letter of credit contract issued by a Japanese financial institution in relation to the borrowing from a local financial institution (loan guarantee for payment by the Japanese parent company)
� Insurance for funds borrowed for local subsidiaries (NEXI)� Investment finance (JBIC)
- Provision of guarantee for borrowings of Japanese companies from (Japanese/local) private financial institutions
Loan guarantee and insurance
◎ Implementation of supply of funds in Thai Baht secured on Japanese government bonds held by the Bank of Thailand and cooperation of the Bank of Japan (BOJ)Provision of short-term operating funds
Supportforsmooth
financing
Support measures of JapanIssue
The symbol ◆ indicates the use of existing system, the symbol ◎ indicates newly established measures against Thai floods after October 2011.
Source: Reproduced from the website of the Ministry of Economy, Trade and Industry.
At actual business scenes, adopted contingency measures are being implemented to improve the business environment and strengthen competitiveness. For example, it has been observed that competition among suppliers has been promoted due to increasing complications and diversification of procurement contractors, resulting in cost reduction. Furthermore, it is believed that various kinds of contingency measures will potentially generate improvement in the original business environment and strengthen competitiveness. Such measures include acceleration of the speed of adopting standardized products, review of the accreditation system/reliability assessment and clarification/visualization/expedition of the decision making process and supply chains (Table 2-3-5-17).
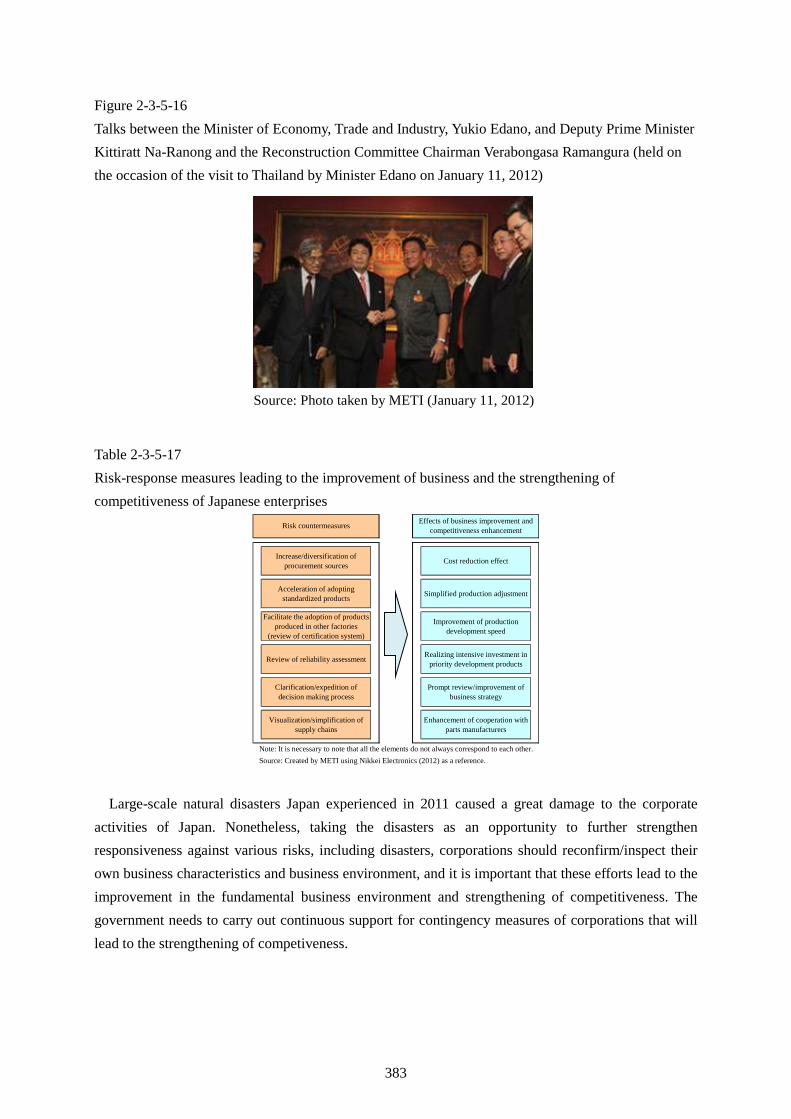
383
Figure 2-3-5-16 Talks between the Minister of Economy, Trade and Industry, Yukio Edano, and Deputy Prime Minister Kittiratt Na-Ranong and the Reconstruction Committee Chairman Verabongasa Ramangura (held on the occasion of the visit to Thailand by Minister Edano on January 11, 2012)
Source: Photo taken by METI (January 11, 2012)
Table 2-3-5-17 Risk-response measures leading to the improvement of business and the strengthening of competitiveness of Japanese enterprises
Increase/diversification ofprocurement sources Cost reduction effect
Acceleration of adoptingstandardized products Simplified production adjustment
Facilitate the adoption of productsproduced in other factories
(review of certification system)
Improvement of productiondevelopment speed
Review of reliability assessment Realizing intensive investment inpriority development products
Clarification/expedition ofdecision making process
Prompt review/improvement ofbusiness strategy
Visualization/simplification ofsupply chains
Enhancement of cooperation withparts manufacturers
Risk countermeasures Effects of business improvement andcompetitiveness enhancement
Note: It is necessary to note that all the elements do not always correspond to each other.Source: Created by METI using Nikkei Electronics (2012) as a reference.
Large-scale natural disasters Japan experienced in 2011 caused a great damage to the corporate activities of Japan. Nonetheless, taking the disasters as an opportunity to further strengthen responsiveness against various risks, including disasters, corporations should reconfirm/inspect their own business characteristics and business environment, and it is important that these efforts lead to the improvement in the fundamental business environment and strengthening of competitiveness. The government needs to carry out continuous support for contingency measures of corporations that will lead to the strengthening of competiveness.

384