Embed Size (px)
Citation preview
1
Rail Project Design with InRailModule 3-D
C. Tyler Dick, P.E.University of Illinois at Urbana-Champaign
Copyright C. Tyler Dick, 2012 – All Rights Reserved
2
Track Design
Railway geometry is designed with a specialized application running within a CAD program
InRail or Geopak most commonBoth run inside MicroStationCivil3D within AutoCAD is also used
Copyright C. Tyler Dick, 2012 – All Rights Reserved
3
CAD Platform vs. Rail Software
MicroStation CAD platformGenerates, manipulates and prints graphicsDisplays aerial images, backgroundsLayer drawings into design plans
InRail or Geopak Design SoftwareIntelligent “brains & math” behind graphicsTies track alignment and profile geometry to graphicsStores elevation and terrain model data for existing ground and proposed subgrade surfaces
Copyright C. Tyler Dick, 2012 – All Rights Reserved
4
MicroStation vs. AutoCAD
Early days of computing, method of math processing leads to efficiency in certain areas
MicroStation for large spatial civil projects
AutoCAD for detailed mechanical design
Many State DOTs adopted MicroStation
Railways and consultants did the same
Some structures work with AutoCAD, used for rail design in states with “AutoCAD DOTs”
MicroStation and AutoCAD interfaces converging over time… MS v8i offers complete cross-functionality
Copyright C. Tyler Dick, 2012 – All Rights Reserved
5
InRail vs. InRoads
Bentley InRail is a specialized version of the InRoads highway design software95% of the commands and functions are the sameSame workflowInRail offers additional capability for turnouts, superlevation, rail design criteria
Copyright C. Tyler Dick, 2012 – All Rights Reserved
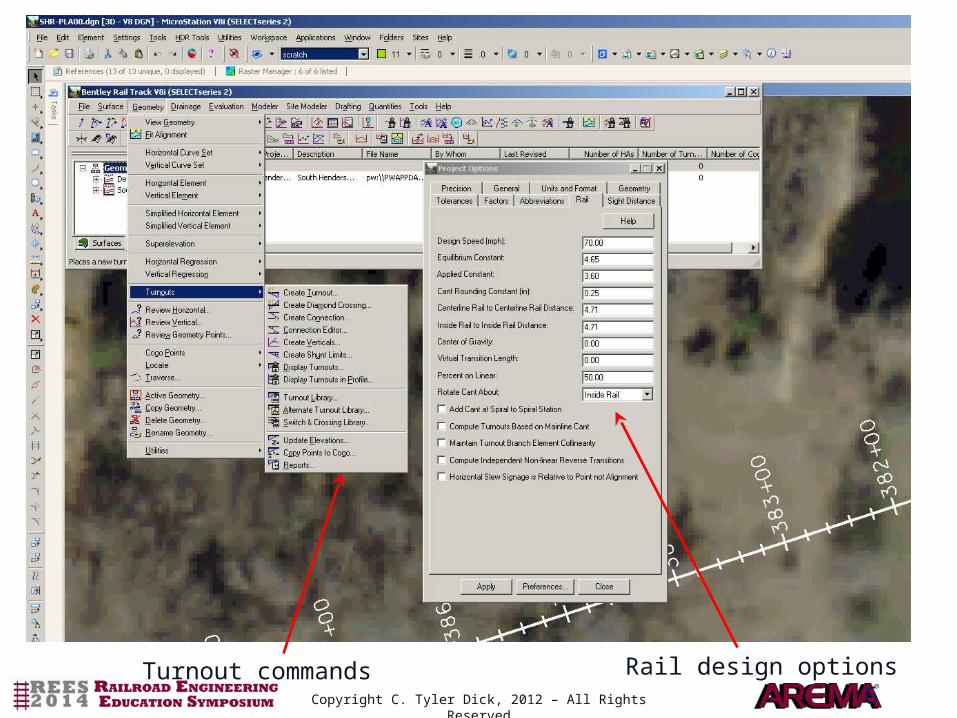
66Turnout commands Rail design options
Copyright C. Tyler Dick, 2012 – All Rights Reserved
7
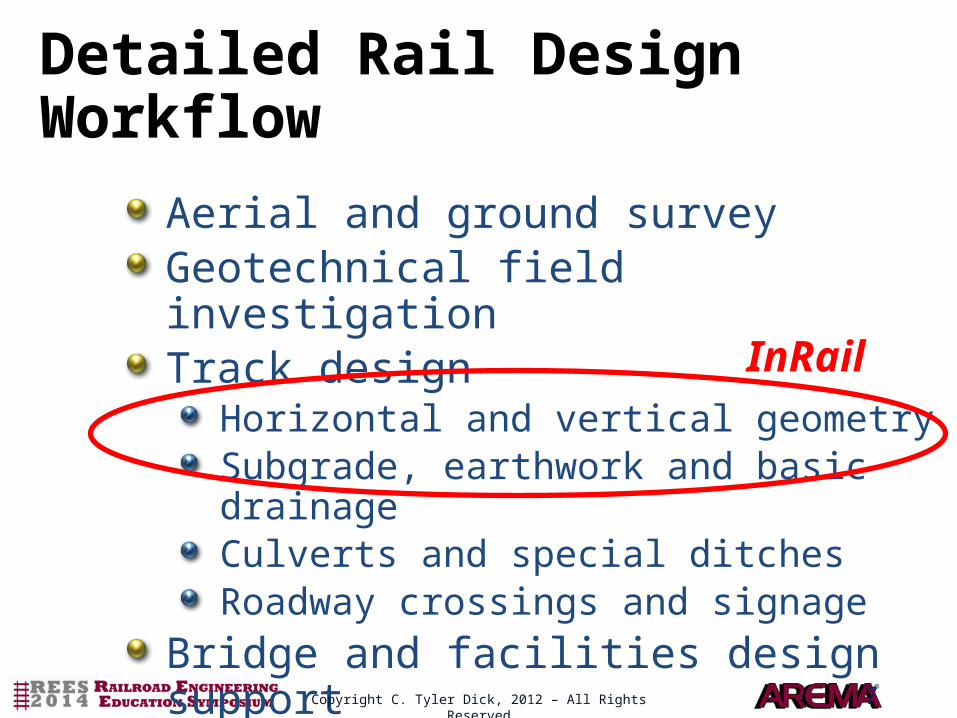
Detailed Rail Design Workflow
Aerial and ground surveyGeotechnical field investigationTrack design
Horizontal and vertical geometrySubgrade, earthwork and basic drainageCulverts and special ditchesRoadway crossings and signage
Bridge and facilities design support
InRail
Copyright C. Tyler Dick, 2012 – All Rights Reserved
8
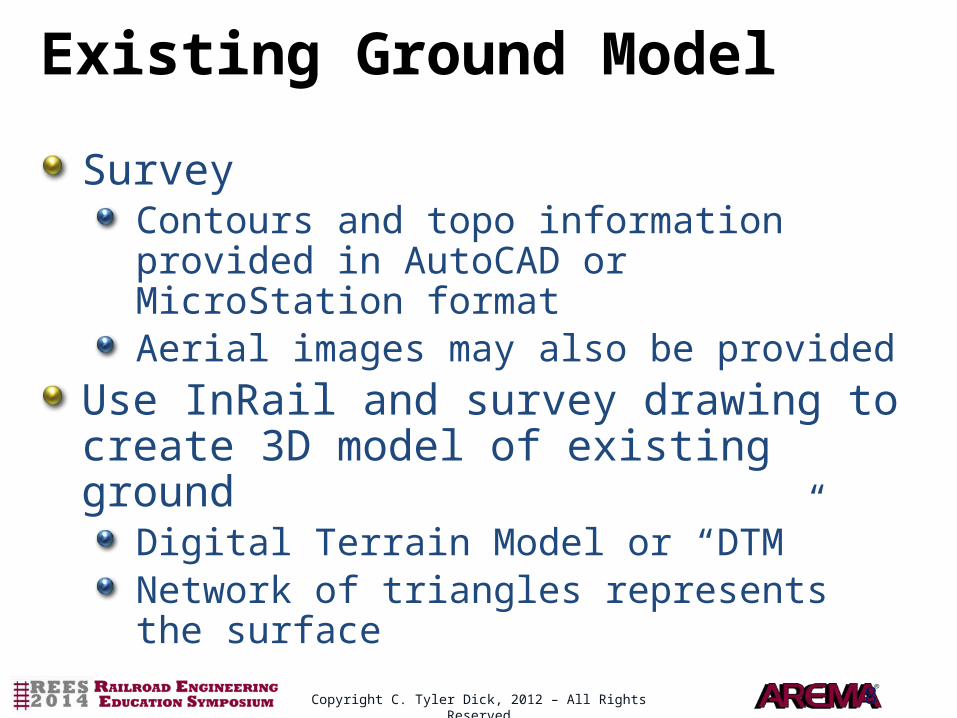
Existing Ground Model
SurveyContours and topo information provided in AutoCAD or MicroStation formatAerial images may also be provided
Use InRail and survey drawing to create 3D model of existing ground
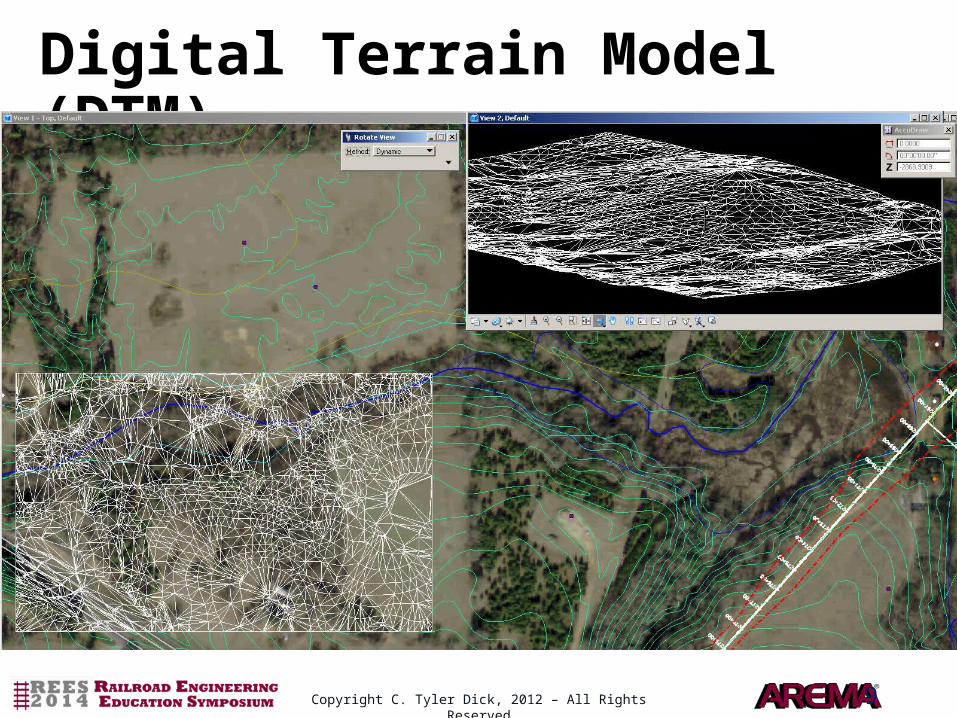
Digital Terrain Model or “DTM”Network of triangles represents the surface
Copyright C. Tyler Dick, 2012 – All Rights Reserved
9
Digital Terrain Model (DTM)
Copyright C. Tyler Dick, 2012 – All Rights Reserved
10
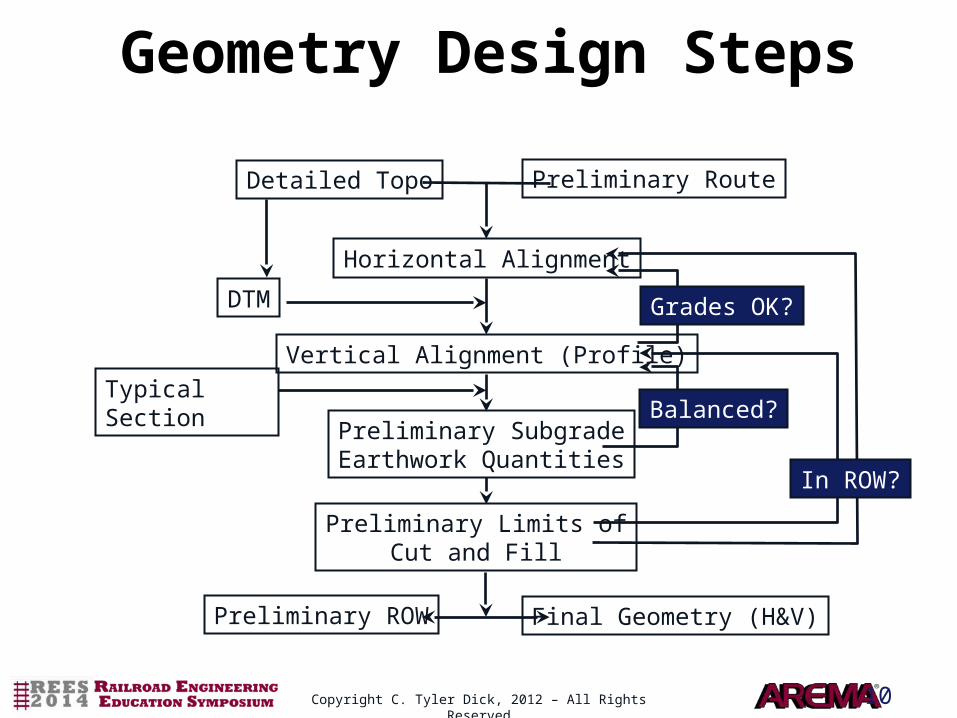
Geometry Design Steps
Preliminary RouteDetailed Topo
Horizontal Alignment
Vertical Alignment (Profile)
DTM
Preliminary SubgradeEarthwork Quantities
Typical Section
Preliminary Limits ofCut and Fill
Preliminary ROW Final Geometry (H&V)
In ROW?
Balanced?
Grades OK?
Copyright C. Tyler Dick, 2012 – All Rights Reserved
11
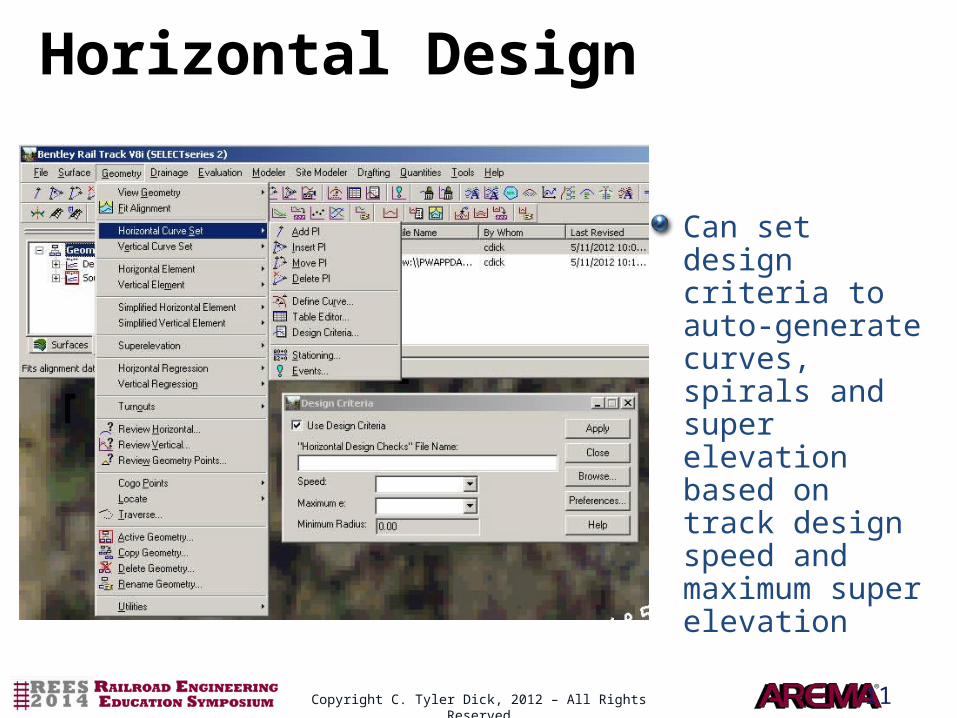
Horizontal Design
Can set design criteria to auto-generate curves, spirals and super elevation based on track design speed and maximum super elevation
Copyright C. Tyler Dick, 2012 – All Rights Reserved
12
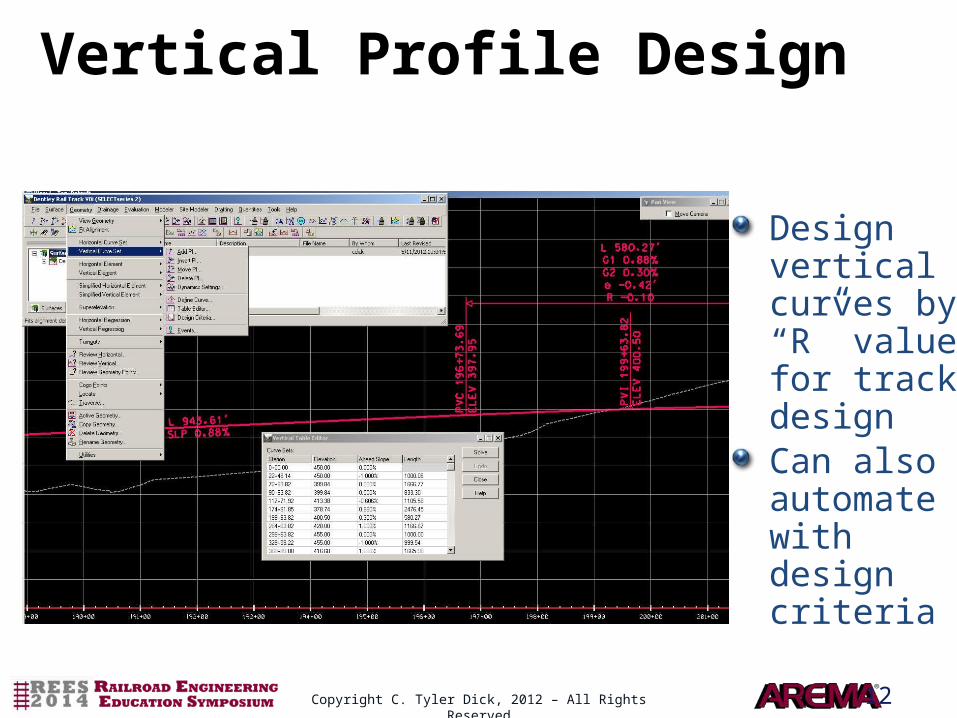
Vertical Profile Design
Design vertical curves by “R” value for track designCan also automate with design criteria
Copyright C. Tyler Dick, 2012 – All Rights Reserved
13
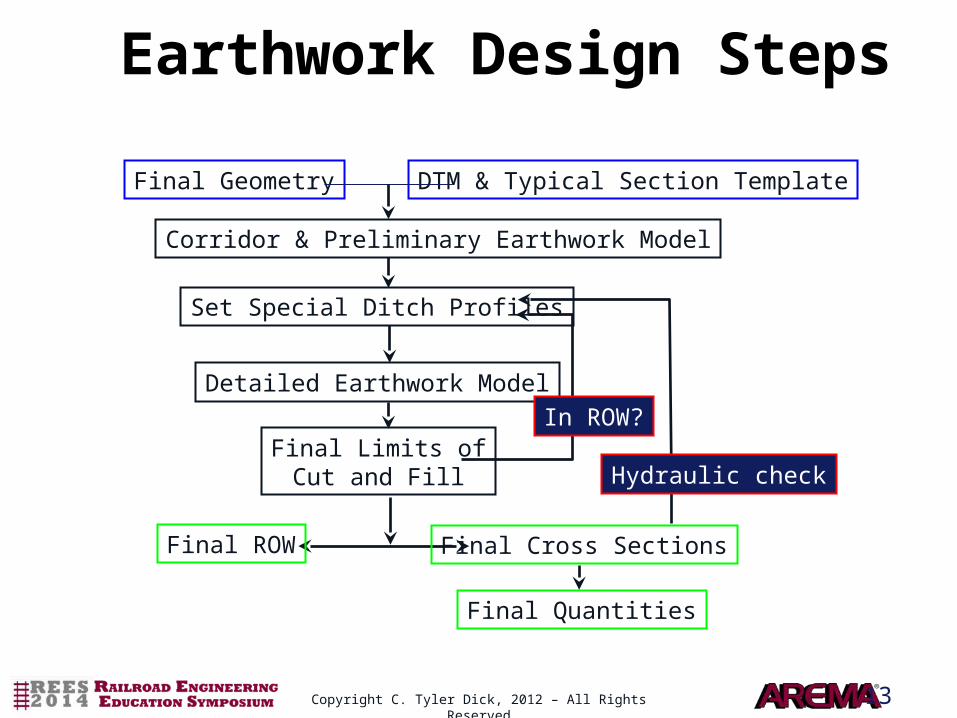
Earthwork Design Steps
DTM & Typical Section TemplateFinal Geometry
Corridor & Preliminary Earthwork Model
Set Special Ditch Profiles
Detailed Earthwork Model
Final Limits ofCut and Fill
Final ROW Final Cross Sections
In ROW?
Hydraulic check
Final Quantities
Copyright C. Tyler Dick, 2012 – All Rights Reserved
14
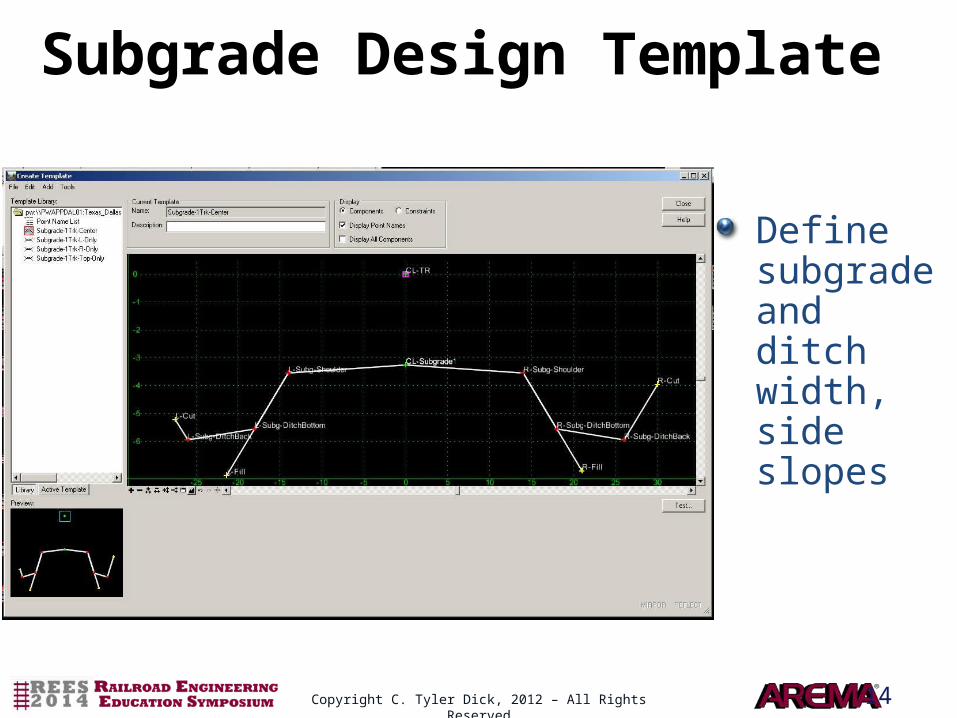
Subgrade Design Template
Define subgrade and ditch width, side slopes
Copyright C. Tyler Dick, 2012 – All Rights Reserved
15
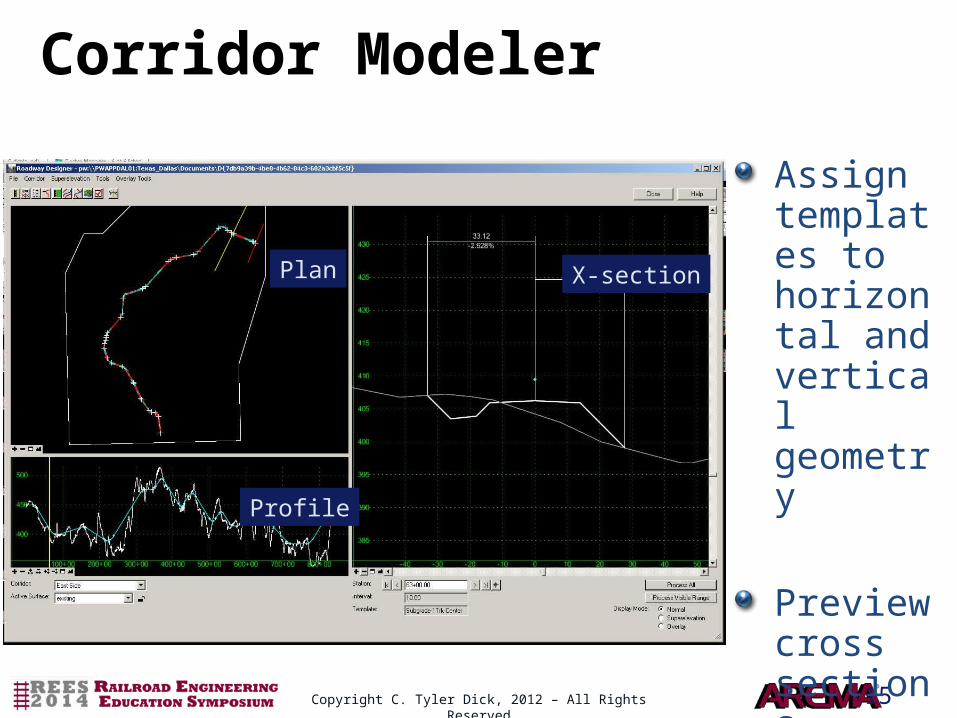
Corridor Modeler
Assign templates to horizontal and vertical geometry
Preview cross sections
Plan
Profile
X-section
Copyright C. Tyler Dick, 2012 – All Rights Reserved
16
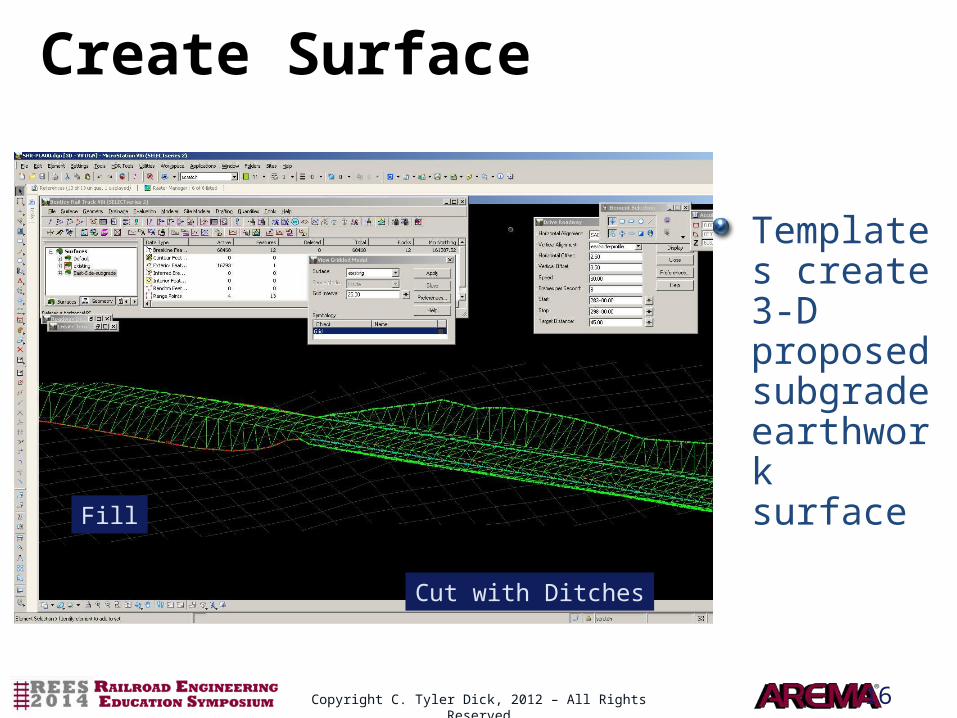
Create Surface
Templates create 3-D proposed subgrade earthwork surface
Cut with Ditches
Fill
Copyright C. Tyler Dick, 2012 – All Rights Reserved
17
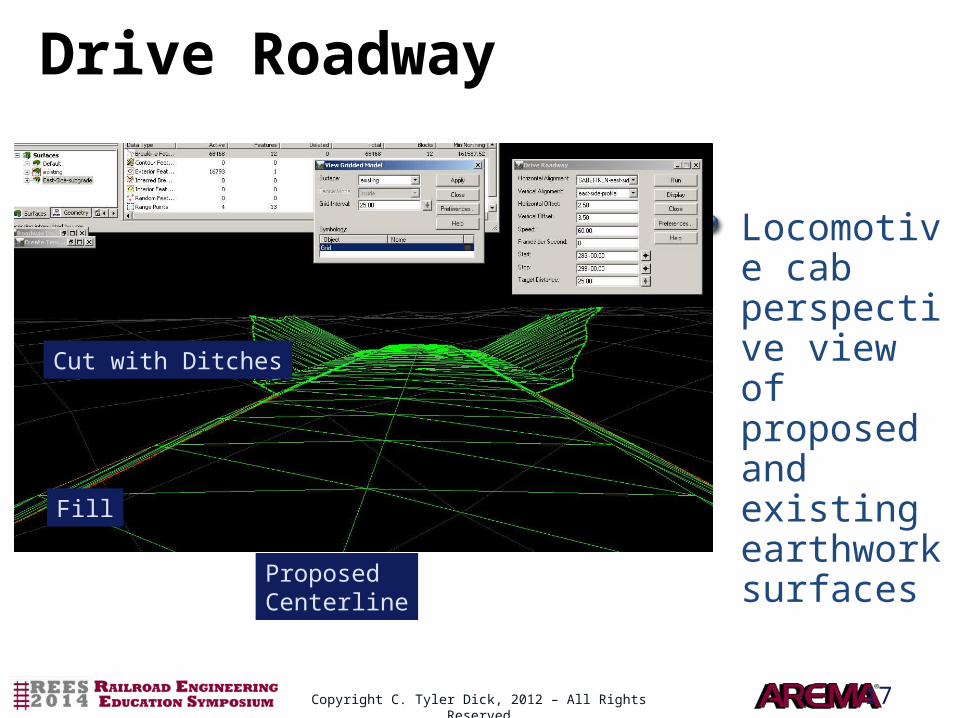
Locomotive cab perspective view of proposed and existing earthwork surfaces
Drive Roadway
Cut with Ditches
Fill
ProposedCenterline
Copyright C. Tyler Dick, 2012 – All Rights Reserved
18
Culvert Design Steps
Detailed earthwork model and DTM combined into proposed terrainDrainage area analysis determines flows and culvert locationsCulverts sized using hydraulic analysis programs outside CAD
Copyright C. Tyler Dick, 2012 – All Rights Reserved
19
Remaining Design Steps
Roadway crossingsLayout of panels, protection devicesHorizontal and vertical reconstructionCulverts to carry ditches under roadways
Locate signage, derails, bumping postsCoordinate with bridge and/or facilities designers
Railway geometry and earthwork sections
Quantities & Cost Estimates
Copyright C. Tyler Dick, 2012 – All Rights Reserved
20
Planset Creation
Project LayoutGeometry and Quantity SummariesTypical SectionsPlan and Profile
Track Culvert Roadway
Cross SectionsStandard DetailsSign LayoutsGrade Crossing LayoutsDrainage Area MapBridge/Facility Drawings
Standard CAD tools used to create sheets from rail design program output
Copyright C. Tyler Dick, 2012 – All Rights Reserved
21
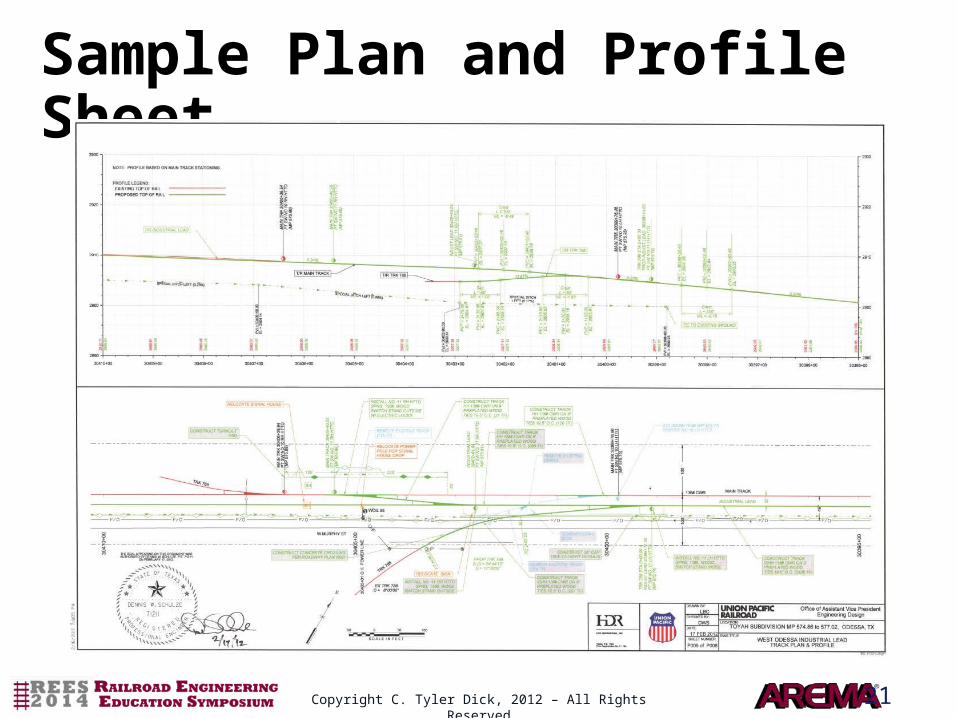
Sample Plan and Profile Sheet
Copyright C. Tyler Dick, 2012 – All Rights Reserved
22
Availability
MicroStation v8i and InRail (Bentley Rail Track v8i) are available on a student/faculty academic license from BentleyIndividual and institution licenses availablewww.bentley.com
Training & learningAcademic program
EducatorsStudents
Copyright C. Tyler Dick, 2012 – All Rights Reserved
23
Copyright Restrictions and Disclaimer
Presentation AuthorTyler DickProfessional Associate, Engineer-RailHDR Engineering600 West 6th Street, Suite 100 | Fort Worth, TX 76102 [email protected] | hdrinc.com…….
It is the author’s intention that the information contained in this file be used for non-commercial, educational purposes with as few restrictions as possible. However, there are some necessary constraints on its use as described below.
Copyright Restrictions and Disclaimer:The materials used in this file have come from a variety of sources and have been assembled here for personal use by the author for educational purposes. The copyright for some of the images and graphics used in this presentation may be held by others. Users may not change or delete any author attribution, copyright notice, trademark or other legend. Users of this material may not further reproduce this material without permission from the copyright owner. It is the responsibility of the user to obtain such permissions as necessary. You may not, without prior consent from the copyright owner, modify, copy, publish, display, transmit, adapt or in any way exploit the content of this file. Additional restrictions may apply to specific images or graphics as indicated herein.
The contents of this file are provided on an "as is" basis and without warranties of any kind, either express or implied. The author makes no warranties or representations, including any warranties of title, noninfringement of copyright or other rights, nor does the author make any warranties or representation regarding the correctness, accuracy or reliability of the content or other material in the file.
Copyright C. Tyler Dick, 2012 – All Rights Reserved
24
Rail Traffic Controller (RTC)
Line-of-Road Simulation Tool
C. Tyler DickUniversity of Illinois
Copyright Samuel L. Sogin, 2012 – All Rights Reserved
25
What is Rail Traffic Controller (RTC)?
Network capacity analysis model
“RTC is a powerful software package that dispatches trains using the same elements as a human dispatcher.”
Copyright Samuel L. Sogin, 2012 – All Rights Reserved
26
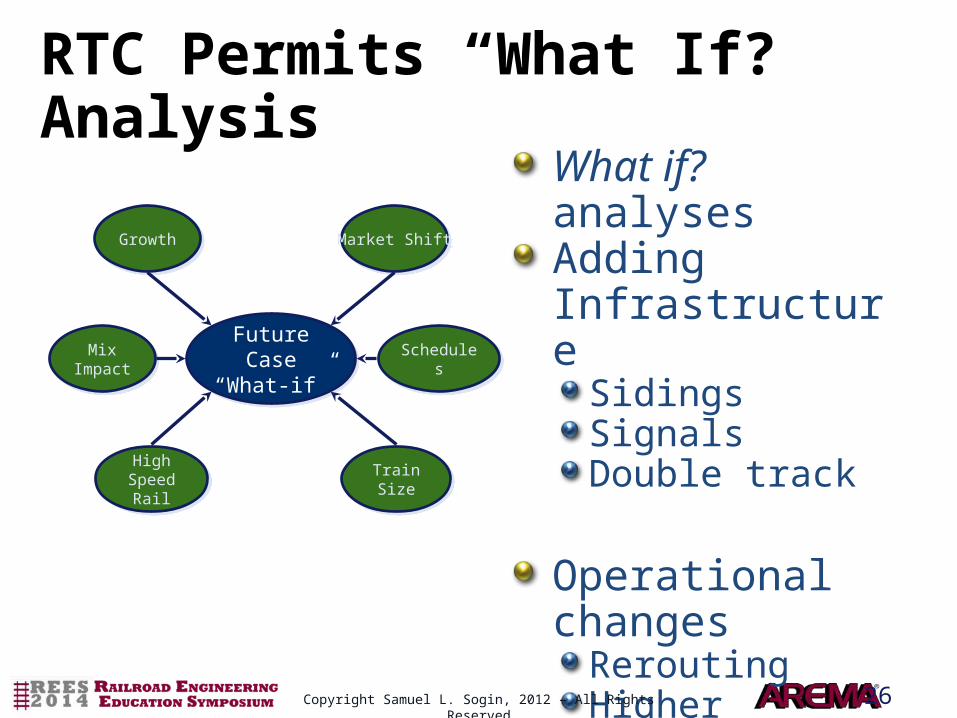
RTC Permits “What If?” Analysis
What if? analysesAdding Infrastructure
SidingsSignalsDouble track
Operational changes
ReroutingHigher volumesShorter dwells
Future Case “What-if”
Future Case “What-if”
SchedulesSchedulesMix Impact
Mix Impact
GrowthGrowth Market ShiftMarket Shift
High Speed Rail
High Speed Rail Train SizeTrain Size
Copyright Samuel L. Sogin, 2012 – All Rights Reserved
27
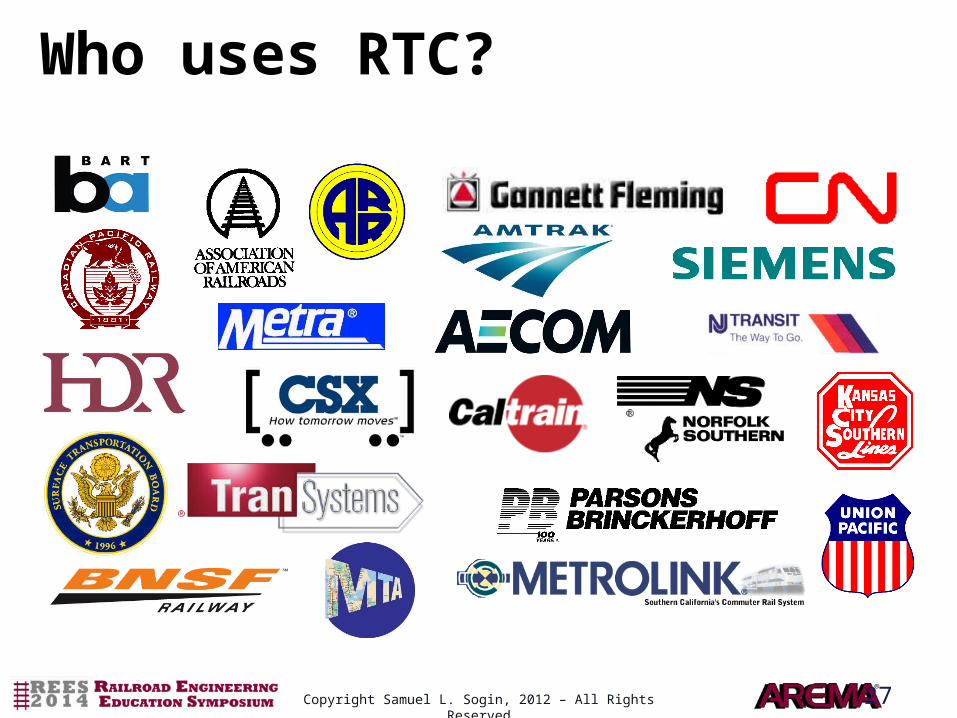
Who uses RTC?
Copyright Samuel L. Sogin, 2012 – All Rights Reserved
28
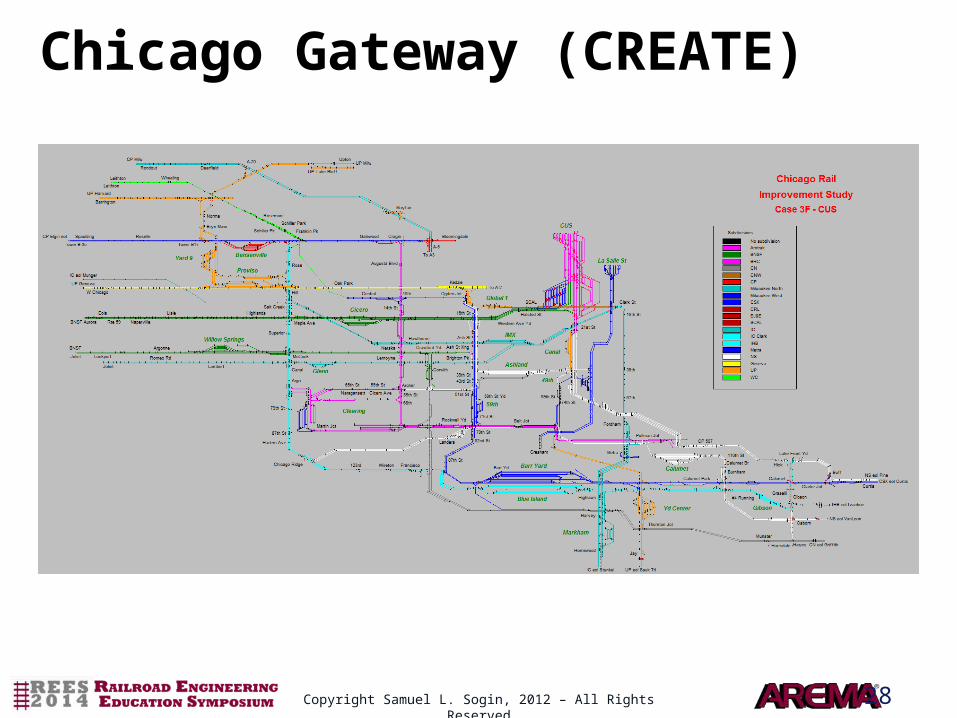
Chicago Gateway (CREATE)
Copyright Samuel L. Sogin, 2012 – All Rights Reserved
29
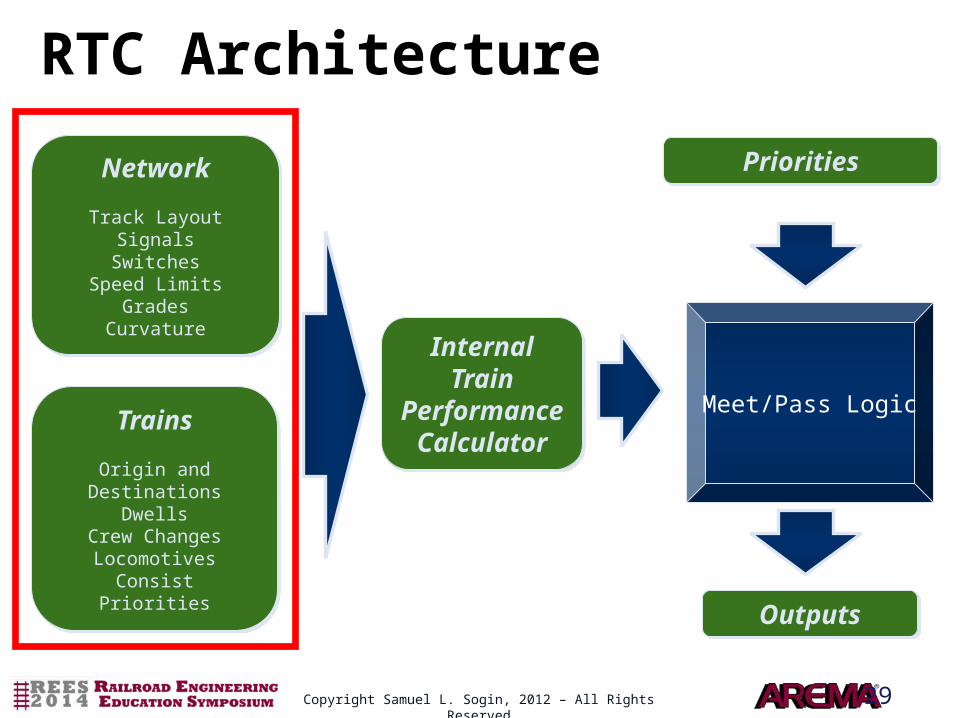
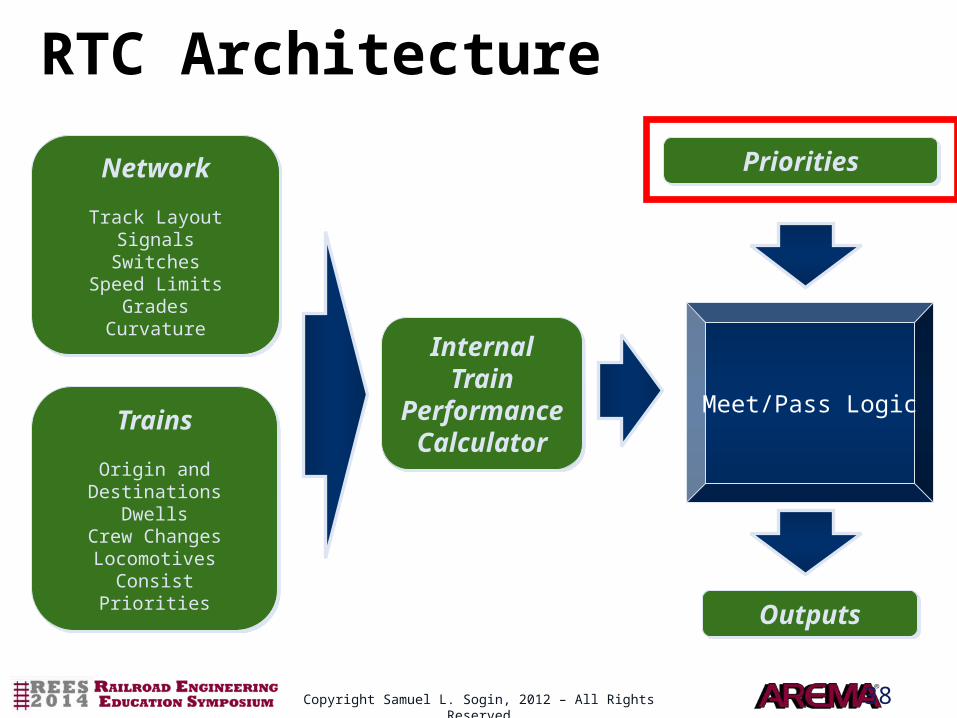
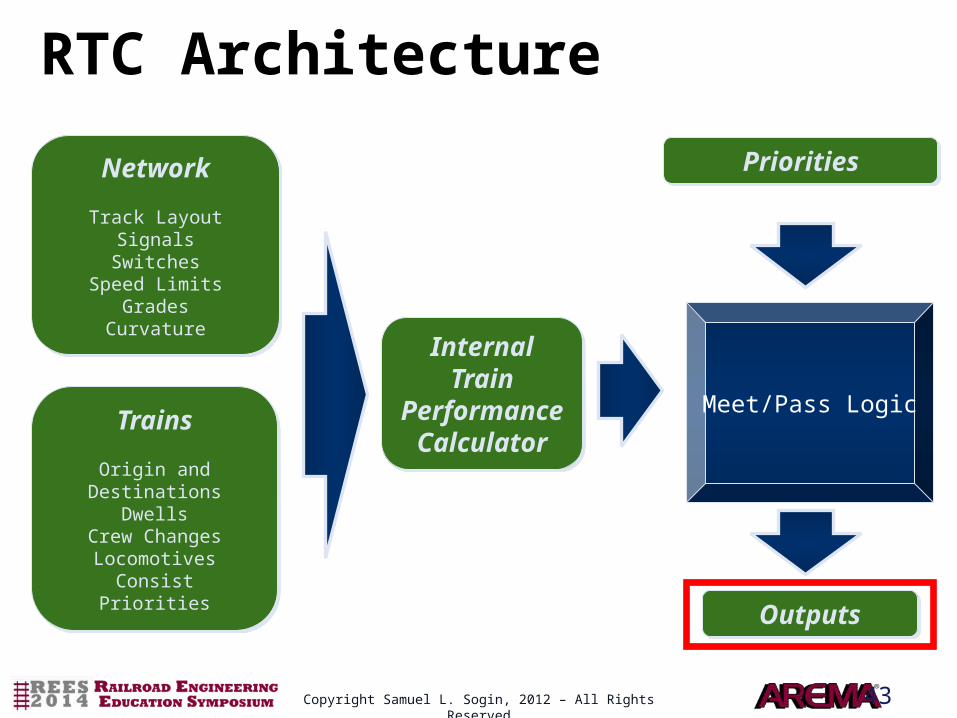
RTC Architecture
Network
Track LayoutSignals
SwitchesSpeed Limits
GradesCurvature
Network
Track LayoutSignals
SwitchesSpeed Limits
GradesCurvature
Trains
Origin and DestinationsDwells
Crew ChangesLocomotives
ConsistPriorities
Trains
Origin and DestinationsDwells
Crew ChangesLocomotives
ConsistPriorities
Meet/Pass Logic
Internal Train Performance
Calculator
Internal Train Performance
Calculator
PrioritiesPriorities
OutputsOutputs
Copyright Samuel L. Sogin, 2012 – All Rights Reserved
30
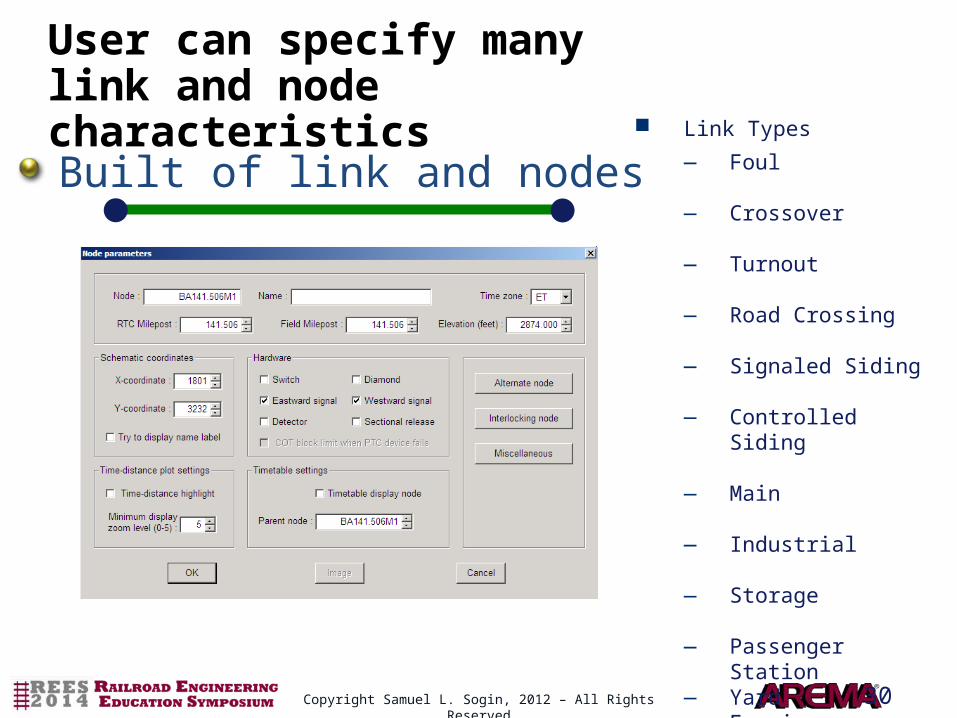
User can specify many link and node characteristics
Built of link and nodes Link Types
— Foul — Crossover — Turnout — Road Crossing — Signaled Siding — Controlled Siding
— Main — Industrial — Storage — Passenger Station — Yard — Foreign
Nodes Identify
— Signal— Switch— Diamond— Change in grade— Change in curvature— Change in speed
Copyright Samuel L. Sogin, 2012 – All Rights Reserved
31
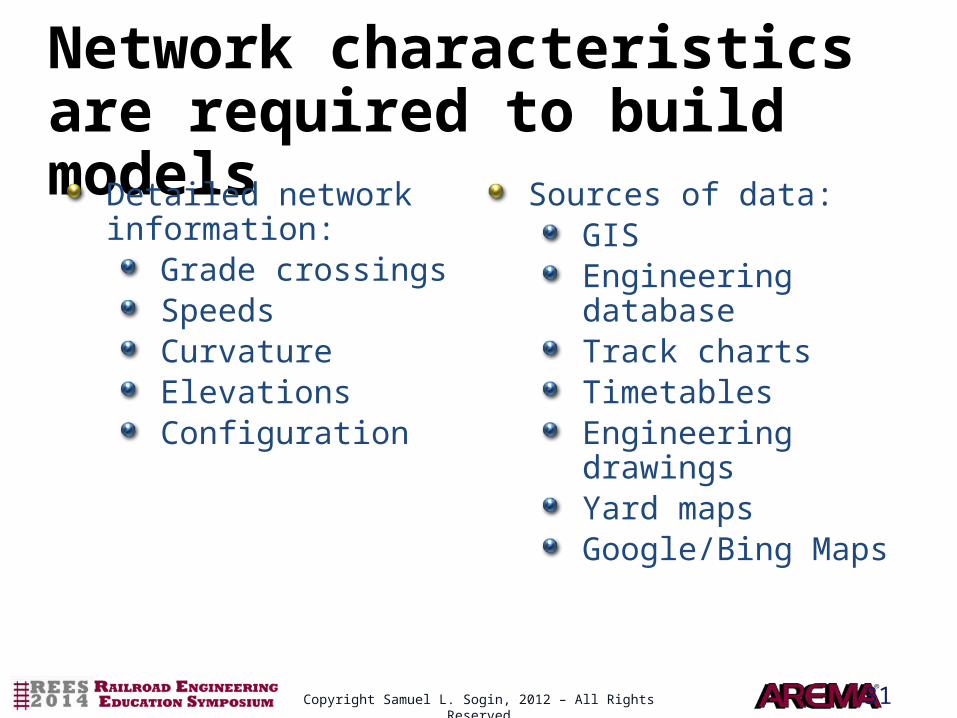
Network characteristics are required to build models
Detailed network information:
Grade crossingsSpeedsCurvatureElevationsConfiguration
Sources of data:GISEngineering databaseTrack chartsTimetablesEngineering drawingsYard mapsGoogle/Bing Maps
Copyright Samuel L. Sogin, 2012 – All Rights Reserved
32
0.930Curvature
-0.052Grade
55/50Speed
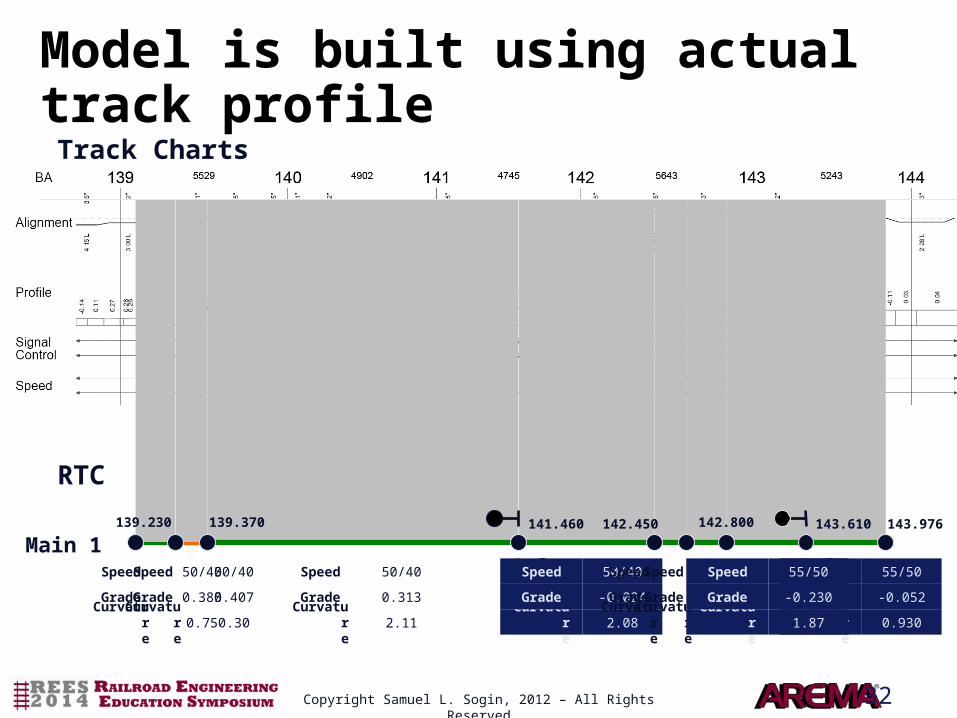
Model is built using actual track profile
Track Charts
RTC
139.230 141.460139.370
2.11Curvature
0.313Grade
50/40Speed
142.450 143.610 143.976
0.75Curvature
0.385Grade
50/40Speed
0.30Curvature
0.407Grade
50/40Speed
Main 1142.800
2.08Curvature
-0.024Grade
50/40Speed
2.60Curvature
0.000Grade
50/40Speed
2.75Curvature
0.000Grade
55/50Speed
1.87Curvature
-0.230Grade
55/50Speed
Copyright Samuel L. Sogin, 2012 – All Rights Reserved
33
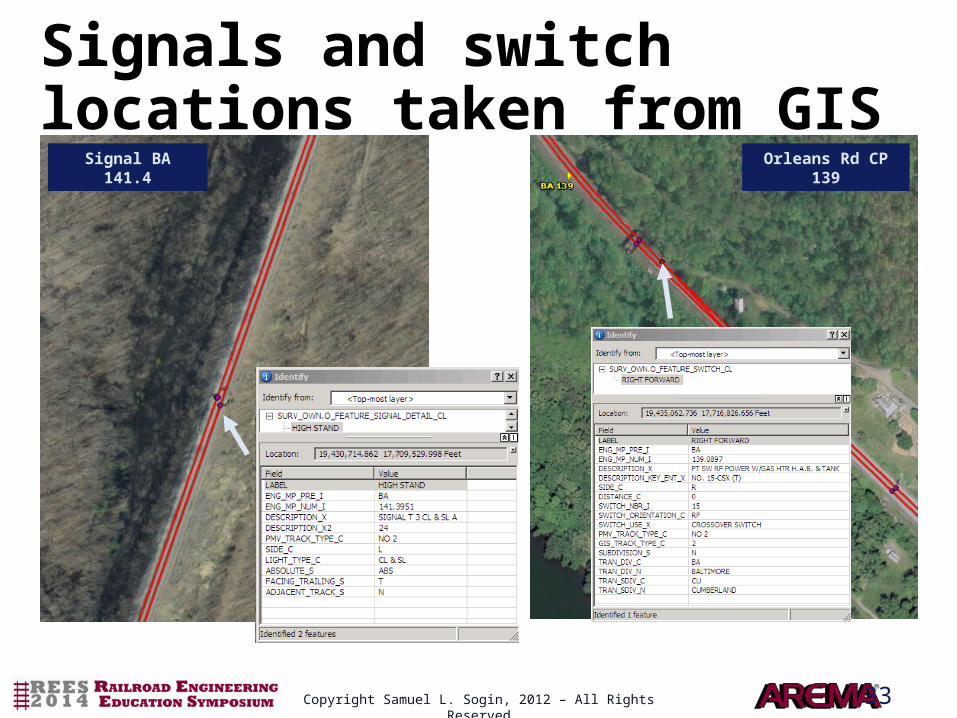
Signals and switch locations taken from GIS
Signal BA 141.4 Orleans Rd CP 139
Copyright Samuel L. Sogin, 2012 – All Rights Reserved
34
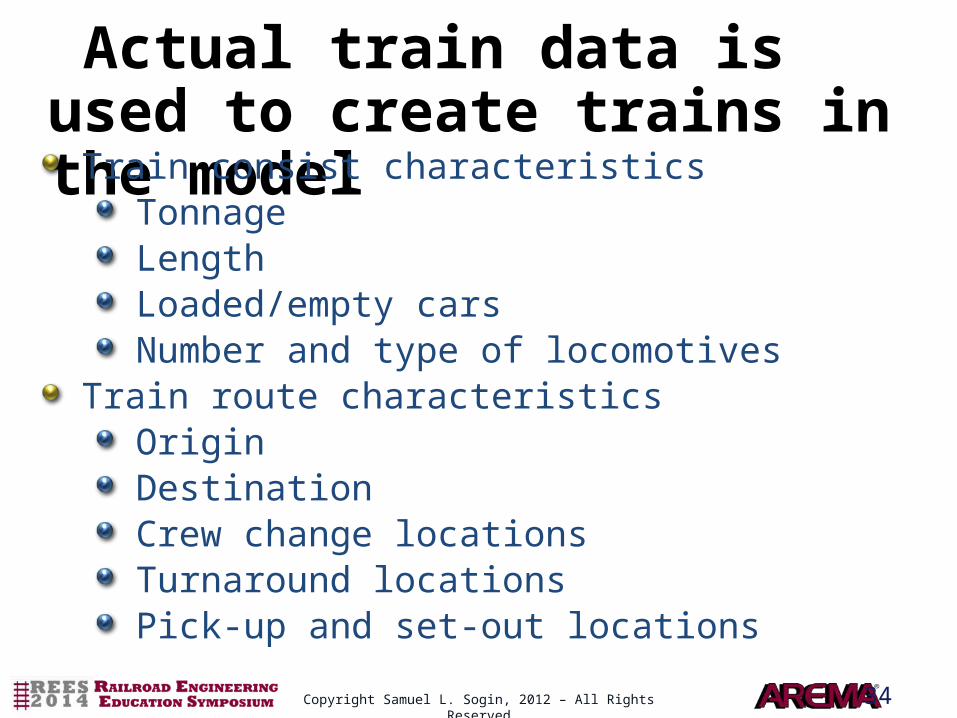
Actual train data is used to create trains in the model
Train consist characteristicsTonnageLengthLoaded/empty carsNumber and type of locomotives
Train route characteristicsOriginDestinationCrew change locationsTurnaround locationsPick-up and set-out locations
Copyright Samuel L. Sogin, 2012 – All Rights Reserved
35
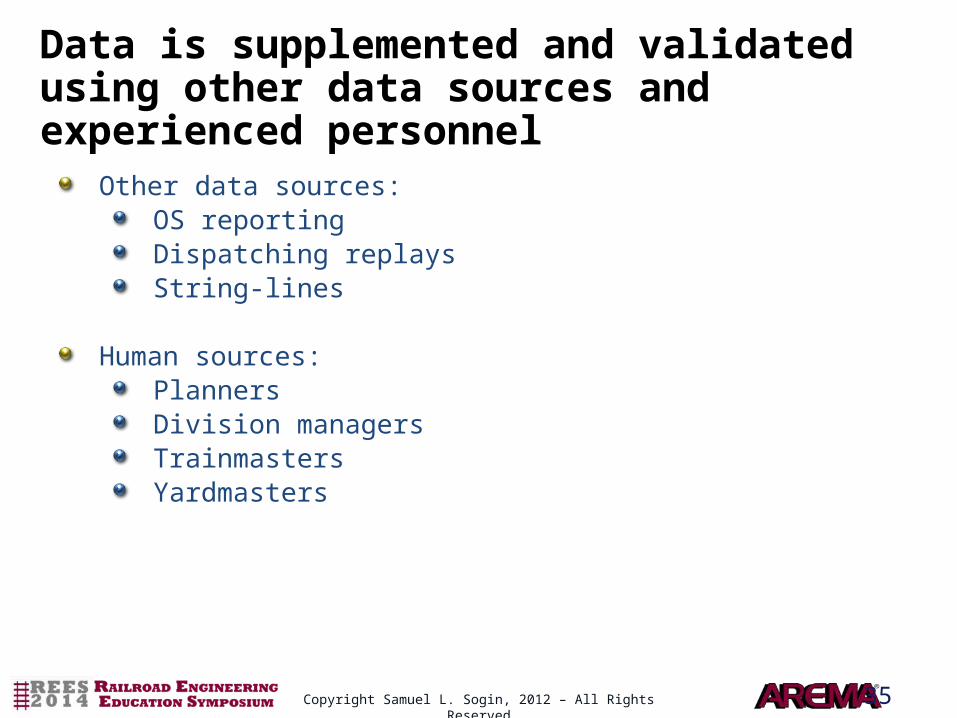
Data is supplemented and validated using other data sources and experienced personnel
Other data sources:OS reportingDispatching replaysString-lines
Human sources:PlannersDivision managersTrainmastersYardmasters
Copyright Samuel L. Sogin, 2012 – All Rights Reserved
36
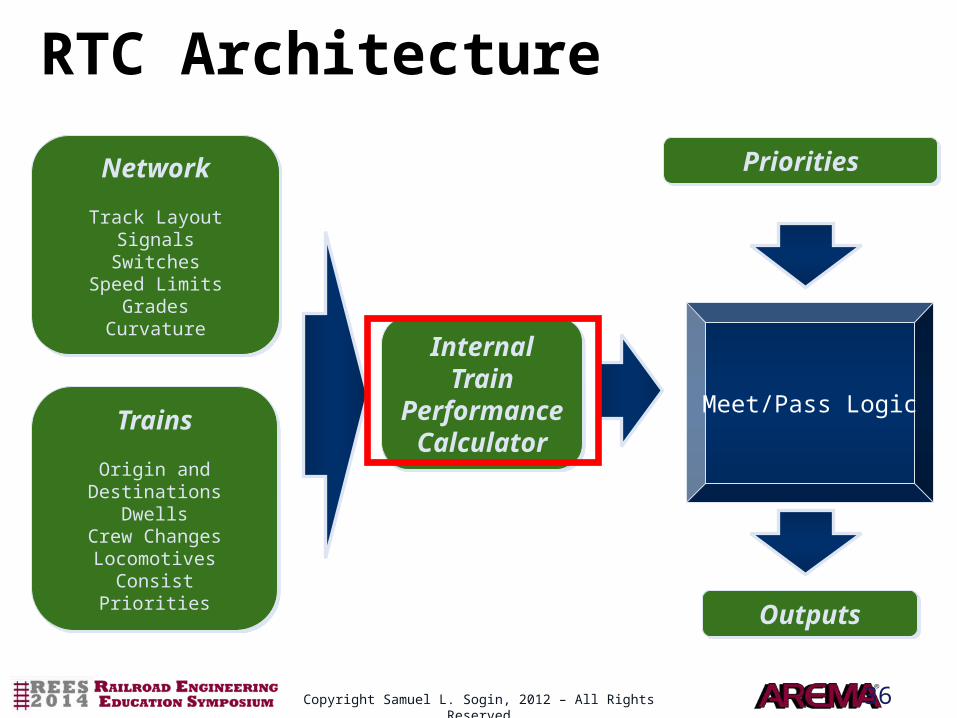
RTC Architecture
Network
Track LayoutSignals
SwitchesSpeed Limits
GradesCurvature
Network
Track LayoutSignals
SwitchesSpeed Limits
GradesCurvature
Trains
Origin and DestinationsDwells
Crew ChangesLocomotives
ConsistPriorities
Trains
Origin and DestinationsDwells
Crew ChangesLocomotives
ConsistPriorities
Meet/Pass Logic
Internal Train Performance
Calculator
Internal Train Performance
Calculator
PrioritiesPriorities
OutputsOutputs
Copyright Samuel L. Sogin, 2012 – All Rights Reserved
37
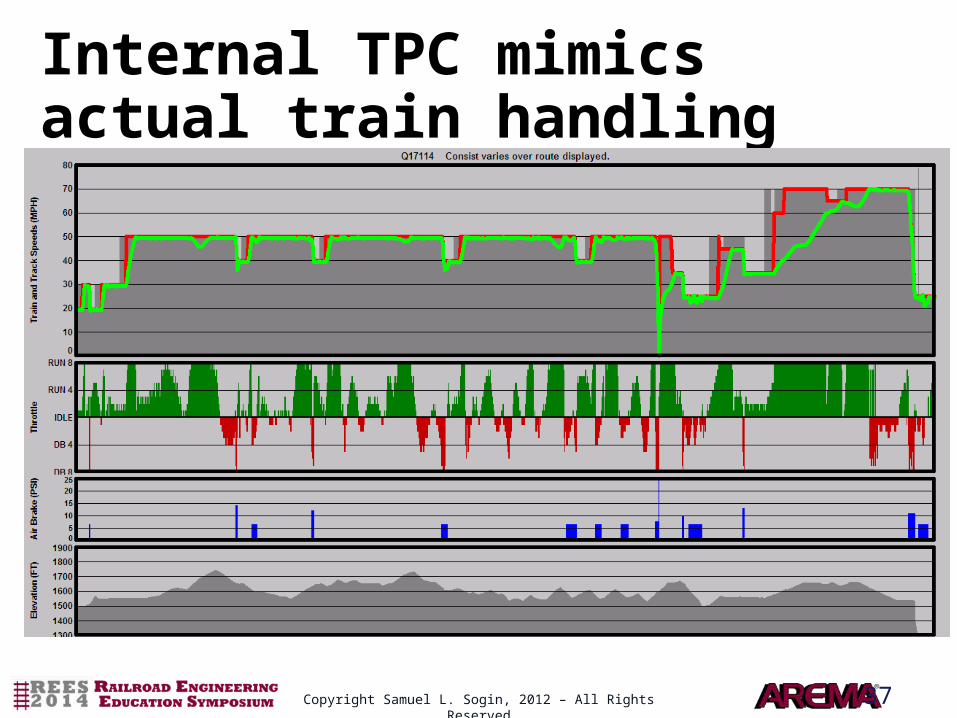
Internal TPC mimics actual train handling
Copyright Samuel L. Sogin, 2012 – All Rights Reserved
38
RTC Architecture
Network
Track LayoutSignals
SwitchesSpeed Limits
GradesCurvature
Network
Track LayoutSignals
SwitchesSpeed Limits
GradesCurvature
Trains
Origin and DestinationsDwells
Crew ChangesLocomotives
ConsistPriorities
Trains
Origin and DestinationsDwells
Crew ChangesLocomotives
ConsistPriorities
Meet/Pass Logic
Internal Train Performance
Calculator
Internal Train Performance
Calculator
PrioritiesPriorities
OutputsOutputs
Copyright Samuel L. Sogin, 2012 – All Rights Reserved
39
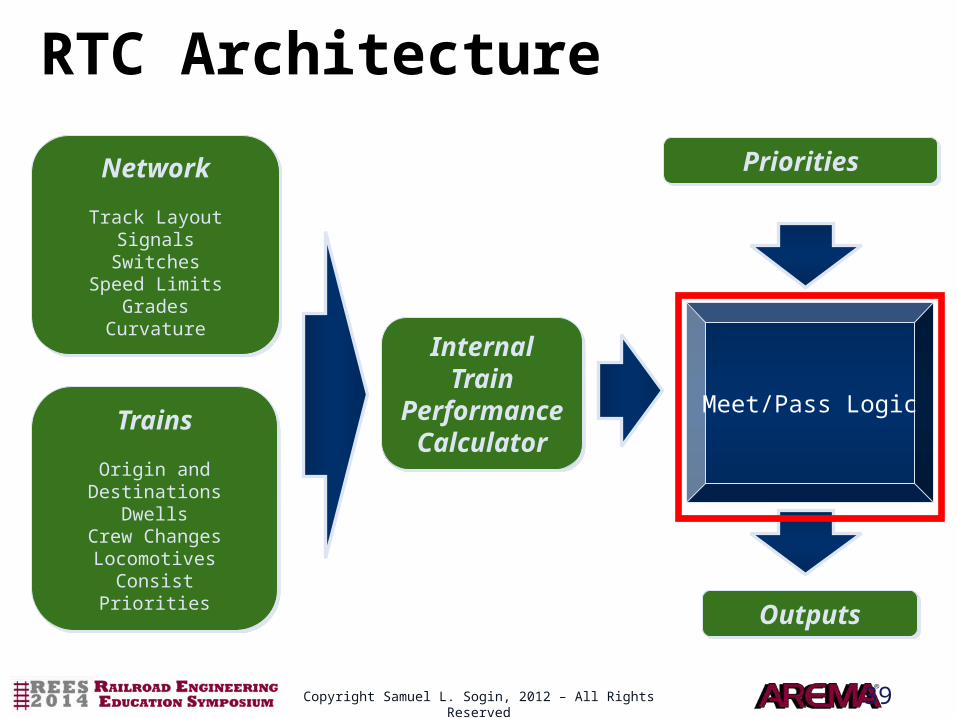
RTC Architecture
Network
Track LayoutSignals
SwitchesSpeed Limits
GradesCurvature
Network
Track LayoutSignals
SwitchesSpeed Limits
GradesCurvature
Trains
Origin and DestinationsDwells
Crew ChangesLocomotives
ConsistPriorities
Trains
Origin and DestinationsDwells
Crew ChangesLocomotives
ConsistPriorities
Meet/Pass Logic
Internal Train Performance
Calculator
Internal Train Performance
Calculator
PrioritiesPriorities
OutputsOutputs
Copyright Samuel L. Sogin, 2012 – All Rights Reserved
40
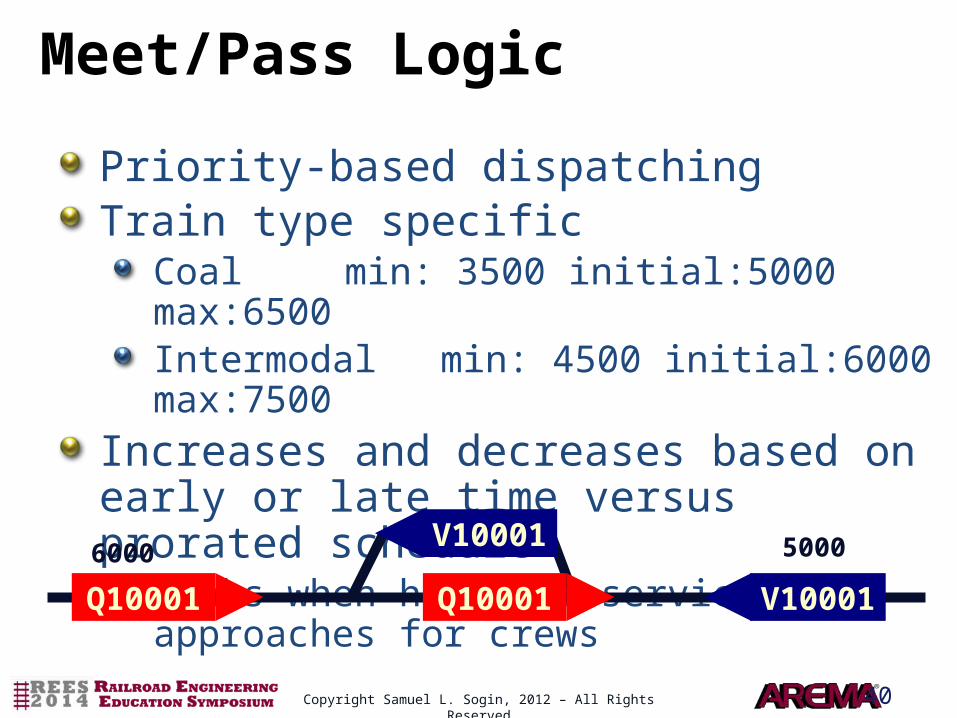
Meet/Pass Logic
Priority-based dispatchingTrain type specific
Coal min: 3500 initial:5000 max:6500Intermodal min: 4500 initial:6000 max:7500
Increases and decreases based on early or late time versus prorated schedule
Peaks when hours of service approaches for crews
Q10001 V10001
50006000
Q10001
V10001
Copyright Samuel L. Sogin, 2012 – All Rights Reserved
41
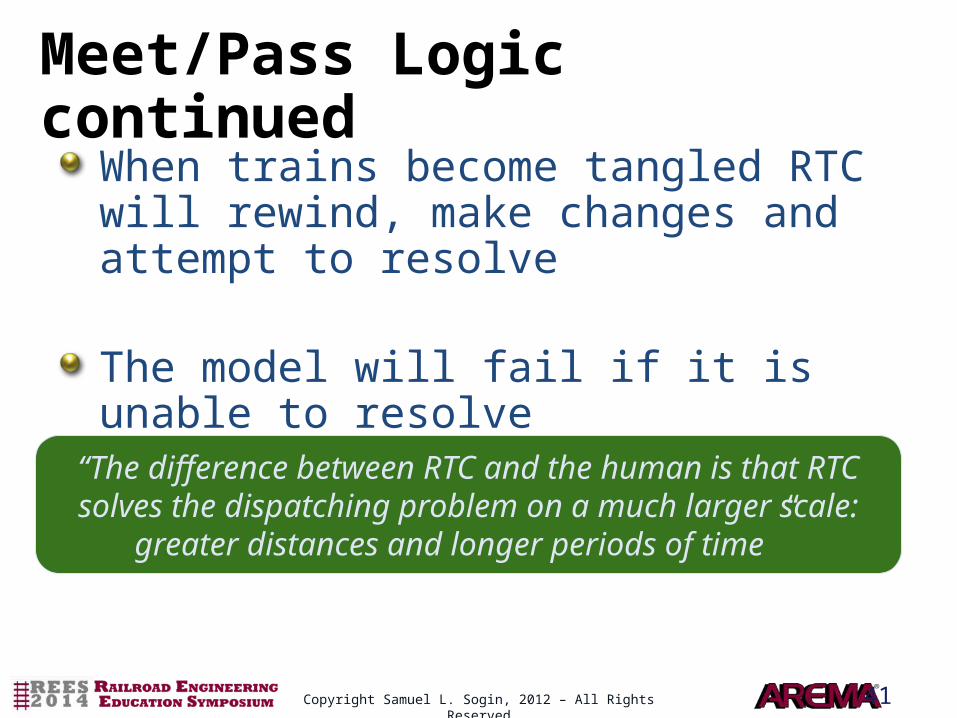
Meet/Pass Logic continued
When trains become tangled RTC will rewind, make changes and attempt to resolve
The model will fail if it is unable to resolve complicated conflicts
“The difference between RTC and the human is that RTC solves the dispatching problem on a much larger scale:
greater distances and longer periods of time”
Copyright Samuel L. Sogin, 2012 – All Rights Reserved
42
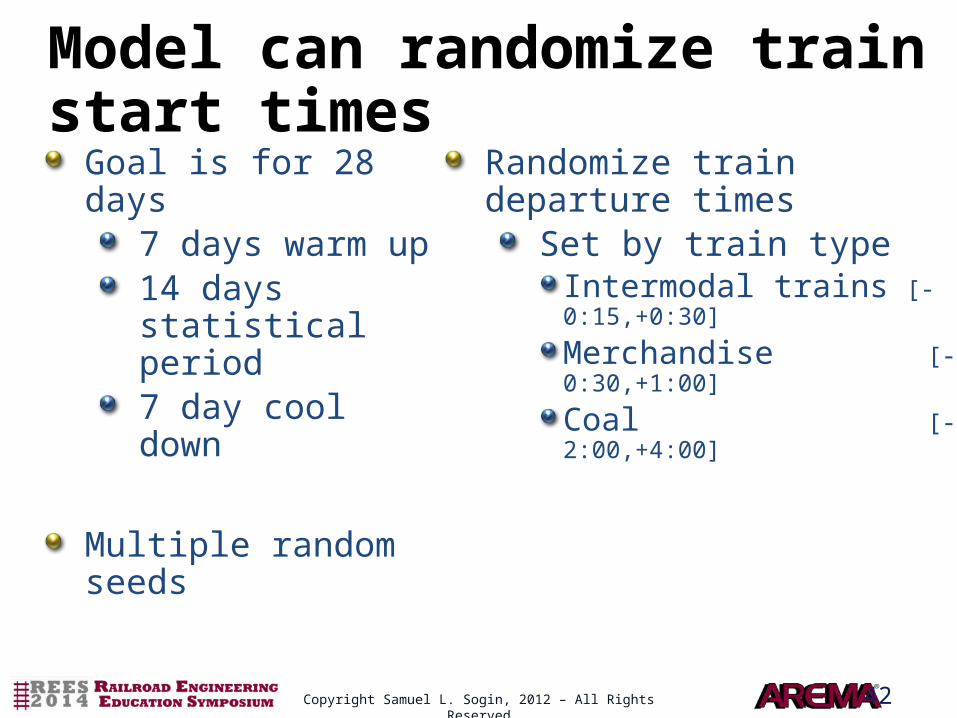
Model can randomize train start times
Goal is for 28 days7 days warm up 14 days statistical period7 day cool down
Multiple random seeds
Randomize train departure times
Set by train typeIntermodal trains [-0:15,+0:30]
Merchandise [-0:30,+1:00]
Coal [-2:00,+4:00]
Copyright Samuel L. Sogin, 2012 – All Rights Reserved
43
RTC Architecture
Network
Track LayoutSignals
SwitchesSpeed Limits
GradesCurvature
Network
Track LayoutSignals
SwitchesSpeed Limits
GradesCurvature
Trains
Origin and DestinationsDwells
Crew ChangesLocomotives
ConsistPriorities
Trains
Origin and DestinationsDwells
Crew ChangesLocomotives
ConsistPriorities
Meet/Pass Logic
Internal Train Performance
Calculator
Internal Train Performance
Calculator
PrioritiesPriorities
OutputsOutputs
Copyright Samuel L. Sogin, 2012 – All Rights Reserved
44
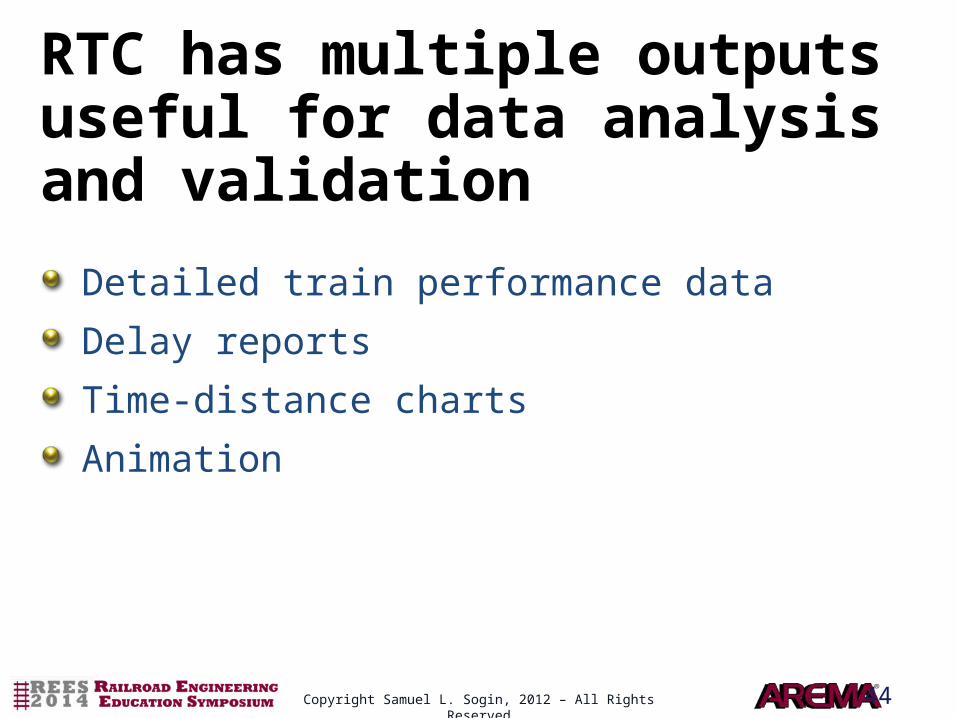
RTC has multiple outputs useful for data analysis and validation
Detailed train performance data
Delay reports
Time-distance charts
Animation
Copyright Samuel L. Sogin, 2012 – All Rights Reserved
45
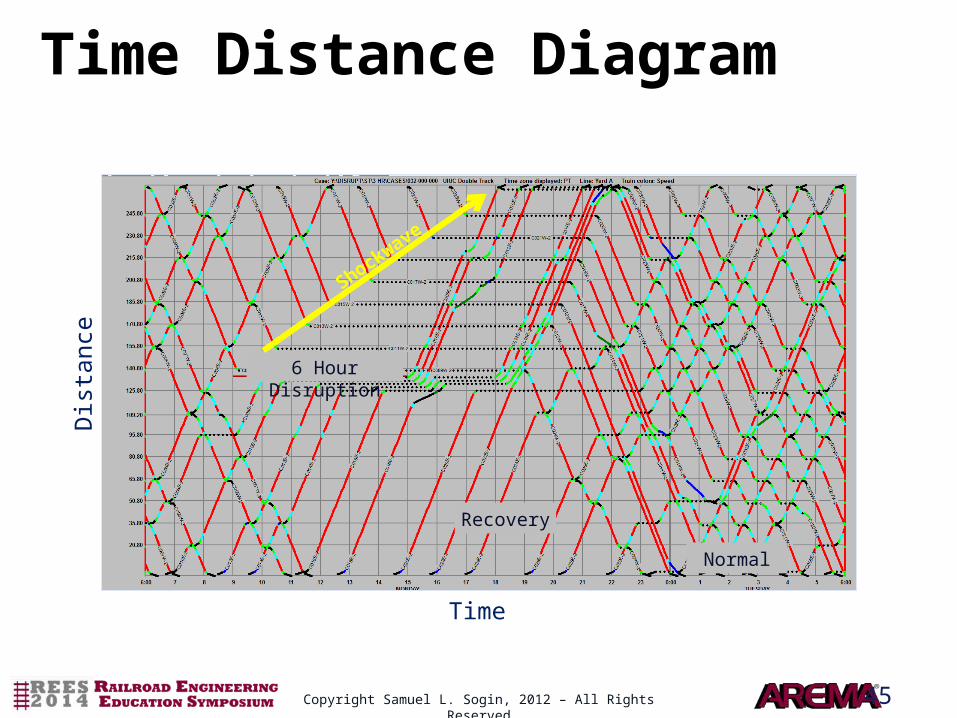
Time
Dis
tanc
e
6 Hour Disruption
Shockw
ave
Recovery
Normal
Time Distance Diagram
Copyright Samuel L. Sogin, 2012 – All Rights Reserved
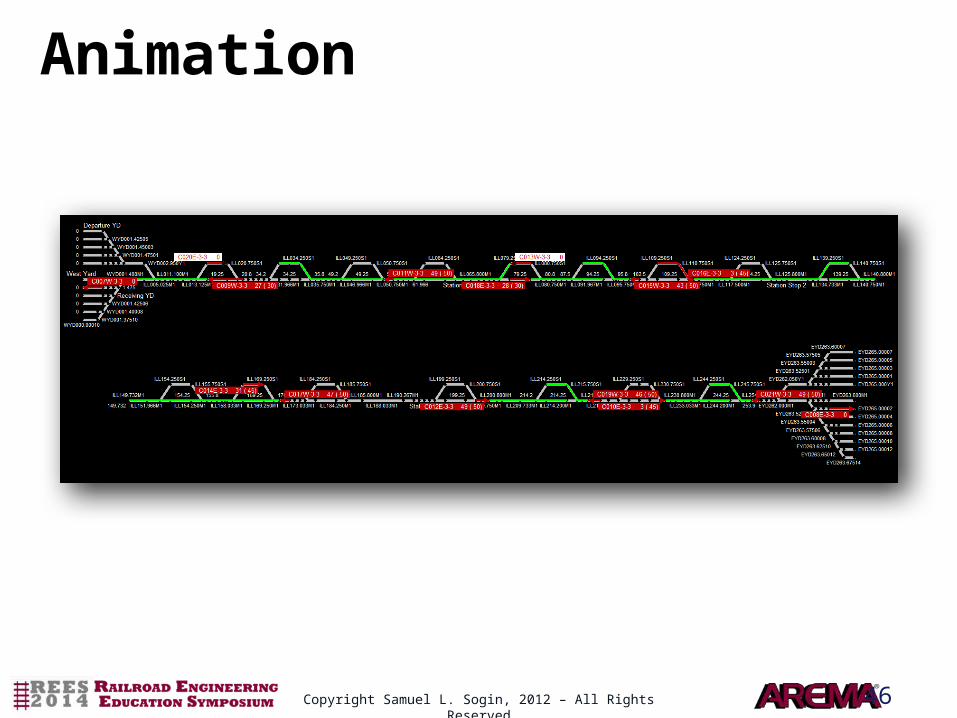
46
Animation
Copyright Samuel L. Sogin, 2012 – All Rights Reserved
47
Questions?
Copyright Samuel L. Sogin, 2012 – All Rights Reserved
48
Copyright Restrictions and Disclaimer
Presentation AuthorC. Tyler Dick, P.E.Senior Railway Research EngineerRail Transportation and Engineering CenterCivil & Environmental Engineering DepartmentUniversity of Illinois at Urbana-Champaign1241 Newmark Civil Engineering LabUrbana, IL 61801(217) 300-2166<[email protected]>
It is the author’s intention that the information contained in this file be used for non-commercial, educational purposes with as few restrictions as possible. However, there are some necessary constraints on its use as described below.
Copyright Restrictions and Disclaimer:The materials used in this file have come from a variety of sources and have been assembled here for personal use by the author for educational purposes. The copyright for some of the images and graphics used in this presentation may be held by others. Users may not change or delete any author attribution, copyright notice, trademark or other legend. Users of this material may not further reproduce this material without permission from the copyright owner. It is the responsibility of the user to obtain such permissions as necessary. You may not, without prior consent from the copyright owner, modify, copy, publish, display, transmit, adapt or in any way exploit the content of this file. Additional restrictions may apply to specific images or graphics as indicated herein.
The contents of this file are provided on an "as is" basis and without warranties of any kind, either express or implied. The author makes no warranties or representations, including any warranties of title, noninfringement of copyright or other rights, nor does the author make any warranties or representation regarding the correctness, accuracy or reliability of the content or other material in the file.
Copyright Samuel L. Sogin, 2012 – All Rights Reserved