Embed Size (px)
Citation preview
1
Business Information TechnologyData Centers Presentation
RTF Data Center Working Group
Geoff Wickes
Emerging Technologies
NEEA May 7th, 2013
Updated May 8th, 2012
2
Emerging Technology
Goal: Fill the pipeline with energy
efficiency opportunities
Key Objective: Project portfolio with 20
year potential of 300 aMW
Activities: Identification Confirmation Market Readiness
3
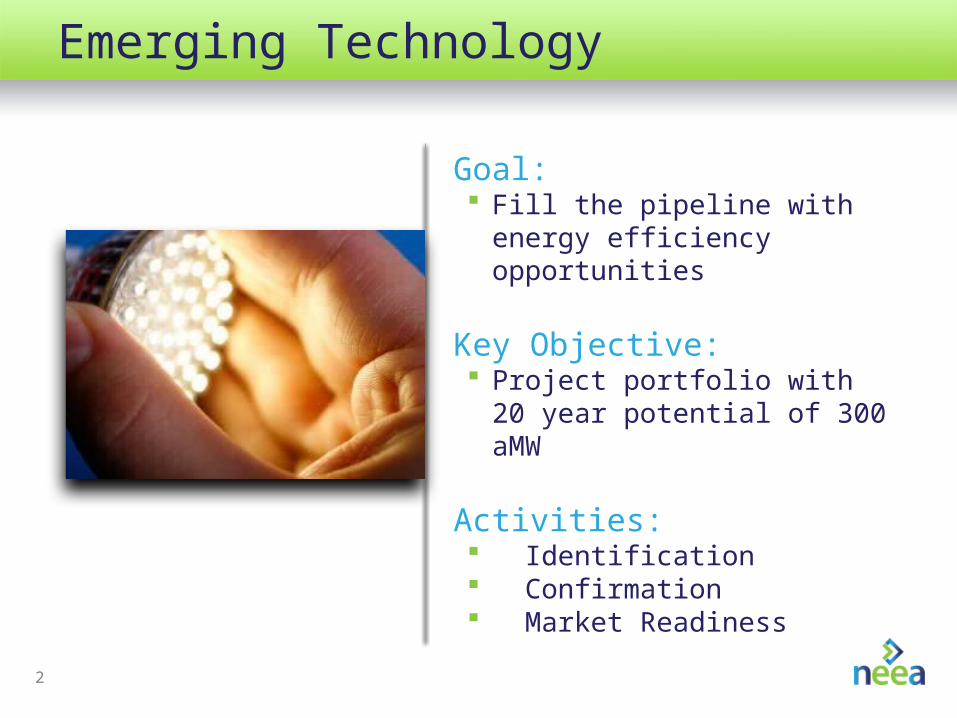
Target Market Definition
4
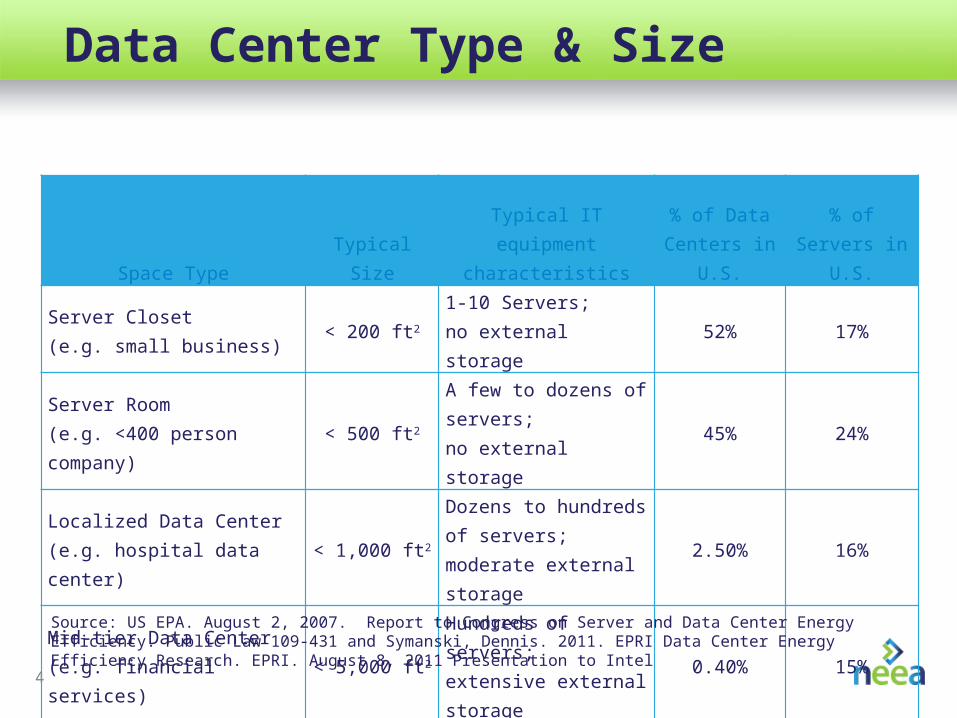
Data Center Type & Size
Space Type Typical SizeTypical IT equipment
characteristics
% of Data Centers in
U.S.% of Servers
in U.S.
Server Closet (e.g. small business)
< 200 ft21-10 Servers; no external storage
52% 17%
Server Room (e.g. <400 person company)
< 500 ft2
A few to dozens of servers; no external storage
45% 24%
Localized Data Center (e.g. hospital data center)
< 1,000 ft2
Dozens to hundreds of servers; moderate external storage
2.50% 16%
Mid-tier Data Center (e.g. financial services)
< 5,000 ft2
Hundreds of servers; extensive external storage
0.40% 15%
Source: US EPA. August 2, 2007. Report to Congress on Server and Data Center Energy Efficiency. Public Law 109-431 and Symanski, Dennis. 2011. EPRI Data Center Energy Efficiency Research. EPRI. August 8, 2011 Presentation to Intel
5
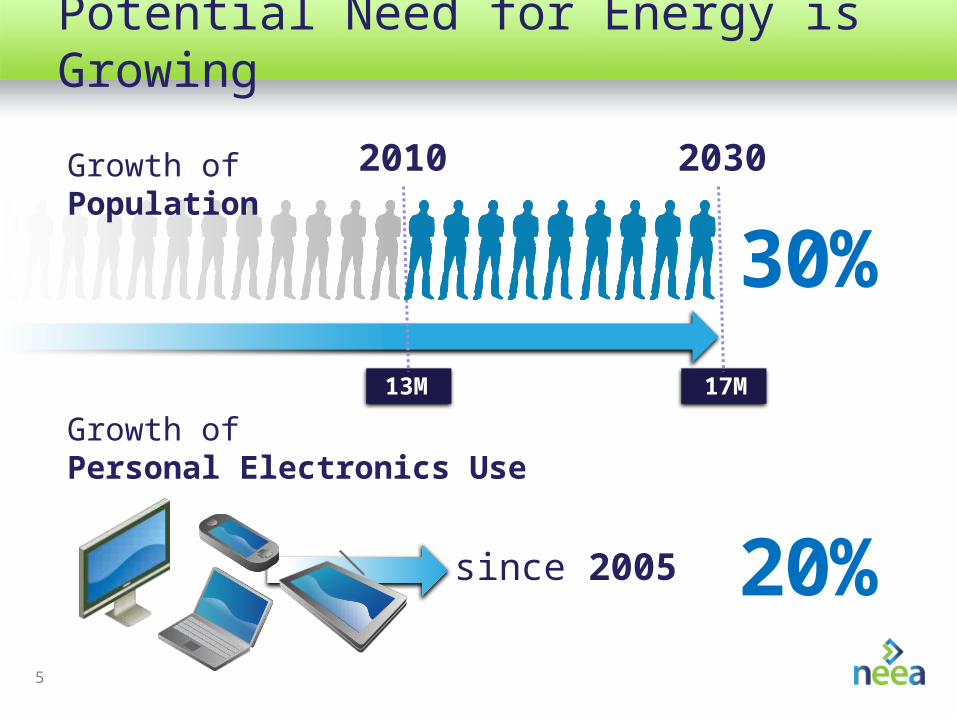
Potential Need for Energy is Growing
17M
2010
30%
2030
13M
Growth of Personal Electronics Use
Growth of Population
since 2005 20%
6
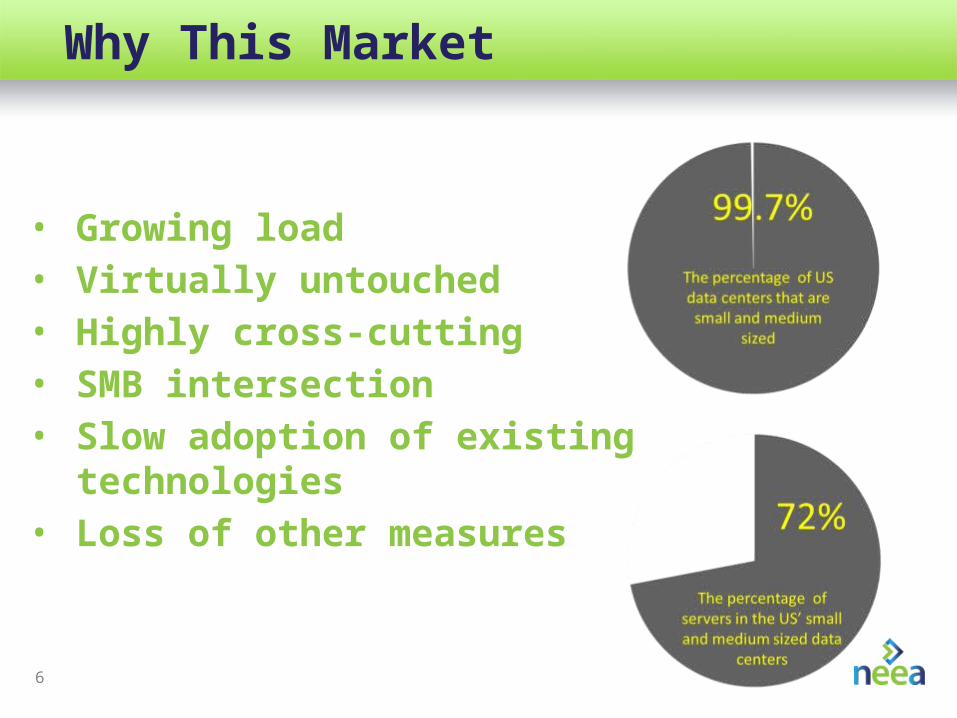
Why This Market
• Growing load• Virtually untouched• Highly cross-cutting• SMB intersection• Slow adoption of existing
technologies• Loss of other measures
7
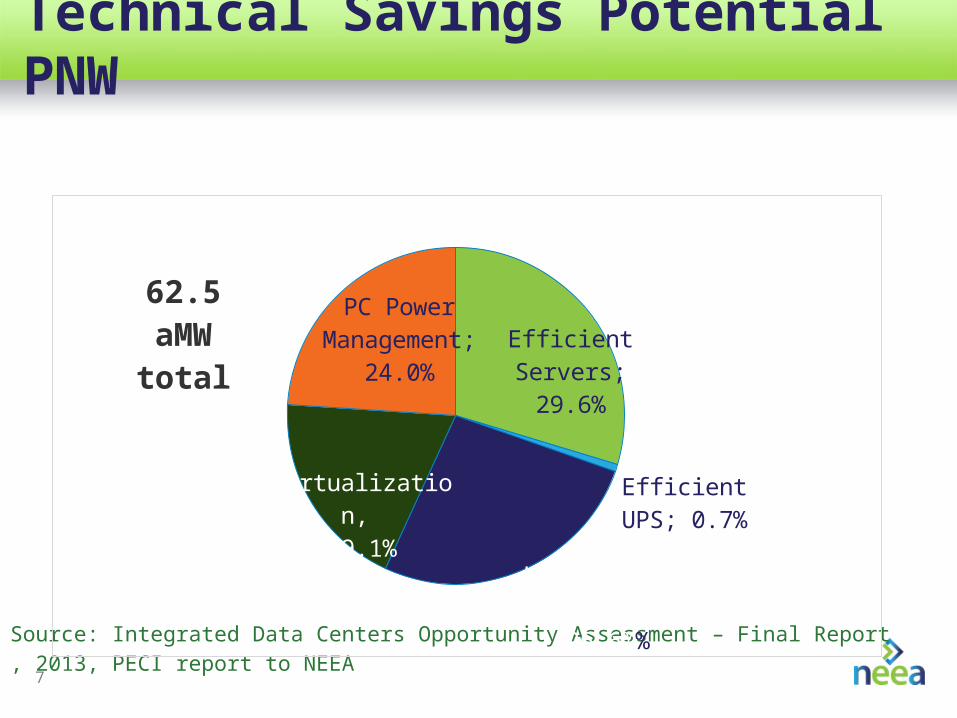
Technical Savings Potential PNW
Source: Integrated Data Centers Opportunity Assessment – Final Report , 2013, PECI report to NEEA
Efficient Servers; 29.6%
Efficient UPS; 0.7%
HVAC and Air Handling,
26.6%%
Virtualization, 19.1%
PC Power Man-agement; 24.0%
62.5 aMW total
8
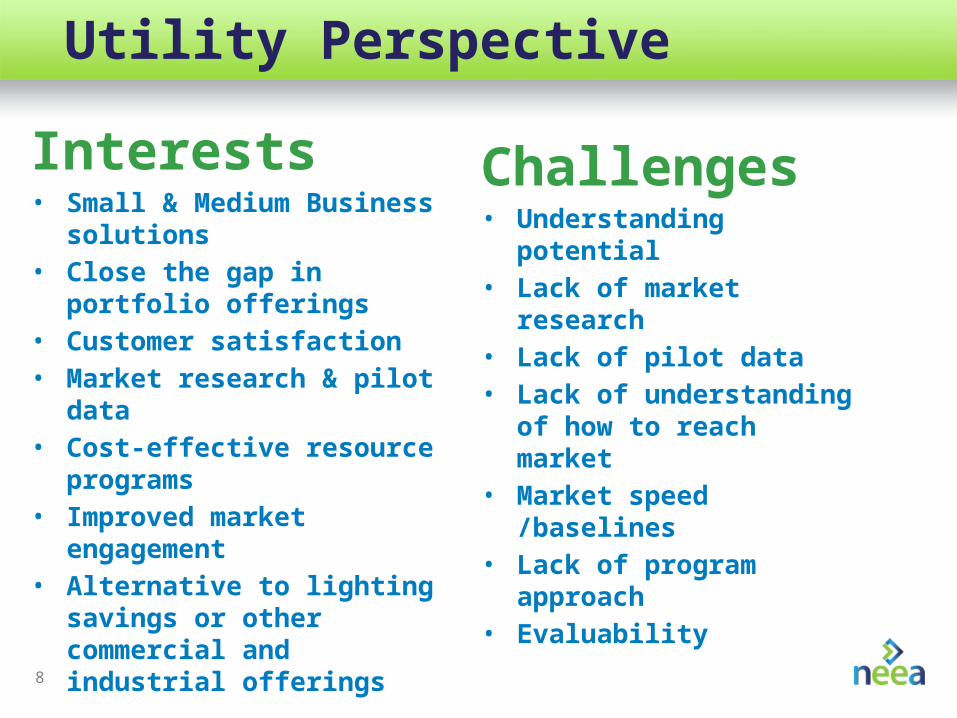
Utility Perspective
Interests• Small & Medium Business
solutions• Close the gap in portfolio
offerings• Customer satisfaction• Market research & pilot data• Cost-effective resource
programs• Improved market engagement• Alternative to lighting savings
or other commercial and industrial offerings
Challenges• Understanding potential• Lack of market research • Lack of pilot data• Lack of understanding of
how to reach market• Market speed /baselines• Lack of program approach• Evaluability
9
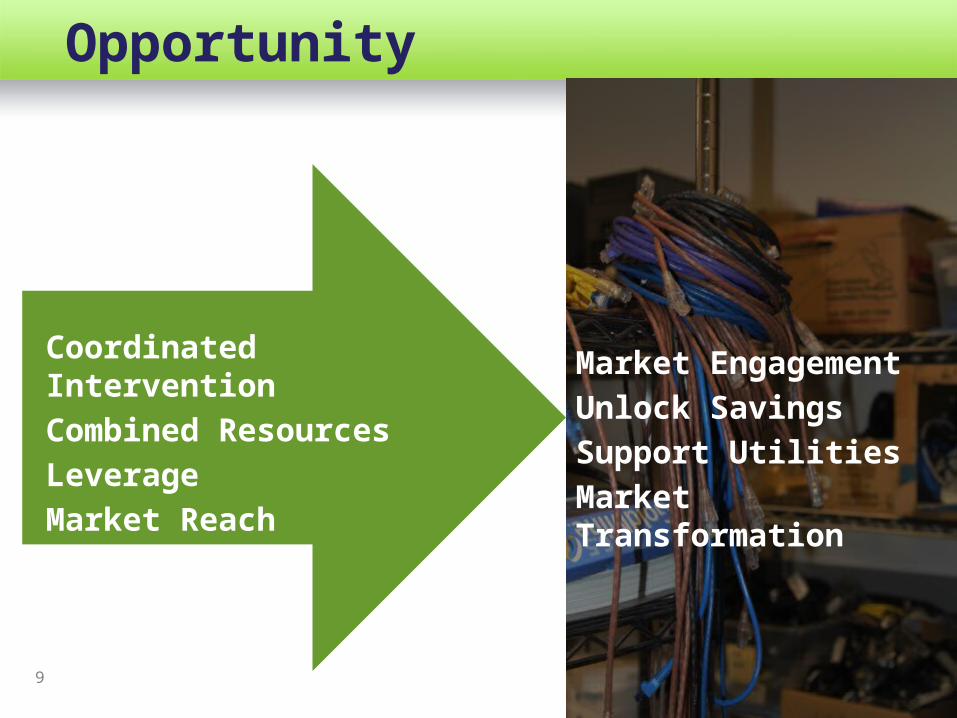
Opportunity
Coordinated Intervention
Combined Resources
Leverage
Market Reach
Market Engagement
Unlock Savings
Support Utilities
Market Transformation
10
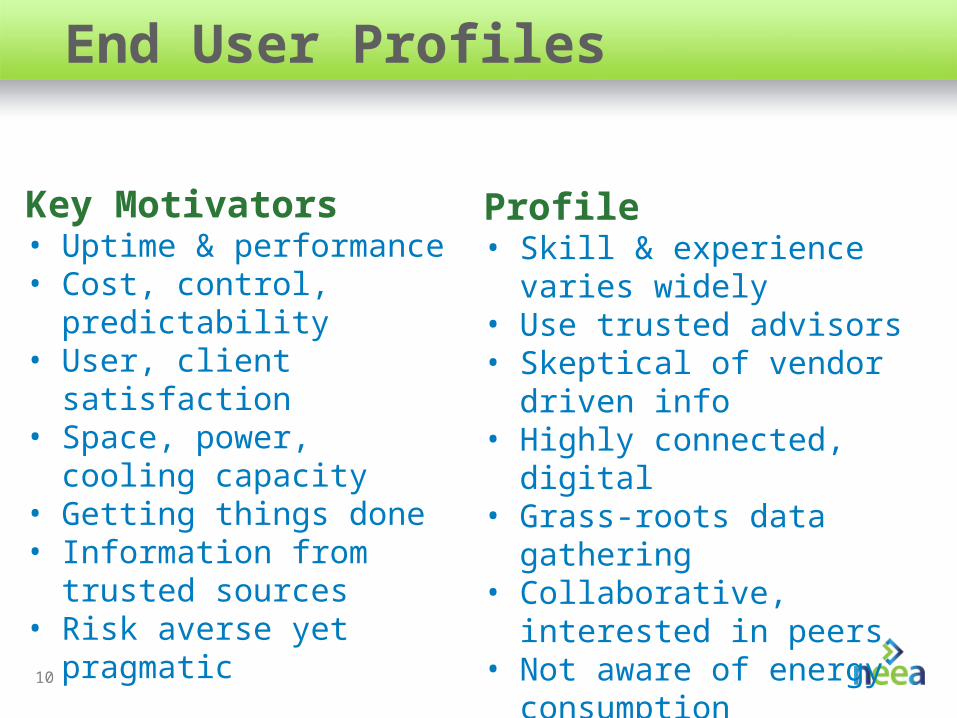
End User Profiles
Key Motivators• Uptime & performance• Cost, control, predictability• User, client satisfaction• Space, power, cooling
capacity• Getting things done• Information from trusted
sources• Risk averse yet pragmatic
Profile• Skill & experience varies
widely• Use trusted advisors• Skeptical of vendor driven
info• Highly connected, digital • Grass-roots data gathering• Collaborative, interested in
peers• Not aware of energy
consumption
11
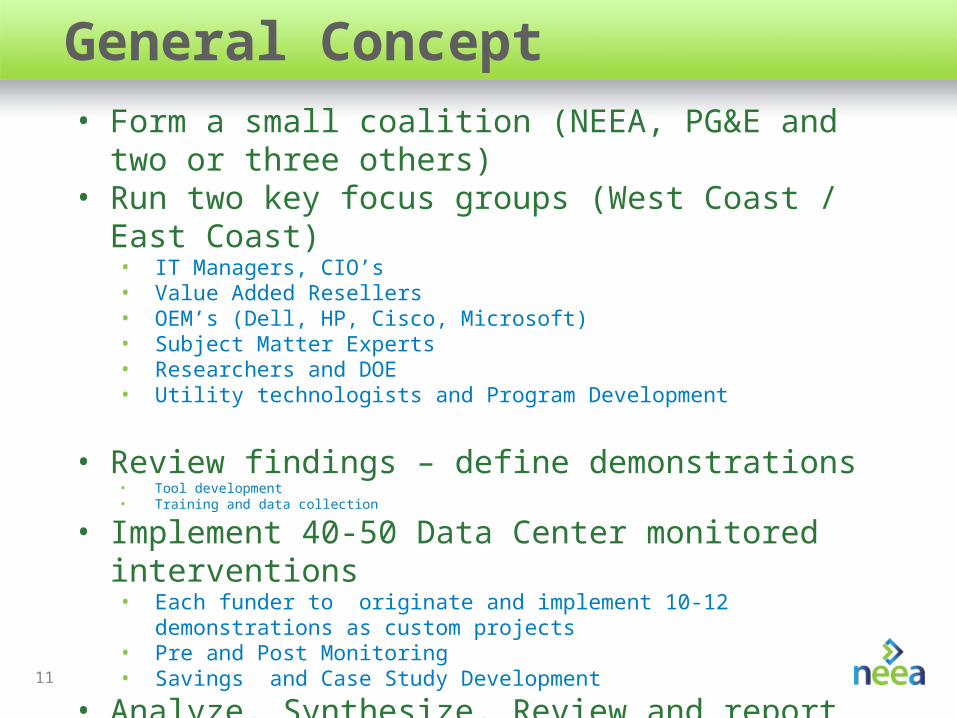
General Concept • Form a small coalition (NEEA, PG&E and two or three
others) • Run two key focus groups (West Coast / East Coast)
• IT Managers, CIO’s • Value Added Resellers• OEM’s (Dell, HP, Cisco, Microsoft)• Subject Matter Experts• Researchers and DOE • Utility technologists and Program Development
• Review findings – define demonstrations• Tool development• Training and data collection
• Implement 40-50 Data Center monitored interventions• Each funder to originate and implement 10-12 demonstrations as custom
projects• Pre and Post Monitoring• Savings and Case Study Development
• Analyze, Synthesize, Review and report results – Make recommendations
12
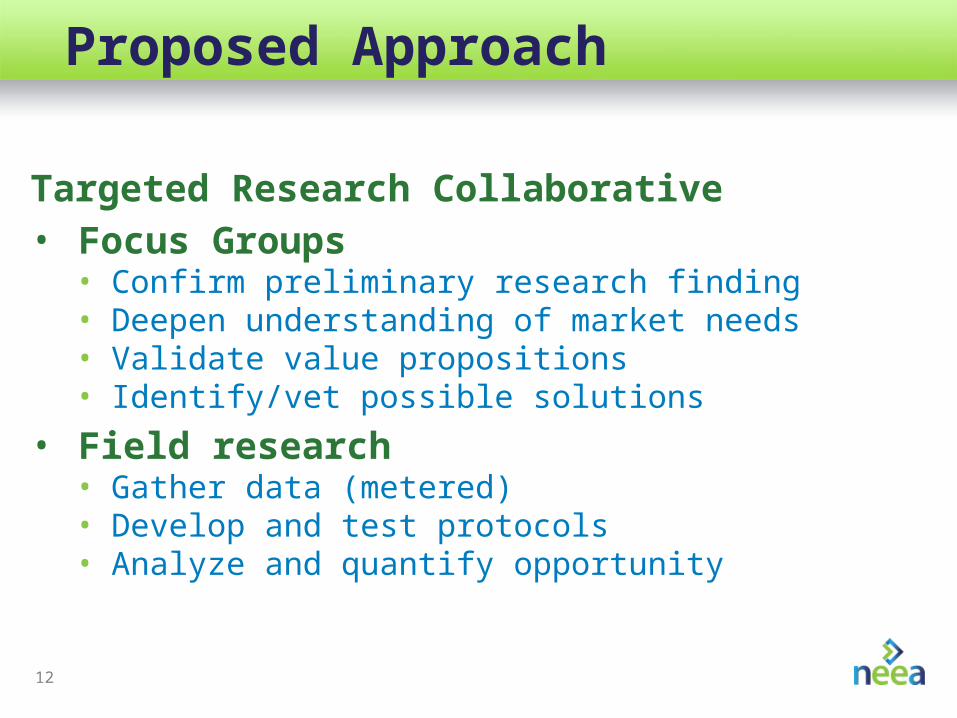
Proposed Approach
Targeted Research Collaborative • Focus Groups
• Confirm preliminary research finding• Deepen understanding of market needs• Validate value propositions • Identify/vet possible solutions
• Field research • Gather data (metered)• Develop and test protocols• Analyze and quantify opportunity
13
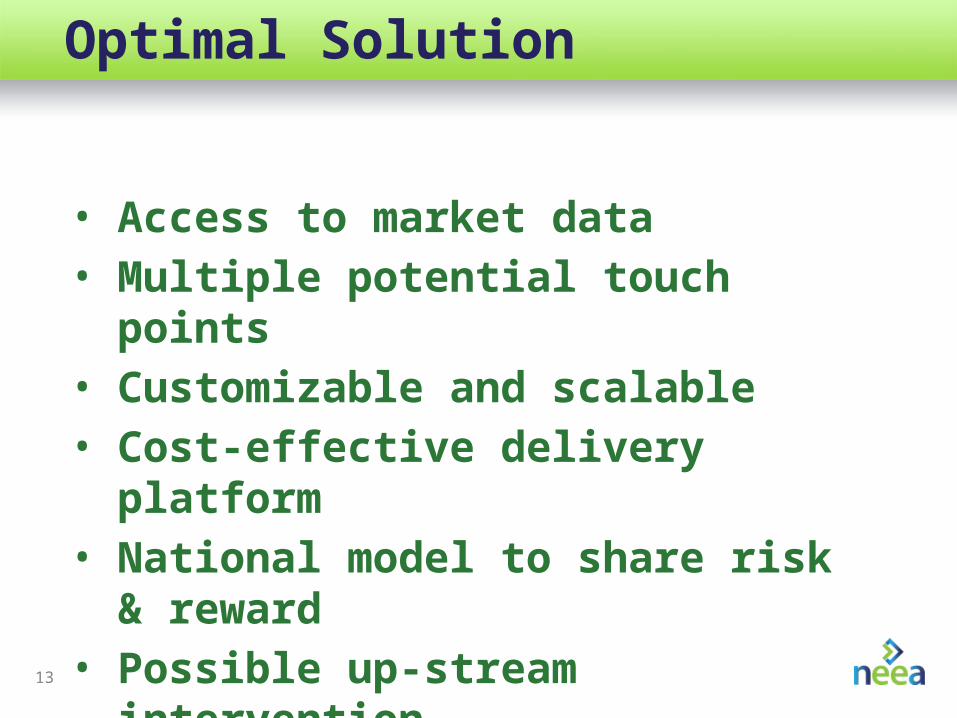
Optimal Solution
• Access to market data• Multiple potential touch points • Customizable and scalable• Cost-effective delivery platform• National model to share risk &
reward• Possible up-stream intervention
14
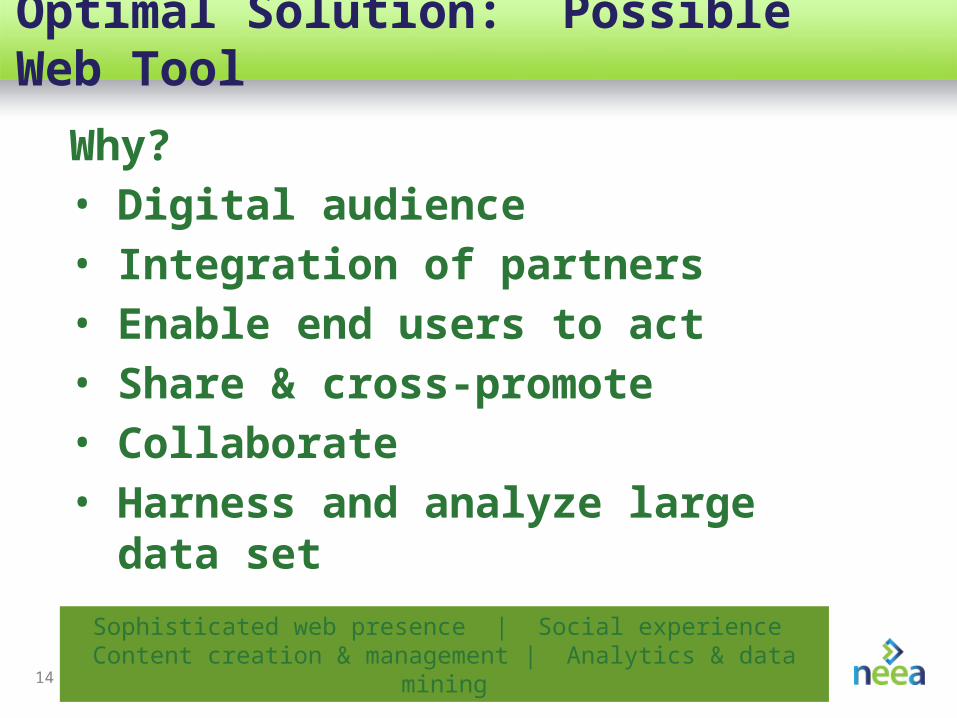
Optimal Solution: Possible Web Tool
Why?• Digital audience• Integration of partners• Enable end users to act• Share & cross-promote• Collaborate• Harness and analyze large data set
Sophisticated web presence | Social experience Content creation & management | Analytics & data mining
15
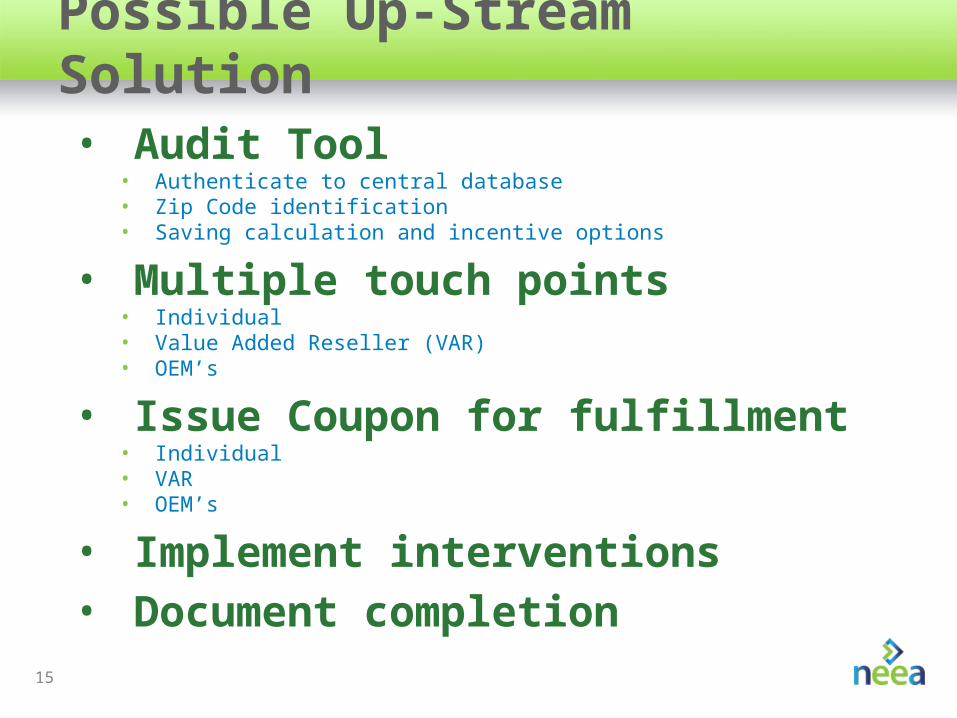
Possible Up-Stream Solution
• Audit Tool• Authenticate to central database• Zip Code identification• Saving calculation and incentive options
• Multiple touch points• Individual• Value Added Reseller (VAR)• OEM’s
• Issue Coupon for fulfillment• Individual• VAR• OEM’s
• Implement interventions• Document completion
16
1. Recruit RC Members & Launch
Research Scope
17
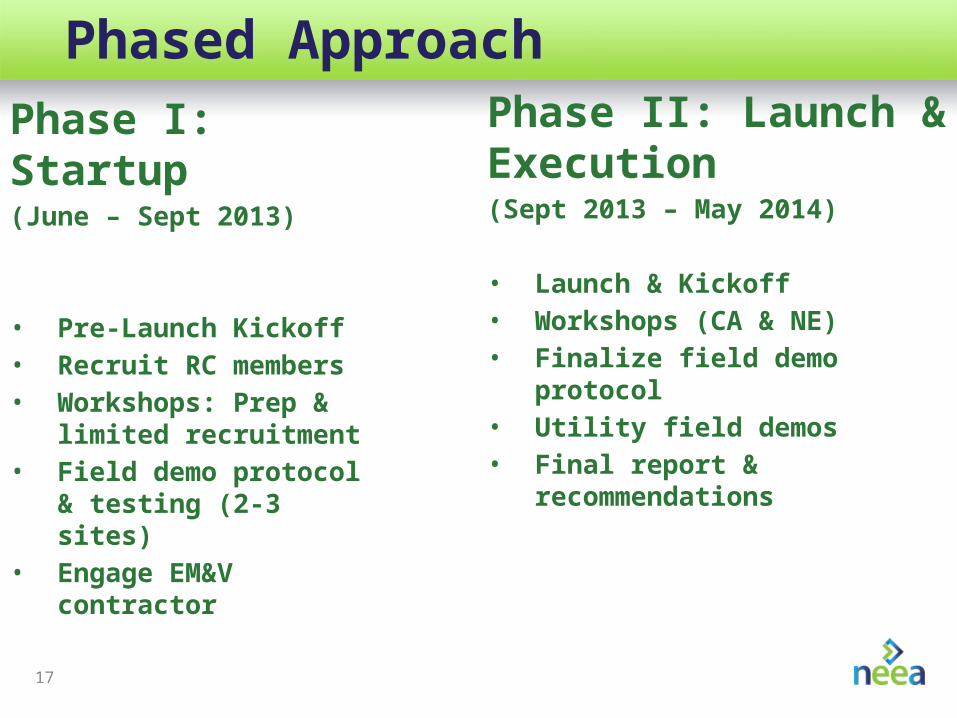
Phased Approach
Phase I: Startup (June – Sept 2013)
• Pre-Launch Kickoff• Recruit RC members• Workshops: Prep &
limited recruitment• Field demo protocol &
testing (2-3 sites)• Engage EM&V contractor
Phase II: Launch & Execution(Sept 2013 – May 2014)
• Launch & Kickoff• Workshops (CA & NE)• Finalize field demo protocol• Utility field demos• Final report & recommendations
18
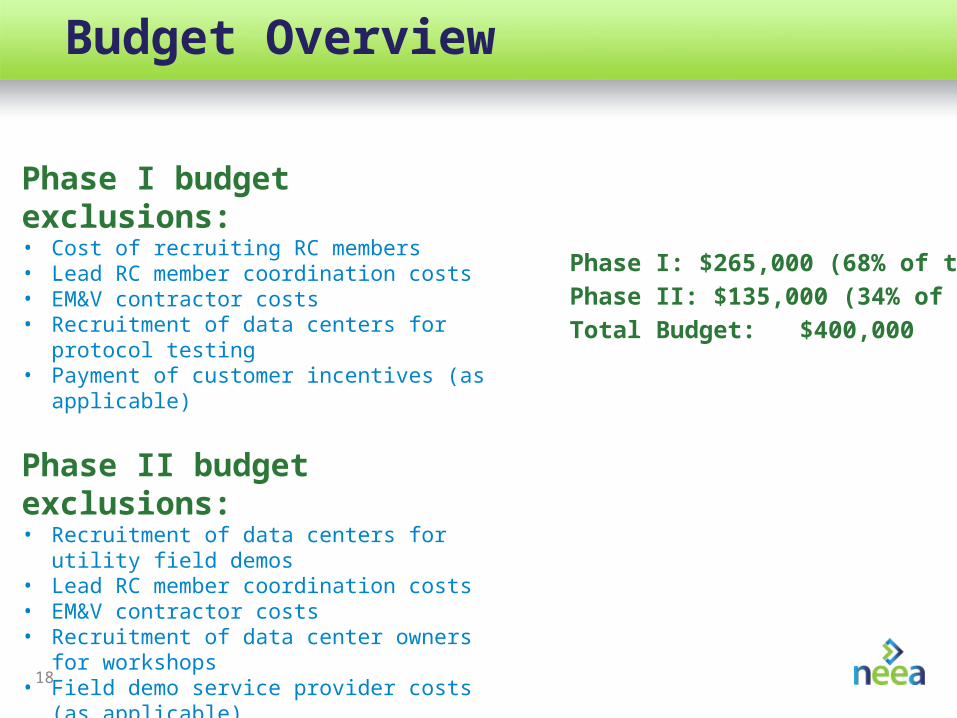
Budget Overview
Phase I budget exclusions:• Cost of recruiting RC members• Lead RC member coordination costs• EM&V contractor costs• Recruitment of data centers for protocol testing• Payment of customer incentives (as applicable)
Phase II budget exclusions:• Recruitment of data centers for utility field demos• Lead RC member coordination costs• EM&V contractor costs• Recruitment of data center owners for workshops• Field demo service provider costs (as applicable)• Payment of customer incentives (as applicable)
Phase I: $265,000 (68% of total)
Phase II: $135,000 (34% of total)
Total Budget: $400,000
19
Additional Content


![[MS-OXRTFCP]: Rich Text Format (RTF) Compression Algorithm · The Rich Text Format (RTF) Compression Algorithm is used to compress and decompress RTF data, as described in [MSFT-RTF],](https://img.pdfslide.us/doc/110x75/5e9e1be31138b067ae753825/ms-oxrtfcp-rich-text-format-rtf-compression-algorithm-the-rich-text-format.jpg)