Embed Size (px)
Citation preview
1
Automated Detection of Lung Cancer with 3DConvolutional Neural Networks
Author AdvisorGustavo Perez, Pablo Arbelaez
Abstract—Lung cancer is the deadliest cancer worldwide. It has been shown that early detection using computer tomography (CT)scans can reduce deaths caused by this disease. We present a general framework for the detection of lung cancer in chest CT images.Our method consists of a nodule detector trained on the LIDC-IDRI dataset followed by a cancer predictor trained on the Kaggle DSB2017 dataset and evaluated on the ISBI 2018 Lung Nodule Malignancy Prediction test set. Our candidate extraction approach iseffective to produce precise candidates with a recall of 99.6%. In addition, false positive reduction stage manages to successfullyclassify candidates and increases precision by a factor of 7.000. Our cancer predictor obtained a ROC AUC of 0.913 and was ranked1st place at the ISBI 2018 Lung Nodule Malignancy Prediction challenge.
Index Terms—Lung cancer, deep learning, computer aided diagnosis.
F
1 INTRODUCTION
C ANCER is the main cause of death worldwide, accounting for8.2 million deaths per year approximately. Lung cancer leads
this list with 1.69 million deaths per year [3]. Early detection withthe aid of CT scans has shown to reduce lung cancer mortality by16% to 20%, compared to standard chest x-ray among adults [1].In January 2013, the American Cancer Society issued guidelinesfor the early detection of lung cancer based on a systematicreview of the evidence. These guidelines endorse a process ofshared decision-making between clinicians who have access tohigh-volume lung cancer screening programs [1]. However, theconsensus in lung nodule detection by radiologists is less than52% when detecting nodules of any size [21]. As shown in Figure1, the difficulty in the early diagnosis of lung cancer is due to thevariability in shape and size of nodules, and the high unbalancebetween the nodules and other lung structures and tissues.
A great amount of research has been conducted over thepast two decades in computer-aided detection (CAD) systems forlung cancer in CT scans [20], [24]. A large number of systemsfor cancer detection have been proposed in the literature [9].However, low sensitivity and high false-positive rates are stillissues that prevent these systems from being used in the dailyclinical practice.
Recently, significant research has been done with the use ofdeep learning techniques, and its recent success for detection,segmentation, and recognition on natural and medical images likedetection of skin cancer [5] makes inescapable the application ofthese machine learning methods for lung cancer CAD systems.Due to the variability and the high unbalance between the nodulesand other lung structures, handcrafted feature extraction is a dif-ficult task. Learned features from a convolutional neural networkyield conceptual abstractions by each layer in a hierarchical wayand outperform handcrafted features.
Our general framework is shown in Figure 2. To achieve thegoal of cancer detection from a CT scan, we implement a stagefor pre-processing using filtering, and the lungs extraction from the
• G. Perez, Universidad de los AndesE-mail: [email protected]
Fig. 1: Examples of annotated nodules <3mm on the LIDC-IDRI dataset. Left. Juxtapleural nodule of diameter 1.7mm. Right.Parenchymal nodule of diameter 2.7mm surrounded by vessels.
entire volume using a mask previously calculated for each patient.From the extracted lungs, we perform a candidate generation usingmorphological operations such as opening by reconstruction, thecalculation of regional maxima, etc. We use the extracted candi-dates to train a three-dimensional convolutional neural networkfor nodule classification and false positive reduction. with the topscored detected nodules, we train a cancer predictor to producea final malignancy score per patient. We conduct experiments onthe currently largest publicly available database with individualnodule annotations, the LIDC-IDRI [21] for our nodule detector,and in the ISBI 2018 Lung Nodule Malignancy Prediction [4]dataset for our cancer predictor. We develop a computer-aidedsystem for the detection of lung cancer ranked 1st place at theISBI 2018 Lung Nodule Malignancy Prediction challenge [4].
May 08, 2018

2
Fig. 2: Proposed method: pre-processing for noise reduction and lung extraction with a mask, candidate generation with morphologicaloperations, nodule classification with a three-dimensional convolutional neural network to reduce false positives and increase precision,and cancer predictor to obtain a final cancer malignancy probability for each patient.
2 RELATED WORK
Lung cancer detection is divided into two main problems: Lungnodule detection and lung cancer prediction. Several algorithmsare focused on nodule detection because it is seen as a criticalintermediate step for the prediction of lung cancer. Other ap-proaches try to predict cancer from the original CT avoiding aprevious detection of nodules. Most of these latter approaches aredeep learning based. Our framework uses and intermediate noduledetector whose detections are used to the prediction of cancer ofeach patient.
Several algorithms rely on thresholding methods and morpho-logical operations for nodule segmentation, followed by featureextraction and classification. In 2007, M. Dolejsi et al. [17]proposed an algorithm for segmentation of nodules in two sep-arate ways, morphological closing and thresholding to find juxta-pleural nodules and 3D blob detector with multiscale filtration tolocate non-pleural nodule candidates. For classification, linear andmulti-threshold classifiers were used. In 2007, Osman et al. [23]proposed a CAD system using template matching over the 3Dvolume to generate candidates. The false positive reduction wasmade using connected components and the sum of differences ofdensities in the surrounding pixels. In 2012, V. Sudha et al. [26]proposed a global thresholding algorithm following an iterativeapproach for lung volume extraction. The nodule segmentationstage was made by thresholding and morphological reconstruction.Another method, using template matching for nodule segmenta-tion, was proposed by A.Tartar et al. [8] in 2013. The false positivereduction was made by decision trees. More algorithms usingmorphological operations for candidate extraction and differenttypes of classifiers for false positive reduction have been proposed[6], [10].
In the case of deep learning strategies, most of the researchhas focused on the classification of nodules starting from 2D or3D nodule images using the LIDC-IDRI [21] dataset [16], [22],[27], the LUNA16 challenge dataset (which uses LIDC-IDRI),and the Multicentric Italian Lung Detection (MILD) [25] trial[13]. In these cases, the problem is addressed as a classification ofnodules from given candidate centroids detected with previouslypublished CAD systems [7], [11], [12], [15], [18]. The numberof false positives to be classified is almost 25 times less than ourextracted candidates but the highest sensitivity reached by thesemethods is around 87% (in the candidate generation stage) forall sized nodules. Since the nodule classification algorithms are
evaluated over the total previously detected nodules and not overthe total ground-truth nodules of each patient, the classification ofnodules from previously detected algorithms is a problem with alower difficulty degree.
3 MATERIALS
3.1 LIDC-IDRI dataset
The LIDC-IDRI dataset is produced by the Lung Image DatabaseConsortium (LIDC) and the Image Database Resource Initiative(IDRI) [21] with a total of 1.010 patients. It is publicly available inDICOM format and the radiologists’ annotations in XML markup.The annotations are made by 4 radiologists in two stages; a blindstage and a second unblinded stage where each radiologist ispresented with the marks placed by all radiologists in the blindstage. For this project we consider lesions labeled as nodules forat least one specialist and included after the unblinded secondstage.
Table 1 shows the consensus in lung nodule detection by thefour radiologists. As we can see, only 51,4% of the total includednodules after the unblinded second stage are detected by the 4specialists, and only 27.8% of the total nodules from the blindinitial stage. The consensus of 51.4%, which we will use as humanperformance for nodule detection task, shows the difficulty ofdetecting lung nodules.
TABLE 1: Annotations statistics from the LIDC-IDRI dataset
Total Patients 1010Total nodules labeled 11.608 100%Total nodules included 6.287 54.2% 100%Included by 4 annotators 3.233 27.8% 51.4%
We divide the dataset for the nodule detector randomly into 3sub-sets; 25% of patients for training, 25% for validation, and theremaining 50% for testing.
3.2 Kaggle DSB 2017 dataset
The Kaggle DSB 2017 is a dataset of thousands of high-resolutionlung scans provided by the National Cancer Institute with anno-tations of cancer/non-cancer for each patient. 1.384 of the totalof 1.890 patients have public labels. Of the 1.384 patients withpublic labels, around 25% of the patients are labeled with cancer.
3
TABLE 2: Statistics from the Kaggle DSB 2017 dataset
Total Patients 1890 100%Patients with public labels 1384 73.2%Patients without public labels 506 26.7%
The scans are provided in DICOM format. Table 2 shows statisticsof the Kaggle DSB 2017 dataset.
We use the 1.384 labeled patients for training of the siamesecancer predictor.
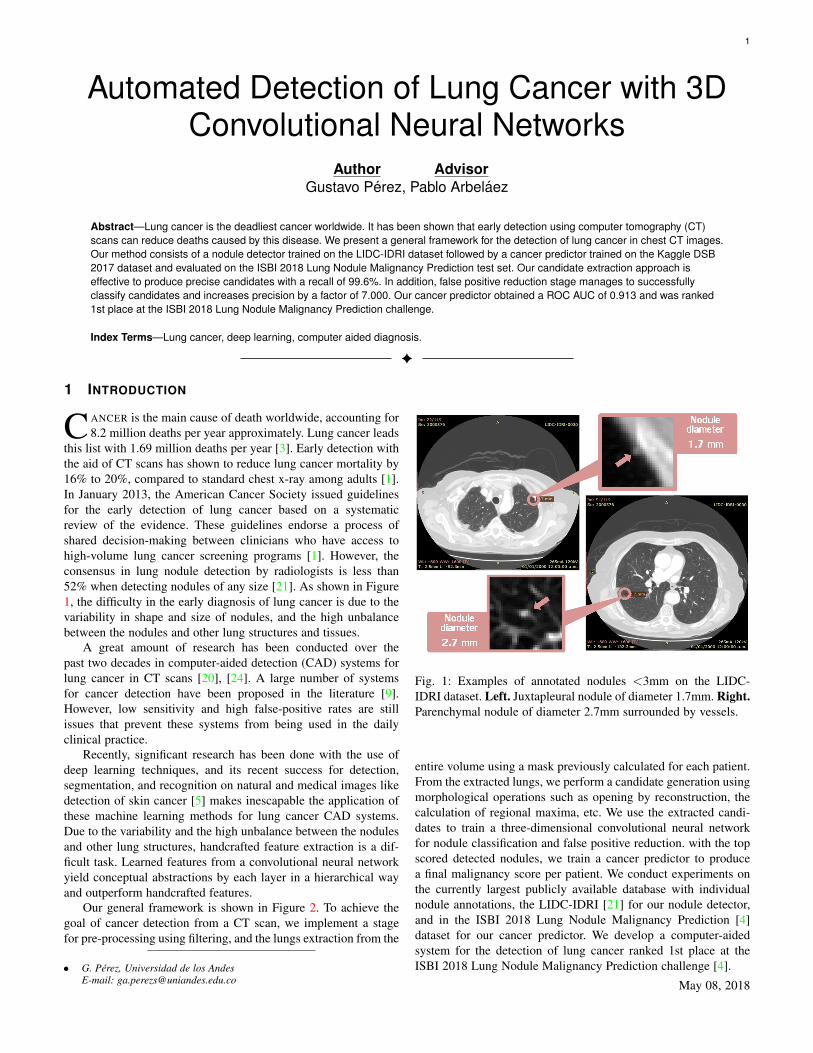
3.3 ISBI 2018 lung cancer datasetThe ISBI 2018 Lung Nodule Malignancy Prediction challenge [4]use a set of 100 patients with sequential CT (total of 200 scans.One scan was taken in 1.999 and the second scan in 2.000 foreach patient), including equal number of cancer and non-cancercases. The dataset also provides segmentation annotations of theindex nodule (most critical nodule chosen by annotators of eachCT) per patient in NIfTI format. The dataset is divided by thechallenge organizers in 30 patients for trainval and 70 patients fortest. The labels of the 70 test patients are not public. The scans areprovided in DICOM format. Table 3 shows statistics of the ISBI2018 dataset.
TABLE 3: Statistics from the ISBI 2018 dataset
Total Patients 100 100%Patients with public labels 30 30%Patients without public labels 70 70%
We use the 30 patients with public labels as validation set forour cancer predictor. And the final score is evaluated on the entiretest set in the ISBI 2018 challenge server. For our experiments, weuse only the year 2.000 scans of all patients.
4 PROPOSED METHOD
4.1 Nodule Detector
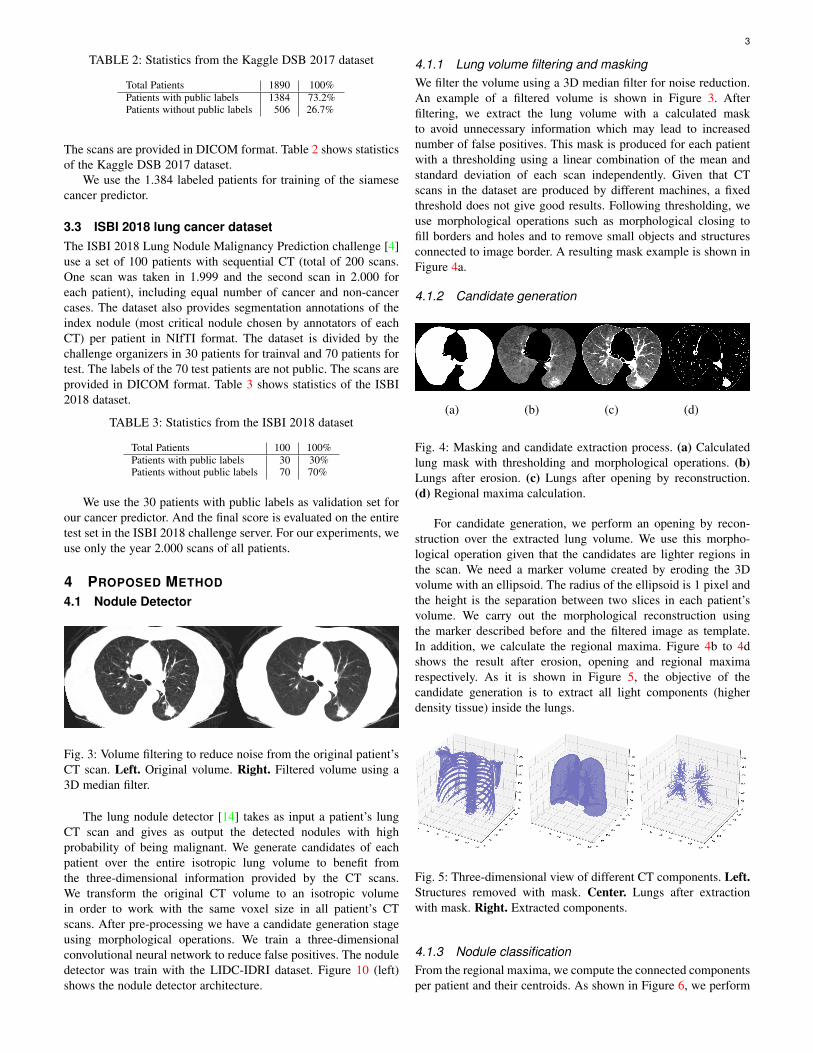
Fig. 3: Volume filtering to reduce noise from the original patient’sCT scan. Left. Original volume. Right. Filtered volume using a3D median filter.
The lung nodule detector [14] takes as input a patient’s lungCT scan and gives as output the detected nodules with highprobability of being malignant. We generate candidates of eachpatient over the entire isotropic lung volume to benefit fromthe three-dimensional information provided by the CT scans.We transform the original CT volume to an isotropic volumein order to work with the same voxel size in all patient’s CTscans. After pre-processing we have a candidate generation stageusing morphological operations. We train a three-dimensionalconvolutional neural network to reduce false positives. The noduledetector was train with the LIDC-IDRI dataset. Figure 10 (left)shows the nodule detector architecture.
4.1.1 Lung volume filtering and maskingWe filter the volume using a 3D median filter for noise reduction.An example of a filtered volume is shown in Figure 3. Afterfiltering, we extract the lung volume with a calculated maskto avoid unnecessary information which may lead to increasednumber of false positives. This mask is produced for each patientwith a thresholding using a linear combination of the mean andstandard deviation of each scan independently. Given that CTscans in the dataset are produced by different machines, a fixedthreshold does not give good results. Following thresholding, weuse morphological operations such as morphological closing tofill borders and holes and to remove small objects and structuresconnected to image border. A resulting mask example is shown inFigure 4a.
4.1.2 Candidate generation
(a) (b) (c) (d)
Fig. 4: Masking and candidate extraction process. (a) Calculatedlung mask with thresholding and morphological operations. (b)Lungs after erosion. (c) Lungs after opening by reconstruction.(d) Regional maxima calculation.
For candidate generation, we perform an opening by recon-struction over the extracted lung volume. We use this morpho-logical operation given that the candidates are lighter regions inthe scan. We need a marker volume created by eroding the 3Dvolume with an ellipsoid. The radius of the ellipsoid is 1 pixel andthe height is the separation between two slices in each patient’svolume. We carry out the morphological reconstruction usingthe marker described before and the filtered image as template.In addition, we calculate the regional maxima. Figure 4b to 4dshows the result after erosion, opening and regional maximarespectively. As it is shown in Figure 5, the objective of thecandidate generation is to extract all light components (higherdensity tissue) inside the lungs.
Fig. 5: Three-dimensional view of different CT components. Left.Structures removed with mask. Center. Lungs after extractionwith mask. Right. Extracted components.
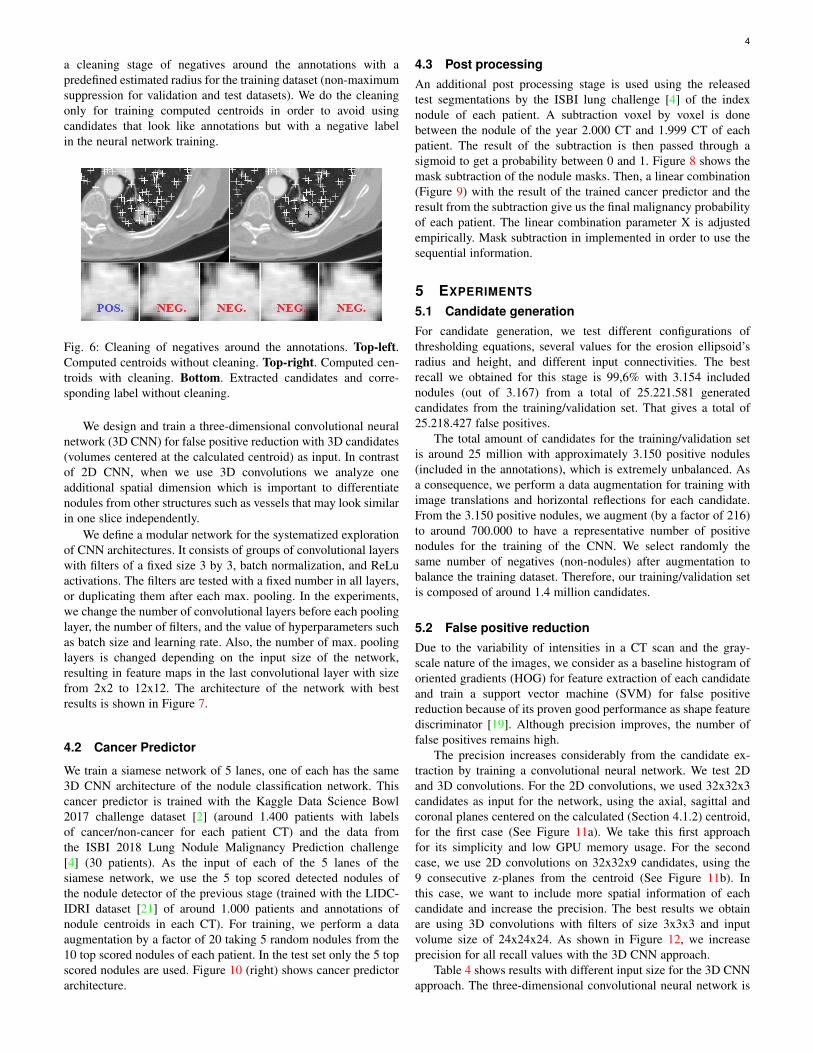
4.1.3 Nodule classificationFrom the regional maxima, we compute the connected componentsper patient and their centroids. As shown in Figure 6, we perform
4
a cleaning stage of negatives around the annotations with apredefined estimated radius for the training dataset (non-maximumsuppression for validation and test datasets). We do the cleaningonly for training computed centroids in order to avoid usingcandidates that look like annotations but with a negative labelin the neural network training.
Fig. 6: Cleaning of negatives around the annotations. Top-left.Computed centroids without cleaning. Top-right. Computed cen-troids with cleaning. Bottom. Extracted candidates and corre-sponding label without cleaning.
We design and train a three-dimensional convolutional neuralnetwork (3D CNN) for false positive reduction with 3D candidates(volumes centered at the calculated centroid) as input. In contrastof 2D CNN, when we use 3D convolutions we analyze oneadditional spatial dimension which is important to differentiatenodules from other structures such as vessels that may look similarin one slice independently.
We define a modular network for the systematized explorationof CNN architectures. It consists of groups of convolutional layerswith filters of a fixed size 3 by 3, batch normalization, and ReLuactivations. The filters are tested with a fixed number in all layers,or duplicating them after each max. pooling. In the experiments,we change the number of convolutional layers before each poolinglayer, the number of filters, and the value of hyperparameters suchas batch size and learning rate. Also, the number of max. poolinglayers is changed depending on the input size of the network,resulting in feature maps in the last convolutional layer with sizefrom 2x2 to 12x12. The architecture of the network with bestresults is shown in Figure 7.
4.2 Cancer Predictor
We train a siamese network of 5 lanes, one of each has the same3D CNN architecture of the nodule classification network. Thiscancer predictor is trained with the Kaggle Data Science Bowl2017 challenge dataset [2] (around 1.400 patients with labelsof cancer/non-cancer for each patient CT) and the data fromthe ISBI 2018 Lung Nodule Malignancy Prediction challenge[4] (30 patients). As the input of each of the 5 lanes of thesiamese network, we use the 5 top scored detected nodules ofthe nodule detector of the previous stage (trained with the LIDC-IDRI dataset [21] of around 1.000 patients and annotations ofnodule centroids in each CT). For training, we perform a dataaugmentation by a factor of 20 taking 5 random nodules from the10 top scored nodules of each patient. In the test set only the 5 topscored nodules are used. Figure 10 (right) shows cancer predictorarchitecture.
4.3 Post processingAn additional post processing stage is used using the releasedtest segmentations by the ISBI lung challenge [4] of the indexnodule of each patient. A subtraction voxel by voxel is donebetween the nodule of the year 2.000 CT and 1.999 CT of eachpatient. The result of the subtraction is then passed through asigmoid to get a probability between 0 and 1. Figure 8 shows themask subtraction of the nodule masks. Then, a linear combination(Figure 9) with the result of the trained cancer predictor and theresult from the subtraction give us the final malignancy probabilityof each patient. The linear combination parameter X is adjustedempirically. Mask subtraction in implemented in order to use thesequential information.
5 EXPERIMENTS
5.1 Candidate generationFor candidate generation, we test different configurations ofthresholding equations, several values for the erosion ellipsoid’sradius and height, and different input connectivities. The bestrecall we obtained for this stage is 99,6% with 3.154 includednodules (out of 3.167) from a total of 25.221.581 generatedcandidates from the training/validation set. That gives a total of25.218.427 false positives.
The total amount of candidates for the training/validation setis around 25 million with approximately 3.150 positive nodules(included in the annotations), which is extremely unbalanced. Asa consequence, we perform a data augmentation for training withimage translations and horizontal reflections for each candidate.From the 3.150 positive nodules, we augment (by a factor of 216)to around 700.000 to have a representative number of positivenodules for the training of the CNN. We select randomly thesame number of negatives (non-nodules) after augmentation tobalance the training dataset. Therefore, our training/validation setis composed of around 1.4 million candidates.
5.2 False positive reductionDue to the variability of intensities in a CT scan and the gray-scale nature of the images, we consider as a baseline histogram oforiented gradients (HOG) for feature extraction of each candidateand train a support vector machine (SVM) for false positivereduction because of its proven good performance as shape featurediscriminator [19]. Although precision improves, the number offalse positives remains high.
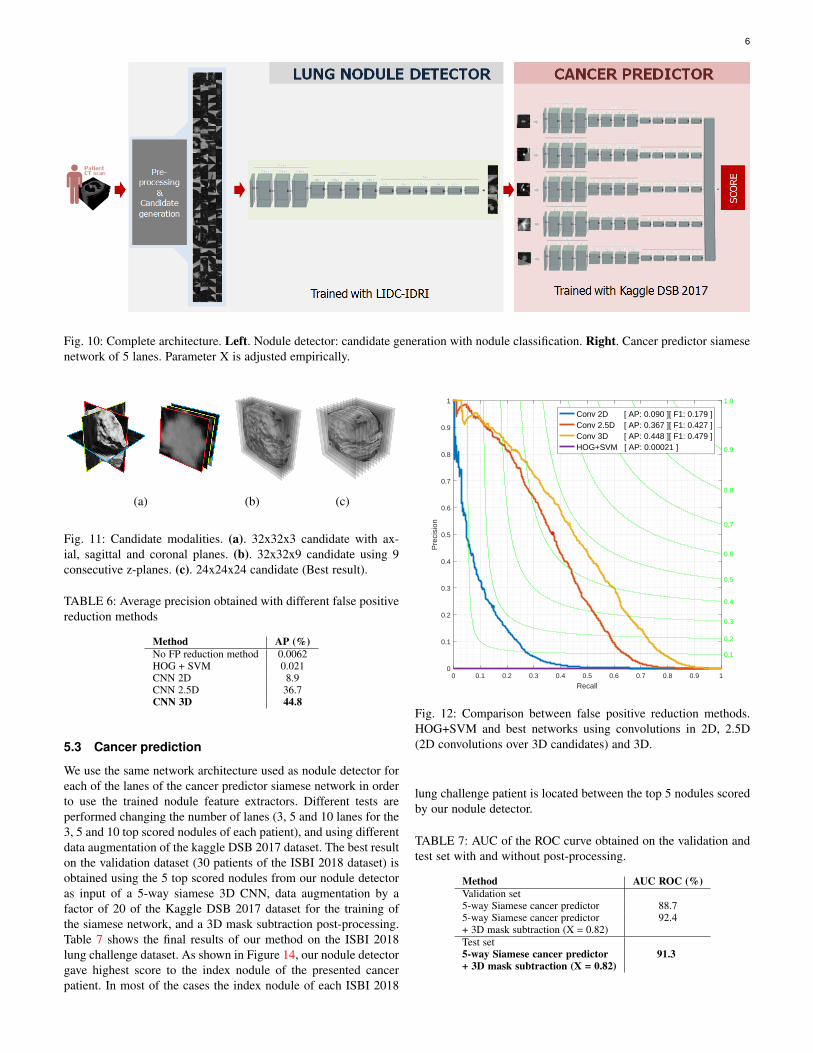
The precision increases considerably from the candidate ex-traction by training a convolutional neural network. We test 2Dand 3D convolutions. For the 2D convolutions, we used 32x32x3candidates as input for the network, using the axial, sagittal andcoronal planes centered on the calculated (Section 4.1.2) centroid,for the first case (See Figure 11a). We take this first approachfor its simplicity and low GPU memory usage. For the secondcase, we use 2D convolutions on 32x32x9 candidates, using the9 consecutive z-planes from the centroid (See Figure 11b). Inthis case, we want to include more spatial information of eachcandidate and increase the precision. The best results we obtainare using 3D convolutions with filters of size 3x3x3 and inputvolume size of 24x24x24. As shown in Figure 12, we increaseprecision for all recall values with the 3D CNN approach.
Table 4 shows results with different input size for the 3D CNNapproach. The three-dimensional convolutional neural network is
5
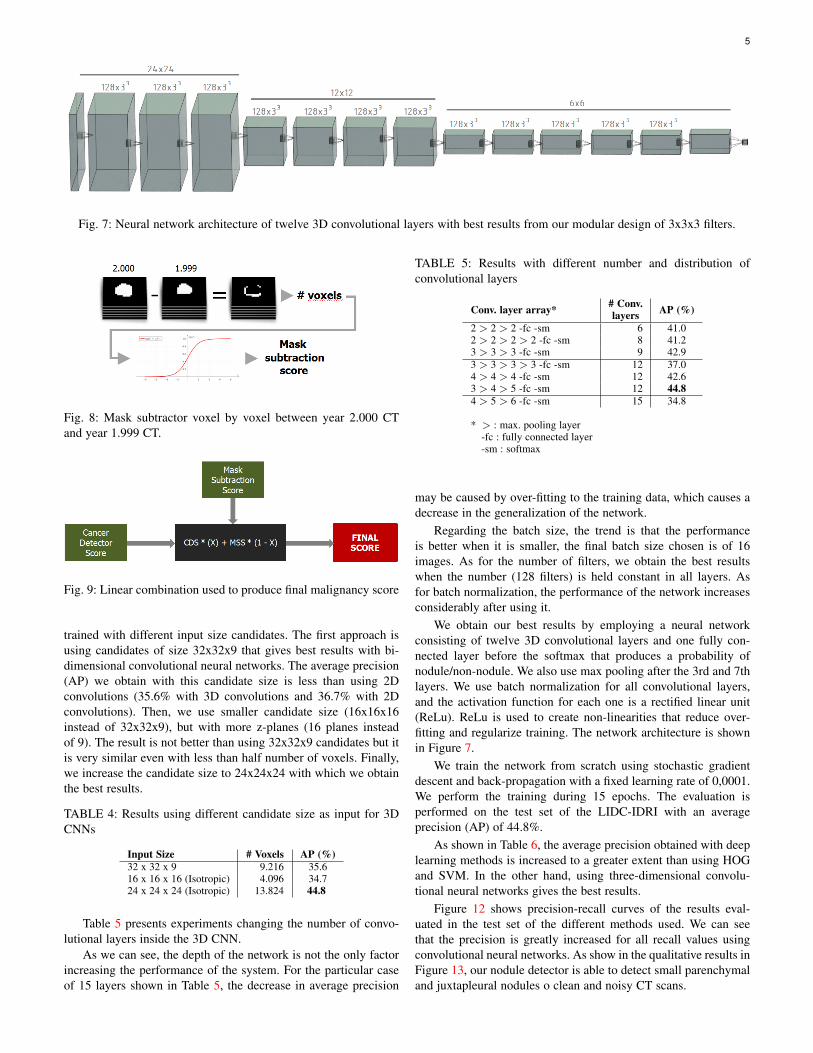
Fig. 7: Neural network architecture of twelve 3D convolutional layers with best results from our modular design of 3x3x3 filters.
Fig. 8: Mask subtractor voxel by voxel between year 2.000 CTand year 1.999 CT.
Fig. 9: Linear combination used to produce final malignancy score
trained with different input size candidates. The first approach isusing candidates of size 32x32x9 that gives best results with bi-dimensional convolutional neural networks. The average precision(AP) we obtain with this candidate size is less than using 2Dconvolutions (35.6% with 3D convolutions and 36.7% with 2Dconvolutions). Then, we use smaller candidate size (16x16x16instead of 32x32x9), but with more z-planes (16 planes insteadof 9). The result is not better than using 32x32x9 candidates but itis very similar even with less than half number of voxels. Finally,we increase the candidate size to 24x24x24 with which we obtainthe best results.
TABLE 4: Results using different candidate size as input for 3DCNNs
Input Size # Voxels AP (%)32 x 32 x 9 9.216 35.616 x 16 x 16 (Isotropic) 4.096 34.724 x 24 x 24 (Isotropic) 13.824 44.8
Table 5 presents experiments changing the number of convo-lutional layers inside the 3D CNN.
As we can see, the depth of the network is not the only factorincreasing the performance of the system. For the particular caseof 15 layers shown in Table 5, the decrease in average precision
TABLE 5: Results with different number and distribution ofconvolutional layers
Conv. layer array* # Conv.layers AP (%)
2 > 2 > 2 -fc -sm 6 41.02 > 2 > 2 > 2 -fc -sm 8 41.23 > 3 > 3 -fc -sm 9 42.93 > 3 > 3 > 3 -fc -sm 12 37.04 > 4 > 4 -fc -sm 12 42.63 > 4 > 5 -fc -sm 12 44.84 > 5 > 6 -fc -sm 15 34.8
* > : max. pooling layer-fc : fully connected layer-sm : softmax
may be caused by over-fitting to the training data, which causes adecrease in the generalization of the network.
Regarding the batch size, the trend is that the performanceis better when it is smaller, the final batch size chosen is of 16images. As for the number of filters, we obtain the best resultswhen the number (128 filters) is held constant in all layers. Asfor batch normalization, the performance of the network increasesconsiderably after using it.
We obtain our best results by employing a neural networkconsisting of twelve 3D convolutional layers and one fully con-nected layer before the softmax that produces a probability ofnodule/non-nodule. We also use max pooling after the 3rd and 7thlayers. We use batch normalization for all convolutional layers,and the activation function for each one is a rectified linear unit(ReLu). ReLu is used to create non-linearities that reduce over-fitting and regularize training. The network architecture is shownin Figure 7.
We train the network from scratch using stochastic gradientdescent and back-propagation with a fixed learning rate of 0,0001.We perform the training during 15 epochs. The evaluation isperformed on the test set of the LIDC-IDRI with an averageprecision (AP) of 44.8%.
As shown in Table 6, the average precision obtained with deeplearning methods is increased to a greater extent than using HOGand SVM. In the other hand, using three-dimensional convolu-tional neural networks gives the best results.
Figure 12 shows precision-recall curves of the results eval-uated in the test set of the different methods used. We can seethat the precision is greatly increased for all recall values usingconvolutional neural networks. As show in the qualitative results inFigure 13, our nodule detector is able to detect small parenchymaland juxtapleural nodules o clean and noisy CT scans.
6
Fig. 10: Complete architecture. Left. Nodule detector: candidate generation with nodule classification. Right. Cancer predictor siamesenetwork of 5 lanes. Parameter X is adjusted empirically.
(a) (b) (c)
Fig. 11: Candidate modalities. (a). 32x32x3 candidate with ax-ial, sagittal and coronal planes. (b). 32x32x9 candidate using 9consecutive z-planes. (c). 24x24x24 candidate (Best result).
TABLE 6: Average precision obtained with different false positivereduction methods
Method AP (%)No FP reduction method 0.0062HOG + SVM 0.021CNN 2D 8.9CNN 2.5D 36.7CNN 3D 44.8
5.3 Cancer prediction
We use the same network architecture used as nodule detector foreach of the lanes of the cancer predictor siamese network in orderto use the trained nodule feature extractors. Different tests areperformed changing the number of lanes (3, 5 and 10 lanes for the3, 5 and 10 top scored nodules of each patient), and using differentdata augmentation of the kaggle DSB 2017 dataset. The best resulton the validation dataset (30 patients of the ISBI 2018 dataset) isobtained using the 5 top scored nodules from our nodule detectoras input of a 5-way siamese 3D CNN, data augmentation by afactor of 20 of the Kaggle DSB 2017 dataset for the training ofthe siamese network, and a 3D mask subtraction post-processing.Table 7 shows the final results of our method on the ISBI 2018lung challenge dataset. As shown in Figure 14, our nodule detectorgave highest score to the index nodule of the presented cancerpatient. In most of the cases the index nodule of each ISBI 2018
0 0.1 0.2 0.3 0.4 0.5 0.6 0.7 0.8 0.9 1
Recall
0
0.1
0.2
0.3
0.4
0.5
0.6
0.7
0.8
0.9
1
Pre
cisi
on
0.1
0.2
0.3
0.4
0.5
0.6
0.7
0.8
0.9
1.0
Conv 2D [ AP: 0.090 ][ F1: 0.179 ]Conv 2.5D [ AP: 0.367 ][ F1: 0.427 ]Conv 3D [ AP: 0.448 ][ F1: 0.479 ]HOG+SVM [ AP: 0.00021 ]
Fig. 12: Comparison between false positive reduction methods.HOG+SVM and best networks using convolutions in 2D, 2.5D(2D convolutions over 3D candidates) and 3D.
lung challenge patient is located between the top 5 nodules scoredby our nodule detector.
TABLE 7: AUC of the ROC curve obtained on the validation andtest set with and without post-processing.
Method AUC ROC (%)Validation set5-way Siamese cancer predictor 88.75-way Siamese cancer predictor 92.4+ 3D mask subtraction (X = 0.82)Test set5-way Siamese cancer predictor 91.3+ 3D mask subtraction (X = 0.82)

7
Fig. 13: Qualitative results of high scored nodule detections.
Fig. 14: Qualitative results of a cancer and a non cancer patient onthe validation set of the ISBI 2018 lung challenge dataset. In thecancer patient our nodule detector gives highest score to the indexnodule of the patient. Nodules are arranged in decreasing order ofscore from left to right.
6 CONCLUSION
Although the problem of nodule detection is extremely unbalancedwith high intra-class variance, our approach is able to detect lungnodules and predict cancer effectively. We design a candidateproposal method with almost perfect recall. In addition, we train athree-dimensional convolutional neural network that successfullyclassifies nodules from non-nodules and increases the precision bya factor of 7.000 achieving a close-to-human performance in thischallenging task. For cancer prediction, we train a 5-way siamesecancer predictor which was ranked 1st place at the ISBI 2018Lung Nodule Malignancy Prediction challenge1.
1. ISBI 2018 lung cancer challenge results can be found at:http://isbichallenges.cloudapp.net/competitions/15#learn the details-news
REFERENCES
[1] American Cancer Society. Cancer Facts and Figures 2015, 2015. Atlanta:American Cancer Society. 1
[2] Data Science Bowl 2017. https://www.kaggle.com/c/data-science-bowl-2017, 2017. 4
[3] World Health Organization. Media Centre, Cancer.http://www.who.int/mediacentre/factsheets/fs297/en/, 2017. 1
[4] ISBI 2018 - Lung Nodule Malignancy Prediction, Based on SequentialCT Scans. http://isbichallenges.cloudapp.net/competitions, 2018. 1, 3, 4
[5] A. Esteva, et al. Dermatologist-level classification of skin cancer withdeep neural networks. Nature, 542:115–126, 2017. 1
[6] A. Oseas, et al. Automatic detection of solitary lung nodules using qualitythreshold clustering, genetic algorithm and diversity index. ArtifitialIntelligence in Medicine, 60:165–177, 2014. 2
[7] A. Setio, et al. Automatic detection of large pulmonary solid nodules inthoracic CT images. Medical Physics, 42:5642–5653, 2015. 2
[8] A.Tartar and A. Akan. A new method for pulmonary nodule detectionusing decision trees. 35th Annual International Conference of the IEEEEMBS, 2013. 2
[9] B. V. Ginneken, et al. Comparing and combining algorithms forcomputer-aided detection of pulmonary nodules in computed tomographyscans: The ANODE09 study. Medical Image Analysis, 14:707–722,2010. 1
[10] C. Jacobs, et al. Automatic detection of subsolid pulmonary nodulesin thoracic computed tomography images. Medical Image Analysis,18:374–384, 2014. 2
[11] C. Jacobs, et al. Automatic detection of subsolid pulmonary nodulesin thoracic computed tomography images. Medical Image Analysis,18:374–384, 2014. 2
[12] E. Torres, et al. Large scale validation of the M5L lung CAD onheterogeneous CT datasets. Medical Physics, 42:1477–1489, 2015. 2
[13] F. Ciompi, et al. Towards automatic pulmonary nodule management inlung cancer screening with deep learning. 2017. 2
[14] G. Perez and P. Arbelaez. Automated detection of lung noduleswith three-dimensional convolutional neural networks. Proc.SPIE,10572:10572 – 10572 – 10, 2017. 3
[15] K. Murphy, et al. A large scale evaluation of automatic pulmonary noduledetection in chest CT using local image features and k-nearest-neighbourclassification. Medical Image Analysis, 13:757–770, 2009. 2
[16] K. Song, et al. Using Deep Learning for Classification of Lung Noduleson Computed Tomography Images. 2015. 2
8
[17] M. Dolejsi and J. Kybic. Automatic two-step detection of pulmonarynodules. Proceedings of SPIE, 6514:3j–1–3j–12, 2007. 2
[18] M. Tan, et al. A novel computer-aided lung nodule detection system forCT images. Medical Physics, 38:5630–5645, 2011. 2
[19] N. Dalal, et al. Histograms of Oriented Gradients for Human Detection.CVPR, 2005. 4
[20] Q. Li. Recent progress in computer-aided diagnosis of lung nodules onthin-section CT. Comput Med Imaging Graph, 31:248–257, June 2007.1
[21] S. G. Armato III et al. The Lung Image Database Consortium LIDCand Image Database Resource Initiative (IDRI): A Completed ReferenceDatabase of Lung Nodules on CT Scans. Medical Physics, 38(2):915–931, 2011. 1, 2, 4
[22] S. Hussein, et al. Risk Stratification of Lung Nodules Using 3D CNN-Based Multi-task Learning. IPMI, 2017. 2
[23] S. O. O. Osman and O. N. Ucan. Lung nodule diagnosis using 3dtemplate matching. Comput. Biol. Med., 37:1167–1172, 2007. 2
[24] S.L.A. Lee and A.Z. Kouzani and E.J. Hu. Automated detection of lingnodules in computed tomography images: a review. Mach Vis Appl,23:151–163, 2012. 1
[25] U. Pastorino, et al. Annual or biennal CT screening versus observationin heavy smokers: 5-year results of the MILD trial. Euroopean Journalof Cancer Prevention, 2012. 2
[26] V. Sudha and P. Jayashree. Lung nodule detection in CT images usingthresholding and morphological operations. International Journal onEmerging Science and Engineering (IJESE), 1:17–21, Dec. 2012. 2
[27] W. Sun, et al. computer aided Lung Cancer Diagnosis with DeepLearning Algorithms. Research gate, 2016. 2