Embed Size (px)
Citation preview
1
Asphaltene Near-WellboreFormation Damage Modeling
By
Kosta J. Leontaritis, Ph.D.
AsphWax, Inc.
E-mail: [email protected]: www.asphwax.com
2
Asphaltene Near-WellboreFormation Damage Modeling
• Asphaltene-Induced Formation Damage
• Asphaltene Particle-Size Distribution (psd)
• Hydraulic Radius
• Permeability Impairment
• Porosity Loss
• Skin Factor
• Asphaltene Deposit Erosion
• Solution Algorithm
• FDModel Application
3
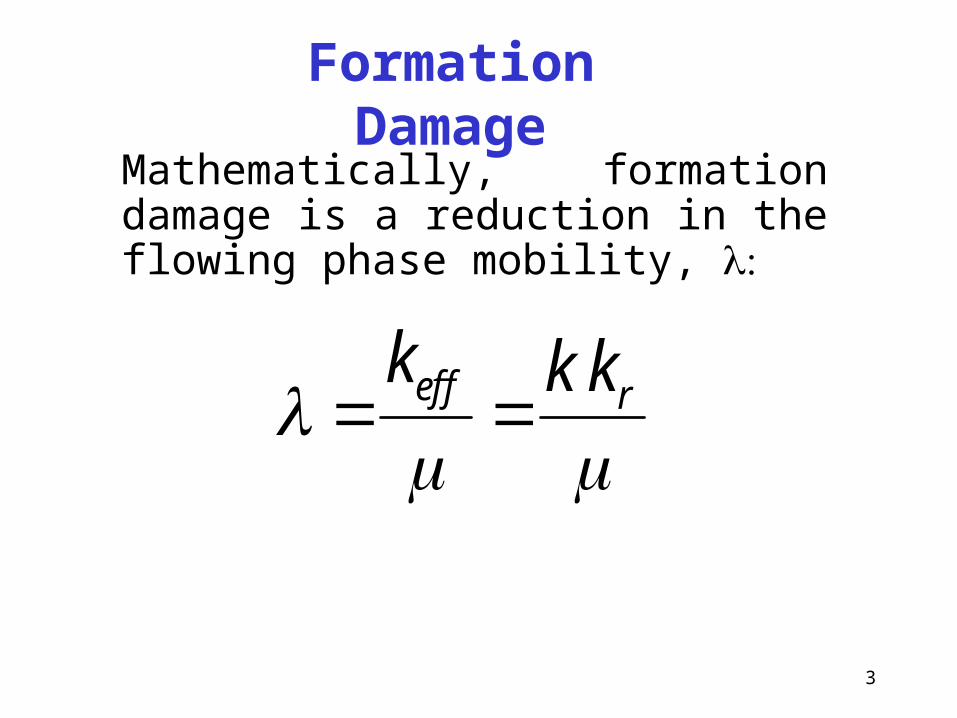
Formation DamageMathematically, formation damage is a reduction in the flowing phase mobility,
eff rk k k
4
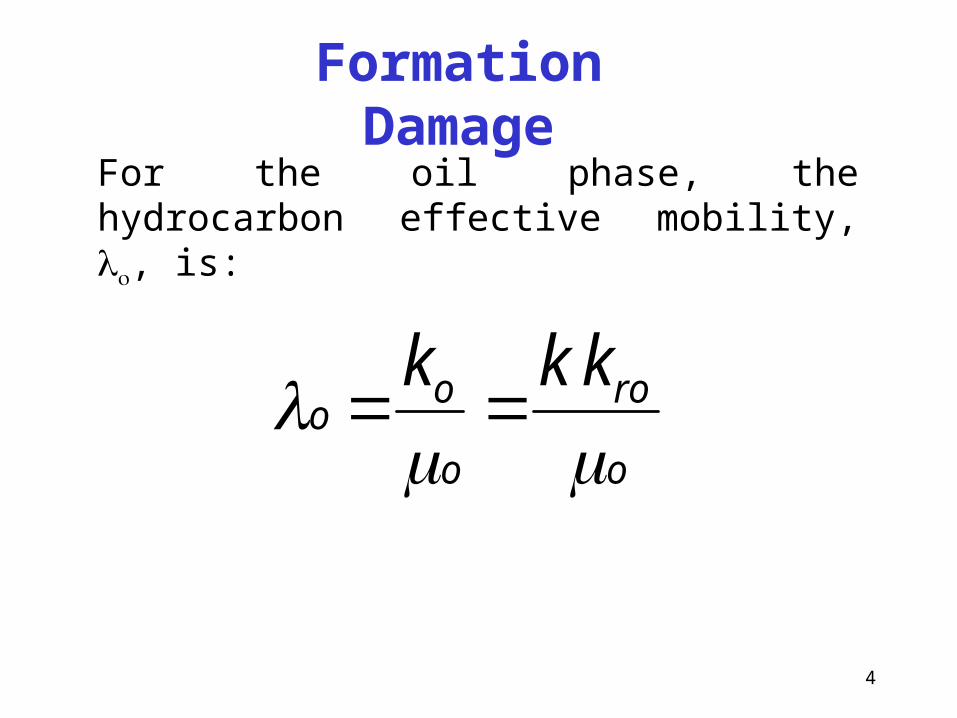
Formation Damage
For the oil phase, the hydrocarbon effective mobility, , is:
o
ro
o
oo
kkk

5
Asphaltene-Induced Formation Damage Mechanisms
• Absolute permeability impairment (k)
• Wettability Changes (kro)
• Viscosity (o) increase due to:
– Emulsion formation– Asphaltene particle increase near the borehole
6
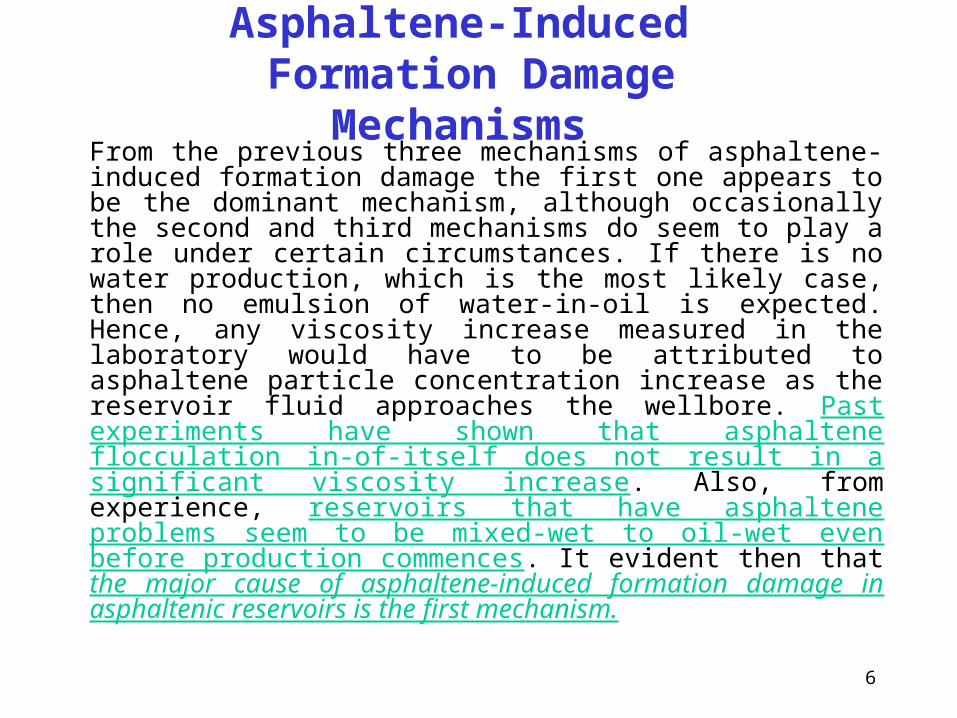
Asphaltene-Induced Formation Damage Mechanisms
From the previous three mechanisms of asphaltene-induced formation damage the first one appears to be the dominant mechanism, although occasionally the second and third mechanisms do seem to play a role under certain circumstances. If there is no water production, which is the most likely case, then no emulsion of water-in-oil is expected. Hence, any viscosity increase measured in the laboratory would have to be attributed to asphaltene particle concentration increase as the reservoir fluid approaches the wellbore. Past experiments have shown that asphaltene flocculation in-of-itself does not result in a significant viscosity increase. Also, from experience, reservoirs that have asphaltene problems seem to be mixed-wet to oil-wet even before production commences. It evident then that the major cause of asphaltene-induced formation damage in asphaltenic reservoirs is the first mechanism.
7
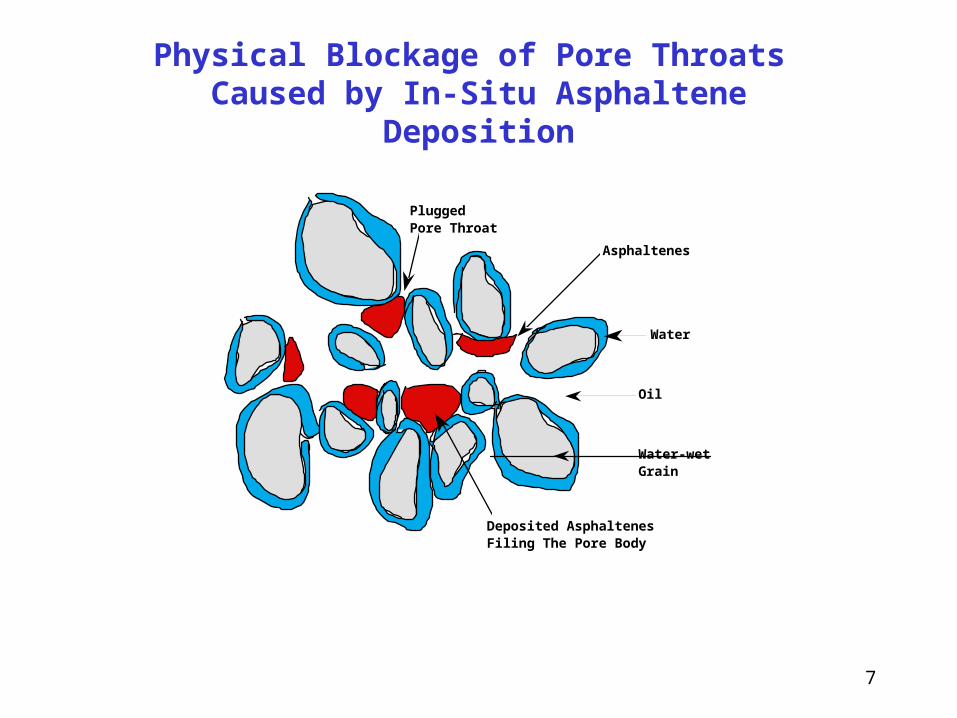
Physical Blockage of Pore Throats Caused by In-Situ Asphaltene Deposition
Asphaltenes
Water
Oil
Water-wet Grain
Plugged Pore Throat
Deposited Asphaltenes Filing The Pore Body

8
Reservoir characterization
Reservoir characterization is an enormous subject that consumes a lot of manpower energy in the oil industry. Some of the parameters that characterize a reservoir are:
1. k, permeability
2. , porosity
3. RQI, Reservoir Quality Index (mean hydraulic radius)
4. Fluid Saturations
5. Wettability
6. Electrical Properties (Formation Factor and Resistivity Index)

9
Formation Mean Hydraulic Radius
Pore throat radii of a formation depend on many reservoir parameters and they certainly vary from one formation to another. However, some general statements about the distribution of hydraulic radii of formations can be made:
1. Largest distribution is 0.001 to 100 micron
2. Usual distribution is 0.01 to 10 micron
3. Occasional distribution is 0.1 to 1 micron

10
Flocculated Asphaltene Micelles Forming an Asphaltene Particle
12 Å
45 Å
11
Obvious question: How can so small flocculated asphaltene particles plug pore throats of much larger size?
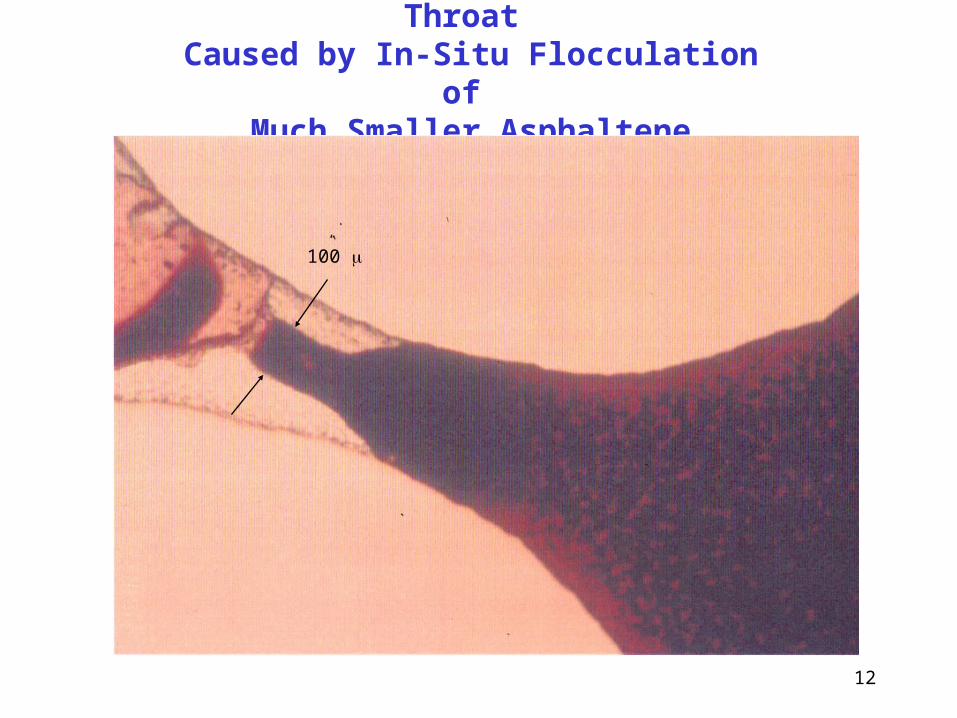
12
Physical Blockage of 100 Pore Throat Caused by In-Situ Flocculation of
Much Smaller Asphaltene Particles
100

13
Physical Blockage Caused byIn-Situ Asphaltene Deposition-Sandstone
14
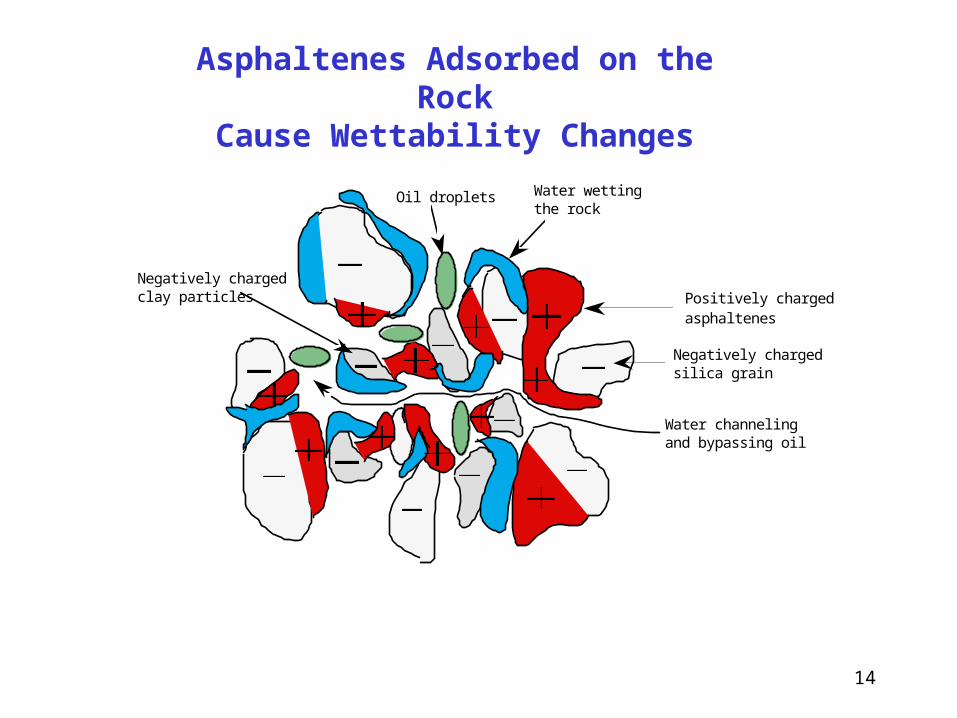
Asphaltenes Adsorbed on the RockCause Wettability Changes
Positively charged asphaltenes
Negatively charged clay particles
Water wetting the rock
Negatively charged silica grain
Water channeling and bypassing oil
Oil droplets
15
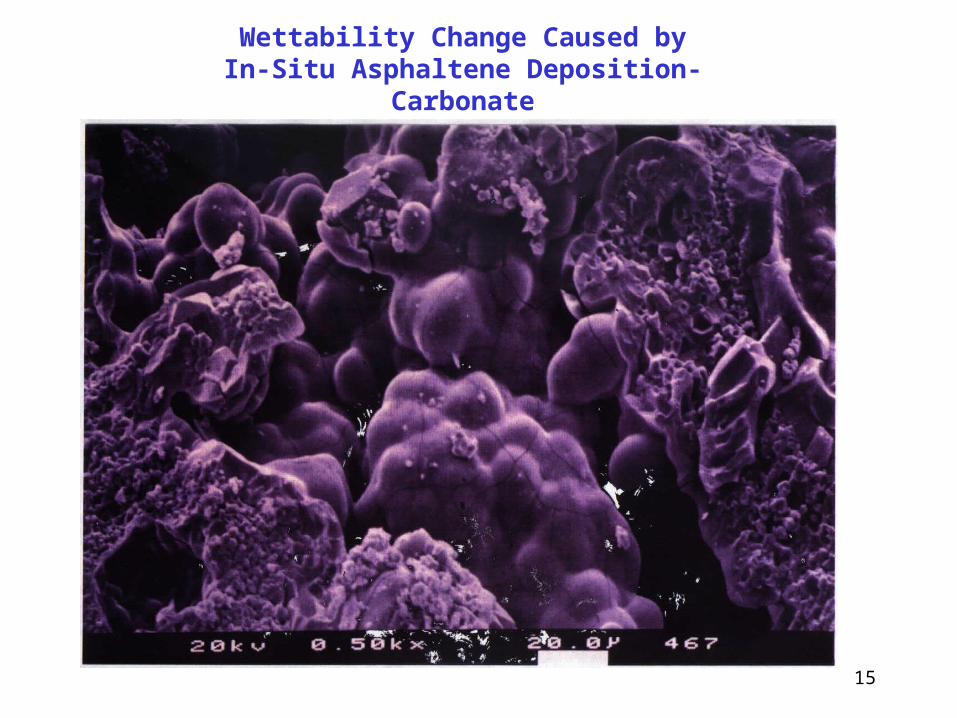
Wettability Change Caused byIn-Situ Asphaltene Deposition-Carbonate

16
Asphaltene-Induced Formation DamageNear Production Wells
• High draw-down
• Miscible-gas breakthrough
• Contact of oil with incompatible fluids during drilling, completion, stimulation, fracturing, and gravel packing operations
• Drop in reservoir pressure below onset of asphaltene pressure
17
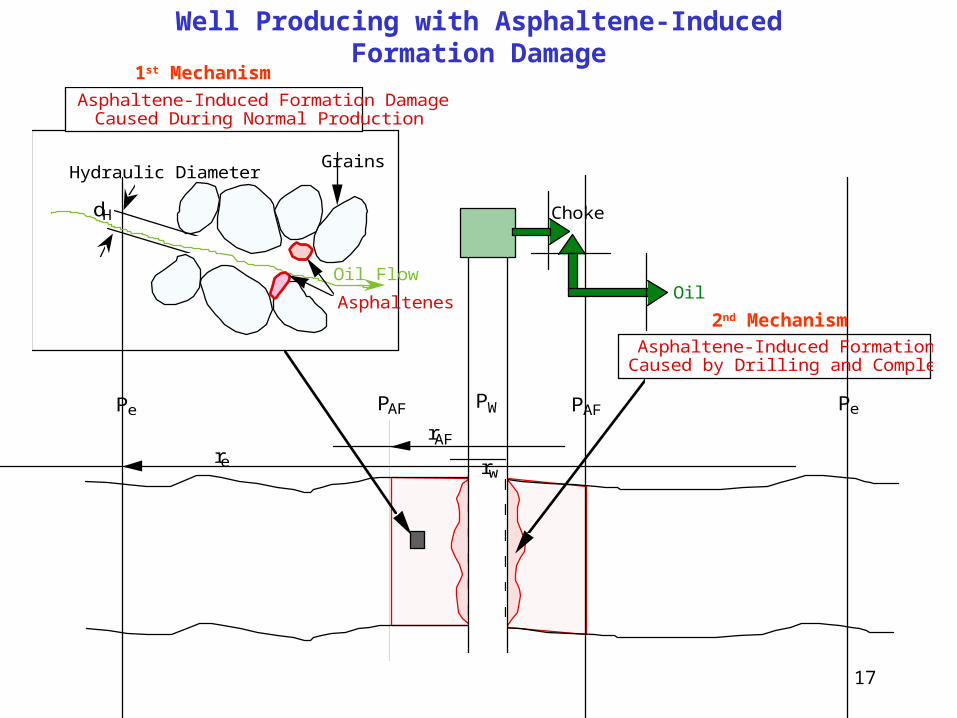
Well Producing with Asphaltene-Induced Formation Damage
re
Pe
rAF
PAF PAF Pe
rw
Choke
Hydraulic Diameter
dH
Asphaltenes
Grains
PW
Asphaltene-Induced Formation Damage Caused by Drilling and Completion Fluids
Asphaltene-Induced Formation Damage Caused During Normal Production
Oil FlowOil
2nd Mechanism
1st Mechanism

18
Well Producing withAsphaltene-Induced Formation Damage
re
rAF
rw
Pe PW
PAF
19
Well Producing withAsphaltene-Induced Formation Damage
The previous slide shows an aerial view of a producing well suffering from asphaltene-induced formation damage. The well is on flow control from the choke. As Pw drops, when asphaltene deposition starts, the choke opens so that the lower Pw can push all of the oil flow, q, through the tubing. Pe and PAF remain constant. However, when the choke is completely open both re and rAF begin to decrease due to the production rate decrease caused by the ever-increasing asphaltene-induced formation damage. When rAF becomes equal to rw no additional formation damage is incurred. This is referred to as "true steady state condition". The production rate at this state, however, may not be economical.
20
Asphaltene Near-WellboreFormation Damage Modeling
• Asphaltene-Induced Formation Damage
• Asphaltene Particle-Size Distribution (psd)
• Hydraulic Radius
• Permeability Impairment
• Porosity Loss
• Skin Factor
• Asphaltene Deposit Erosion
• Solution Algorithm
• FDModel Application

21
Asphaltene Deposition Envelope

22
Asphaltene psd at P=2975 psia & T=122 °F
23
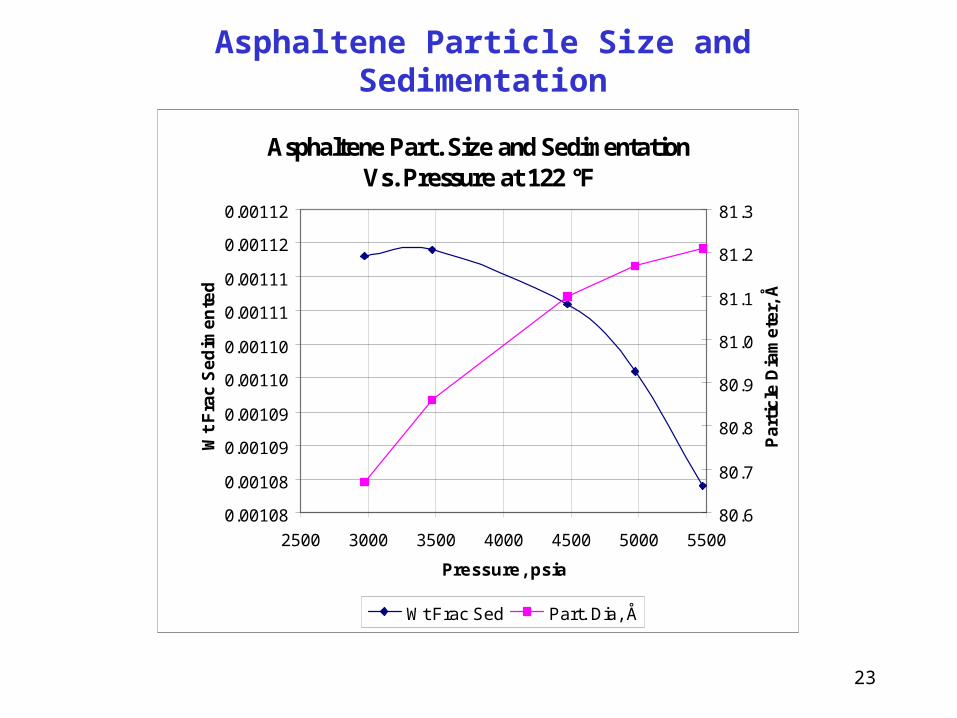
Asphaltene Particle Size and Sedimentation
Asphaltene Part. Size and Sedimentation Vs. Pressure at 122 °F
0.00108
0.00108
0.00109
0.00109
0.00110
0.00110
0.00111
0.00111
0.00112
0.00112
2500 3000 3500 4000 4500 5000 5500
Pressure, psia
Wt
Fra
c S
ed
ime
nte
d
80.6
80.7
80.8
80.9
81.0
81.1
81.2
81.3
Pa
rtic
le D
iam
ete
r, Å
Wt Frac Sed Part. Dia, Å

24
Asphaltene Near-WellboreFormation Damage Modeling
• Asphaltene-Induced Formation Damage
• Asphaltene Particle-Size Distribution (psd)
• Hydraulic Radius
• Permeability Impairment
• Porosity Loss
• Skin Factor
• Asphaltene Deposit Erosion
• Solution Algorithm
• FDModel Application

25
Well Producing with Asphaltene-Induced Formation Damage
re
Pe
rAF
PAF PAF Pe
rw
Choke
Hydraulic Diameter
dH
Asphaltenes
Grains
PW
Asphaltene-Induced Formation Damage Caused by Drilling and Completion Fluids
Asphaltene-Induced Formation Damage Caused During Normal Production
Oil FlowOil
2nd Mechanism
1st Mechanism

26
The hydraulic radius of a single flow channel is given by:
PPH L
S
LL
LS
channelflowofareaSurface
channelflowofvolumeVoidr
Where:– S = x-sectional area of flow channel
– LP = wetted perimeter of flow channel
– L = length of flow channel
Hydraulic Radius – Single Channel
27
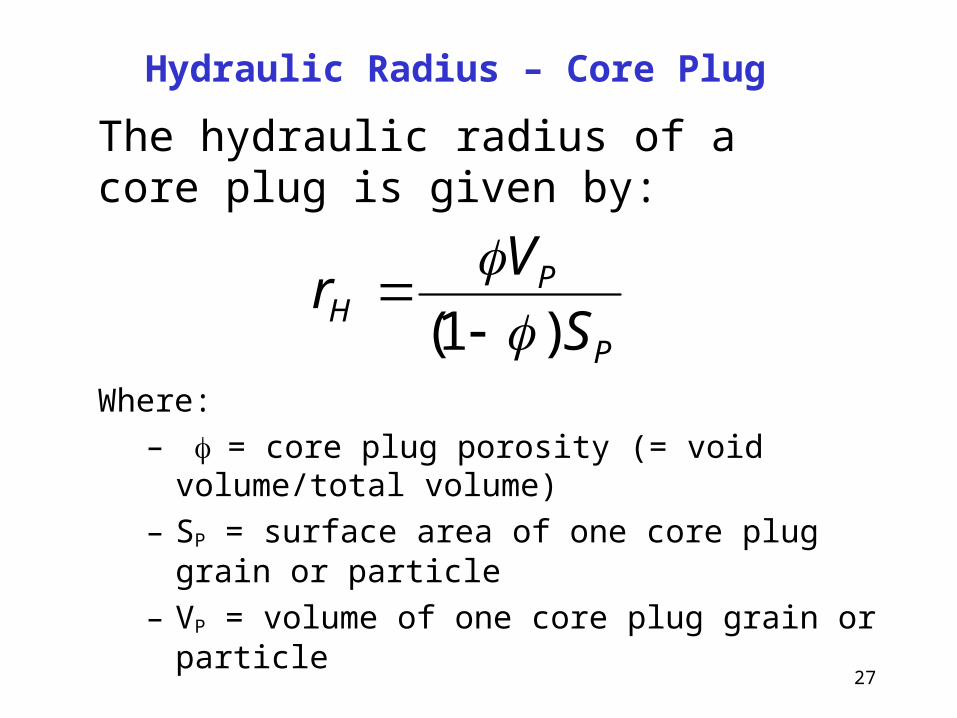
The hydraulic radius of a core plug is given by:
Where:
– = core plug porosity (= void volume/total volume)
– SP = surface area of one core plug grain or particle
– VP = volume of one core plug grain or particle
P
PH S
Vr
)1(
Hydraulic Radius – Core Plug
28
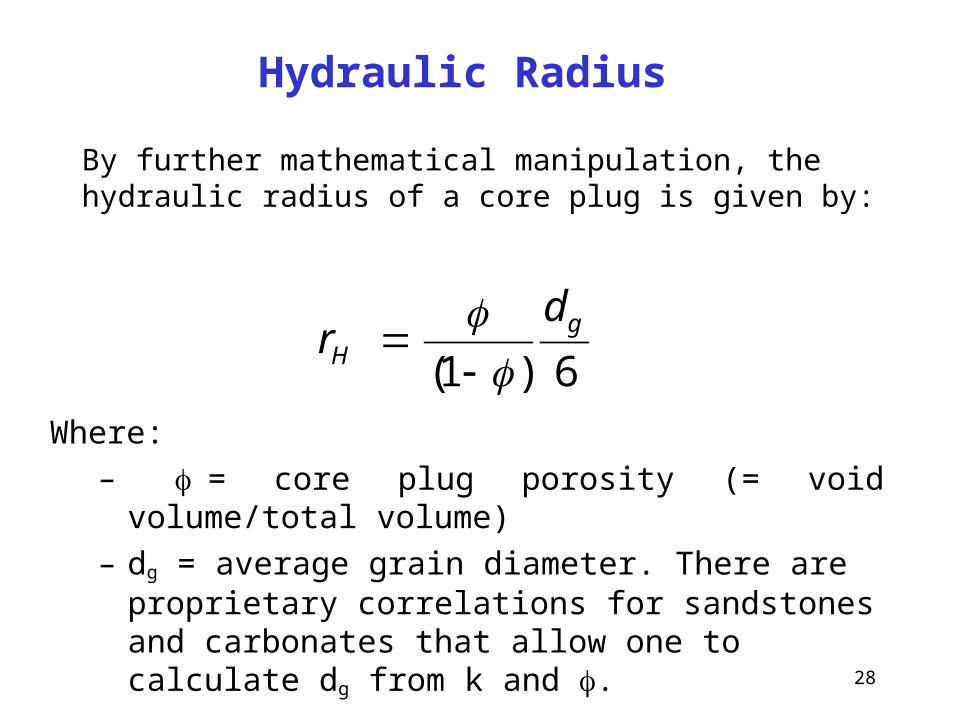
By further mathematical manipulation, the hydraulic radius of a core plug is given by:
Where:
– = core plug porosity (= void volume/total volume)
– dg = average grain diameter. There are proprietary correlations for sandstones and carbonates that allow one to calculate dg from k and .
(1 ) 6g
H
dr
Hydraulic Radius

29
Mean Hydraulic Pore-Throat Radius
12( )
Re , , 0.0314H
k mdr servoir Quality Index RQI micron
A simple, quick and dirty way to estimate the Mean Hydraulic Pore-Throat Radius is via the following equation:
30
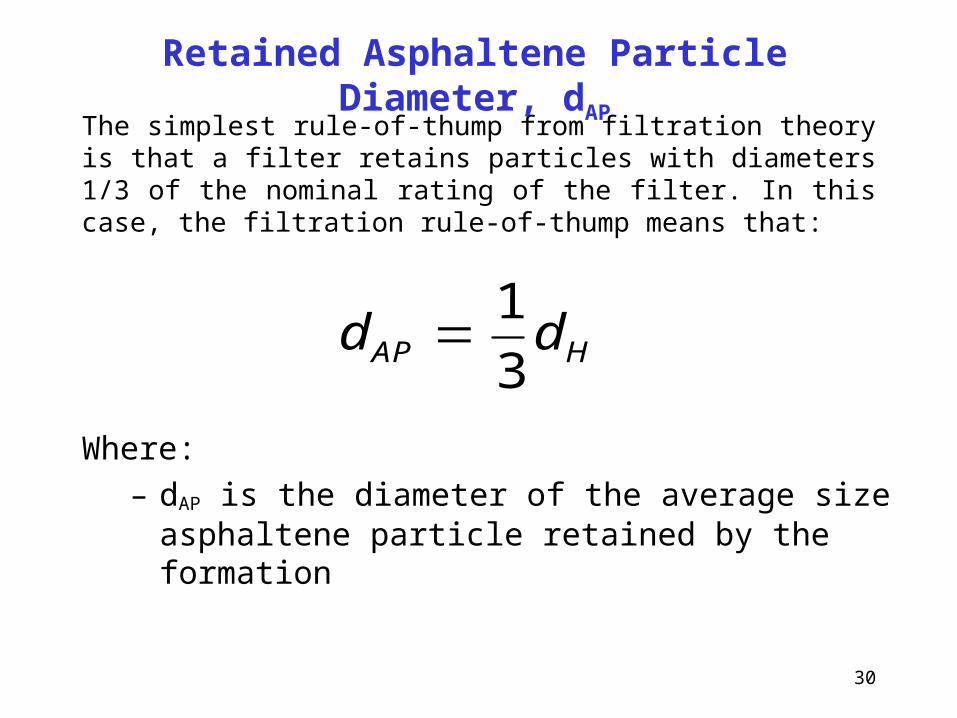
The simplest rule-of-thump from filtration theory is that a filter retains particles with diameters 1/3 of the nominal rating of the filter. In this case, the filtration rule-of-thump means that:
Where:
– dAP is the diameter of the average size asphaltene particle retained by the formation
1
3AP Hd d
Retained Asphaltene Particle Diameter, dAP

31
Physical Blockage of 100 Pore Throat Caused by In-Situ Flocculation of
Much Smaller Asphaltene Particles
100 m

32
In the more general case, however, a more appropriate definition for dAP is:
Where:– is a constant that accounts for the variation of the size of the
asphaltene particle filtered by the formation. varies from 0 to 1.
– dH is the average hydraulic diameter of the producing horizon
HAP dd
Retained Asphaltene Particle Diameter, dAP

33
Asphaltene Near-WellboreFormation Damage Modeling
• Asphaltene-Induced Formation Damage
• Asphaltene Particle-Size Distribution (psd)
• Hydraulic Radius
• Permeability Impairment
• Porosity Loss
• Skin Factor
• Asphaltene Deposit Erosion
• Solution Algorithm
• FDModel Application

34
Darcy's equation for steady state radial flow is:
Where:– is viscosity, centipoise
– q is reservoir barrels per day
– k is permeability, Darcy
– P is pressure, psia
– r is distance from center of wellbore, feet
)(127.1)(
rAk
qr
r
P
initial
35
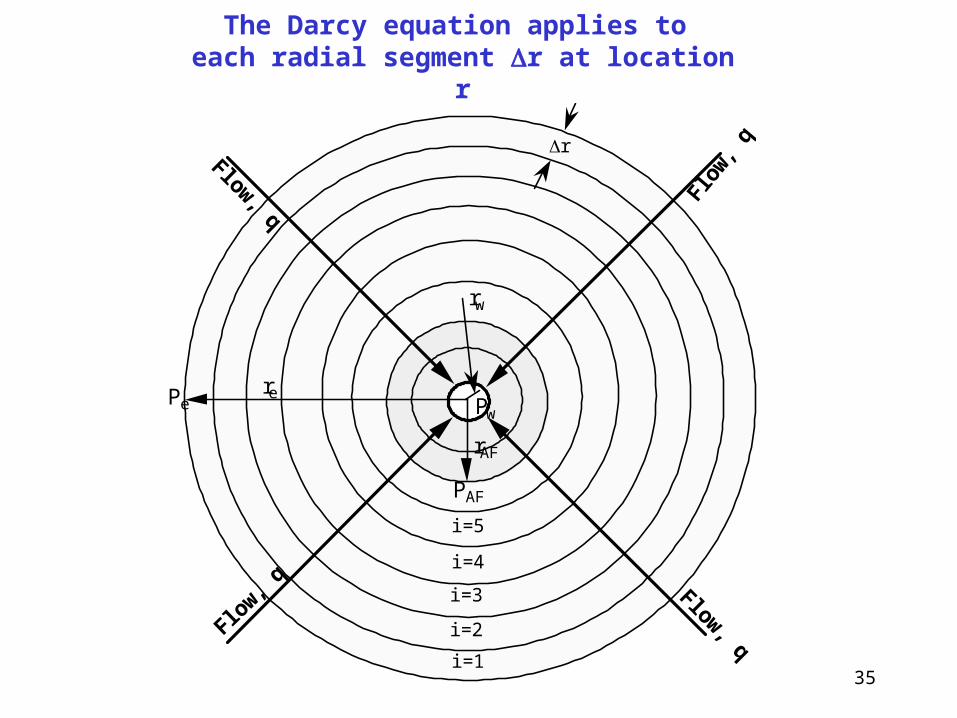
The Darcy equation applies to each radial segment r at location r
re
rAF
rw
r
PAF
Pe Pw
i=1
i=2
i=3
i=4
i=5

36
At time equal to zero, i.e., before any asphaltene plugging, the total area available to flow at a distance r from the center of the wellbore is:
Where:– h is the net thickness of the formation or the net pay zone
– is the initial average effective porosity of the formation
initialinitial hrrA 2)(
Initial Area Available to Flow Ainitial(r)

37
The net area available to flow at location r, after asphaltene plugging for time t, is obtained as follows:
Where:
– AAP(r,t) is the total area plugged by asphaltene particles at location r at time t. The calculation of AAP(r,t) is described next.
),()(),( trArAtrA APinitialnet
Net Area Available to Flow Anet(r,t)

38
The total area plugged by asphaltene particles at location r at time t is AAP(r,t):
Where:– AAP(r,j) , is the incremental area plugged by
asphaltene particles at location r within time interval j
– N is the number of time intervals
1
( , ) ( , )N
AP APj
A r t A r j
Total Area Plugged AAP(r,t)

39
Very Effective Pore-Throat Plugging by Least Number of Asphaltene Particles
Pore-Throat
Asphaltene Particle
Calculation of Incremental Area Plugged AAP(r,j)
40
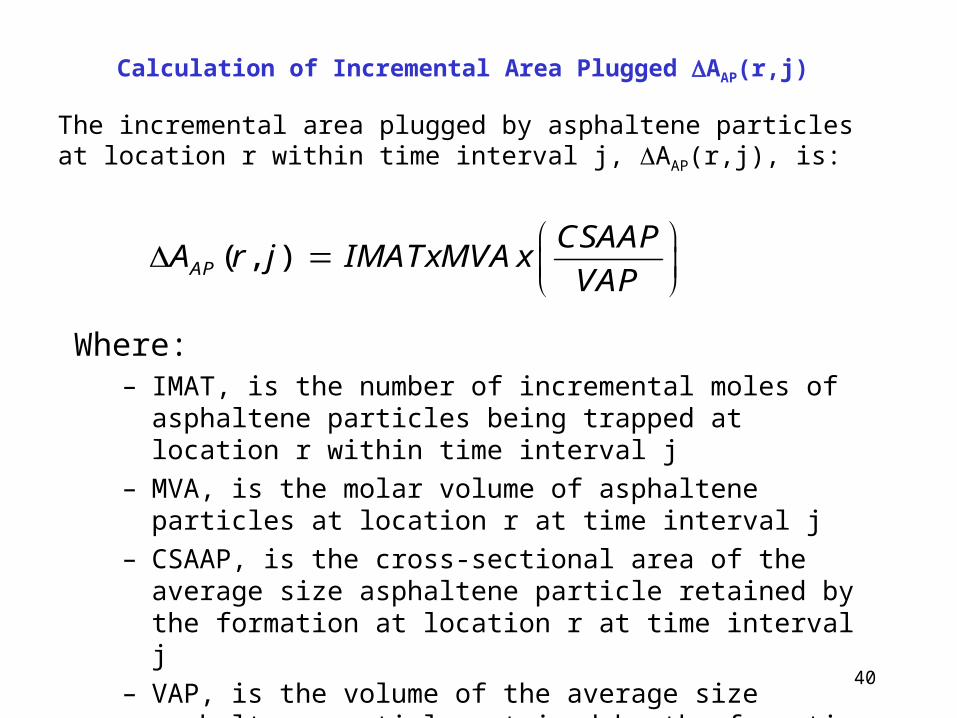
The incremental area plugged by asphaltene particles at location r within time interval j, AAP(r,j), is:
( , )AP
CSAAPA r j IMATxMVA x
VAP
Where:– IMAT, is the number of incremental moles of asphaltene particles
being trapped at location r within time interval j
– MVA, is the molar volume of asphaltene particles at location r at time interval j
– CSAAP, is the cross-sectional area of the average size asphaltene particle retained by the formation at location r at time interval j
– VAP, is the volume of the average size asphaltene particle retained by the formation at location r at time interval j
Calculation of Incremental Area Plugged AAP(r,j)

41
The equation giving the incremental area plugged by asphaltene particles at location r within time interval j, AAP(r,j), is:
2
3
4 ( )2( , ) ( , ) ( , )
4( )
3 2
AP
AP trap AAP
d
A r j AP r j r jd
Where:– APtrap(r,t), is the number of incremental moles of asphaltene
particles being trapped at location r within time interval j
– A(r,j) is the molar volume of asphaltene particles at location r at time interval j
– dAP, the diameter of the average size asphaltene particle retained by the formation
Calculation of Incremental Area Plugged AAP(r,j)

42
After rearrangement and substitution, the equation giving the incremental area plugged by asphaltene particles at location r within time interval j, AAP(r,j), is:
Where:– APtrap(r,t), is the number of incremental moles of asphaltene
particles being trapped at location r within time interval j
– A(r,j) is the molar volume of asphaltene particles at location r at time interval j
– dAP, the diameter of the average size asphaltene particle retained by the formation
APAtrapAP d
jrjrAPjrA6
),(),(),(
Calculation of Incremental Area Plugged AAP(r,j)

43
Substitute into the equation giving the total area plugged by
asphaltene particles at location r and time t, AAP(r,t), to get:
N
j APAtrap
N
jAPAP d
jrjrAPjrAtrA11
6),(),(),(),(
Total Area Plugged AAP(r,t)

44
Hence, to calculate the total area plugged by asphaltene particles at location r at time t, AAP(r,t), we need the following:
– dAP, the diameter of the average size asphaltene particle retained by the formation
– A(r,j), the molar volume of average size asphaltene particles at location r at time increment j
– APtrap(r,j), is the number of incremental moles of asphaltene particles being trapped at location r within time interval j
Total Area Plugged AAP(r,t)
45
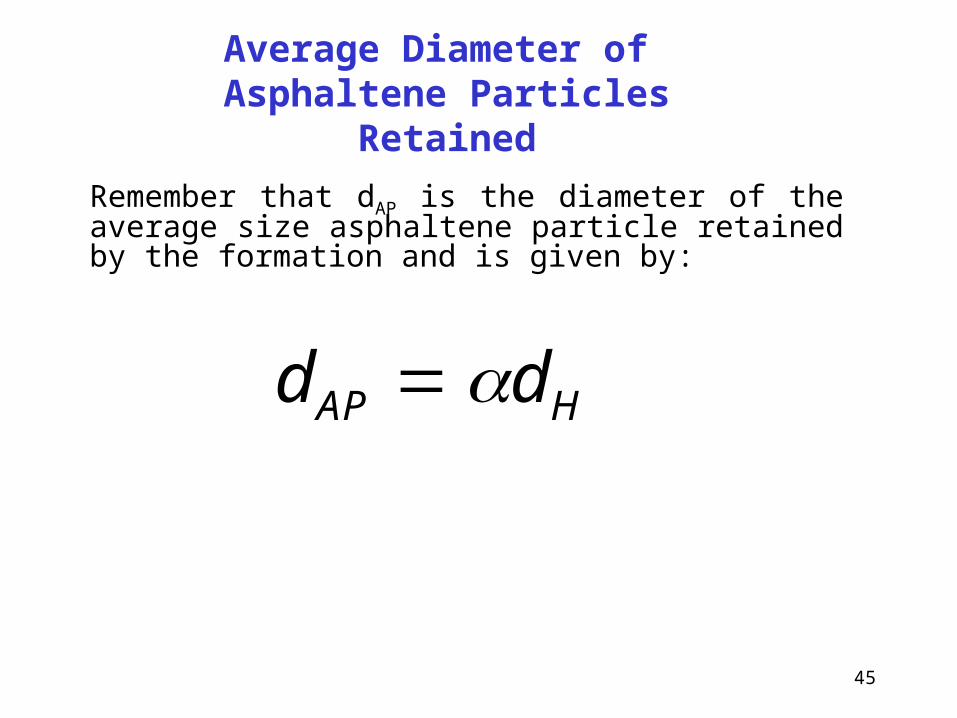
Remember that dAP is the diameter of the average size asphaltene particle retained by the formation and is given by:
AP Hd d
Average Diameter of Asphaltene Particles Retained
46
A(r,j), the molar volume of asphaltene particles at location r at time interval j, is calculated by the phase behavior model. In this case, it is calculated by the TC Model, AsphWax’s asphaltene phase behavior simulator.
Molar Volume of Asphaltene Particles Retained
47
Incremental Moles of Asphaltene Particles Retained
APtrap(r,j), the incremental moles of asphaltene particles retained, is obtained as follows:
– At the pressure and temperature prevailing at location r at time t, the asphaltene phase behavior model (TCModel) calculates the moles of asphaltene particles per mole of reservoir fluid, s, and their psd, f(x), where x is the asphaltene particle diameter.
– f(x) is then integrated from x = dAP to x = to obtain the moles of asphaltene particles being trapped, ftrap, per mole of reservoir fluid at location r within time interval t.
– The total number of moles of reservoir fluid, MRF, flowing at location r is obtained by flowing the well at flowrate q for some specified production time interval t.
48
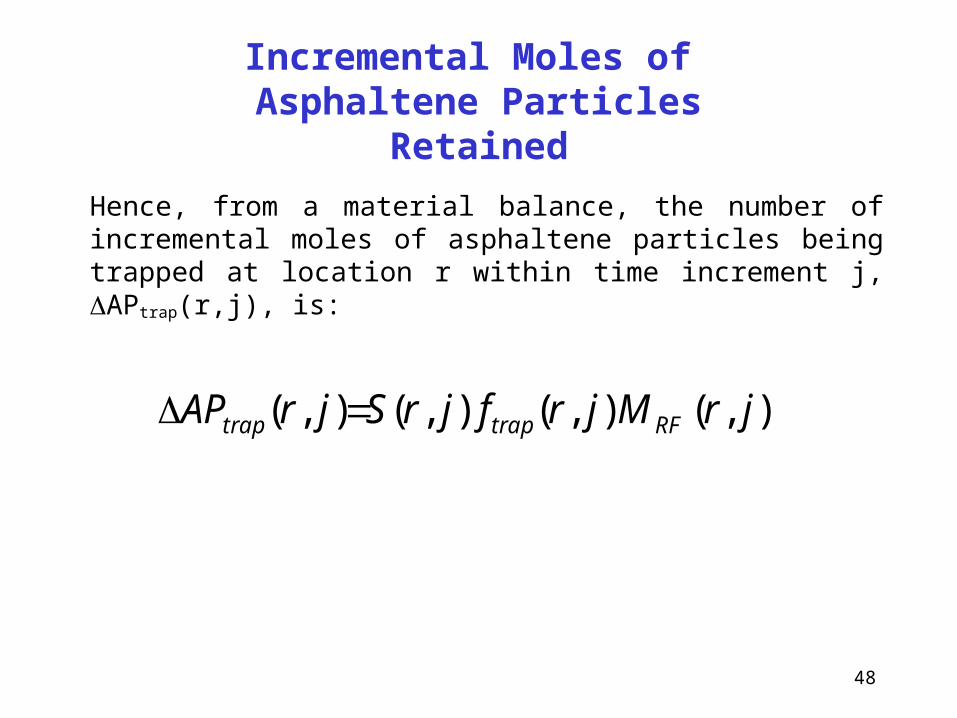
Hence, from a material balance, the number of incremental moles of asphaltene particles being trapped at location r within time increment j, APtrap(r,j), is:
),(),(),(),( jrMjrfjrSjrAP RFtraptrap
Incremental Moles of Asphaltene Particles Retained
49
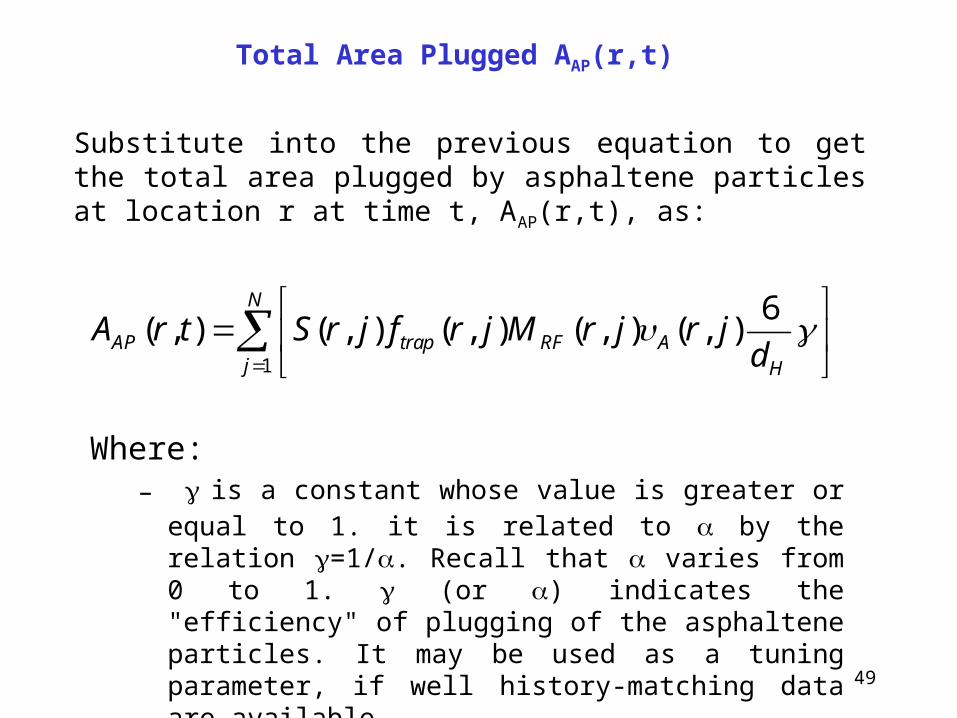
Substitute into the previous equation to get the total area plugged by asphaltene particles at location r at time t, AAP(r,t), as:
Where:– is a constant whose value is greater or equal to 1. it is related
to by the relation =1/. Recall that varies from 0 to 1. (or ) indicates the "efficiency" of plugging of the asphaltene particles. It may be used as a tuning parameter, if well history-matching data are available.
1
6( , ) ( , ) ( , ) ( , ) ( , )
N
AP trap RF Aj H
A r t S r j f r j M r j r jd
Total Area Plugged AAP(r,t)

50
It is convenient to introduce the "Degree of Damage", DOD, at each location r at time t. DOD may be defined as:
)(
),(),(
rP
trPtrDOD
initial
dam
"Degree of Damage", DOD

51
Using the definition of DOD and applying Darcy’s law to both the damaged and initial situation one gets:
),()(127.1
),(*)(),( trDODrAk
qtrDODrPtrP
initialinitialinitialdam
Permeability Impairment
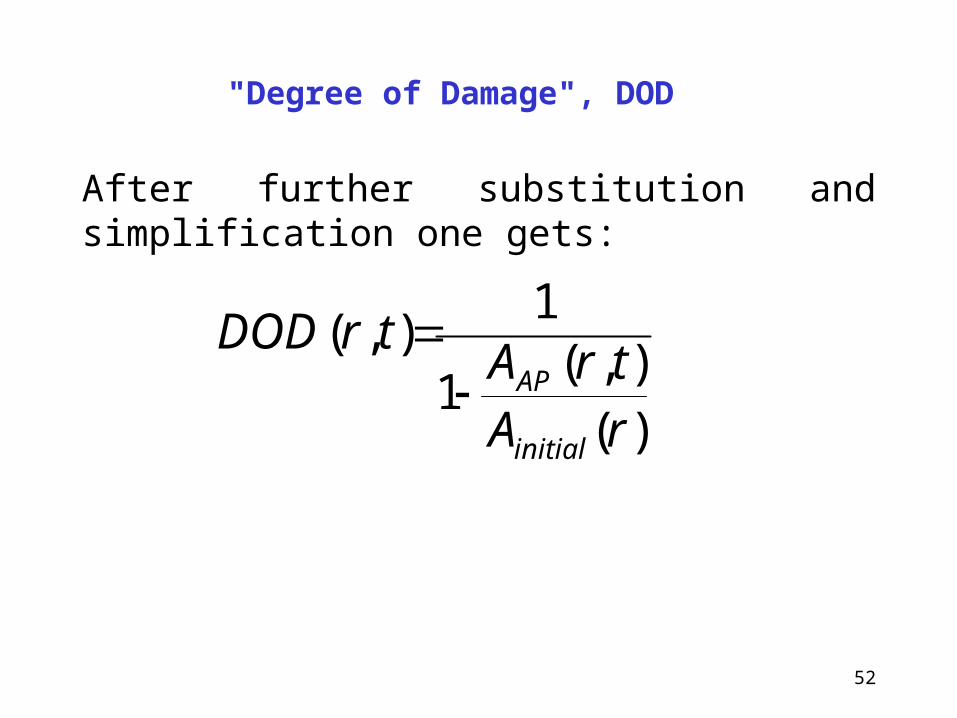
52
After further substitution and simplification one gets:
)(
),(1
1),(
rA
trAtrDOD
initial
AP
"Degree of Damage", DOD

53
The previous equations yield the definition of damaged permeability:
( , )( , ) (1 )
( , ) ( )initial AP
dam initialinitial
k A r tk r t k
DOD r t A r
The damaged permeability, kdam(r,t), at location r and time t is used in the Darcy equation to calculate the pressure drop in the formation. Although this gives the appearance that permeability is treated as a point property, in reality it is not. k does not really refer to a point at distance r but rather to an increment r at distance r from the center of the wellbore.
Permeability Impairment
54
Asphaltene Near-WellboreFormation Damage Modeling
• Asphaltene-Induced Formation Damage
• Asphaltene Particle-Size Distribution (psd)
• Hydraulic Radius
• Permeability Impairment
• Porosity Loss
• Skin Factor
• Asphaltene Deposit Erosion
• Solution Algorithm
• FDModel Application

55
Porosity loss is modeled in a similar way to permeability. Using the definition of porosity we have:
( , )( , )
( )net
dam
Void Volume r tr t
Total Volume r
( )( )
( )initial
initial
Void Volume rr
Total Volume r
Porosity Loss

56
Dividing both sides of the above equations, one gets:
( , ) ( , ) ( , ) ( ) ( , ) 1
( ) ( ) ( ) ( )dam net net initial AP
initial initial initial initial
r t Void Volume r t A r t A r A r t
r Void Volume r A r A r DOD
))(
),(1(
),(),(
rA
trA
trDODtr
initial
APinitial
initialdam
If the radial interval r is taken very small we can assume that the area loss at this interval due to asphaltene flocculation is uniform across its thickness r. This implies that DOD(r,t), as previously defined, is an average value for the whole increment thickness r at location r.
Porosity Loss
57
Asphaltene Near-WellboreFormation Damage Modeling
• Asphaltene-Induced Formation Damage
• Asphaltene Particle-Size Distribution (psd)
• Hydraulic Radius
• Permeability Impairment
• Porosity Loss
• Skin Factor
• Asphaltene Deposit Erosion
• Solution Algorithm
• FDModel Application

58
The familiar van Everdingen-Hurst skin factor is defined as:
q
hktPts initial
s
08.7)()(
Skin Factor
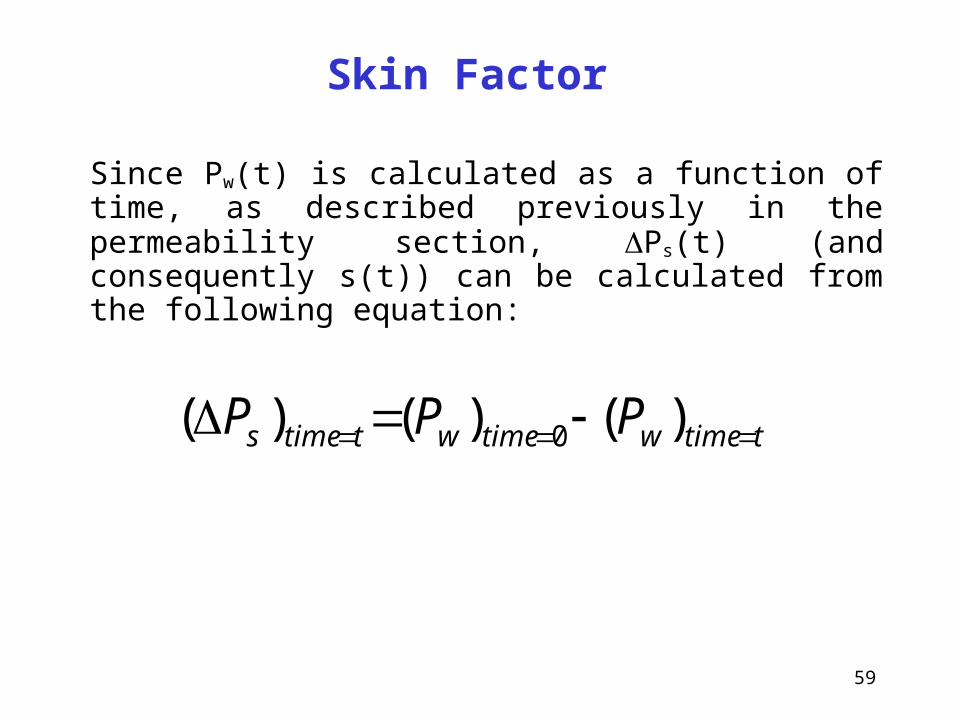
59
Since Pw(t) is calculated as a function of time, as described previously in the permeability section, Ps(t) (and consequently s(t)) can be calculated from the following equation:
ttimewtimewttimes PPP )()()( 0
Skin Factor
60
Asphaltene Near-WellboreFormation Damage Modeling
• Asphaltene-Induced Formation Damage
• Asphaltene Particle-Size Distribution (psd)
• Hydraulic Radius
• Permeability Impairment
• Porosity Loss
• Skin Factor
• Asphaltene Deposit Erosion
• Solution Algorithm
• FDModel Application
61
Asphaltene Deposit Erosion
As plugging is occurring inside the asphaltene-inflicted formation, the interstitial velocity increases continuously at constant production rate (constant rate accomplished by opening the choke). If the system continues to produce undisturbed, the interstitial velocity eventually becomes equal to and surpasses the critical velocity at which point previously deposited asphaltene particles begin to move with the flow. At further velocity increases the rate of erosion becomes equal to the rate of deposition, hence, no additional asphaltene damage occurs at that location. Such a “pseudo-steady state condition” has been observed in the field in wells undergoing asphaltene deposition in the near-wellbore formation. The production rate at this steady state condition, however, may not be (and generally it is not) economically acceptable or viable. In general, when the steady state condition is reached or even before then, the well requires stimulation to restore production at economical rates. It should be noted that some of the smaller pore throats may plug up completely. Whereas the bigger pore throats may reach the steady state condition caused by the deposit erosion rate being equal to the deposition rate.

62
Well Producing with Asphaltene-Induced Formation Damage
re
Pe
rAF
PAF PAF Pe
rw
Choke
Hydraulic Diameter
dH
Asphaltenes
Grains
PW
Asphaltene-Induced Formation Damage Caused by Drilling and Completion Fluids
Asphaltene-Induced Formation Damage Caused During Normal Production
Oil FlowOil
2nd Mechanism
1st Mechanism

63
At the previously described pseudo-steady state condition, the net area available to flow Anet(r,t) corresponds to some fraction of the initial area available to flow Ainitial(r). The following equation is recommended for achieving steady state condition in the simulation:
* ( , )( , ) ( ) ( , ) ( )
( , )net initial AP initial
A B DOD r tA r t A r A r t A r
DOD r t
Asphaltene Deposit Erosion

64
There are certain salient features of the previous equation that make it suitable for representing asphaltene particle erosion at the steady state condition. First, it is evident that as the degree of damage, DOD, increases the value of A(r,t) approaches B*Ainitial(r). This is equivalent to saying that:
Asphaltene Deposit Erosion
lim ( , ) ( )*initialDODA r t A r B
Hence, the value of constant B is limited to 0 < B < 1. B places a limit on the maximum damage that can occur at location r. For those r segments or locations that reach the maximum deposition at some time t, DOD will remain constant after time t. This will show as a decline in the damage rate increase, such as a decline in the skin factor increase, when a segment reaches its maximum deposition level specified by B. Factor B can be used for history-matching data, along with constant .
65
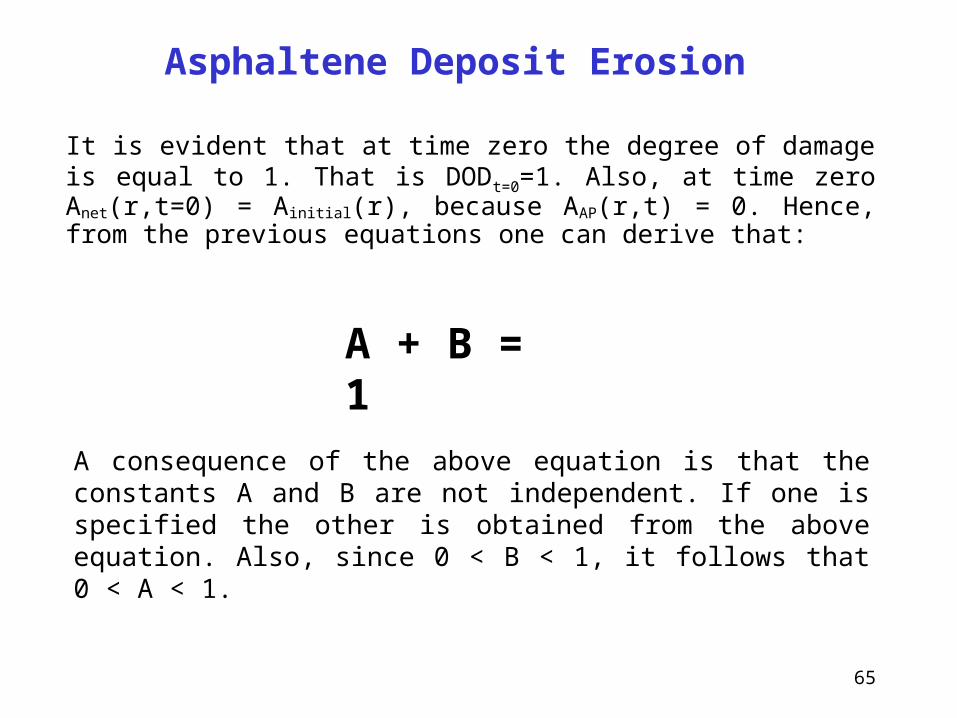
It is evident that at time zero the degree of damage is equal to 1. That is DODt=0=1. Also, at time zero Anet(r,t=0) = Ainitial(r), because AAP(r,t) = 0. Hence, from the previous equations one can derive that:
Asphaltene Deposit Erosion
A + B = 1
A consequence of the above equation is that the constants A and B are not independent. If one is specified the other is obtained from the above equation. Also, since 0 < B < 1, it follows that 0 < A < 1.

66
Asphaltene Near-WellboreFormation Damage Modeling
• Asphaltene-Induced Formation Damage
• Asphaltene Particle-Size Distribution (psd)
• Hydraulic Radius
• Permeability Impairment
• Porosity Loss
• Skin Factor
• Asphaltene Deposit Erosion
• Solution Algorithm
• FDModel Application
67
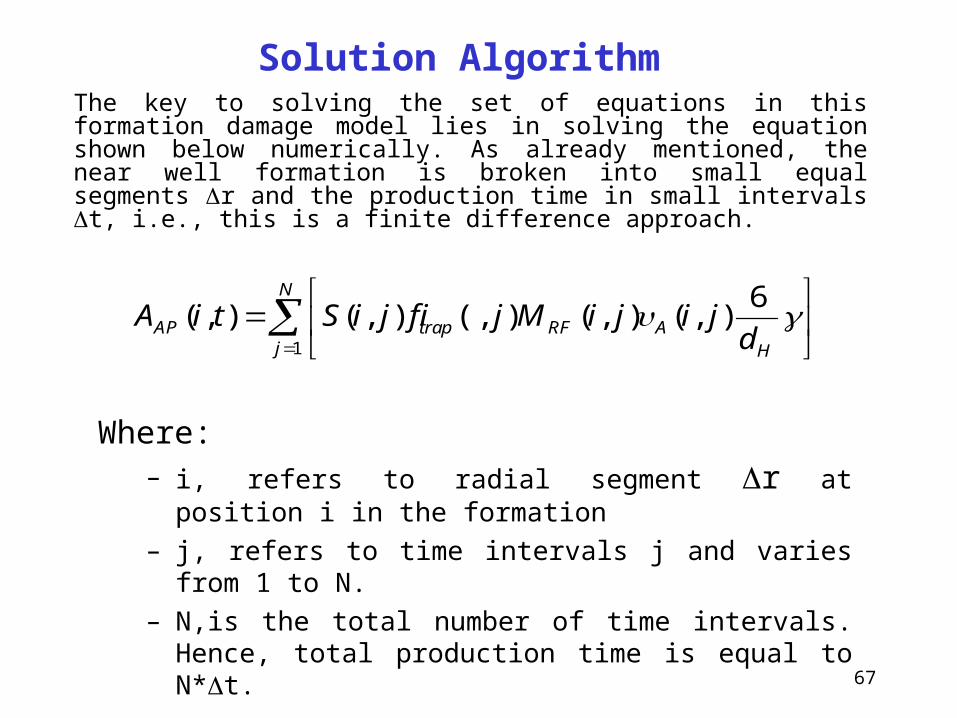
Solution AlgorithmThe key to solving the set of equations in this formation damage model lies in solving the equation shown below numerically. As already mentioned, the near well formation is broken into small equal segments r and the production time in small intervals t, i.e., this is a finite difference approach.
Where:– i, refers to radial segment r at position i in the formation
– j, refers to time intervals j and varies from 1 to N.
– N,is the total number of time intervals. Hence, total production time is equal to N*t.
1
6( , ) ( , ) ( , ) ( , ) ( , )
N
AP trap RF Aj H
A i t S i j f i j M i j i jd
68
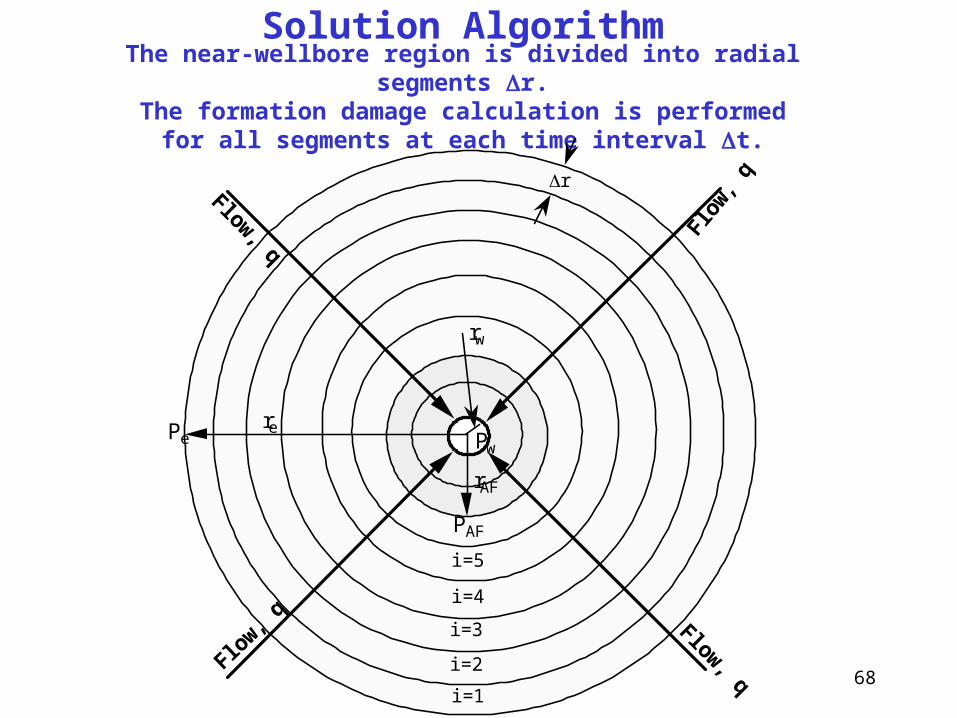
The near-wellbore region is divided into radial segments r.The formation damage calculation is performed
for all segments at each time interval t.
re
rAF
rw
r
PAF
Pe Pw
i=1
i=2
i=3
i=4
i=5
Solution Algorithm

69
Pe and PAF remain constant while PW is declining. Flow, q, is constant. During time interval j, PW remains constant. Say for time interval 6, PW is P6, for time interval 4, PW is P4, etc.
Pre
ssur
e
Time
Pw
PAF
Pe
1 2 3 4 5 6
P6
P4
j
Solution Algorithm

70
Solution Algorithm
The previous figure shows the decline in the bottom hole pressure Pw with time caused by asphaltene-induced formation damage. An analogous decline is taking place in the entire region affected by asphaltene deposition (rrAF). One can assume that during a time interval t the pressure is equal to an average value Pavg. This allows one to calculate the thermodynamic properties of the reservoir fluid and utilize the previous equation as if during time interval t the system was at steady state (although during time interval t some incremental formation damage is taking place). The accuracy of this approach obviously improves with smaller time interval t and radius segment r, because the smaller the time interval and radius segment the closer the system is to steady state. This is true with any other numerical finite difference approach.

71
Solution Algorithm
The calculation proceeds as follows:– Using the well productivity index, PI, at time t=0 calculate a
starting Pw that corresponds to the production rate q. Then, the formation hydraulic diameter dH and average retained asphaltene particle diameter dAP are calculated. Also, the mole rate of reservoir fluid, MRF, corresponding to q is calculated.
– Assuming no damage present, the pressure profile is calculated from the wellbore to the well drainage radius, re, using the Darcy equation (i.e., Ps=0). This gives us the undamaged pressure profile at time t=0.
– At the first time interval t, i=1, the FDModel starts the calculation at r=rAF, because if q remains constant rAF remains constant as well. Hence, the pressure profile at locations with rrAF remains constant during the pseudo-steady state period (i.e., there is no damage at rrAF). But the pressure profile changes continuously at rrAF.
72
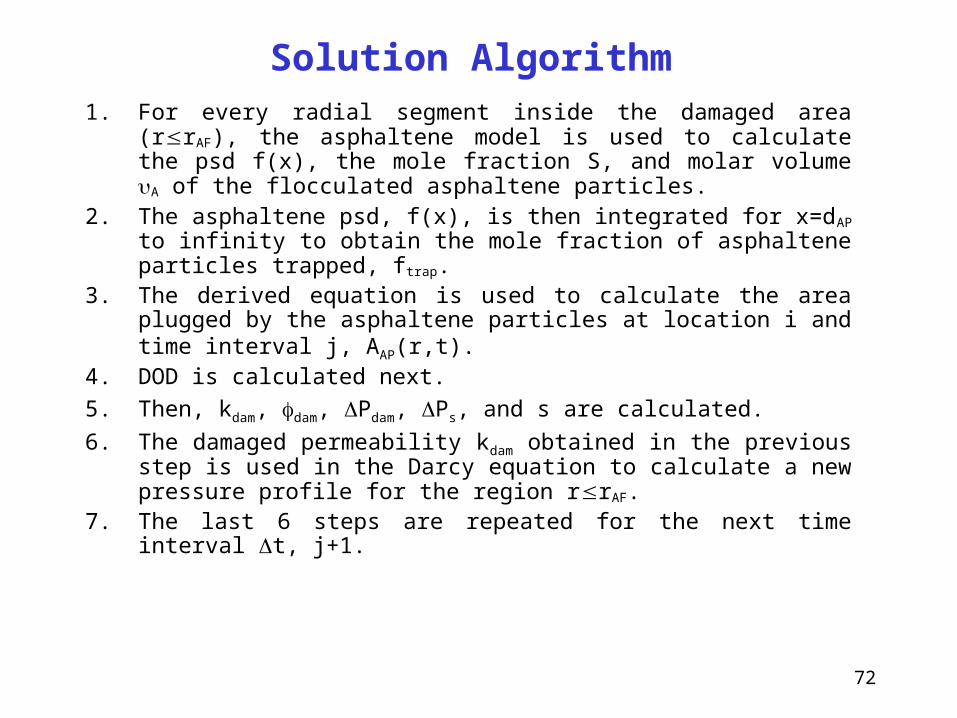
Solution Algorithm
1. For every radial segment inside the damaged area (rrAF), the asphaltene model is used to calculate the psd f(x), the mole fraction S, and molar volume A of the flocculated asphaltene particles.
2. The asphaltene psd, f(x), is then integrated for x=dAP to infinity to obtain the mole fraction of asphaltene particles trapped, ftrap.
3. The derived equation is used to calculate the area plugged by the asphaltene particles at location i and time interval j, AAP(r,t).
4. DOD is calculated next.
5. Then, kdam, dam, Pdam, Ps, and s are calculated.
6. The damaged permeability kdam obtained in the previous step is used in the Darcy equation to calculate a new pressure profile for the region rrAF.
7. The last 6 steps are repeated for the next time interval t, j+1.

73
Solution Algorithm
The calculation proceeds until one of the following happens:– The time t=j*t reaches tmax, the total production time specified at
the beginning of the calculation.
– the choke opens all the way and the flow rate cannot be kept constant. At this time, the pressure profile at rrAF begins to change also due to the decreasing flowrate. This corresponds to some low Pw. This low Pw must be specified to the model as a model stopping criteria.
74
Asphaltene Near-WellboreFormation Damage Modeling
• Asphaltene-Induced Formation Damage
• Asphaltene Particle-Size Distribution (psd)
• Hydraulic Radius
• Permeability Impairment
• Porosity Loss
• Skin Factor
• Asphaltene Deposit Erosion
• Solution Algorithm
• FDModel Application

75
FDModel Application
Reservoir Pressure, psia 6500.0
Reservoir Temperature, °F 187.0
Production Rate, reservoir Bbl/day 2500.0
Well Productivity Index, reservoir Bbl/psi 2.25
Wellbore Radius, feet 0.29
Formation Permeability, md 130.0
Porosity, fraction 0.290
Formation Hydraulic Radius (DH), micron 1.330
Well/Formation Data

76
FDModel Application
RESERVOIR PRESSURE, PSIA 6500.0
ASPHALTENE ONSET PRESSURE, PSIA 6258.8
BOTTOM HOLE PRESSURE, PSIA 5388.9
ASPHALTENE DAMAGE RADIUS, FEET 18.8
WELL DRAINAGE RADIUS, FEET 59.6
Well/Formation Data at Time t=0

77
FDModel Application
78
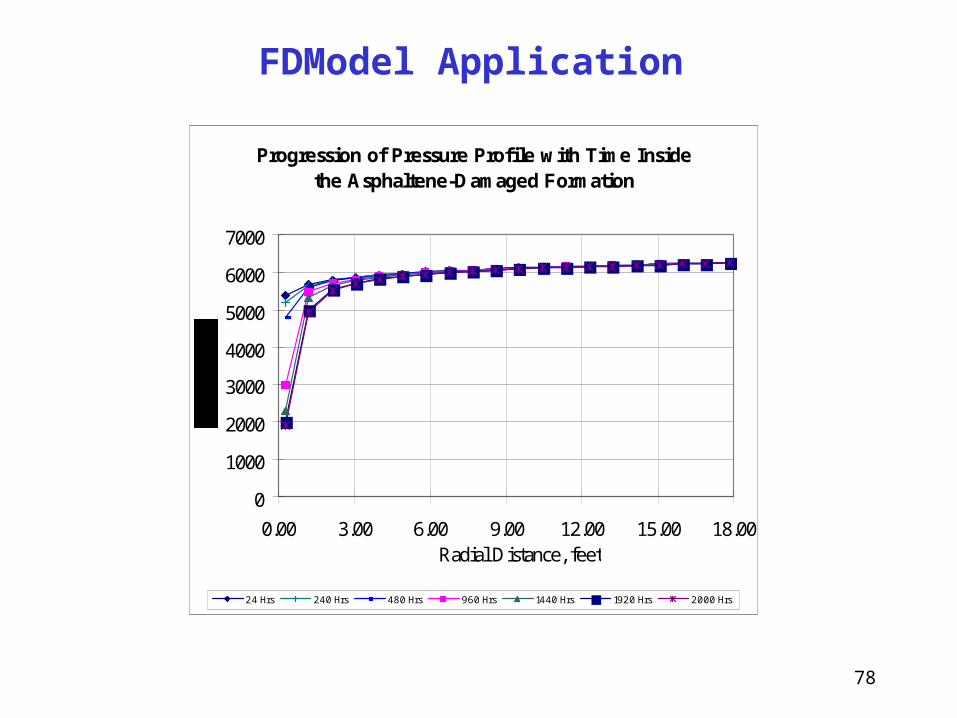
FDModel Application
Progression of Pressure Profile with Time Inside the Asphaltene-Damaged Formation
0
1000
2000
3000
4000
5000
6000
7000
0.00 3.00 6.00 9.00 12.00 15.00 18.00Radial Distance, feet
24 Hrs 240 Hrs 480 Hrs 960 Hrs 1440 Hrs 1920 Hrs 2000 Hrs
79
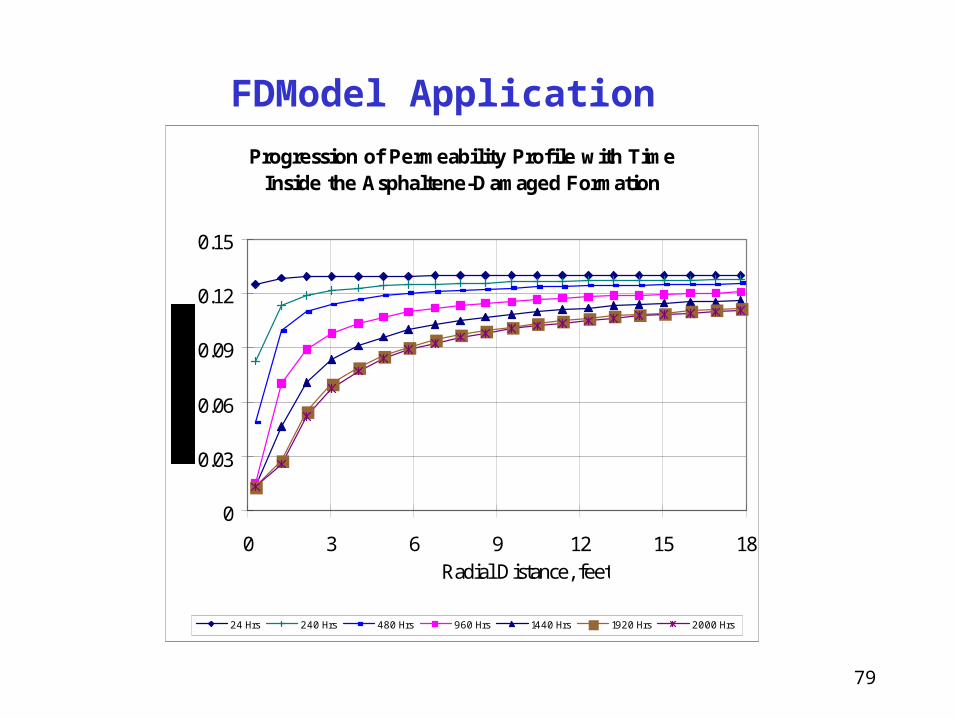
FDModel Application
Progression of Permeability Profile with Time Inside the Asphaltene-Damaged Formation
0
0.03
0.06
0.09
0.12
0.15
0 3 6 9 12 15 18Radial Distance, feet
24 Hrs 240 Hrs 480 Hrs 960 Hrs 1440 Hrs 1920 Hrs 2000 Hrs
80
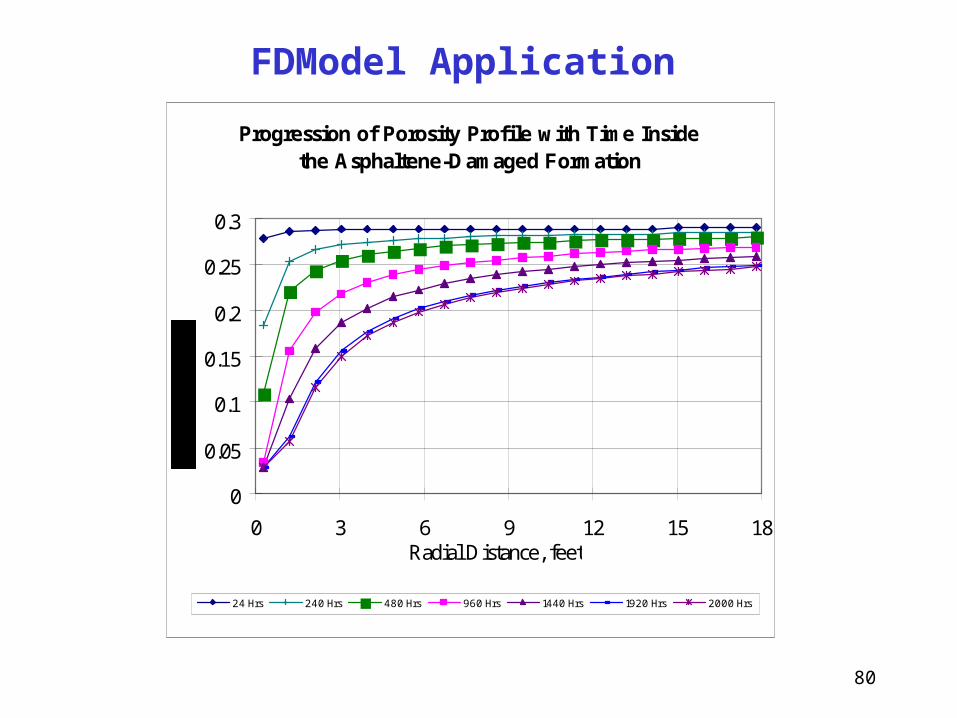
FDModel Application
Progression of Porosity Profile with Time Inside the Asphaltene-Damaged Formation
0
0.05
0.1
0.15
0.2
0.25
0.3
0 3 6 9 12 15 18Radial Distance, feet
24 Hrs 240 Hrs 480 Hrs 960 Hrs 1440 Hrs 1920 Hrs 2000 Hrs
81
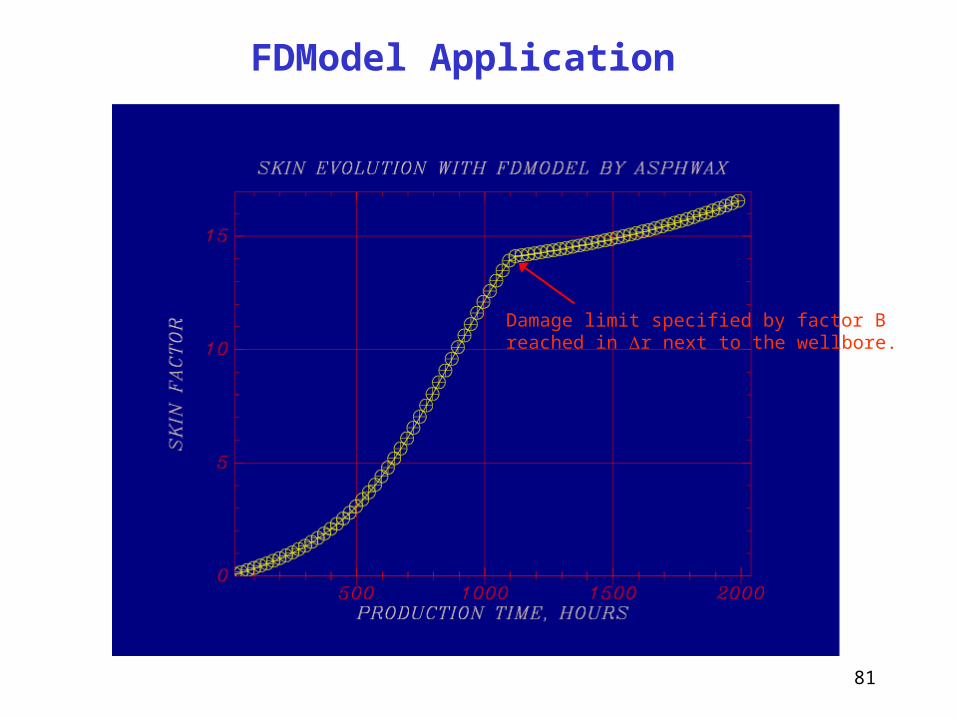
FDModel Application
Damage limit specified by factor B reached in r next to the wellbore.

82
Asphaltene Near-WellboreFormation Damage Modeling
• Asphaltene-Induced Formation Damage
• Asphaltene Particle-Size Distribution (psd)
• Hydraulic Radius
• Permeability Impairment
• Porosity Loss
• Skin Factor
• Asphaltene Deposit Erosion
• Solution Algorithm
• FDModel Application

83
Asphaltene Near-WellboreFormation Damage Modeling
By
Kosta J. Leontaritis, Ph.D.
AsphWax, Inc.
E-mail: [email protected]: www.asphwax.com