Embed Size (px)
Citation preview

Subsurface drip irrigation with wastewater and theeffects of environmental factors on virus survival in soil
Item Type text; Dissertation-Reproduction (electronic)
Authors Song, Inhong
Publisher The University of Arizona.
Rights Copyright © is held by the author. Digital access to this materialis made possible by the University Libraries, University of Arizona.Further transmission, reproduction or presentation (such aspublic display or performance) of protected items is prohibitedexcept with permission of the author.
Download date 06/12/2021 08:35:22
Link to Item http://hdl.handle.net/10150/280752

SUBSURFACE DRIP IRRIGATION WITH WASTEWATER AND THE EFFECTS OF
ENVIRONMENTAL FACTORS ON VIRUS SURVIVAL IN SOIL
by
Inhong Song
A Dissertation Submitted to the Faculty of the
DEPARTMENT OF AGRICULTURAL AND BIOSYSTEMS ENGINEERING
In Partial Fulfillment of the Requirements
For the Degree of
DOCTORAL OF PHILOSOPHY
In the Graduate College
THE UNIVERSITY OF ARIZONA
2 0 0 4

UMI Number: 3158158
INFORMATION TO USERS
The quality of this reproduction is dependent upon the quality of the copy
submitted. Broken or indistinct print, colored or poor quality illustrations and
photographs, print bleed-through, substandard margins, and improper
alignment can adversely affect reproduction.
In the unlikely event that the author did not send a complete manuscript
and there are missing pages, these will be noted. Also, if unauthorized
copyright material had to be removed, a note will indicate the deletion.
UMI UMI Microform 3158158
Copyright 2005 by ProQuest Information and Learning Company.
All rights reserved. This microform edition is protected against
unauthorized copying under Title 17, United States Code.
ProQuest Information and Learning Company 300 North Zeeb Road
P.O. Box 1346 Ann Arbor, Ml 48106-1346

9
The University of Arizona '«) Graduate College
As members of the Final Examination Committee, we certify that we have read tlie
dissertation prepared by INHONG SONG
entitled SUBSURFACE DRIP IRRIGATION WITH WASTEWATER AND
THE EFFECTS OF ENVIRONMENTAL FACTORS ON VIRUS
SURVIVAL IN SOIL
and recommend that it be accepted as fulfilling the dissertation requirement for the
Degree of Doctor of Philosophy
^ CA / i - 2 0 Y Christopher Y. CMoi 7 date
11 /jV/yV
Peter Waller . / date
c kluA'/. ikJe, //p- i/c i iiarles Peter Gerba
Arthur Warrick
Charles Peter Gerba date
oi
Final approval and acceptance of this dissertation is contingent upon the candidate's submission of the final copies of the dissertation to the Graduate College.
I hereby certify that I have read this dissertation prepared under my direction and recommend that it be accepted as fulfilling the dissertation requirement.
Dissertafion Director: Chr^topher Y. Choi^ date

3
STATEMENT BY AUTHOR
This dissertation has been submitted in partial fulfillment of requirements for an advanced degree at the University of Arizona and is deposited in the University Library to be made available to borrowers under rules of the Library.
Brief quotations from this dissertation are allowable without special permission, provided that accurate acknowledgement of source is made. Requests for permission for extended quotation from or this manuscript in whole or in part may be granted by the head of the major department or the Dean of the Graduate College when in his or her judgment the proposed use of the material is in the interests of scholarship. In all other instances, however, permission must be obtained from the author.
SIGNED:

4
ACKNOWLEDGEMENTS
I would like to thank Dr. Christopher Choi, my dissertation chair and major
advisor, for his guidance and invaluable support during my graduate study. I
would like to acknowledge my other committee members, Drs. Charles Gerba,
Mark Riley, Peter Waller, and Arthur Warrick. I would also like to thank my
former advisor. Dr. Soon-Kuk Kwun, for his encouragement of my study abroad.
I would like to thank Drs. Jose Pimentel and Scott Stine for their assistance with
this project. I would like to acknowledge our lab members, Susan O'Shaughnessy,
Minyoung Kim, Mathew Grabau, and Teodulo Dominguez, for their invaluable
time as well as colleagueship. I would also like to thank Charlie Defer and Jack
Keating for setting up all field experiments. This work would have not been
possible without each of these individual's help.
I extend my appreciation to all of the micro-lab members, in particular Kelly
Riley for her help. I would also like to thank Justina Tam and Nick Nelson for
their help in performing experiments.
I would like to acknowledge Dr. Keesung Kim and Mr. Sang-Ho Choi for their
advice and friendship. It was pleasant to have spent my time here with you.
Most of all, I appreciate my parents and brothers for their support, trust, and
sacrifices. You have always given me the strength to overcome challenges and
have been a part of what I am.

DEDICATION
This dissertation is dedicated to my parents and brothers. This work could have
not been completed with their invaluable support and sacrifice. Also to the other
half of mine to appear soon
6
TABLE OF CONTENTS
TABLE OF CONTENTS 6
LIST OF TABLES 12
ABSTRACT 14
CHAPTER 1. INTRODUCTION 16
1.1. PROBLEM STATEMENT AND RESEARCH OBJECTIVES 16
1.2. LITERATURE REVIEW 18
1.2.1. Subsurface drip irrigation 18
1.2.2. Health risks with wastewater irrigation 23
1.2.3. Indicator microorganisms 27
1.2.4. Microbial survival 28
CHAPTER 2. EFFICIENT WATER USE OF SUBSURFACE DRIP IRRIGATION IN
COMPARISON WITH FURROW IRRIGATION 34
SUMMARY 34
2.1. INTRODUCTION 34
2.2. MATERIALS AND METHODS 36
2.2.1. Field preparation 36
2.2.2. Irrigation schedule 37
2.2.3. Harvest 37
2.2.4. Estimation of water use efficiency (WUE) 38
2.2.5. Uniformity test for drip tapes 38
2.3. RESULTS AND DISCUSSION 39

7
2.3.1. Applied water amount 40
2.3.2. Crop yields and water use efficiencies 41
2.3.2. Drip uniformity test 42
2.4. CONCLUSION 42
CHAPTER 3. IRRIGATION WITH WASTEWATER AND MICROBIAL CROP
CONTAMINATION 49
SUMMARY 49
3.1. INTRODUCTION 50
3.2. MATERIALS AND METHODS 51
3.2.1. Field preparation 52
3.2.2. Application of the study microorganisms 52
3.2.3. Sample collection 53
3.2.4. Microbial assay 54
3.2.5. Estimation of inactivation rate 54
3.3. RESULTS AND DISCUSSION 55
3.3.1. Crop contamination 55
3.3.2. Soil contamination 57
3.3.3. Inactivation rates on or in the soil 59
3.4. CONCLUSION 60
CHAPTER 4. THE EFFECTS OF TEMPERATURE AND MOISTURE ON
SURVIVAL OF COLIPHAGE PRD-1 IN SOIL 68
SUMMARY 68

8
4.1. INTRODUCTION 69
4.2. MATERIALS AND METHODS 70
4.2.1. Soil preparation 70
4.2.2. Control of environmental factors 71
4.2.3. Sample preparation and sampling 71
4.2.4. Assay of PRD-1 72
4.2.5. Model development 72
4.3. RESULTS AND DISCUSSION 73
4.3.1. Inactivation rates versus environmental factors 73
4.3.2. Effect of evaporation on PRD-1 survival 75
4.3.3. Model regression and application to predict PRD-1 survival 76
4.4. CONCLUSION 77
APPENDIX A - Climatic data during the field experiments 86
APPENDIX B - Water use efficiency experiment data 101
APPENDIX C - Crop contamination experiment data 103
APPENDIX D - Microcosm experiment data 108
REFERENCES 116

9
LIST OF FIGURES
Figure 2-1. Schematics of the experimental field (SDI and FI represent subsurface drip
and furrow irrigation, respectively. Width was 5 m for lettuce and bell pepper fields
and 7 m for cantaloupe field. Unit: meter) 46
Figure 2-2. Cross section of each plot (D indicates the depth of drip tape installation
which was 0.15 m for lettuce and 0.20 m for bell pepper. Unit: meter) 47
Figure 2-3. Comparison of crop yields between irrigation systems (Error bars indicate
standard deviations) 47
Figure 2-4. Comparison of crop water use efficiencies between irrigation systems (Error
bars indicate standard deviations) 48
Figure 3 - 1. Comparison of microbial recoveries from produce surface (*No microbial
recovery over detection limit was observed from bell pepper surface. SDI and FI
indicate subsurface drip and furrow irrigation, x indicates outlier defined as recovery
< Ql-1.5xinter-quartile (Q3-Q1) or >Q3+1.5xinter-quartile, where Qi and Q3 are the
first and the third quartile, respectively. Inner and outer boxes represent inter-quartile
ranges and 95 % confidence interval of the mean, respectively.) 63
Figure 3-2. Microbial recoveries from the produce surfaces versus soil moisture content
underneath produce (SDI and FI represent subsurface drip and furrow irrigated plots,
respectively. Soil moisture content was measured gravimetrically) 64
Figure 3-3. Comparison of microbial recoveries on soil surface (SDI and FI indicate
s u b s u r f a c e d r i p a n d f u r r o w i r r i g a t i o n , x i n d i c a t e s o u t l i e r d e f i n e d a s r e c o v e r y < Q l -
1.5Xinter-quartile (Q3-Q1) or >Q3+1.5xinter-quartile, where Qi and Q3 are the first
10
and the third quartile, respectively. Inner and outer boxes represent inter-quartile
ranges and 95 % confidence interval of the mean, respectively.) 65
Figure 3-4. Comparison of microbial recoveries from subsurface soil (SDI and FI
indicate subsurface drip and furrow irrigation, x indicates outlier defined as recovery
< Ql-1.5xinter-quartile (Q3-Q1) or >Q3+1.5xinter-quartile, where Qi and Q3 are the
first and the third quartile, respectively. Inner and outer boxes represent inter-quartile
ranges and 95 % confidence interval of the mean, respectively.) 66
Figure 3-5. Microbial inactivation rates (Error bars indicate standard deviations of the
mean values) 67
Figure 4 - 1. Inactivation rates versus temperature (f indicates the inactivation rates
evaluated from the average soil moisture at less than 5.0 % (4.8,4.7, and 4.3 % from
the left to the right, respectively)) 82
Figure 4-2. Inactivation rates versus volumetric soil moisture 82
Figure 4-3. PRD-1 recoveries with soil moisture decrease from the initial level of
20.9 % (The values in the parentheses are volumetric soil moisture content, %.) 83
Figure 4-4. Effect of evaporation on PRD-1 survival (• (SMD) indicates the soil
moisture control decreased from the initial level of 20.9 %, while • indicates the
constant soil moisture control at 20.9 %.) 83
Figure 4-5. Regressed by the models versus observed inactivation rates in the soil
moisture ranges of (a) 8.9 to 20.9 % and (b) 5.0 to 20.9 % (kd indicates inactivation
rate in the unit of 1/days) 84

11
Figure 4-6. Comparison of predicted and observed inactivation rates (The model with
the soil moisture range of 8.9 to 20.9 % was used to predict kd (inactivation rate)
values. Field survival data were used as the observed inactivation rates) 85
Figure A - 1. Climatic data during the crop growing seasons of (a) 2001, (b) 2002, (c)
2003, and (d) 2004 (The boxes, A, B, and C indicate the periods of field studies on
crop contamination for cantaloupe, lettuce, and bell pepper, respectively.) 99
Figure C - 1. Field survival curves of the study microorganisms from soil surface in
furrow irrigation plots (a, b, and c represent cantaloupe, lettuce, and bell pepper
experiment, respectively) 106
Figure C - 2. Field survival curves of the study microorganisms from subsurface soil at
10 cm in furrow irrigation plots (a, b, and c represent cantaloupe, lettuce, and bell
pepper experiment, respectively) 107
Figure D - 1. Coliphage PRD-1 survival curves from the microcosm experiment (Soil
moisture was controlled at 20.9, 16.2, 12.1, 8.9, and 5.1 %) 113
12
LIST OF TABLES
Table 1 - 1. Recommended revised microbiological guidelines for treated wastewater use
in agriculturea (WHO, 2000) 26
Table 2 - 1. Growing seasons and climatic data obtained from AZMET (Arizona
meteorological network weather station) 44
Table 2 - 2. Total amounts of water applied during growing seasons 44
Table 2-3. Crop yields and water use efficiencies 45
Table 2-4. Flow rates and uniformities of retrieved drip tapes after two seasons of
lettuce irrigation 45
Table 3-1. Experimental periods and climatic data obtained from AZMET (Arizona
meteorological network weather station) 62
Table 4-1. Experimental controls 80
Table 4-2. Estimated inactivation rates of coliphage PRD-1 in soil (unit; 1/days) 80
Table 4-3. Models regressed from two different ranges of soil moisture 81
Table 4-4. Model application to predict PRD-1 survival (The developed model with the
range of soil moisture 8.9 to 20.9 % was used to predict the inactivation rates of
PRD-1 and compare the data from field survival study as addressed in Chapter 3).. 81
Table A - 1. Climatic data during the 2001 lettuce experiment - AZMET 86
Table A - 2. Climatic data during the 2002 lettuce experiment - AZMET 88
Table A - 3. Climatic data during the 2003 cantaloupe experiment - AZMET 90
Table A - 4. Climatic data during the 2003 cantaloupe experiment - AZMET 92
Table A - 5. Climatic data during the 2003 lettuce experiment - AZMET 94

13
Table A - 6. Climatic data during the 2004 bell pepper experiment - AZMET 96
Table B - 1. Total applied water, crop yield and water use efficiency for lettuce 101
Table B - 2. Total applied water, crop yield and water use efficiency for cantaloupe... 102
Table B - 3. Total applied water, crop yield and water use efficiency for bell pepper... 102
Table C -1. PRD-1 recoveries from the produce surfaces 103
Table C - 2. PRD-1 recoveries from the soil surface 104
Table C - 3. PRD-1 recoveries from subsurface soil at a depth of 10 cm 105

14
ABSTRACT
This study compared subsurface drip irrigation with furrow irrigation in terms of
water use efficiency and crop contamination when microbial-contaminated water was
used for irrigation. The effects of temperature and moisture on microbial survival in soil
were also assessed quantitatively. Three years of field experiments with cantaloupe,
lettuce, and bell pepper, and a laboratory microcosm study were conducted to fulfill the
study purposes. Escherichia coli ATCC 25922, Clostridium perfringens, and coliphage
PRD-1 were used for the study microorganisms.
Subsurface drip irrigation used irrigation water more efficiently as compared to
furrow irrigation due to lower water requirement for similar crop yields. Subsurface drip
irrigation performed better for the deep-rooted crops, cantaloupe and bell pepper,
compared to the shallow-rooted crop, lettuce. After two years of irrigating lettuce, drip
tapes still demonstrated high uniformity.
Significantly greater microbial contamination of produce and soil surface occurred
in furrow irrigated plots as compared to subsurface drip irrigated plots. Direct movement
of subsurface drip irrigated water to the soil surface appeared to cause crop
contamination in subsurface drip irrigation plots. Coliphage PRD-1 demonstrated greater
crop contamination and longer survival than E. coli. The smaller size of PRD-1 than that
of E. coli might facilitate its movement through soil matrices and increased the chance to
contaminate crop produce.
15
The inactivation rate of PRD-1 increased as temperature increased. A soil moisture
decrease from 20.9 to 8.9 % was inversely related with the inactivation rate. Further
decrease of the soil moisture content to 5.1 % increased the inactivation rate. An
optimum or a threshold soil moisture level for PRD-1 survival may exist. Evaporation
increased the inactivation rate of PRD-1 substantially in higher temperatures but
minimally in lower temperatures. A regressed model to predict PRD-1 survival estimated
the inactivation rates of PRD-1 in field conditions with an average error of 11.0 %.
Subsurface drip irrigation with proper management can be a sustainable strategy not
only to conserve water resources but to reduce crop contamination when wastewater is
used for crop production. The field envirormient continuously changes and therefore the
effects of environmental changes on microbial survival need to be further investigated.
16
CHAPTER 1. INTRODUCTION
1.1. PROBLEM STATEMENT AND RESEARCH OBJECTIVES
Over the past decade, growing scarcity and competition for water resources have
been witnessed around the world. The concentration of populations in metropolitan areas
has required not only massive water supplies but also large-scale waste disposal systems
(Haruvy, 1997). Agricultural fresh water use is expected to decline even faster because of
increasing competition with urban and industrial use (Tuong and Bhuiyan, 1994).
However, existing water resources have been fully utilized as a result of increased water
demand, particularly in arid and semi-arid regions including the State of Arizona. For
example, irrigated agriculture accounts for about 75 % of the total water use in the Active
Management Areas of central Arizona (Carr et al., 1990).
Treated wastewater use for agricultural purposes can solve both water shortage and
waste disposal issues (Arar, 1989). This is also a sustainable strategy for recycling water
and nutrients. In recent years, subsurface drip irrigation has been considered as an
alternate irrigation technique for conserving water resources and reducing health risks
associated with wastewater irrigation (Oron et al., 1991; Ruskin, 1992; Phene and
Ruskin, 1995).
Although irrigation with wastewater is a primary option for the development of new
water resources, this option is often limited to parks and golf courses in urban areas.
Agricultural use of treated wastewater may pose health risks to farmers and consumers of
produce by the potential introduction of pathogenic microorganisms in treated

wastewater. Consequently, treated wastewater used for irrigation is restricted by
guidelines which might be unnecessarily conservative (Shuval, 1991; WHO, 2000).
A few studies have reported that subsurface drip irrigation can be an alternate
irrigation technique that can not only conserve water (Camp, 1998; Schneider and
Howell, 2001) but also reduce health risks associated with wastewater irrigation
(Shrivastava et al., 1994; Ruskin, 1993). Microirrigation systems have also been studied
as an alternate treatment process which can reduce the costs associated with wastewater
treatment facilities (Rubin et al., 1994). Relatively few studies are available which
compare subsurface drip irrigation with furrow irrigation, the most common irrigation
practice for crop production in Arizona.
Under favorable conditions, enteric pathogens can survive for extremely long
periods of time on crops, in water or in the soil (Feachem et al., 1983; Gerba et al., 1975).
Environmental factors affecting microbial survival in soil include soil moisture content,
temperature, soil types, solar radiation, adsorption to soil particles, pH, etc. (Gerba et al.,
1975; Hurst et al., 1980; Seymour and Appleton, 2001). Although many studies on
microbial survival have been conducted, much of the information on the effects of these
factors is qualitative (Yates and Yates, 1988). Quantitative assessment of the effects of
these factors is necessary to predict microbial survival and assess the potential transfer of
microorganisms through subsurface drip irrigation.
The main objectives of this study were to investigate the role of subsurface drip
irrigation in terms of water use efficiency and crop contamination and to study virus
survival in the soil. Three years of field experiments with three crops, cantaloupe, lettuce.
18
and bell pepper were conducted to meet the need of the study. In addition, a laboratory
experiment allowed qualitative and quantitative assessment of the effects of temperature
and soil moisture level on virus survival.
The specific objectives of the present study were as follows:
1. To compare subsurface drip irrigation with furrow irrigation in terms of produce
production and water use efficiency.
2. To investigate any maintenance problems associated with subsurface drip
irrigation and to suggest possible solutions.
3. To determine the efficacy of subsurface drip irrigation with treated wastewater.
4. To acquire data on virus survival in the soil and quantitatively assess the effects of
environmental factors on virus survival in the soil.
5. To develop an empirical model to predict virus survival in the soil.
1.2. LITERATURE REVIEW
1.2.1. Subsurface drip irrigation
Subsurface drip irrigation involves drip or trickle application equipment installed
below the soil surface only for the past 15 to 20 years. The invention of plastic allowed
the development of subsurface drip irrigation as a method of drip irrigation. As
commercial drip emitters and related equipment became more reliable, the use of
subsurface drip irrigation increased during the 1980s, especially in areas with declining
water supplies (Camp et al., 2000). Applications of subsurface drip irrigation using

19
wastewater began to emerge in the 1990s. Subsurface drip irrigation is defined as "the
application of water below the soil surface through emitters, with discharge rates
generally in the same range as drip irrigation" (ASAE standards, 1995).
1.2.1.1. Crop yield and water use efficiency
Water use efficiency is a common indicator used to evaluate the performance of an
irrigation system (Guerra et al., 1998). There are several ways to define water use
efficiency depending on the nature of inputs and outputs. Irrigation efficiency is defined
as the net amount of water applied to the root zone divided by the amount of water uptake
from the water source (Jensen, 1980; Wolters and Bos, 1989; Hillel, 1997). The amount
of water supplied to a field of interest but not used by crops is considered a loss, which
includes surface runoff, deep percolation, evaporation, etc. (Shideed et al., 2003).
However, the water use efficiency concept is not directly related to the amount of food
that can be produced using available water amounts. In this respect, agronomic or crop
water use efficiency, defined as the amount of food produced per unit volume of water
taken by crops, is more relevant (Viets, 1962; Tabbal et al., 1992; Molden, 1997). The
aforementioned efficiencies can be combined in a single concept, the overall agronomic
water use efficiency which is defined as the crop production divided by the volume of
water applied (Hillel, 1998).
Camp (1998) comprehensively reviewed the applications of subsurface drip
irrigation for 10 different agronomic crops and 20 horticultural crops including grains,
vegetables, fruit, and vine crops. In most comparisons, crop yields with subsurface drip

20
irrigations were equal to or better than those with other irrigation systems. Bucks et al.
(1981) successfully applied subsurface drip irrigation to multiple crops of cantaloupe,
onion, and carrot suggesting that subsurface trickle irrigation can be an irrigation method
for water conservation and high crop yields. This study also recommended less frequent
irrigation for deep-rooted row crops than for shallow-rooted crops. In comparison with
sprinkler, surface trickle, and furrow irrigation, subsurface drip irrigation showed the
highest potato and lettuce yields and the high efficient water use (Sammis, 1980). Fitz-
Rodriguez (2002) and Suarez-Ray et al. (2000) reported equal or better turfgrass quality
with subsurface drip irrigation in comparison with sprinkler irrigation.
Similar corn yields with subsurface drip irrigation used 30 % less water than that
with sprinkler irrigation (Adamsen, 1992). Approximately 40 % less water was applied to
produce similar or higher cotton yields with subsurface drip irrigation than with furrow
irrigation (Phene et al., 1992; DeTar et al., 1994). Shideed et al. (2003) studied irrigation
water use efficiency in a comparison of three types of systems, the trickle, solid-set
sprinkler, and furrow irrigation systems. This study showed that overall, the efficiency of
the trickle irrigation was on the average about 28 % and 45 % greater than those of the
sprinkler and furrow systems, respectively (Dawood and Hamad, 1985).
Irrigation frequencies ranging from one to seven days had no effect on corn yield,
provided soil water storage was managed within acceptable stress levels (Caldwell et al.,
1994; Camp et al., 1989). El-Gindy and El-Araby (1996) reported greater tomato and
cucumber yields with daily irrigation than with irrigation every three days for a
21
calcareous soil in Egypt. Camp et al. (1993) found no difference of yields between
multiple irrigation per day and daily irrigation for several vegetable and fruit crops.
1.2.1.2. Emitter clogging and uniformity
Emitter plugging can be a major problem associated with subsurface drip irrigation.
Clogging factors include particulate matter, insects, biological growth, chemical
precipitation, or combinations of these factors (Pitts et al., 1990). Root intrusion to
emitters can be minimized by chemical injection, emitter design, and irrigation
management (Camp et al., 2000). Water quality is extremely important and significantly
influences the type of filtration. In general, the better the water quality, the less complex a
filtration system is required, i.e. recycled wastewater supplies may require the most
elaborate filtration.
Emitter clogging and the uniformity test are commonly used to evaluate the
performance of subsurface drip tape. These are the two most common ways to evaluate
the uniformity of water application (Wu and Barragan, 2000). Christiansen (1942)
defined the uniformity coefficient of sprinkler irrigation as follows:
UC = 100x V " Y,
(1.1)
where UC, AY, and Y represent the uniformity coefficient, the mean absolute deviation,
and the mean of irrigation depth, respectively. Wu and Gitlin (1974) substituted emitter
flow for irrigation depth and thus calculated the uniformity for drip irrigation. Wilcox and
Swailes (1947) evaluated the uniformity of irrigation using a standard deviation instead
22
of a mean deviation in the Christiansen equation, which is called the statistical uniformity
coefficient. Simple evaluations include the emitter flow ratio of minimum emitter flow to
maximum emitter flow (Howell and Hiler, 1974) and emitter flow variation, which is one
minus emitter ratio (Wu and Gitlin, 1974). The statistical uniformity coefficient was
recommended for use in determining the drip irrigation design uniformity (Bralts and
Wu, 1979). According to ASAE standard EP458 (1995), irrigation uniformities are
classified as follows: 95-100 % is excellent, 85-90 % is good, and 75-80 % is fair.
Choi and Suarez-Rey (2004) reported that the statistical uniformity of drip tapes
was reduced from 91.8 % to 85.3 % after the first year and 86.2 % after the third year,
while no reduction in flow rates was observed. Root intrusion into the emitters was
identified at the end of the irrigation season (Choi and Suarez-Rey, 2004; Solomon and
Jorgensen, 1992). Camp (1998) reviewed the performance of subsurface drip irrigation
and reported that there was more reduction in uniformity for subsurface systems than for
surface drip systems, as observed after eight years of use. The reason was primarily
because of emitter plugging caused by soil entry into the main or sub-main during system
modification. Mitchell (1981) reported no deterioration of the porous lateral wall but
observed reduced flow rates, after five years of use.
Measuring the uniformity of subsurface drip irrigation is much more difficult than
for surface irrigation because of tape burial. Sadler et al. (1995) investigated the effect of
excavating subsurface emitters on emitter discharge rate and concluded that this had no
significant effect on uniformity. Upward water movement from buried emitters in the soil
was reported by Zimmer et al. (1988); similarly, Warrick and Shani (1996) suggested use

23
of lower flow rates with more emitters as well as pressure compensating emitters to
improve uniformity under soil conditions. Tajrishy et al. (1994) observed that sand
media, screen filters, and free chlorine injections were all effective in preventing clogging
of self-flushing and tortuous-path turbulent flow emitters.
1.2.2. Health risks with wastewater irrigation
Wastewater contains not only beneficial nutrients such as nitrogen and phosphorus
but contaminants (Arar, 1989). These contaminants include pathogenic microorganisms
which may be present in treated wastewater and chemical pollutants in the case of
industrial effluent. Provided that the quality of wastewater conforms to the
recommendations by the Food and Agriculture Organization (FAO) for irrigation water
(Ayers and Westcot, 1985), domestic and municipal wastewater is usually of adequate
physio-chemical quality for crop irrigation (Arar, 1989).
The health risks associated with wastewater use for crop irrigation can be manifested
to different sub-groups, consumers of crops irrigated with wastewater and agricultural
workers subject to occupational exposure (Pescod, 1989). The Centers for Disease
Control and Prevention (CDC) has reported an increasing number of foodborne outbreaks
over the past few decades (Tauxe, 1997). Viruses are responsible for 67 % of all
foodborne illness, bacteria for 30 %, and parasites for 3 % (Mead et al., 1999). Seymour
and Appleton (2001) reported that the most frequently reported foodborne viral infections
are viral gastroenteritis and hepatitis A and the most responsible viruses include
rotavirus, Norwalk-like viruses, astro virus and adenovirus, and hepatitis A virus.
Outbreaks of foodbome illness associated with cantaloupe have been caused by several
serovars of Salmonella enterica over the past decade (Fancis et al., 1991; Mohle-Boetani
et al., 1999). Helminth removal alone is sufficient to protect field workers, so a lesser
degree of removal can be considered if other health protection measures are utilized or if
the water quality will be further improved after treatment (WHO, 1989a).
To encourage the safe use of wastewater and excreta in agriculture and aquaculture,
the World Health Organization (WHO, 1989b) developed guidelines with an emphasis on
microbiological contamination rather than chemical pollution, which is of only minor
importance in the reuse of domestic wastes. The United States Environmental Protection
Agency (USEPA) and the United States Agency for International Development have
recommended strict guidelines for wastewater use using total and fecal coliforms as
indicator organisms (USEPA/USDA, 1992). For unrestricted irrigation of crops eaten
uncooked, no detectable fecal coliform bacteria are allowed in 100 ml of irrigation water,
and for irrigation of commercially processed and fodder crops, the limit is 200 fecal
coliform bacteria/100 ml. WHO guidelines (1989) recommended 1,000 fecal coliform
bacteria/100 ml for unrestricted irrigation, while limits on the presence of nematode eggs
is set for cereal, industrial, and fodder crops irrigation. In the USA, the setting of
standards belongs to individual states and ranges from 10 to 1,000 fecal coliform for
unrestricted irrigation for surface irrigation and 2.2 to 200 fecal coliform bacteria/100 ml
for spray irrigation.
A main criticism is that these guidelines may be unnecessarily strict and could result
in high costs per case of infectious disease averted (Shuval, 1991; Shuval et al., 1997).
25
The World Health Organization, the World Bank and the International Reference Centre
for Waste Disposal convened in Engelberg, Switzerland, in 1985, to propose a more
realistic approach to the use of treated wastewater and excreta, based on the best and
most recent epidemiological evidence. The recommendations of the resulting Engelberg
Report have formed the basis for these guidelines which are summarized in Table 1-1
(WHO, 2000).
Apart from effluent quality criteria related to health, there are also concerns about
resultant effects on the soil and on crops (Pescod, 1989). However, it is not possible to
cover all situations to meet water quality criteria. Even if the Engelberg guidelines for
treated wastewater quality are not fully met, appropriate management can be
complemented for wastewater irrigation of crops without causing health risks.
Subsurface drip irrigation has been suggested as an alternate technique to conserve
water and for wastewater irrigation (Oron et al., 1991; Ruskin, 1992; Phene and Ruskin,
1995). Since this irrigation water does not normally reach the soil surface due to direct
irrigation to the crop root zone, the exposure of irrigated water to produce as well as to
the crop handlers would be minimized (Absar et al., 2000). The soil acts as a living filter
to remove pathogenic microorganisms (Oron et al., 1995). With proper management,
crop yields were increased and no adverse health effects were induced (Arar, 1989).

Table 1-1. Recommended revised microbiological guidelines for treated wastewater use in agriculture^ (WHO, 2000).
Category Reuse
conditions Exposed
group Irrigation technique
Intestinal nematodes'' (arithmetic mean No. of
eggs per liter')
Fecal conforms (geometric mean No. per 100 ml'')
Wastewater treatment expected to achieve required microbiological quality
A
Unrestricted irrigation
A1 for vegetable and salad crops eaten uncooked, sports fields, public parks'
Workers, consumers, public
Any <0.1« < 1,000
Well-designed series of waste stabilization ponds (WSP), sequential batch-fed wastewater storage and treatment reservoirs (WSTR) or equivalent treatment (e.g., conventional secondary treatment supplemented by either polishing ponds or filtration and disinfection)
B
Restricted irrigation Cereal crops, industrial corps, fodder crops, pasture and trees*^
B1 Workers (but no children <15 years), nearby communities
B2asBl
B3 Workers including children <15 years, nearby
communities
Spray or sprinkler
Floodyfurrow
Any
< 1
< 1
<0.1
< 100,000
< 1,000
< 1,000
Retention in WSP series including one maturation pond or in sequential WSTR or equivalent treatment (e.g., conventional secondary treatment supplemented by either polishing ponds or filtration)
As for Category A
As for Category A
C
Localized irrigation of crops in category B if exposure of workers and the public does not occur
None Trickle, drip or bubbler
Not applicable Not applicable Pretreatment as required by the irrigation technology, but not less than primary sedimentation
°In specific cases, local epidemiological, sociocultural and environmental factors should be taken into account and the guidelines modified accordingly. ''Ascarisand Trichurisspecies and hookworms; the guideline limit is also intended to protect against risks from parasitic protozoa. 'During the irrigation season (if the wastewater is treated in WSP or WSTR which have been designed to achieve these egg numbers, then routine effluent quality monitoring is not required). ••During the inigation season (faecal coliform counts should preferably be done weekly, but at least monthly).
'A more stringent guideline limit (<200 faecal coliforms/100 ml) is appropriate for public lawns, such as hotel lawns, with which the public may come into direct contact.
'This guideline limit can be increased to <1 egg/I if (i) conditions are hot and dry and surface irrigation is not used or (ii) if wastewater treatment is supplemented with anthelmintic chemotherapy campaigns in areas of wastewater reuse. ®In the case of fruit trees, irrigation should stop two weeks before fruit is picked, and no fruit should be picked off the ground. Spray/sprinkler irrigation should not be used.

27
Oron et al. (1991) successfully applied subsurface drip system to effluent irrigation
without failure for years and reported minimal risks for crop contamination. Enriquez et
al. (2003) studied turfgrass contamination by comparing subsurface drip irrigation with
sprinkler irrigation when tertiary effluent seeded with coliphages of MS-2 and PRD-1
were used for irrigation water. The numbers of coliphages in the clippings collected from
the subsurface irrigated plots were minimal, while both coliphages were found in large
numbers in the clippings from the sprinkler irrigated plots. According to Alum et al.
(2000), no above-ground surface contamination of tomato crops was observed with
subsurface drip irrigation while the surface irrigation resulted in surface contamination of
roots, leaves and fruits of tomato.
1.2.3. Indicator microorganisms
An indicator is used as a biological marker of the efficiency of treatments or of the
variation in numbers of the surrogate microorganisms in specific environments (Dura'n et
al., 2002). An indicator must have similar resistance to natural inactivation factors and to
treatments as that of the surrogate microorganism or microorganisms. One of the criteria
for an ideal indicator is to survive longer than the pathogen itself (Allwood et al., 2003).
Three main groups of bacteriophages have been considered as potential model
microorganisms for various aspects of water quality assessment: somatic coliphages, F-
specific RNA bacteriophages, and bacteriophages infecting Bacteroides fragilis (Dura'n
et al., 2002; lAWPRC Study Group, 1991). F-specific RNA phages were highly
correlated with virus concentrations in sewage and can be used as model organisms to
28
predict enteric virus concentrations (Havelaar et al., 1993). Moce'-Llivina et al. (2003)
showed that bacteriophages were significantly more resistant to thermal inactivation than
bacterial indicators, with the exception of spores of sulfite-reducing Clostridia.
Clostridium perfringens spores have been proposed as indicators of parasitic protozoan
content (Payment and Franco, 1993). Davies et al. (1995) used fecal coliforms, fecal
streptococci, and Clostridium perfringens spores for the study on survival of fecal
microorganisms in marine and freshwater sediments. Clostridium perfringens can survive
for extended periods of time, is heat resistant, and is resistant to disinfection (Gerba,
2000).
PRD-1 survived the longest under various environmental conditions, as compared to
poliovirus, enteric adenovirus, and coliphage MS-2, suggesting that PRD-1 can be a
useful surrogate for enteric viruses (Enriquez et al. 2003). At higher temperatures, PRD-1
was far more resistant to inactivation than MS-2, persisting for periods of 7 to 10 times
longer survival in most water (Yahya et al., 1993). Choi et al. (2004) also reported greater
persistence of PRD-1 in soil in a comparative study with MS-2.
1.2.4. Microbial survival
Under favorable conditions, enteric pathogens can survive for extremely long
periods of time on crops, in water or in the soil (Feachem et al, 1983; Gerba et al., 1975).
Hardier enteric pathogens, such as protozoan parasites and enteric viruses, experience
longer survival than some traditional indicators such as coliforms (Gerba, 2000; Seymour
29
and Appleton, 2001). Survival and migration are the major factors controlling virus fate
in the subsurface environment (Yates et al., 1987; Schijven and Hassanizadeh, 2000).
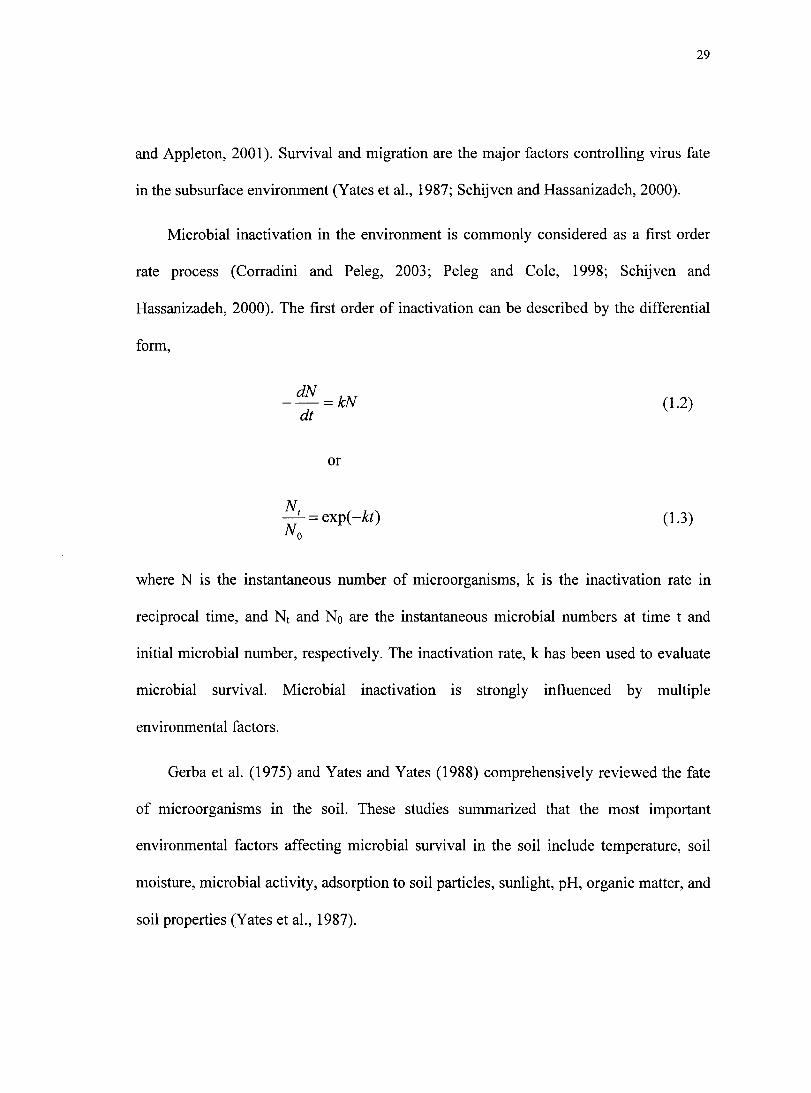
Microbial inactivation in the environment is commonly considered as a first order
rate process (Corradini and Peleg, 2003; Peleg and Cole, 1998; Schijven and
Hassanizadeh, 2000). The first order of inactivation can be described by the differential
form,
where N is the instantaneous number of microorganisms, k is the inactivation rate in
reciprocal time, and Nt and No are the instantaneous microbial numbers at time t and
initial microbial number, respectively. The inactivation rate, k has been used to evaluate
microbial survival. Microbial inactivation is strongly influenced by multiple
environmental factors.
Gerba et al. (1975) and Yates and Yates (1988) comprehensively reviewed the fate
of microorganisms in the soil. These studies summarized that the most important
environmental factors affecting microbial survival in the soil include temperature, soil
moisture, microbial activity, adsorption to soil particles, sunlight, pH, organic matter, and
soil properties (Yates et al., 1987).
(1.2) dt
or
(1.3)
30
Temperature is the single most important factor influencing microbial survival.
Lower temperature favors the survival of microorganisms, particularly for viruses
(Schijven and Hassanizadeh, 2000; Bitton, 1980). Hurst et al. (1980) reported that of the
significant factors affecting virus survival, overall temperature and virus adsorption to
soil appeared to be the most important factors. Repeated freeze-thaw cycles could be
detrimental for fecal streptococci survival (Kibbey et al., 1978).
Soil moisture is a principal factor determining microbial survival, particularly for
bacteria (Gerba et al. 1975). Bacteria survive longer in moist soils than in dry soils (Yates
and Yates, 1988; Kibbey et al., 1978). Bacterial inactivation rates were generally
proportional to the moisture decrease and a drastic effect was observed in samples
containing more than 90 % solids in sludge (Yeager and Ward, 1981). Although previous
studies regarding the effects of soil moisture on virus survival are conflicting and indicate
no clear trend (Bagdasaryan, 1964), the majority of the reports indicated a significant
influence of soil moisture on virus inactivation (Yates and Yates, 1988). Hurst et al.
(1980) showed that the inactivation rate of poliovirus 1 increased as the soil moisture
content of a sandy soil increased from 5 to 15 % and then decreased when soil moisture
further increased from 15 to 25 %. This study also found that the inactivation rate was the
greatest near soil moisture saturation.
Yeager and O'Brien (1979) reported that evaporation may be the primary cause of
viral inactivation in drying soils and a critical moisture threshold may exist, indicating the
important relationship between temperature and the time required for soil dewatering by
evaporation. This study found that infective virus recovery decreased gradually from 18

% to 2.9 %, while a marked decrease was noted at 1.2 % and 0.6 % soil moisture. This
agreed with the study conducted by Straub et al. (1992). This study reported rapid
inactivation of coliphages, MS-2 and PRD-1, regardless of soil temperature when the
moisture content was decreased to 2.9 %. However, temperature became the most
important factor at a soil moisture greater than 10 %.
The adsorption of viruses to soils and other surfaces may prolong or reduce viral
survival depending on the properties of the sorbent (Yates and Yates, 1988). The strong
association with the particle surface may induce spontaneous disassembly of virus
resulting in reduced survival. Gerba and Schaiberger (1975) have suggested several
possibilities including interference with the action of virucides, increased stability of viral
protein capsid, prevention of aggregate formation, and adsorption of enzymes and other
inactivating substances. Schijven and Hassanizadeh (2000) indicated that the attachment
of viruses to solids may significantly reduce inactivation by preventing them from
entering into the air-water interface or the air-water-solid contact line.
In general, bacteria survive better in alkaline soils (pH > 5) than in acid soils, while
most enteric viruses are stable in pH 3 to 9 (Yates and Yates, 1988). Increased bacterial
survival in sterile soil has been reported due the absence of predators or competing
organisms, while there are conflicting reports for virus survival. According to Hurst et al.
(1980), virus survival under aerobic sterile, anaerobic sterile and nonsterile conditions
was greater than under aerobic non-sterile conditions. However, in lower temperatures,
there was no difference in virus survival possibly due to no competition by much slower
metabolism rates.
Aggregates are more resistant to inactivation than single virions because all virions
within an aggregate must be inactivated before the aggregate as a whole is considered
inactive. Undamaged components of inactive virions within an aggregate may recombine
to cause host-cell infection (Grant, 1995).
Davies-Colley et al. (1999) reported that sunlight and its interaction with other
factors have a significant influence on the inactivation of fecal indicator microorganisms.
Sinton et al. (1994) indicated that enterococci have a greater resistance to sunlight
inactivation compared to fecal coliforms. Sinton et al. (2002) showed that sunlight
inactivation in freshwater was 10 times greater than dark inactivation for all indicators
including E. coli, enterococci, fecal coliforms, F-RNA phages, and somatic phages. The
UV-B portion of the solar spectrum is the most bacteriocidal, causing direct
(photobiological) DNA damage. At wavelengths above 329 nm, photochemical
mechanisms become more important, usually acting through photosensitizers to damage
cell membranes and tending to be more injurious in the presence of oxygen.
The presence of the air-water-solid interface can affect virus survival (Thompson
and Yates, 1999). Schijven and Hassanizadeh (2000) found that the contact with the air-
water interface increased virus inactivation and repeated attachment and detachment
resulted in enhanced virus inactivation. At the air-water-solid interface, hydrophobic
regions of the virus will partition out of solution and into the gas phase via the
reconfiguration of capsid proteins, which may result in a loss of viral infectivity
(Thompson et al., 1998).

33
A study conducted by Mbithi et al. (1991) concluded that the survival of Hepatitis A
virus was inversely proportional to the level of relative humidity and temperature. This
result agreed with results by Stine (2004) indicating that, in spite of variation, overall
longer survival of viruses, Hepatitis A, Feline calicivirus, and PRD-1 were observed in
dry conditions than in humid conditions. Theunissen et al. (1993) indicated that gram-
negative bacteria survived longer at low temperatures and relative humidity whereas
gram-positive bacteria in low temperature and high relative humidity. In general, gram-
positive bacteria survive longer than gram-negative bacteria in aerosols. Viruses with
membrane lipids are more stable in aerosols than are viruses without membrane lipids.

34
CHAPTER 2. EFFICIENT WATER USE OF SUBSURFACE DRIP
IRRIGATION IN COMPARISON WITH FURROW IRRIGATION
SUMMARY
The objectives of this study were to compare water use efficiencies between
subsurface drip irrigation and furrow irrigation. The uniformity of used drip tapes was
also tested to determine if clogging was a significant issue. Three crops, cantaloupe,
lettuce, and bell pepper were grown in four plots for each irrigation system. After being
used for two lettuce growing seasons, drip tapes were retrieved and emitter flow rates
were measured. Significantly less water with subsurface drip irrigation (68.5 % for
cantaloupe and 55.6 % bell pepper) was applied to produce similar crop yields achieved
by furrow irrigation. Water use efficiencies with subsurface drip irrigation were
significantly higher for cantaloupe (P-value = 0.016) and bell pepper (P-value = 0.000)
than with furrow irrigation. Lettuce showed moderately higher water use efficiency
during the first two seasons, while no difference was observed in the third season.
Uniformity of drip tapes tested was 92.1 % on the average and classified as good. The
high values of water use efficiency and uniformity indicate that subsurface drip irrigation
is a sustainable method for conserving irrigation water, especially when applied to deep-
rooted crops.
2.1. INTRODUCTION
Easily accessible water resources are being fully developed. To meet new demands
of water supplies due to population growth, agricultural and industrial development,

35
additional water resources need to be developed (Arar, 1989). New developments of
water resources require a great deal of effort and may not be economically feasible.
Therefore water conservation is of great importance, particularly in arid and semiarid
regions. Considering that irrigation is a significant portion of fresh water use, the
improvement of efficient water use in agriculture can relieve water shortages.
Crop yields with subsurface drip irrigation systems were equal to or better than with
other systems while a less water amount was required for subsurface drip irrigation
(Camp, 1998). This study also indicated that high-frequency subsurface drip irrigation
produced higher tomato yields than a one-time application of the same amount of water.
Fitz-Rodriguez (2002) and Suarez-Ray et al. (2000) reported equal or better turfgrass
quality with subsurface drip irrigation as compared to sprinkler irrigation. Oron et al.
(1991) reported several advantages of subsurface drip irrigation including reduced
evaporation, weed control, and enhanced workability. Subsurface drip irrigation has been
considered as an effective technique to reduce crop contamination when wastewater is
used for irrigation (Oron et al., 1991; Ruskin, 1992; Phene and Ruskin, 1995). Enriquez
et al. (2003) reported that viral contamination of turfgrass was minimal using subsurface
drip irrigation.
Camp (1998) reported a greater reduction in emitter uniformity for subsurface
systems than for surface drip systems after eight years of use, primarily because of
emitter plugging caused by soil entry into the main or sub-main during system
modification. After five years of use, Mitchell (1981) reported no deterioration of a
porous lateral wall but observed reduced flow rates. Emitter clogging by root intrusion

was identified and statistical uniformity of emitters was reduced from 91.8% to 86.2 %
without flow rate reduction after three years of turf irrigation (Choi and Suarez-Rey,
2004).
The primary purpose of this study was to compare subsurface drip irrigation with
furrow irrigation in terms of produce production and water use efficiency. The uniformity
of used drip tapes was tested to see if clogging was a significant issue.
2.2. MATERIALS AND METHODS
The three crops used for this study include cantaloupe (Mission variety hybrid,
Willhite Inc., TX), lettuce (Beacon variety, Paragon Seed Inc., CA), and bell pepper
(California Wonder, Willhite Seed Inc., TX). They were grown in the field at the Campus
Agricultural Research Center of the University of Arizona, Tucson, AZ.
2.2.1. Field preparation
Eight plots (each of 10 m (L) x 7 m (W) for cantaloupe, 10 m (L) x 5 m (W) for
lettuce and bell pepper) were prepared in a field with the overall size of 50 m (L) x 19 m
(W) (Figures 2-1). Four of them were subsurface drip irrigated, while the remaining four
were furrow irrigated. The field was plowed and four seedbeds, 110 cm wide - 20 cm tall
for cantaloupe and 55 cm wide - 20 cm tall for lettuce and bell pepper, were established
for each plot. Chapin turbulent twin-wall drip tapes were buried at approximately 30 cm
for cantaloupe, 20 cm for bell pepper, and 15 cm for lettuce below the soil surface.
Cantaloupe and bell pepper were seeded in a row whereas lettuce was seeded in two rows
on each bed. The emitters were spaced 20 cm apart and design flow rate was 1.9 1/h per

37
30.5 meters of drip tape at the operation pressure of 69 kPa. Sprinkler and subsurface drip
irrigation were used to germinate seeds for cantaloupe and lettuce, respectively. Bell
pepper was germinated on seedling beds and transplanted to the plots. Once the crops had
been established in the field, the subsurface drip and furrow irrigation systems were
separated.
2.2.2. Irrigation schedule
Furrow and subsurface drip irrigation in 2001 and 2002 took place approximately
once a week. Irrigation events were scheduled based on average soil moisture measured
by a time domain reflectometer (Soilmoisture Equipment Corp., Minitrase, Santa
Barbara, CA). Soil moisture to a depth of 50 cm was measured approximately every two
days in three locations per plot by inserting wave guides perpendicularly into the soil.
One of the advantages of pressurized irrigation such as subsurface drip irrigation is to
facilitate frequent irrigation. Intermittent irrigation was applied to SDI plots in 2003 at
different frequencies. Three separate schedules, 20 minutes every hour for cantaloupe, 15
minutes every one and half hours for lettuce, and 30 minutes every two hours for bell
pepper were implemented during the daytime (from 8 am to 6 pm). The amounts of water
applied were measured from flow meters installed at the entry to each plot.
2.2.3. Harvest
Crops were harvested in two 5 m, 3 m, and 1.5 m segments chosen in the two central
rows of each plot for cantaloupe, lettuce, and bell pepper, respectively. Fresh produce
weights of harvested crop were measured immediately after collection and converted to
produce yield per hectare.
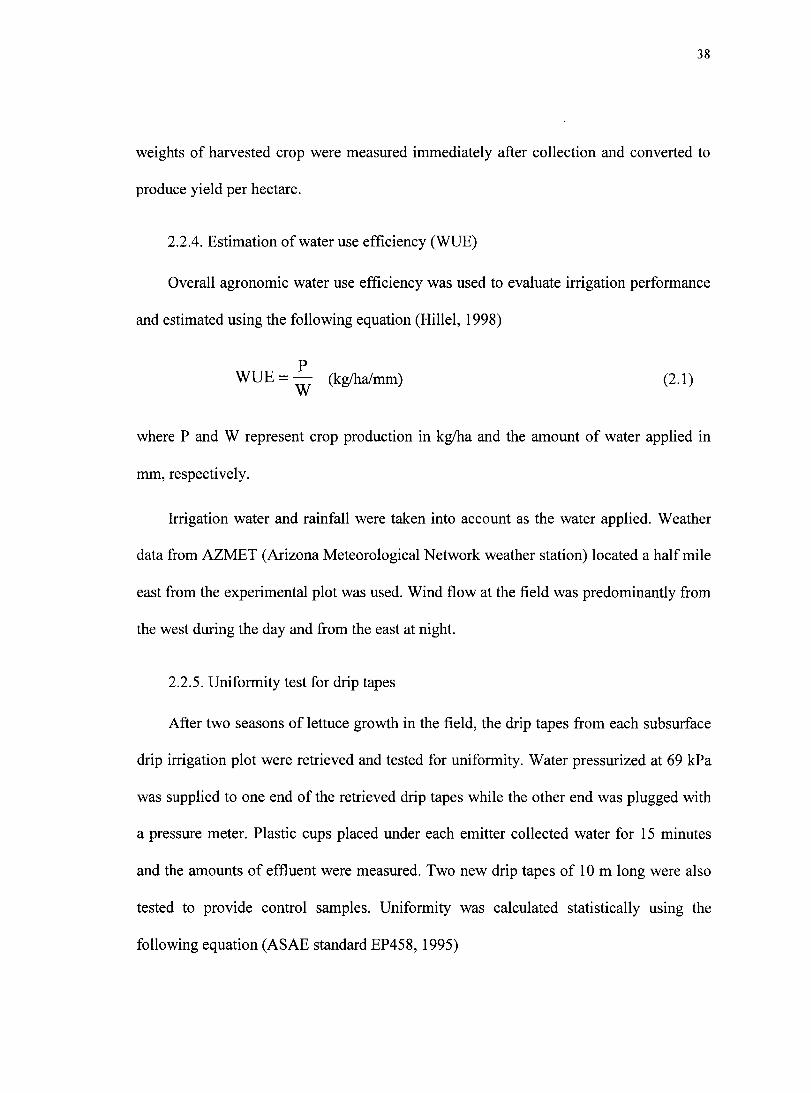
2.2.4. Estimation of water use efficiency (WUE)
Overall agronomic water use efficiency was used to evaluate irrigation performance
and estimated using the following equation (Hillel, 1998)
P WUE = — (kg/ha/mm) (2.1)
W
where P and W represent crop production in kg/ha and the amount of water applied in
mm, respectively.
Irrigation water and rainfall were taken into account as the water applied. Weather
data from AZMET (Arizona Meteorological Network weather station) located a half mile
east from the experimental plot was used. Wind flow at the field was predominantly from
the west during the day and from the east at night.
2.2.5. Uniformity test for drip tapes
After two seasons of lettuce growth in the field, the drip tapes from each subsurface
drip irrigation plot were retrieved and tested for uniformity. Water pressurized at 69 kPa
was supplied to one end of the retrieved drip tapes while the other end was plugged with
a pressure meter. Plastic cups placed under each emitter collected water for 15 minutes
and the amounts of effluent were measured. Two new drip tapes of 10 m long were also
tested to provide control samples. Uniformity was calculated statistically using the
following equation (ASAE standard EP458, 1995)
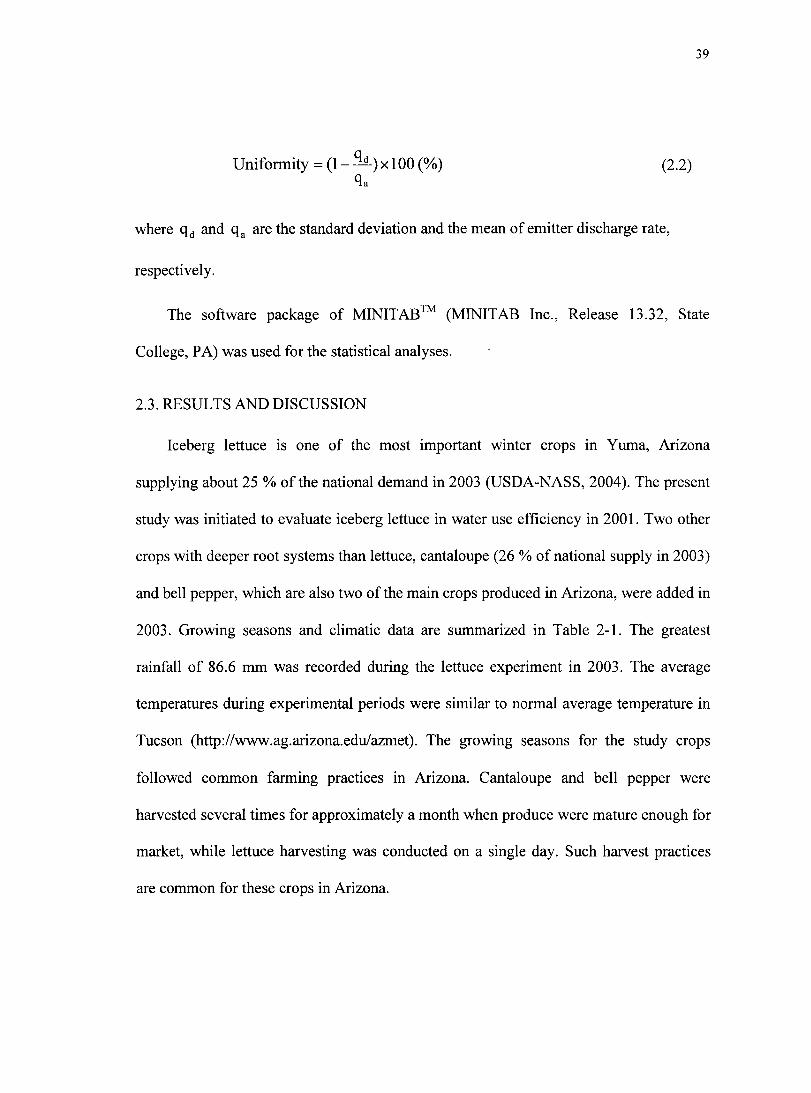
Uniformity = (1 - x 100 (%) (2.2) qa
where and are the standard deviation and the mean of emitter discharge rate,
respectively.
The software package of MINITAB™ (MINITAB Inc., Release 13.32, State
College, PA) was used for the statistical analyses.
2.3. RESULTS AND DISCUSSION
Iceberg lettuce is one of the most important winter crops in Yuma, Arizona
supplying about 25 % of the national demand in 2003 (USDA-NASS, 2004). The present
study was initiated to evaluate iceberg lettuce in water use efficiency in 2001. Two other
crops with deeper root systems than lettuce, cantaloupe (26 % of national supply in 2003)
and bell pepper, which are also two of the main crops produced in Arizona, were added in
2003. Growing seasons and climatic data are summarized in Table 2-1. The greatest
rainfall of 86.6 mm was recorded during the lettuce experiment in 2003. The average
temperatures during experimental periods were similar to normal average temperature in
Tucson (http://www.ag.arizona.edu/azmet). The growing seasons for the study crops
followed common farming practices in Arizona. Cantaloupe and bell pepper were
harvested several times for approximately a month when produce were mature enough for
market, while lettuce harvesting was conducted on a single day. Such harvest practices
are common for these crops in Arizona.

40
2.3.1. Applied water amount
The total amounts of water applied included irrigation water and rainfall. The water
supplied for germination was not counted in the total applied water amount (Table 2-2).
In general, cantaloupe used the most water as compared to the other crops. Much less
water was applied by subsurface drip irrigation than by furrow irrigation with the
exception of lettuce. The ratios of applied water by subsurface drip irrigation to the
average amount applied by furrow irrigation are presented in Table 2-2. Only 68.3 % and
55.6 % of the water amount used by furrow irrigation were required by the subsurface
drip irrigation system for cantaloupe and bell pepper, respectively. These results
generally agreed with the results from previous studies by Camp (1998) and DeTar et al.
(1996).
However, no significant differences in applied water amounts were observed in the
lettuce experiments. This might be because the root depth of lettuce is relatively shallow
as compared to the other crops. Thus, applied water for lettuce was not as readily
available as for cantaloupe and bell pepper which had deeper root depths. A study
conducted by Choi and Suarez-Rey (2004) indicated that water from the subsurface drip
emitters did not reach close to the soil surface where the dense root zone of turf is
located; thus, they reported no significant difference in the total amount of water applied
between subsurface drip and sprinkler irrigation. The deviation of the drip tapes from the
root zone might also reduce efficient water uptake for lettuce since the drip tapes buried
along the center of the seed beds while lettuce was planted in two rows at both edges of
the seedbed.

41
2.3.2. Crop yields and water use efficiencies
Table 2-3 presents crop yields and water use efficiencies for the three crops. Lettuce
showed the highest water use efficiency followed by cantaloupe and bell pepper.
However, there were no significant differences in crop yields between the irrigation
systems for any crop with the exception of lettuce in 2001 (Figure 2-3). The lettuce yield
in 2002 was lower as compared to those in 2001 and 2003 due to the lower temperature.
The average temperature during the lettuce experiment in 2002 was lower by
approximately 7 °C than those in 2001 and 2003 (Table 2-1). The variety of lettuce used
was for a fall season rather than a winter and the experiment in 2002 was delayed for
about a month due to hail damage. The lettuce yield in 2003 when intermittent subsurface
drip irrigation had been applied was significantly greater than in 2001 (P=0.017).
However, this could be due to climatic or other factors since the same trend was observed
for furrow irrigation.
Water use efficiencies with subsurface drip irrigation were significantly higher than
those with furrow irrigation for cantaloupe (P-value = 0.016) and bell pepper (P-value =
0.000) as shown in Figure 2-4. This is mainly because much less water was used with
subsurface drip irrigation than with furrow irrigation for cantaloupe and bell pepper
growth, while the crop yields were similar. Only lettuce in 2001 showed significantly
higher water use efficiency with subsurface drip than with furrow irrigation due to higher
yield (P-value = 0.038). The water use efficiencies of lettuce in 2002 and 2003 were not
significantly different between the two irrigation systems.

42
2.3.2. Drip uniformity test
The flow rates of two unused and eight retrieved drip tapes from the lettuce field
after two years of burial were measured from the emitters. As summarized in Table 2-4,
the average emitter flow rates from the retrieved drip tapes were reduced by 5.9 % on
average varying from 2.7 % to 9.9 % as compared to unused drip tapes. Emitter clogging
by ion precipitation appeared to cause this flow rate reduction. However, no obvious root
intrusion was observed. Uniformity of used drip tapes was 92.1 % on the average varying
from the lowest of 84.8 % to the highest of 96.9 %. According to ASAE standard EP458
(1995) (95-100 % as excellent, 85-90 % as good, and 75-80 % as fair), the uniformities
tested were at least classified as good. Proper management of the water supply and
chemical injection to prevent emitter performance degradation may be necessary for
longevity with subsurface drip systems.
2.4. CONCLUSION
Three crops, cantaloupe, lettuce, and bell pepper were grown in the field using two
irrigation systems, subsurface drip and fiirrow irrigation. Only 68.3 % and 55.6 % of the
applied water for furrow irrigation was used for subsurface drip irrigation for cantaloupe
and bell pepper, respectively. Lettuce required similar amount of water. However, no
significant differences in crop yields were observed between the irrigation systems except
for lettuce in 2001. Water use efficiencies with subsurface drip irrigation were
significantly higher than with furrow irrigation for cantaloupe (P-value = 0.016) and bell
pepper (P-value = 0.000) due to much lower water requirements. Lettuce did not show a
significant difference in water use efficiency except for in 2001 (P-value = 0.038).
43
Uniformities of used drip tapes after two seasons of lettuce irrigation varied from 84.8 %
to 96.9 % (92.1 % on average) and overall classified as good. However, long-term
performance of subsurface drip tapes may reduce flow rates by emitter clogging. Proper
management of water supply and chemical injection to prevent emitter plugging may be
necessary for longevity with subsurface drip systems. It was concluded that subsurface
drip irrigation can be an efficient technique in conserving water, especially when applied
to deep-rooted crops.
44
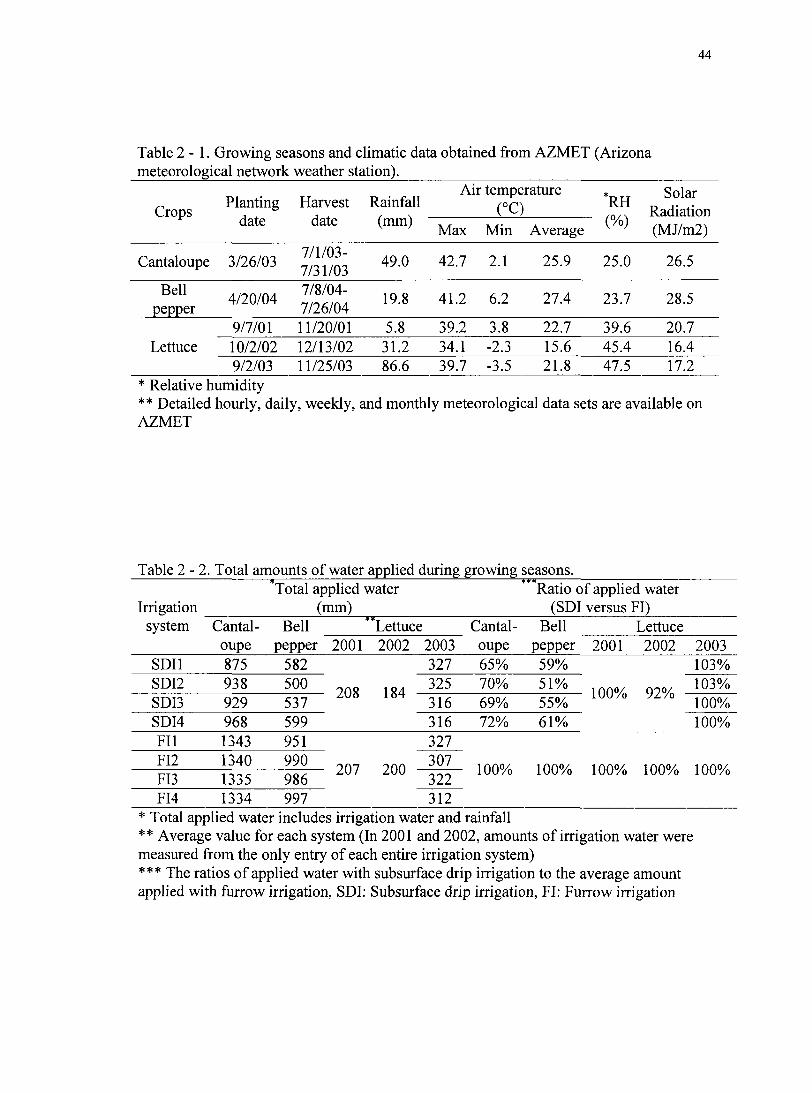
Table 2-1. Growing seasons and climatic data obtained from AZMET (Arizona meteorological network weather station).
Crops Planting
date Harvest
date Rainfall
(mm)
Air temperature (°C) *RH
Solar Radiation Crops
Planting date
Harvest date
Rainfall (mm)
Max Min Average (%)
(MJ/m2)
Cantaloupe 3/26/03 7/1/03-7/31/03
49.0 42.7 2.1 25.9 25.0 26.5
Bell pepper
4/20/04 7/8/04-7/26/04
19.8 41.2 6.2 27.4 23.7 28.5
9/7/01 11/20/01 5.8 39.2 3.8 22.7 39.6 20.7 Lettuce 10/2/02 12/13/02 31.2 34.1 -2.3 15.6 45.4 16.4
9/2/03 11/25/03 86.6 39.7 -3.5 21.8 47.5 17.2 * Relative humidity ** Detailed hourly, daily, weekly, and monthly meteorological data sets are available on AZMET
Table 2-2. Total amounts of water applied during growing seasons.
Irrigation Total applied water
(mm) Ratio of applied water
(SDI versus FI) system Cantal Bell Lettuce Cantal Bell Lettuce
oupe pepper 2001 2002 2003 oupe pepper 2001 2002 2003 SDIl 875 582 327 65% 59% 103% SDI2 938 500
208 1 9.A 325 70% 51% 100% QlOA 103%
SDI3 929 537 208 1 OH
316 69% 55% 100% VZ /o
100% SDI4 968 599 316 72% 61% 100% FIl 1343 951 327 FI2 1340 990
207 onn 307 100% 100% 100% 100% 100%
FI3 1335 986 207 zwu
322 100% 100% 100% 100% 100%
FI4 1334 997 312 * Total applied water includes irrigation water and rainfall ** Average value for each system (In 2001 and 2002, amounts of irrigation water were measured from the only entry of each entire irrigation system) *** The ratios of applied water with subsurface drip irrigation to the average amount applied with furrow irrigation, SDI: Subsurface drip irrigation, FI; Furrow irrigation
45
Table 2-3. Crop yields and water use efficiencies. Production Water use efficiency
Plot (ton/ha) (kg/ha/mm) Numbers Cantal Bell Lettuce Cantal Bell Lettuce
oupe pepper 2001 2002 2003 oupe pepper 2001 2002 2003
SDIl 187.4 55.0 61.5 51.5 68.6 214.1 94.5 295.4 279.1 209.7
SDK 182.2 53.2 58.6 37.9 76.7 194.3 106.6 281.8 205.3 236.0
SDI3 137.6 52.5 61.2 44.8 60.9 148.1 97.8 294.4 242.8 192.8
SDI4 173.8 55.6 48.2 48.1 73.0 179.6 92.8 231.7 260.7 230.7 FIl 171.8 61.3 52.7 43.1 76.2 127.9 64.4 254.7 215.0 232.8
FI2 196.8 44.5 45.7 43.1 63.9 146.9 45.0 220.7 215.0 208.1
FI3 162.0 56.6 44.5 34.1 70.9 121.3 57.5 214.7 170.3 220.2
F14 137.8 55.4 43.1 52.2 64.5 103.3 55.5 208.1 260.2 206.9 * SDI: Subsurface drip irrigation, FI: Furrow irrigation
Table 2-4. Flow rates and uniformities of retrieved drip tapes after two seasons of lettuce irrigation.
'Samples Average flow rates
of emitters (1/hr)
Standard deviation
of flow rates (1/hr)
Uniformity **Number of
impaired emitters out of 50 tested
Control 1 0.78 0.02 97% 0 Control 2 0.77 0.02 98% 0 SDI 1-1 0.74 0.02 97% 0 SDI 1-2 0.74 0.11 85% 1 SDI 2-1 0.72 0.09 87% 1 SDI 2-2 0.73 0.03 96% 0 SDI 3-1 0.70 0.05 94% 3 SDI 3-2 0.71 0.11 85% 3 SDI 4-1 0.75 0.02 97% 1 SDI 4-2 0.75 0.02 97% 1
* Control: unused drip tape, SDI: drip tapes retrieved from subsurface drip irrigated plot ** No. of emitters of which flow rates are less than 90 % of average value

46
SDI
FI
FI
SDI
Irrigation water
_J
Fertilizer and microorganisms injection
Mixing distance '
Water supply
1 r ""i I
.t-L U U' ' LI 11 11 11
JT n 11 n i: IT n.
SDI FI Experimental Plot
FI SDI
[r Filter
!F i Injection pump
(V Pressure Guage
Z Auto Flow Controller
V Manual Valve
Flow Meter
Figure 2-1. Schematics of the experimental field (SDI and FI represent subsurface drip and furrow irrigation, respectively. Width was 5 m for lettuce and bell pepper fields and 7 m for cantaloupe field. Unit: meter).
Lettuce Bell pepper
-i, ! /v W I \ /' y-^ o
Drip tape
Lettuce and bell pepper
1 . 1 Omit^loupc r" - — -- — --»-i
>• '' ' lP'3 /
• 0.3 o o \ 0.2
Cantaloupe
Figure 2-2. Cross section of each plot (D indicates the depth of drip tape installation which was 0.15 m for lettuce and 0.20 m for bell pepper. Unit: meter).
200
150 c o
2 100
e. 2 U 50
1 Cantaloupe Bell pepper
• Subsurface drip irrigation
• Furrow irrigation
1 1 2001 2002 2003
Crops
2002
Lettuce
Figure 2-3. Comparison of crop yields between irrigation systems (Error bars indicate standard deviations).
48
^ 350
I 300
^ 250
o 200 C
<L> U 100 VI 3 fe 50
^ 0
• Subsurface drip irrigation
• Furrow irrigation
Cantaloupe Bell pepper Lettuce
Crops
Figure 2-4. Comparison of crop water use efficiencies between irrigation systems (Error bars indicate standard deviations).

49
CHAPTER 3. IRRIGATION WITH WASTEWATER AND
MICROBIAL CROP CONTAMINATION
SUMMARY
This study was conducted to compare subsurface drip irrigation with furrow
irrigation in crop contamination with microbial-contaminated water irrigation. Survival of
the study microorganisms, Escherichia coli ATCC 25922, Clostridium perfringens, and
coliphage PRD-1 in the field, was also studied. Cantaloupe, iceberg lettuce, and bell
pepper were grown in eight plots, each 10 m long and 4 m wide. Four of these plots
received subsurface drip irrigation (SDI) water while the remaining plots were furrow
irrigated (FI). Six samples of each produce, surface, and subsurface (10 cm) soil were
collected on days 1, 3, 5, 7, 10, and 14 after the application of the study microorganisms.
Overall, significantly greater produce contamination occurred in FI plots than in SDI
plots. A greater contamination occurred on the surfaces of cantaloupe and lettuce, while
none of the study microorganisms were recovered from bell pepper surface. Coliphage
PRD-1 showed greater persistence than E. coli 25922 in the soil. C. perfringens
experienced little inactivation during the experiment suggesting that it can be a
conservative indicator of fecal contamination. It was concluded that the combination of
subsurface drip irrigation with proper management can reduce crop contamination when
microbial-contaminated water is used to irrigate crops for human consumption.

50
3.1. INTRODUCTION
Recycling of wastewater in the future may not be an option but a requirement
because of water shortages, especially in arid and semi-arid regions. Wastewater reuse for
irrigation can be a sustainable strategy for conserving water resources, recycling nutrients
as well as disposing waste in an inexpensive and sanitary manner. Treated wastewater has
an important potential in water resources management by releasing freshwater sources for
potable water supplies and other uses (Pescod, 1989). However, agricultural reuse of
wastewater can pose health risks to farmers and the consumers of produce which has
been irrigated with wastewater due to the possible presence of pathogenic
microorganisms. This concern has led to the restriction of reclaimed water use for
agricultural purposes by guidelines which might be overly conservative (Shuval, 1991;
WHO, 2000).
A number of studies comparing irrigation systems have suggested that subsurface
drip irrigation can be an alternate irrigation technique for wastewater irrigation.
Subsurface drip irrigation systems have advantages over other methods, increasing not
only crop yields but also water use efficiency (Camp, 1998; Schneider and Howell,
2001). Seymour and Appleton (2001) reported that food-borne outbreaks can arise in the
growth and harvesting area because of contact with polluted water and inadequately
treated sewage sludge used for irrigation and fertilization. SDI systems can also reduce
health risks from reclaimed water use by minimizing the exposure of the irrigated water
to people or agricultural produce and filtering potential pathogens through the soil (Oron
et al., 1992 and 1995; Alum et al., 2000; Enriquez et al., 2003).
51
Under favorable conditions, enteric pathogens can survive for extremely long
periods of time on crops, in water or in the soil (Feachem et al, 1983; Gerba et al., 1975).
The important envirormiental factors affecting microbial survival include temperature,
adsorption to the particulate matter, salinity, pH, solar radiation, soil moisture, soil type,
etc. (Gerba et al, 1975).
Hardier enteric pathogens, such as protozoan parasites and enteric viruses,
demonstrated longer survival than some traditional indicators such as coliforms (Gerba,
2000). Compared to viruses such as poliovirus, enteric adenovirus, and MS-2, PRD-1 has
been reported to survive the longest under different environmental conditions, suggesting
PRD-1 can be a useful surrogate for enteric viruses (Enriquez et al. 2003). Clostridium
perfringens can survive for extended periods of time, is heat resistant, and is resistant to
disinfection (Gerba, 2000).
The objectives of this study were to compare microbial contamination levels for
subsurface drip irrigation and furrow irrigation systems and to investigate the survival of
the study microorganisms under various conditions.
3.2. MATERIALS AND METHODS
Cantaloupe (Mission variety hybrid, Willhite Inc., TX), iceberg lettuce (Beacon
variety. Paragon Seed Inc., CA), and bell pepper (California Wonder, Willhite Seed Inc.,
TX) were grown for this study at the Campus Agricultural Research Center in Tucson,
Arizona.
3.2.1. Field preparation
A field with an overall size of 50 m (L) x 19 m (W) was divided into eight plots, 10
m long and 4 m wide (Figure 2-1). Four plots received subsurface drip irrigation water
while the remaining plots were furrow irrigated. The soil was sandy loam, which is one
of two typical soil types used for crop production in Arizona. Four rows of seedbeds (110
cm wide for cantaloupe and 55 cm wide for lettuce and bell pepper) were shaped for each
plot and drip tapes were buried (30 cm for cantaloupe, 15 cm for lettuce, and 20 cm for
bell pepper). Cantaloupe and bell pepper were seeded in a row while lettuce was seeded
in two rows with approximately 30 cm spacing. Sprinkler and subsurface drip irrigation
was used to germinate cantaloupe and lettuce, respectively. Bell pepper was germinated
on seedling beds and transplanted to the field. Irrigation systems were separated into
subsurface drip and furrow irrigation after crop germination.
3.2.2. Application of the study microorganisms
Escherichia coli ATCC 25922, Clostridium perfringens ATCC 3624, and coliphage
PRD-1 were obtained from the American Type Culture Collection (ATCC, Rockville,
MD) or from the University of Arizona Department of Soil, Water, and Environmental
Science. Media were supplied by Difco (Detroit, MI) unless stated otherwise. E. coli
ATCC 25922 was grown overnight in tryptic soy broth at 37°C. C. perfringens was
grown in cooked meat media. Duncan-Strong raffinose (Sigma Chemical Co., St. Louis,
MO) was used to sporulate C. perfringens, as described in the FDA Bacteriological
53
Analytical Manual (1998). Coliphage PRD-1 was propagated using Salmonella
typhimurium ATCC 19585 as the host bacteria (Governal and Gerba, 1997).
The microorganisms were mixed using a stir plate in a 20-liter container for 10
minutes and pump-injected into the irrigation water as it was being applied to the fields.
Approximately 1.67xl0'^ plaque forming units (pfu), 3.73x10^° colony forming units
o (cfu), and 1.67x10 cfu for PRD-1, E. coli, and C. perfringens, respectively, were applied
to each irrigation plot. Background samples of irrigation water, plants, and soil were
collected before the injection. The presence of chloride in irrigation water was tested
using the DPD colorimetric method (Hach Chemical Co., Loveland, CO) prior to
application. Subsurface drip and furrow irrigation plots were inoculated independently.
Influent water samples were taken fi:om the outlets of the irrigation line for each plot.
3.2.3. Sample collection
Three replicates of produce, surface soil, and subsurface (10 cm) soil samples per
each irrigation system were collected on days 1, 3, 5, 7, 10, and 14 after the application of
the study microorganisms. Soil samples were taken randomly from the furrow in furrow
irrigated plots and from the seed bed in subsurface drip irrigated plots.
Cantaloupes were cut from the vine, and the area in contact with soil was marked
and used for assay. Any clinging soil was removed from the samples. Lettuce heads were
cut from the stem and the 2-3 outermost leaves were discarded to reflect standard
industry harvesting techniques. Bell peppers were removed from the plants by hand. All

54
samples were collected in large plastic bags and placed in an ice chest until assayed in the
laboratory.
A small spatula was used to collect surface soil samples, while a bucket auger was
used to collect the subsurface soil samples. All equipment used to collect samples was
disinfected between each sample collection by cleaning with a solution of water, 30%
bleach, followed by a solution of 10% sodium thiosulfate.
3.2.4. Microbial assay
E. coli ATCC 25922 was assayed using the Colilert quanti-tray system (IDEXX,
Westbrook, MA). C. perfringens was assayed using m-CP media (Difco, Detroit, MI) as
described by Armon and Payment (1988). PRX)-1 coliphage was assayed using the
plaque-forming unit method with the bacterial host S. typhimurium ATCC 19585, as
described by Govemal and Gerba (1997). All microorganisms were incubated on their
respective media for 18-24 hours at 37 °C.
3.2.5. Estimation of inactivation rate
Microbial inactivation was assumed to follow first-order kinetics and the
inactivation rates were evaluated using the following equation
TV. _j . f — = 1 0 ' ( 3 . 1 )
where t, Nt, No, and kd represent time (days), numbers of microorganisms at t days,
initial, and inactivation rate (1/days), respectively.

55
The MINITAB™ software package (MINITAB Inc., Release 13.32, State College,
PA) was used to conduct statistical analyses.
3.3. RESULTS AND DISCUSSION
Cantaloupe and bell pepper experiments were conducted during the summer, while
lettuce was done in the winter season. The crop growing seasons followed common
farming practices in Arizona. As shown in Table 3-1, average ambient temperature was
the highest during the cantaloupe experiment and the most rainfall occurred during the
lettuce experiment. Solar radiation intensity during the bell pepper experiment was
greater than during the cantaloupe experiment because of fewer rainy days during the bell
pepper experiment in spite of lower ambient temperatures. Soil temperature at the 10 cm
depth was approximately 8 °C lower than air temperature for the cantaloupe and bell
pepper experiments, while these values were similar during the lettuce experiment.
3.3.1. Crop contamination
Coliphage PRD-1 contamination was more pronounced on the surfaces of
cantaloupe and lettuce as compared to E. coli (Figure 3-1). Most C. perfringens recovery
values were less than the detection limit because of the lower titer application in spite of
repeated attempts to increase the titer. Assuming that irrigation water is contaminated, the
most vulnerable areas to contamination would be on both edges of seedbeds in furrow
irrigated plots and in the vicinity of the buried drip tapes in subsurface drip irrigated
plots. Furrow irrigation water advances toward the center of the seedbed, while
subsurface drip irrigated water moves upward from the drip tapes. It is likely that

coliphage PRD-1 can be easily transported with the water movement through soil
matrices because of its relatively smaller size as compared to E. coli and render crops to
be contaminated by indirect contact of irrigation water via contaminated soil. The size of
PRD-1 is known to be 62 nm, while E. coli and C. perfringens are greater than 1 |a,m.
(Maier et al., 1999).
Water movement and wetting patterns of the soil surface appeared to be closely
associated with crop contamination. To investigate the relationship between crop
contamination and surface soil wetness, soil samples underneath the harvested
cantaloupes and near the lettuce stems were collected to estimate soil moisture. Figure 3-
2 clearly shows that the greater the surface soil moisture content was, the greater the
microbial recoveries were.
Cantaloupe contamination was not significantly different between the two irrigation
systems. Cantaloupe vines can grow not only on the seedbed but in the furrow where
furrow irrigation water is applied. However, the vines were guided to the seedbed, which
is a common farming practice for cantaloupe in order to provide furrows for machinery
passage for management and harvest. With the initiation of irrigation for cantaloupe,
loose soil of the seedbeds caused by plowing settled down above the buried drip tapes.
Both water marks and direct movement of the irrigation water also appeared on the
seedbed in subsurface drip irrigation plots. Most of the cantaloupe samples were
collected from areas vulnerable to contamination, which was considered to be the worst-
case scenario. For this reason, the contamination level of cantaloupe was similar for both
irrigation systems. It should also be noted that the median values of recoveries from
cantaloupe surface are extremely biased to the lower 25"^ percentile, which means that at
least half of the microbial recovery values was not significant. Extreme tails and outliers
were suspected to be contaminated by direct contact of produce with irrigation water.
Significantly greater PRD-1 contamination of lettuce was observed in furrow
irrigated plots than in subsurface drip irrigated plots (P-value = 0.004), while the
difference in E. coli contamination was not significant. Water wetting marks beneath
lettuce plant and direct contact of lettuce leaves with irrigation water was observed in
furrow irrigated plots. Unlike the cantaloupe experiment, neither soil settlement or
significant preferential flow appeared on the seedbeds in subsurface drip irrigation plots
in the lettuce and bell pepper experiments. These phenomena may be a result of the
difference in the compactness of the seedbeds. Relatively compact seedbeds were
achieved in shaping the narrower seedbeds, which grew lettuce and bell pepper, as
compared to those for cantaloupe (Figure 2-2).
None of the study microorganisms were recovered from bell pepper surface. This
was expected since bell pepper is an aerial crop and does not come into contact with the
soil.
3.3.2. Soil contamination
Soil surface contamination is of concern because of the possible transmission of
microbial contaminants to produce as well as to farmers, especially during harvesting.
The highest recoveries of the study microorganisms occurred on the soil surface in
furrow irrigated plots, where irrigation water is directly applied. Fewer of the study

58
microorganisms were recovered from the soil surface in subsurface drip irrigation plots as
compared to fiirrow irrigation (P-values < 0.047, Figure 3-3). No significant
contamination of the surface soil was observed in the lettuce and bell pepper experiments.
Cantaloupe was the exception to this due to the preferential flow and vine guidance as
mentioned earlier. Both irrigation systems showed great variations in recoveries except
for C. perfringens, especially in the cantaloupe experiment. This was because of not only
microbial decay but non-uniform distribution of the study organisms. Irrigation water
directly was applied to the furrow surface and initial distribution of the study
microorganisms was relatively uniform. The inactivation of the study microorganisms
during the experiments could potentially be the main cause of the variation in furrow
irrigated plots. Subsurface drip irrigated water must penetrate the soil layer before
reaching the surface, during which soil non-homogeneity, such as preferential water
paths, could play a role and result in non-uniform soil penetration of the organisms to the
soil surface. The bias of median values to the lower quartile in subsurface drip irrigated
plots can be another explanation for this. Relatively small variation from furrow
irrigation plots in lettuce implies slower inactivation as compared to the other
experiments due to the lower ambient temperatures during the lettuce experiment. This
suggests that subsurface drip irrigation with proper management can be an alternate
technique to reduce crop contamination when irrigating crops with treated wastewater.
Figure 3-4 shows the recoveries from the soil samples at a depth of 10 cm. As
compared to the soil surface, much greater contamination of subsurface soil occurred in
subsurface drip irrigated plots. Almost none of the study organisms showed a significant
differences in recoveries when comparing two irrigation systems. The only exception to
this was the bell pepper, which showed no significant contamination in subsurface drip
irrigation plots. Greater contamination was observed in subsurface soil than on the soil
surface in subsurface drip irrigated plots. This was expected because subsurface soil is
closer to where subsurface drip irrigation water is applied. Again, greater variation was
observed in the subsurface drip irrigated plots as described earlier.
Overall higher contamination by PRD-1 was observed in subsurface soil than on the
soil surface not only with subsurface drip irrigated but in furrow irrigated plots with the
exception of the lettuce. This can be explained by a combined effect of inactivation and
transport mechanisms. PRD-1 on the soil surface experienced more rapid die-off, while a
greater number of coliphage applied was transported to the subsurface as compared to the
other larger bacteria. Higher inactivation occurred on the soil surface than in subsurface
soil. However, inactivation rates between the soil surface and subsurface were not
significantly different during the lettuce experiment probably due to the lower
temperatures. Much lower recoveries of E. coli and C. perfringens in subsurface soil than
on the soil surface in furrow irrigated plots imply that those organisms could not
penetrate the soil matrices as efficiently as PRD-1 because of their greater size.
3.3.3. Inactivation rates on or in the soil
The inactivation rates of the study microorganisms were estimated using the survival
data from soil surface and subsurface soil in furrow irrigated plots, where the study
organisms were applied relatively uniformly (Figure 3-5). No consistent die-off trend was

60
observed in the subsurface drip irrigated plots because of the wide variations in
recoveries. C. perfringens experienced little die-off during the experimental period. Stine
et al. (2004) found that C. perfringens generally survived for longer periods on the
surfaces of cantaloupe, lettuce, and bell pepper than other bacteria under both humid and
dry conditions in a growth chamber. This suggests that C. perfringens could serve as a
conservative indicator of fecal contamination.
Although inactivation rates were not statistically different, the soil surface showed
overall greater inactivation rates than the subsurface soil. The soil surface is generally
harsher to microbial survival because of desiccation and exposure to solar radiation.
However, no difference of microbial inactivation rates in the lettuce experiment was
observed, likely because the experiment was conducted during winter when the ambient
temperature was much lower than the other experiments (Table 3-1). Coliphage PRD-1
showed consistently lower inactivation rates than E. coli 25922 except for the lettuce
experiment. This is consistent with the previous study reporting that viruses are more
persistent in harsh envirormients than are bacteria (Schneider and Howell, 2001).
3.4. CONCLUSION
The present study compared subsurface drip irrigation and furrow irrigation relative
to the potential for crop contamination. Cantaloupe, lettuce, and bell pepper were grown
and irrigated with microbial-contaminated water.
Overall, coliphage PRD-1 contamination was pronounced on the surfaces of the
cantaloupe and lettuce as compared to E. coli. The relatively smaller size of PRD-1 as

compared to E. coli seemed to facilitate its transport through soil matrix along irrigation
water movement, thus resulting in greater crop contamination. None of the study
microorganisms were recovered from bell pepper surface. Furrow irrigation showed
generally greater microbial contamination of crops and the soil surface than subsurface
drip irrigation. Cantaloupe was the exception to this. Unlike other crop experiments,
direct movement of irrigation water was observed on the seedbeds in subsurface drip
irrigation plots for cantaloupe. Preferential water paths from the emitters to the soil
surface appeared to be established as the loosened soil settled dovm upon irrigation. No
significant contamination of the soil surface was observed in subsurface drip irrigated
plots for the lettuce and bell pepper experiments.
Transport and inactivation were two primary mechanisms impacting crop and soil
contamination. Coliphage PRD-1 can be more readily transported through soil than
bacteria, E. coli and C. perfringens due to the smaller size. Greater inactivation of the
study organisms occurred on the soil surface than in the soil probably due to desiccation
and exposure to solar radiation.
Coliphage PRD-1 showed consistently more persistence than E. coli in the soil
environment. Little die-off of C. perfringens occurred even on the soil surface during the
experimental periods suggesting that the bacteriod spores can serve as a conservative
indicator of fecal contamination. It was concluded that the combination of subsurface
drip irrigation with proper management can reduce crop contamination when microbial-
contaminated water is used for irrigation water.

Table 3-1. Experimental periods and climatic data obtained from AZMET (Arizona meteorological network weather station).
Crops Seeding
date Ending
date
Air temperature (°C) *RH Rainfall
(mm)
Soil temperature
at 10 cm (°C)
Solar radiation Crops
Seeding date
Ending date
Max Min Average • (%)
Rainfall (mm)
Soil temperature
at 10 cm (°C) (MW)
Cantaloupe 7/10/03 7/24/03 42.7 21.4 32.3 36.7 20.8 24.8 24.5 Lettuce 11/7/03 11/21/03 28.9 1.2 14.5 62.3 29.0 15.5 12.0
Bell pepper 6/24/04 7/8/04 39.8 13.5 29.7 18.9 0.5 21.7 28.6 * Average relative humidity during the period

63
3 -
2 -
00
p
O 1
D tL| w M> O
•J
0 -
- 1 -
i
ajB
(No contamination
detected)
I .i I I I .1 I
Cu W (J
o o sx S W U
SDI FI
§ S -Ph PJ u
SDI
X I I I . 1 o o <X
E W U
FI
0, tti u cu w o
SDI FI Cantaloupe Bell pepper Lettuce
Figure 3-1. Comparison of microbial recoveries from produce surface (*No microbial recovery over detection limit was observed from bell pepper surface. SDI and
FI indicate subsurface drip and furrow irrigation, x indicates outlier defined as recovery <
Ql-1.5xinter-quartile (Q3-Q1) or >Q3+1.5xinter-quartile, where Qi and Q3 are the first and the third quartile, respectively. Inner and outer boxes represent inter-quartile ranges and 95 % confidence interval of the mean, respectively.).
64
1.E+04
• PRD-1_SD1
• E. coli_SDI
• PRD-1_FI
OE. coli_FI
Dry Soil & Low • Contamination Zone
Wet Soil & High contamination Zone
•
•
Otg,
o •
•
oo
0.00 0.05 0.10 0.15 0.20
Soil moisture content
0.25 0.30
Figure 3-2. Microbial recoveries from the produce surfaces versus soil moisture content underneath produce (SDI and FI represent subsurface drip and furrow irrigated plots, respectively. Soil moisture content was measured gravimetrically).
65
U)
D U o D b fe-6C O J
6
5
4
3 -
2 -
-1
&H w U
X
^ X
I J, I
OH W cj
SDI FI Cantaloupe
0
o o T d
(2H w U
SDI
1
^ . L I
cu w (J
FI Lettuce
.1 I
Oh P-i U SDI
— -*-
i lii
T
1 I
cu w cJ
FI
Bell pepper
Figure 3-3. Comparison of microbial recoveries on soil surface (SDI and FI indicate subsurface drip and furrow irrigation, x indicates outlier defined as recovery <
Ql-1.5xinter-quartile (Q3-Q1) or >Q3+1.5xinter-quartile, where Qi and Q3 are the first
and the third quartile, respectively. Inner and outer boxes represent inter-quartile ranges and 95 % confidence interval of the mean, respectively.).

66
6 H
bO
P pL, u o D [Jh CU ao o hJ
3 -
2 -
1 -
0 -
-1 -]
P
X
T
Cu w u Oh pq o u u PJ u u u u u
SDI FI Cantaloupe
SDI FI Lettuce Bell pepper
Figure 3-4. Comparison of microbial recoveries from subsurface soil (SDI and FI
indicate subsurface drip and furrow irrigation, x indicates outlier defined as recovery <
Ql-1.5xinter-quartile (Q3-Q1) or >Q3+1.5xinter-quartile, where Qi and Q3 are the first and the third quartile, respectively. Inner and outer boxes represent inter-quartile ranges and 95 % confidence interval of the mean, respectively.).

67
I PRD1 • E. coli
Cantaloupe Lettuce ! Bell pepper
Soil surface
rt i [ft Cantaloupe! Lettuce Bell pepper
Subsurface soil
Figure 3-5. the mean values)
. Microbial inactivation rates (Error bars indicate standard deviations of
68
CHAPTER 4. THE EFFECTS OF TEMPERATURE AND
MOISTURE ON SURVIVAL OF COLIPHAGE PRD-1 IN SOIL
SUMMARY
The goal of this study was to develop a model for virus survival in soil based on soil
temperature and moisture content. Coliphage PRD-1 was added to sandy loam soil at five
different soil moisture levels. Amended soil was packed into sterile polyethylene jars and
was exposed to eight different temperatures in an oven. Samples were collected over 14
to 25 days depending on the temperature. The inactivation rate of PRD-1 increased
linearly with a temperature increase. The inactivation rate gradually decreased when the
soil moisture level decreased from 20.9 % to 8.9 %. However, the inactivation rate
increased when the soil moisture content was 5.1 %. This suggests the existence of an
optimal soil moisture condition for PRD-1 survival. It is also possible that there is a
threshold soil moisture level below which the inactivation of PRD-1 increases suddenly.
Marked reductions in recoveries were observed as soil moisture approached or fell below
5 % due to evaporation. The combined effect of increased inactivation and strong
adsorption of PRD-1 to soil particles may have caused these rapid reductions.
Evaporation seemed to affect PRD-1 survival substantially at higher temperatures while
little effect was observed at lower temperatures. A developed model predicted PRD-1
survival with the average error of 11.0 % in subsurface soil. However, to predict virus
survival in field conditions, the effects of the envirormiental changes need to be further
investigated.

4.1. INTRODUCTION
The use of treated wastewater for agricultural purposes has gained attention as an
alternative water resource, especially in arid and semi-arid regions. A number of food-
borne outbreaks have been associated with enteric viruses, which are potentially present
in reclaimed wastewater and persistent in harsh environments (Seymour and Appleton,
2001). Agricultural use of treated wastewater is usually restricted by regulations.
However, these regulations may be overly conservative (Shuval, 1991; WHO, 2000).
Quantitative microbial risk assessment has been used to develop microbial standards
(Rose et al., 1991; Hass et al., 1999; Scott et al., 2004). To assess risks more precisely, it
is important to predict the survival of pathogenic microorganisms in the environment.
Environmental factors affecting microbial survival include temperature, soil
moisture, adsorption to soil particles, salinity, soil properties, and pH (Yates et al., 1987;
Yates and Yates, 1988; Seymour and Appleton, 2001). Of the significant factors affecting
microbial survival, temperature, soil moisture level, and virus adsorption have been
reported to be three most important factors (Hurst et al., 1980; Yates et al., 1985, 1987;
Schijven and Hassanizadeh, 2000).
Coliphages have been used extensively as models for studies of virus behavior in the
environment (Hass et al., 1999). PRD-1 showed greater survival at higher temperatures
(Yahya et al., 1993; Straub et al., 1992) and survived longer than other viruses such as
poliovirus, enteric adenovirus, and MS-2 (Enriquez et al. 2003).
Evaporation may be the primary cause of virus inactivation in drying soils (Straub et
al., 1992; Yeager and O'Brien, 1979). According to Yeager and O'Brien (1979), in spite
of the influence of temperature on virus inactivation in saturated soils, the relationship
between temperature and the time required for soil dewatering by evaporation may be
more important. However, microbial survival cannot be addressed explicitly in closed
formula since much of the known information is qualitative in nature and the data is
limited (Yates and Yates, 1988; Schijven and Hassanizadeh, 2000).
The objectives of this study were to assess the effects of temperature and soil
moisture on virus survival using coliphage PRD-1 and to develop an empirical model for
predicting virus survival in soil. The developed model was applied to predict the
inactivation rates of PRD-1 in field soil.
4.2. MATERIALS AND METHODS
4.2.1. Soil preparation
The soil used for this study was sandy loam obtained from the field at the Campus
Agricultural Center, Tucson, Arizona. This soil is one of the typical cropland soils in
Arizona. The soil was sieved using a 2 mm mesh to remove debris and gravel and dried
to natural soil moisture level under shadow. The prepared soil was stored at room
temperature until used for the experiment.
4.2.2. Control of environmental factors
Two most important factors affecting microbial survival, temperature and soil
moisture were chosen as control factors for this study. The temperature was controlled at
eight different levels, 9.3, 10.5, 17.5, 20.1, 25.5, 28.4, 34.6, and 38.4 °C using an oven
(Fisher Scientific International Inc., Isotemp® vacuum oven 282A, Hampton, NH) in a
walk-in refrigerator. These control temperatures were based on typical incubation and
normal seasonal temperatures in Tucson, Arizona, for subsurface soil at 10 cm below
ground. To approximate the range of field capacity to a naturally dry state, the soil
moisture was maintained at five different levels, 20.9, 16.2, 12.1, 8.9, and 5.1 %. An
additional control was to allow soil moisture to continuously decrease from 20.9 % in
order to assess the effect of evaporation on virus survival.
Ambient temperatures were measured at two locations in the oven and recorded
every ten minutes using two temperature & humidity sensors (Vaisala Inc., Humitter
50U, Helsinki, Finland) cormected to a 21X datalogger (Campbell Scientific Inc., North
Logan, Utah).
4.2.3. Sample preparation and sampling
Approximately 400 g of soil was amended with a predetermined amount of distilled
• • • 19 « • water for each soil moisture level. Approximately 1.1 x 10 plaque forming units (pfu)
of coliphage PRD-1 were suspended in distilled water and amended with the soil. The
amended soil (30 g dry weight) was compacted into sterile 30 ml polypropylene jars to a
predetermined depth such that the bulk density of the soil sample was approximately 1.3
g/cm^, similar to the field bulk density of sandy loam soil. Twelve soil samples were
prepared. Two samples from each moisture level were immediately processed to
determine initial PRD-1 concentration. Samples were collected at various intervals over
the experimental periods varying from 14 to 25 days depending on the temperature
control. One sample for each soil moisture level was collected for every sampling event.
The soil moisture levels of the samples were measured immediately after sampling.
4.2.4. Assay of PRD-1
Coliphage PRD-1 was obtained from the University of Arizona Department of Soil,
Water and Environmental Science. PRD-1 was propagated and enumerated as described
by Rusin et al. (2002). PRD-1 was assayed using the plaque forming unit method with the
bacterial host Salmonella typhimurium ATCC 19585 as described by Governal and Gerba
(1997). Five grams of soil from each sample were sub-sampled into a 100 ml sterile
centrifuge bottle and 45 ml of 3 % beef extract was added. The content in the bottle was
mixed on a stir plate for 30 minutes. Then the mixture was centrifuged at 29600 xg for 10
minutes to remove soil particles. The supernatant was transferred to a 15 ml sterile
centrifuge tube, adjusted to pH 7 - 8, and assayed.
4.2.5. Model development
A two-step analysis was used for the model development. First step was to estimate
the inactivation rates of PRD-1 using equation (3.1). Secondly, an empirical model for
predicting PRD-1 survival was regressed by correlating the inactivation rate with
temperature and soil moisture level.
K = f { T , @ ) (4.1)
where T and © represent temperature and soil moisture level, respectively.
Therefore, combining the equations of (3.1) and (4.1) results in
^ (4.2)
A statistical package, MINITAB™ (MINITAB Inc., Release 13.32, State College,
PA was used to estimate inactivation rates and to regress empirical models.
4.3. RESULTS AND DISCUSSION
Temperatures were maintained constantly at eight levels over the experiments with
the maximum standard deviation of 0.59 °C (Table 4-1). At each temperature, five levels
of soil moisture were controlled constantly whereas soil moisture for an additional
control was decreased from the initial level of 20.9 % to the various levels at different
temperatures.
4.3.1. Inactivation rates versus enviroimiental factors
Inactivation rates for each condition were calculated and are shown in Table 4-2. As
shown in Figure 4-1, the study organism lost infectivity as temperature increased. Yates
and Yates (1988) indicated that enteric microorganisms survive longer at lower
temperatures. Overall, inactivation rates appeared to be linearly related with temperature.
However, it should be noted that the inactivation curve for the 5.1 % moisture treatment
showed a severe curvature as temperature increased, while the 8.9 % control curve

showed a slight curvature. At lower soil moisture, PRD-1 may be more sensitive to a
temperature increase.
Overall, high variations in PRD-1 recoveries were observed from soil moisture
controlled at 5.1 % as compared to the other moisture controls. Difficulty in achieving
soil moisture at 5.1 % uniformly due to the soil amendment with a small amount of water
might have been resulted in high variations in recoveries. Approximately the same
number of PRD-1 was applied to each treatment. However, initial recoveries from soil
moisture controlled at 5.1 % were one to two order magnitudes less than the other
moisture levels. This may be due to combined effect of immediate inactivation and strong
adsorption to the soil particles. According to Yates and Yates (1988), strong association
with soil surface is more likely in lower soil moisture level and may induce spontaneous
disassembly of the virus. Considering the assay was conducted within four hours after
soil amendment, strong adsorption of the study organism to the soil also seemed to be
responsible for the lower recoveries.
PRD-1 survived the best at 8.9 % soil moisture at all temperatures. As shown in
Figure 4-2, the inactivation rate increased gradually as soil moisture content increased in
the range of 8.9 % to 20.9 %. However, the lowest soil moisture controls at 5.1 %
resulted in increased inactivation rates as compared to 8.9 %. An optimal soil moisture
level for PRD-1 survival may exist between 5.1 % and 8.9 %. It is also possible that there
may be a threshold soil moisture level below which PRD-1 loses infectivity rapidly. In
this case, PRD-1 would survive the best in the lowest soil moisture above this soil
moisture threshold. Previous studies indicated that rapid virus inactivation occurred when

the moisture content reached 5 % (Yeager and O'Brien, 1979) and temperature becomes
the most important factor at a soil moisture level greater than 10 % (Straub et al., 1992).
Hurst et al. (1980) reported that the inactivation of poliovirus was at its maximum near
the soil moisture saturation point. Yeager and O'Brien (1979) mentioned that a critical
moisture threshold may exist for the survival of enteroviruses.
4.3.2. Effect of evaporation on PRD-1 survival
A treatment of soil moisture allowed for the soil samples to evaporate continuously
from the initial level of 20.9 % to the various levels during the experiments. Figure 4-3
shows the survival curves of PRD-1 at various temperatures. Marked reductions in PRD-
1 recoveries were observed when the soil moisture content approached or fell below 5.0
%. In contrast, no rapid drop in PRD-1 recoveries was observed when the final soil
moisture level was 9.5 %. This may be because of the combined effect of increased
inactivation and irreversible adsorption of PRD-1 to soil particles at the lower soil
moisture levels.
The data showing the rapid reduction in recovery were excluded from the estimation
of the inactivation rates in order to assess the effect of evaporation on PRD-1 survival.
The rates of inactivation and evaporation are summarized in Table 4-2. Figure 4-4
compares inactivation rates between the soil moisture controls of continuous drying and
constant at 20.9 %, which was the initial soil moisture of the drying soil. As expected, the
evaporation process was slower at lower temperatures as compared to higher
temperatures. Evaporation seems to have little effect on PRD-1 survival at temperatures
below 20 °C. However, as temperature increases, the difference of inactivation rates

between two soil moisture controls becomes significant. Assuming that evaporation had
no effect on PRD-1 survival, then inactivation rates in drying soil should be less or at
least similar to those from the soil moisture control at 20.9 %. This is because PRD-1 is
expected to survive better at lower soil moisture as soil moisture decreases. Therefore,
the evaporation process appeared to accelerate virus inactivation at higher temperatures.
According to Yeager and O'Brien (1979), the evaporation process may be the primary
factor affecting virus survival in drying soil.
4.3.3. Model regression and application to predict PRD-1 survival
Figures 4-1 and 4-2 show that the inactivation rate appeared to be linearly related to
temperature. Soil moisture content between 8.9 and 20.9 % also showed a linear
relationship with inactivation rate. However, the inactivation rate of PRD-1 increased as
soil moisture further decreased below 8.9 %. Soil moisture in crop field commonly
remains between field capacity and wilting point by irrigation practices. Suttles (1998)
and Copeland (1989) reported a field capacity of 22 % and a wilting point of 10 % in the
field where the soil used for this study was obtained, respectively. Accordingly, two
separate models based on distinct soil moisture ranges were regressed and reported in
Table 4-3. The regression variables include temperature (T) and soil moisture level (0).
Three orders of polynomial terms for each environmental variable (T, T^, T^, 0, 0^, and
0^) were used for the regression in order to address potential non-linearity. All possible
combinations of variables were evaluated using the "Best Subset Regression Option" in
MINITAB. The best subsets of variables were selected based on the statistics including

R^, C-p values and standard deviations and used for the regressions (Tables D-2, D-3 and
D-4). Figure 4-5 compares regressed and observed inactivation rates. The determination
coefficients of the models were 0.931 and 0.865, respectively.
The developed model with the range of 8.9 to 20.9 % was applied to predict the
inactivation rates of PRD-1 using the mean temperature and soil moisture data collected
from the field survival study as addressed in chapter 3 (Table 4-4). It should be noted that
overall the soil moisture levels were out of the model range, especially in soil surface
conditions. The mean soil moisture values in subsurface soil were close to the upper limit
for the model range. The model predicted the inactivation rates of PRD-1 with 11.0 % in
subsurface soil conditions, where temperature and soil moisture values varied relatively
small ranges as compared to the soil surface conditions (Figure 4-6). However, the model
considerably underestimated the inactivation rates on the soil surface conditions
particularly at high temperatures. This was expected since the surface soil was exposed to
sunlight, higher temperatures, and consequently higher desiccation. Therefore, the effects
of environmental changes on virus survival need to be further investigated in order to
predict virus survival in field, particularly soil surface conditions.
4.4. CONCLUSION
This study investigated the survival of coliphage PRD-1 in soil at various
temperature and soil moisture conditions. Overall, the inactivation of PRD-1 increased
linearly as temperature increased. However, PRD-1 survival was non-linearly related
with temperature increase at the lower soil moisture (5.1 % and 8.9 %). This implies that
PRD-1 in dry conditions could be more vulnerable to inactivation as temperature
increases. Initial recoveries from the 5.1 % moisture treatment were on the order of one-
to two-orders of magnitude less than those of the other moisture conditions. Strong
absorption of the study organism to the soil seems to cause the lower recoveries.
The best survival of PRD-1 occurred at the 8.9 % soil moisture content for all
studied temperatures. The inactivation rate of PRD-1 increased gradually with soil
moisture increase in the range of the soil moisture of 8.9 to 20.9 %. Further decrease of
soil moisture to 5.1 % resulted in the increased inactivation rates as compared to the 8.9
% moisture content. This may indicate the existence of an optimal soil moisture level for
the survival of PRD-1 between 5.1 % and 8.9 %, or there may be a threshold soil
moisture level below which PRD-1 loses infectivity rapidly.
As soil moisture evaporated to or fell below 5 %, the recovery of PRD-1 was rapidly
reduced. The combined effect of increased inactivation and strong adsorption of PRD-1
to soil particles at the lower soil moisture was considered as a probable cause. The effect
of evaporation on PRD-1 survival in the soil appeared to be minimal at temperatures
below 20 °C. However, at higher temperatures, evaporation process appeared to
accelerate PRD-1 inactivation significantly.
Two separate models to predict PRD-1 inactivation rate based on distinct soil
moisture ranges were regressed using temperature and soil moisture as the regressors
with R values greater than 0.865. The regressed model predicted the inactivation rate of
PRD-1 with the average error of 11.0 % for the field subsurface conditions. However,
significant underestimation of PRD-1 inactivation rates resulted from the application to

the soil surface conditions, where the variation of the environment factors was relatively
large compared to the subsurface conditions. Therefore, the changes of environmental
factors on virus survival need to be further investigated in order to predict virus survival
more precisely.

80
Table 4-1. Experimental controls.
Experimental Volumetric duration soil moisture (days) (%)
9.3 0.09 24.4 10.5 0.10 24.4 20.9 ±0.5 17.5 0.39 24.9 16.2 ±0.6
20.1 0.59 24.9 12.1 ±0.5
25.5 0.10 18.7 8.9 ±0.6
28.4 0.09 18.7 5.1 ±0.5
34.6 0.47 14.8 *SMD
38.4 0.42 14.8 *SMD: soil moisture decreased from the initial level of 20.9 % to various levels depending on the temperature control.
Temperature
(!Q Standard
Average , . ^. ° deviation
Table 4-2. Estimated inactivation rates of coliphage PRD-1 in soil (unit: 1/days). Volumetric
moisture (%) 20.9 16.2 12.1 8.9 5.1 *SMD
Temperature (°C)
9.3 0.0471 0.0294 0.0144 0.0087 0.0296 0.0410 (0.15)
10.5 0.0524 0.0312 0.0126 0.0112 0.0258 0.0587 (0.16)
17.5 0.0768 0.0490 0.0259 0.0121 0.0664 0.0602 (0.10)
20.1 0.0826 0.0652 0.0316 0.0176 0.1437 0.0896 (0.14)
25.5 0.1106 0.0898 0.0548 0.0135 0.0678 0.2051 (0.17)
28.4 0.1146 0.1006 0.0543 0.0224 0.0821 0.1757 (0.20)
34.6 0.1522 0.1258 0.0803 0.0513 0.1547 0.2399 (0.25)
38.4 0.1533 0.1240 0.0803 0.0757 0.2622 0.2342 (0.30)
*SMD: soil moisture decreased from the initial level of 20.9 % to various levels depending on the temperature control. ** Values in the parentheses represent evaporation rates in mm/day.
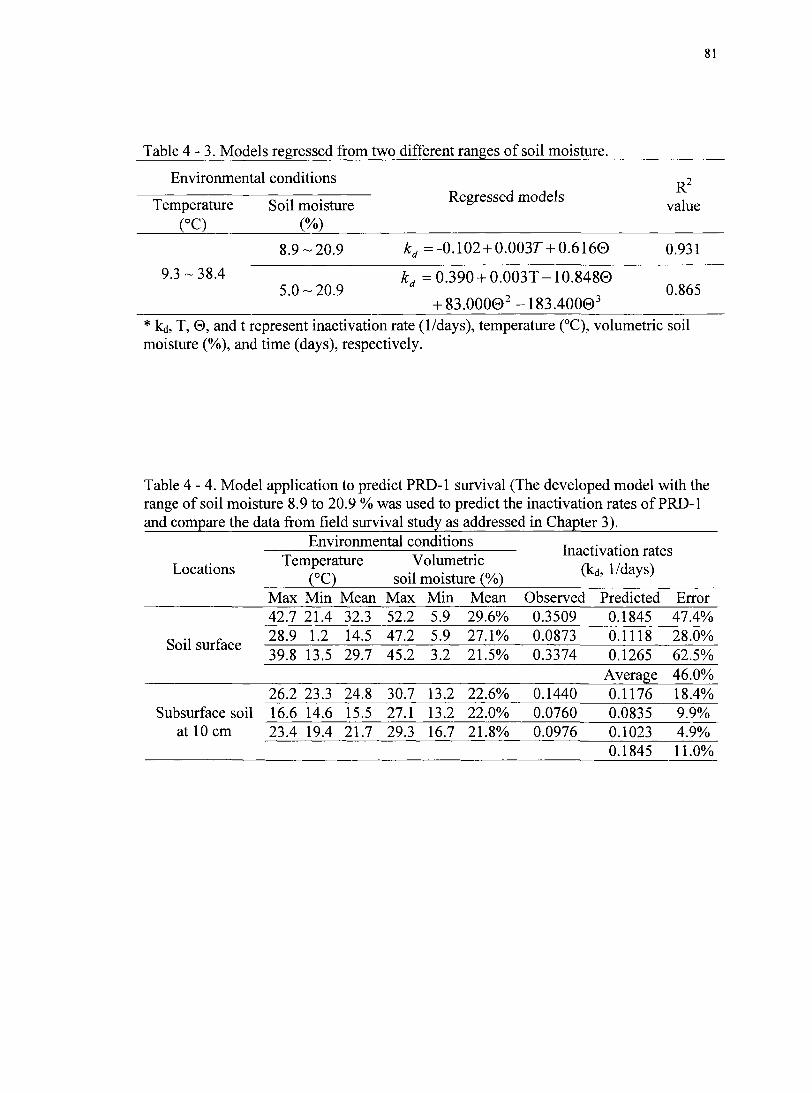
81
Table 4-3. Models regressed from two different ranges of soil moisture.
Envirormiental conditions R^
Regressed models R^
Temperature Soil moisture Regressed models
value (°C) (%)
8.9-20.9 kd --0.102 + 0.0037 + 0.6160 0.931
9.3-38.4 5.0-20.9
kd = 0.390 + 0.0031-10.848©
+ 83.0000^-183.4000' 0.865
* kd, T, 0, and t represent inactivation rate (1/days), temperature (°C), volumetric soil moisture (%), and time (days), respectively.
Table 4-4. Model application to predict PRD-1 survival (The developed model with the range of soil moisture 8.9 to 20.9 % was used to predict the inactivation rates of PRD-1 and compare the data from field survival study as addressed in Chapter 3).
Environmental conditions
Locations Temperature
(°C) Volumetric
soil moisture
Inactivation rates (kd, 1/days)
Max Min Mean Max Min Mean Observed Predicted Error 42.7 21.4 32.3 52.2 5.9 29.6% 0.3509 0.1845 47.4%
Soil surface 28.9 1.2 14.5 47.2 5.9 27.1% 0.0873 0.1118 28.0%
Soil surface 39.8 13.5 29.7 45.2 3.2 21.5% 0.3374 0.1265 62.5%
Average 46.0% 26.2 23.3 24.8 30.7 13.2 22.6% 0.1440 0.1176 18.4%
Subsurface soil 16.6 14.6 15.5 27.1 13.2 22.0% 0.0760 0.0835 9.9% at 10 cm 23.4 19.4 21.7 29.3 16.7 21.8% 0.0976 0.1023 4.9%
0.1845 11.0%
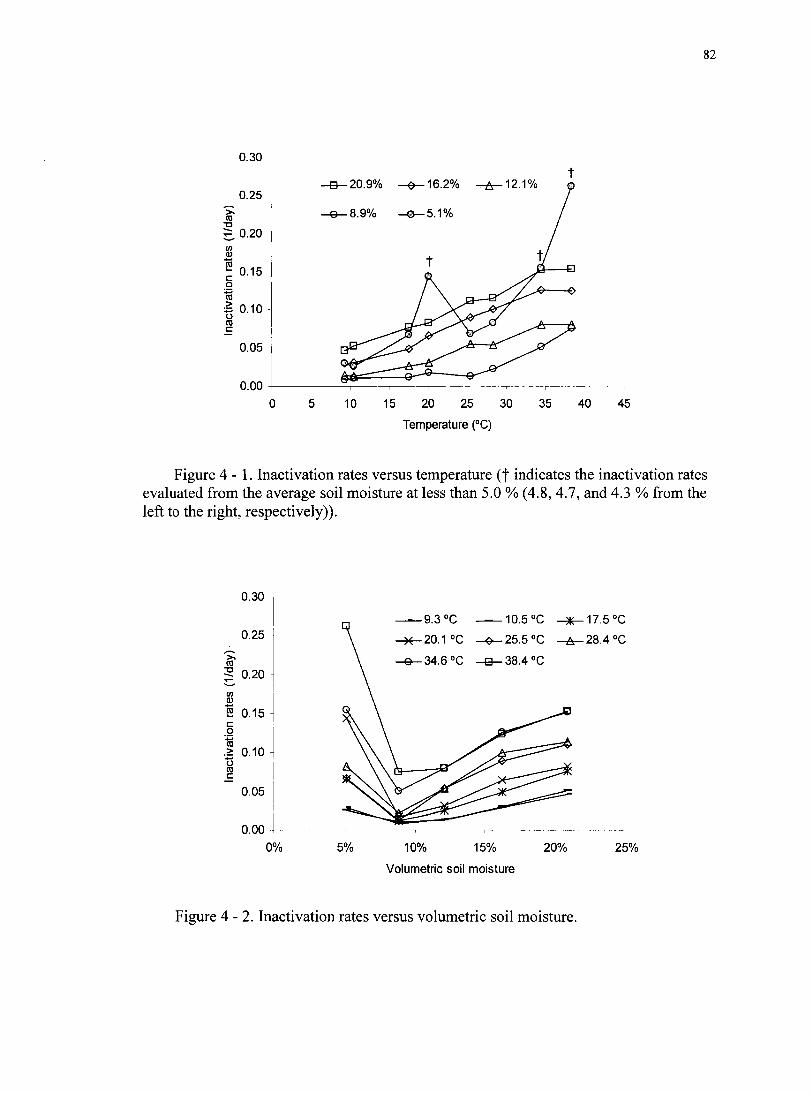
82
0.30 n
B-20.9% _e-16.2% ^t5J_12.1%
^8.9% -©-5.1%
0.20
0.15
0.10
0.05
0.00 T
10 5 15 20 25 30 35 40
Temperature (°C)
Figure 4-1. Inactivation rates versus temperature (t indicates the inactivation rates evaluated from the average soil moisture at less than 5.0 % (4.8, 4.7, and 4.3 % from the left to the right, respectively)).
>. <0 •o
c o
0.30
0.25
0.20
0.15
(0 0.10
"o C O _c
0.05
0.00
0%
-9.3 "C 10.5 "C -JK-IT S-C
.20.1 °C -0-25.5"'C -A-28.4 "C
-e-34.6 00 -b-38.4''C
5% 10% 15%
Volumetric soil moisture
20% 25%
Figure 4-2. Inactivation rates versus volumetric soil moisture.
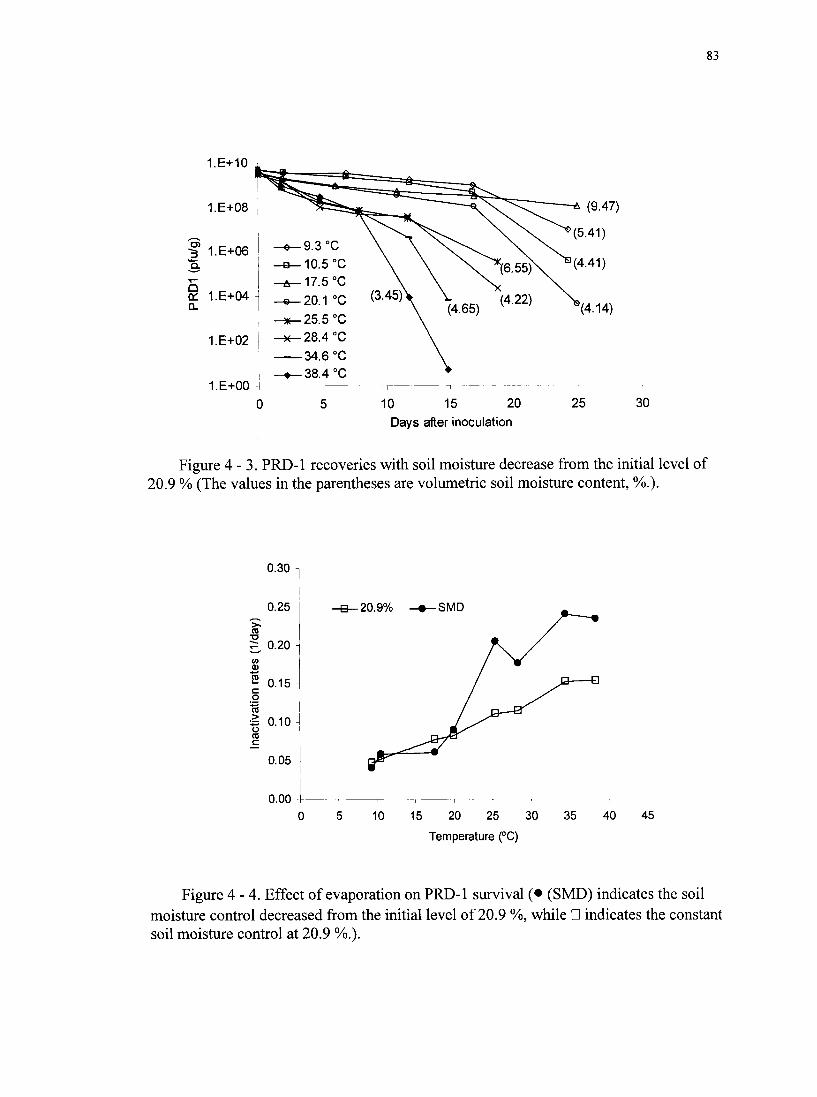
83
1.E+10
^ (9.47)
(5.41)
1.E+08
O) 'B .E+06
(4.41) Q. t6.55)
§ 1.E+04 (3.45) (4.22) (4.14) (4.65)
25.5 °C
28.4 °C
34.6 °C
38.4 "C
.E+02
.E+00
20 25 15 10 0 5
Days after inoculation
Figure 4-3. PRD-1 recoveries with soil moisture decrease from the initial level of 20.9 % (The values in the parentheses are volumetric soil moisture content, %.).
>> C O T3
0.30
0.25
0.20
0.15
0.10
0.05
0.00
-B-20.9% -SMD
10 15 20 25 30 35 40 45
Temperature (°C)
Figure 4-4. Effect of evaporation on PRD-1 survival (• (SMD) indicates the soil
moisture control decreased from the initial level of 20.9 %, while • indicates the constant soil moisture control at 20.9 %.).

84
kd= - 0.102 + 0.003 T-0.616 0 A
R2=0.931 / •
• /
^ •
• y •
(a)
0 0.04 0.08 0.12 0.16
Observed kj values (1/days)
kd= 0.390+ 0.003 T-10.848 0
+ 83.000 0^-183.400 0^
R2=0.865
(b)
0.05 0.1 0.15 0.2 0.25 0.3
Observed k^ values (1/days)
Figure 4-5. Regressed by the models versus observed inactivation rates in the soil moisture ranges of (a) 8.9 to 20.9 % and (b) 5.0 to 20.9 % (kd indicates inactivation rate in the unit of 1/days).
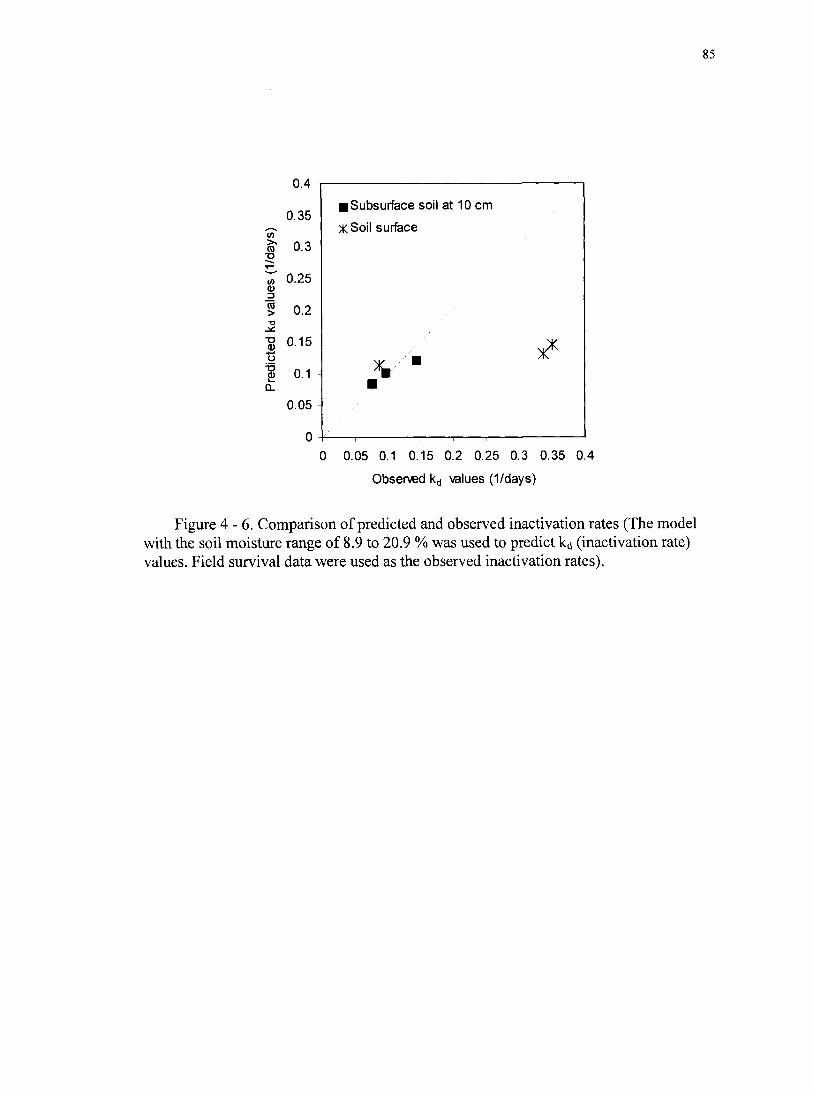
85
0 4
BSubsurface soil at 10 cm
xSoil surface
•
0 0.05 0.1 0.15 0.2 0.25 0.3 0.35 0.4
Observed kj values (I/days)
Figure 4-6. Comparison of predicted and observed inactivation rates (The model with the soil moisture range of 8.9 to 20.9 % was used to predict kd (inactivation rate) values. Field survival data were used as the observed inactivation rates).
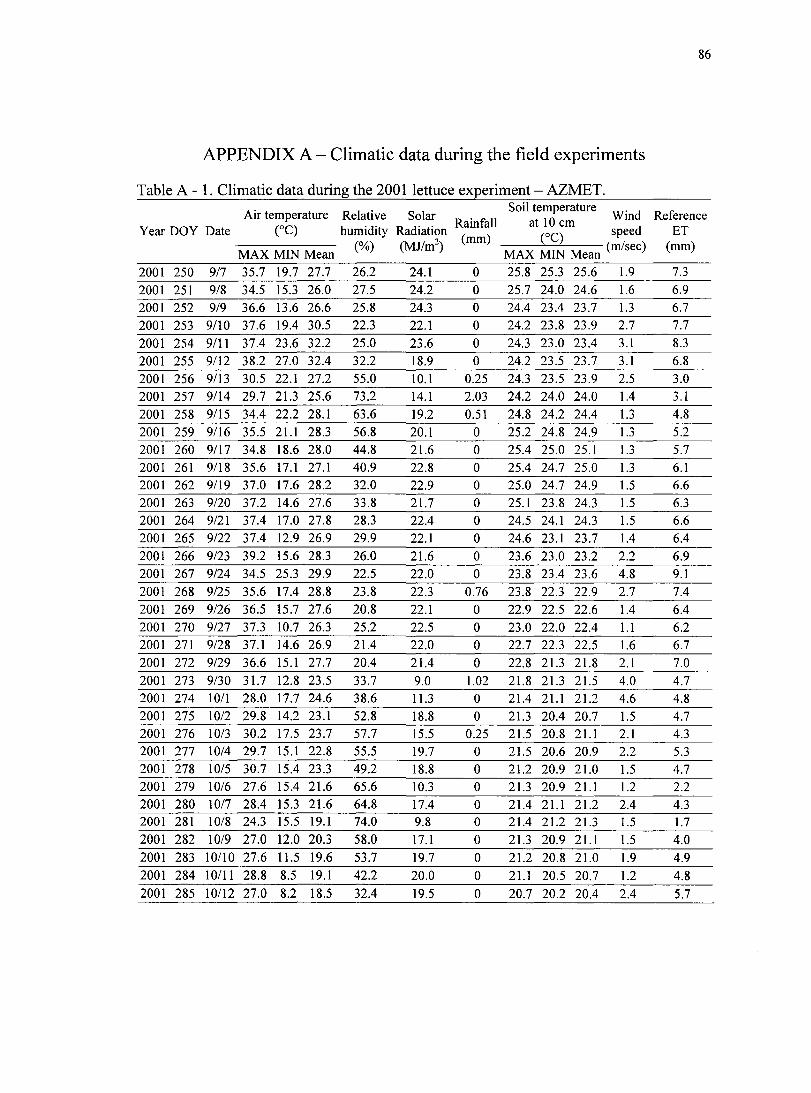
86
APPENDIX A - Climatic data during the field experiments
Table A - 1. Climatic data during the 2001 lettuce experiment - AZMET.
Air temperature Relative Solar n • f n Wind Reference Year DOY Date (°C) humidity Radiation ^ ^ speed ET
. . . V , \ / f W (MJW) (m/sec) (mm) MAX MIN Mean v ^ v / MAX MIN Mean
2001 250 9/7 35.7 19.7 27.7 26.2 24.1 0 25.8 25.3 25.6 1.9 7.3
2001 251 9/8 34.5 15.3 26.0 27.5 24.2 0 25.7 24.0 24.6 1.6 6.9
2001 252 9/9 36.6 13.6 26.6 25.8 24.3 0 24.4 23.4 23.7 1.3 6.7
2001 253 9/10 37.6 19.4 30.5 22.3 22.1 0 24.2 23.8 23.9 2.7 7.7
2001 254 9/11 37.4 23.6 32.2 25.0 23.6 0 24.3 23.0 23.4 3.1 8.3
2001 255 9/12 38.2 27.0 32.4 32.2 18.9 0 24.2 23.5 23.7 3.1 6.8
2001 256 9/13 30.5 22.1 27.2 55.0 10.1 0.25 24.3 23.5 23.9 2.5 3.0
2001 257 9/14 29.7 21.3 25.6 73.2 14.1 2.03 24.2 24.0 24.0 1.4 3.1
2001 258 9/15 34.4 22.2 28.1 63.6 19.2 0.51 24.8 24.2 24.4 1.3 4.8
2001 259 9/16 35.5 21.1 28.3 56.8 20.1 0 25.2 24.8 24.9 1.3 5.2
2001 260 9/17 34.8 18.6 28.0 44.8 21.6 0 25.4 25.0 25.1 1.3 5.7
2001 261 9/18 35.6 17.1 27.1 40.9 22.8 0 25.4 24.7 25.0 1.3 6.1
2001 262 9/19 37.0 17.6 28.2 32.0 22.9 0 25.0 24.7 24.9 1.5 6.6
2001 263 9/20 37.2 14.6 27.6 33.8 21.7 0 25.1 23.8 24.3 1.5 6.3
2001 264 9/21 37.4 17.0 27.8 28.3 22.4 0 24.5 24.1 24.3 1.5 6.6
2001 265 9/22 37.4 12.9 26.9 29.9 22.1 0 24.6 23.1 23.7 1.4 6.4
2001 266 9/23 39.2 15.6 28.3 26.0 21.6 0 23.6 23.0 23.2 2.2 6.9
2001 267 9/24 34.5 25.3 29.9 22.5 22.0 0 23.8 23.4 23.6 4.8 9.1
2001 268 9/25 35.6 17.4 28.8 23.8 22.3 0.76 23.8 22.3 22.9 2.7 7.4
2001 269 9/26 36.5 15.7 27.6 20.8 22.1 0 22.9 22.5 22.6 1.4 6.4
2001 270 9/27 37.3 10.7 26.3 25.2 22.5 0 23.0 22.0 22.4 1.1 6.2 2001 271 9/28 37.1 14.6 26.9 21.4 22.0 0 22.7 22.3 22.5 1.6 6.7 2001 272 9/29 36.6 15.1 27.7 20.4 21.4 0 22.8 21.3 21.8 2.1 7.0
2001 273 9/30 31.7 12.8 23.5 33.7 9.0 1.02 21.8 21.3 21.5 4.0 4.7 2001 274 10/1 28.0 17.7 24.6 38.6 11.3 0 21.4 21.1 21.2 4.6 4.8 2001 275 10/2 29.8 14.2 23.1 52.8 18.8 0 21.3 20.4 20.7 1.5 4.7 2001 276 10/3 30.2 17.5 23.7 57.7 15.5 0.25 21.5 20.8 21.1 2.1 4.3 2001 277 10/4 29.7 15.1 22.8 55.5 19.7 0 21.5 20.6 20.9 2.2 5.3 2001 278 10/5 30.7 15.4 23.3 49.2 18.8 0 21.2 20.9 21.0 1.5 4.7 2001 279 10/6 27.6 15.4 21.6 65.6 10.3 0 21.3 20.9 21.1 1.2 2.2 2001 280 10/7 28.4 15.3 21.6 64.8 17.4 0 21.4 21.1 21.2 2.4 4.3 2001 281 10/8 24.3 15.5 19.1 74.0 9.8 0 21.4 21.2 21.3 1.5 1.7
2001 282 10/9 27.0 12.0 20.3 58.0 17.1 0 21.3 20.9 21.1 1.5 4.0 2001 283 10/10 27.6 11.5 19.6 53.7 19.7 0 21.2 20.8 21.0 1.9 4.9 2001 284 10/11 28.8 8.5 19.1 42.2 20.0 0 21.1 20.5 20.7 1.2 4.8
2001 285 10/12 27.0 8.2 18.5 32.4 19.5 0 20.7 20.2 20.4 2.4 5.7
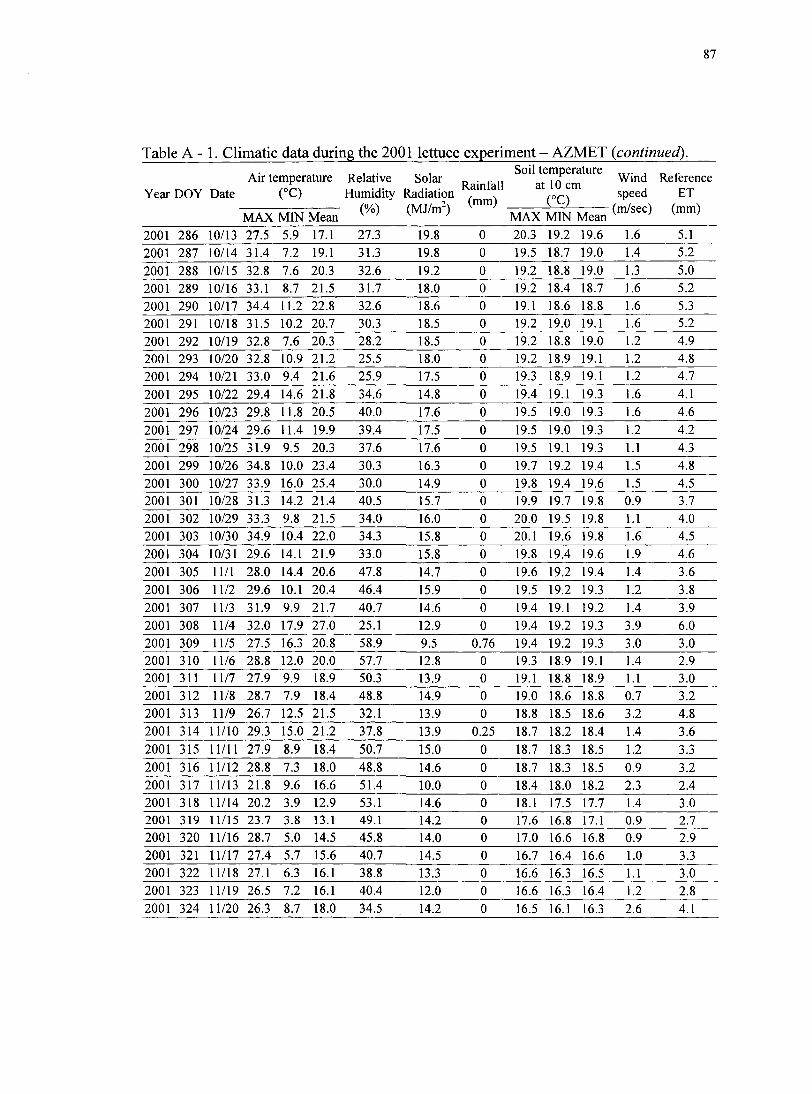
87
Table A - 1. Climatic data during the 2001 lettuce experiment - AZMET (continued).
Year DOY Date
Air temperature (°C)
Relative Solar Humidity Radiation
/-n/N /UT/ 2n
Rainfall (mm)
Soil temperature at 10 cm
(°C)
Wind speed
(m/sec)
Reference ET
(mm) MAX MIN Mean
y / 0 ) MAX MIN Mean
Wind speed
(m/sec)
Reference ET
(mm)
2001 286 10/13 27.5 5.9 17.1 27.3 19.8 0 20.3 19.2 19.6 1.6 5.1
2001 287 10/14 31.4 7.2 19.1 31.3 19.8 0 19.5 18.7 19.0 1.4 5.2
2001 288 10/15 32.8 7.6 20.3 32.6 19.2 0 19.2 18.8 19.0 1.3 5.0
2001 289 10/16 33.1 8.7 21.5 31.7 18.0 0 19.2 18.4 18.7 1.6 5.2
2001 290 10/17 34.4 11.2 22.8 32.6 18.6 0 19.1 18.6 18.8 1.6 5.3
2001 291 10/18 31.5 10.2 20.7 30.3 18.5 0 19.2 19.0 19.1 1.6 5.2
2001 292 10/19 32.8 7.6 20.3 28.2 18.5 0 19.2 18.8 19.0 1.2 4.9
2001 293 10/20 32.8 10.9 21.2 25.5 18.0 0 19.2 18.9 19.1 1.2 4.8
2001 294 10/21 33.0 9.4 21.6 25.9 17.5 0 19.3 18.9 19.1 1.2 4.7
2001 295 10/22 29.4 14.6 21.8 34.6 14.8 0 19.4 19.1 19.3 1.6 4.1
2001 296 10/23 29.8 11.8 20.5 40.0 17.6 0 19.5 19.0 19.3 1.6 4.6
2001 297 10/24 29.6 11.4 19.9 39.4 17.5 0 19.5 19.0 19.3 1.2 4.2
2001 298 10/25 31.9 9.5 20.3 37.6 17.6 0 19.5 19.1 19.3 1.1 4.3
2001 299 10/26 34.8 10.0 23.4 30.3 16.3 0 19.7 19.2 19.4 1.5 4.8
2001 300 10/27 33.9 16.0 25.4 30.0 14.9 0 19.8 19.4 19.6 1.5 4.5
2001 301 10/28 31.3 14.2 21.4 40.5 15.7 0 19.9 19.7 19.8 0.9 3.7
2001 302 10/29 33.3 9.8 21.5 34.0 16.0 0 20.0 19.5 19.8 1.1 4.0
2001 303 10/30 34.9 10.4 22.0 34.3 15.8 0 20.1 19.6 19.8 1.6 4.5
2001 304 10/31 29.6 14.1 21.9 33.0 15.8 0 19.8 19.4 19.6 1.9 4.6
2001 305 11/1 28.0 14.4 20.6 47.8 14.7 0 19.6 19.2 19.4 1.4 3.6
2001 306 11/2 29.6 10.1 20.4 46.4 15.9 0 19.5 19.2 19.3 1.2 3.8
2001 307 11/3 31.9 9.9 21.7 40.7 14.6 0 19.4 19.1 19.2 1.4 3.9
2001 308 11/4 32.0 17.9 27.0 25.1 12.9 0 19.4 19.2 19.3 3.9 6.0
2001 309 11/5 27.5 16.3 20.8 58.9 9.5 0.76 19.4 19.2 19.3 3.0 3.0 2001 310 11/6 28.8 12.0 20.0 57.7 12.8 0 19.3 18.9 19.1 1.4 2.9 2001 311 11/7 27.9 9.9 18.9 50.3 13.9 0 19.1 18.8 18.9 1.1 3.0
2001 312 11/8 28.7 7.9 18.4 48.8 14.9 0 19.0 18.6 18.8 0.7 3.2 2001 313 11/9 26.7 12.5 21.5 32.1 13.9 0 18.8 18.5 18.6 3.2 4.8
2001 314 11/10 29.3 15.0 21.2 37.8 13.9 0.25 18.7 18.2 18.4 1.4 3.6
2001 315 11/11 27.9 8.9 18.4 50.7 15.0 0 18.7 18.3 18.5 1.2 3.3
2001 316 11/12 28.8 7.3 18.0 48.8 14.6 0 18.7 18.3 18.5 0.9 3.2
2001 317 11/13 21.8 9.6 16.6 51.4 10.0 0 18.4 18.0 18.2 2.3 2.4 2001 318 11/14 20.2 3.9 12.9 53.1 14.6 0 18.1 17.5 17.7 1.4 3.0 2001 319 11/15 23.7 3.8 13.1 49.1 14.2 0 17.6 16.8 17.1 0.9 2.7 2001 320 11/16 28.7 5.0 14.5 45.8 14.0 0 17.0 16.6 16.8 0.9 2.9
2001 321 11/17 27.4 5.7 15.6 40.7 14.5 0 16.7 16.4 16.6 1.0 3.3 2001 322 11/18 27.1 6.3 16.1 38.8 13.3 0 16.6 16.3 16.5 1.1 3.0 2001 323 11/19 26.5 7.2 16.1 40.4 12.0 0 16.6 16.3 16.4 1.2 2.8 2001 324 11/20 26.3 8.7 18.0 34.5 , 14.2 0 16.5 16.1 16.3 2.6 4.1

88
Table A - 2. Climatic data during the 2002 lettuce experiment - AZMET. Soil temperature . . „ ^
Wind Reference
(°C) humidity Radiation ,o(^\ speed ET —— (m/sec) (mm)
Year DOY Date
Air temperature Relative Solar „ . u jv, r. J- Rainfall humidity Radiation , ,
- (%) (MJ/m^) • MAX MIN Mean MAX MIN Mean
2002 275 10/2 27.6 12.8 20.8 43.8 20.1 0 22.6 22.1 22.3 3.5 6
2002 276 10/3 22.8 8.6 16.6 31.9 20.9 0 22.2 21.5 21.8 2.5. 5.4
2002 277 10/4 28.9 5 17.6 33.5 20.4 0 21.5 20.7 21 1.5 5.1
2002 278 10/5 30.4 7.7 19.5 31.7 20.1 0 21 20.5 20.7 1.6 5.3
2002 279 10/6 32.1 9.1 20.9 28.7 20.1 0 20.8 20.4 20.6 1.6 5.5
2002 280 10/7 30 14.1 21.5 45.9 15.1 0.25 20.7 20.4 20.5 2.8 4.6
2002 281 10/8 30.8 14 22.3 41.7 19.1 0 20.6 20.3 20.4 1.5 4.8
2002 282 10/9 33 11 22.3 35.7 19.2 0 20.8 20.4 20.6 1.3 5
2002 283 10/10 34.1 10.2 22.2 32.2 19.2 0 20.8 20.4 20.6 1 4.9
2002 284 10/11 33.5 11.3 23.1 27.5 17.7 0 20.8 20.5 20.7 1.7 5.1
2002 285 10/12 30.8 12.6 21.9 30.9 14.1 0 20.8 20.5 20.6 1 3.6
2002 286 10/13 30.8 13 23.3 35.4 15.3 0 20.7 20.5 20.6 3.2 5.3
2002 287 10/14 31.7 16.4 24.4 35.3 17.5 0 20.8 20.5 20.6 2.1 5
2002 288 10/15 32.5 14.6 22.8 37.9 16.6 0 20.9 20.6 20.8 1.4 4.3
2002 289 10/16 31.1 13.6 22.1 33.8 16.3 0 20.9 20.6 20.8 1.5 4.5
2002 290 10/17 26.9 15.8 21.6 37.9 15.3 0 20.8 20.6 20.8 2.4 4.5
2002 291 10/18 23.1 11.3 16.9 52 17.7 0 20.8 20.3 20.6 1.7 3.9
2002 292 10/19 26.7 8.3 17.5 47.6 17.3 0 20.5 19.9 20.2 1.2 3.9
2002 293 10/20 28.4 10.6 19.7 41.4 15.2 0 20.2 19.8 20 1.4 3.7
2002 294 10/21 27.8 14.6 20.5 42.9 16.5 0 20.2 19.8 20 1.4 4
2002 295 10/22 27.6 9.8 19.8 41.8 14.2 0 20.2 19.8 20 1.4 3.6 2002 296 10/23 27.2 12.8 20 44.3 16.4 0 20 19.7 19.8 1.7 4.2
2002 297 10/24 25.4 9.3 17.4 47.3 16.9 0 19.9 19.5 19.7 1.1 3.7 2002 298 10/25 27.2 6.5 16.6 43.4 16.9 0 19.7 19.1 19.4 1 3.7 2002 299 10/26 24.4 9.7 16.8 46.3 10.9 0.25 19.4 18.9 19.1 1.8 2.7
2002 300 10/27 19.9 10.2 14.1 75.6 10.8 11.43 19 18.6 18.7 1.7 1.8 2002 301 10/28 20.8 7.1 13.8 73.5 16.3 0 18.6 18.2 18.4 1.3 2.9
2002 302 10/29 24.3 6.9 14.3 61.5 16.4 0 18.4 17.9 18.2 1.3 3.2 2002 303 10/30 26.4 7 15.3 52.4 16.4 0 18.2 17.7 18 1.2 3.4
2002 304 10/31 26.2 5.3 16 50.8 16.1 0 18 17.6 17.8 1.1 3.4 2002 305 11/1 29.3 8.7 17.1 48.1 14.7 0 18 17.6 17.8 1.1 3.3 2002 306 11/2 24.2 7.6 16.6 48.1 12.8 0 18 17.6 17.8 1.2 2.9 2002 307 11/3 21.4 10 14.4 56.6 6.4 0 17.8 17.4 17.6 1.2 1.2 2002 308 11/4 23.4 5.3 14.1 48.2 15.6 0 17.4 16.9 17.1 1.6 3.7 2002 309 11/5 23 0.3 11.6 35.6 16.2 0 17.1 16.3 16.6 1.2 3.5 2002 310 11/6 29.2 0.5 14.3 34.8 16.2 0 16.5 15.8 16.1 1.3 4 2002 311 11/7 28.9 3.8 16.3 30.9 15.5 0 16.1 15.6 15.9 1.6 4 2002 312 11/8 25.3 10.1 17.6 33.7 12.3 0 16 15.8 15.9 2 3.4 2002 313 11/9 25.6 8.2 18 48.8 14.8 0 16.2 15.9 16 2.1 3.8 2002 314 11/10 21.9 7.8 17 56.8 10.7 0 16.4 16.2 16.3 2.4 2.7 2002 315 11/11 22.1 3.5 13.4 46.1 15.0 0 16.4 15.8 16.1 2.3 3.9
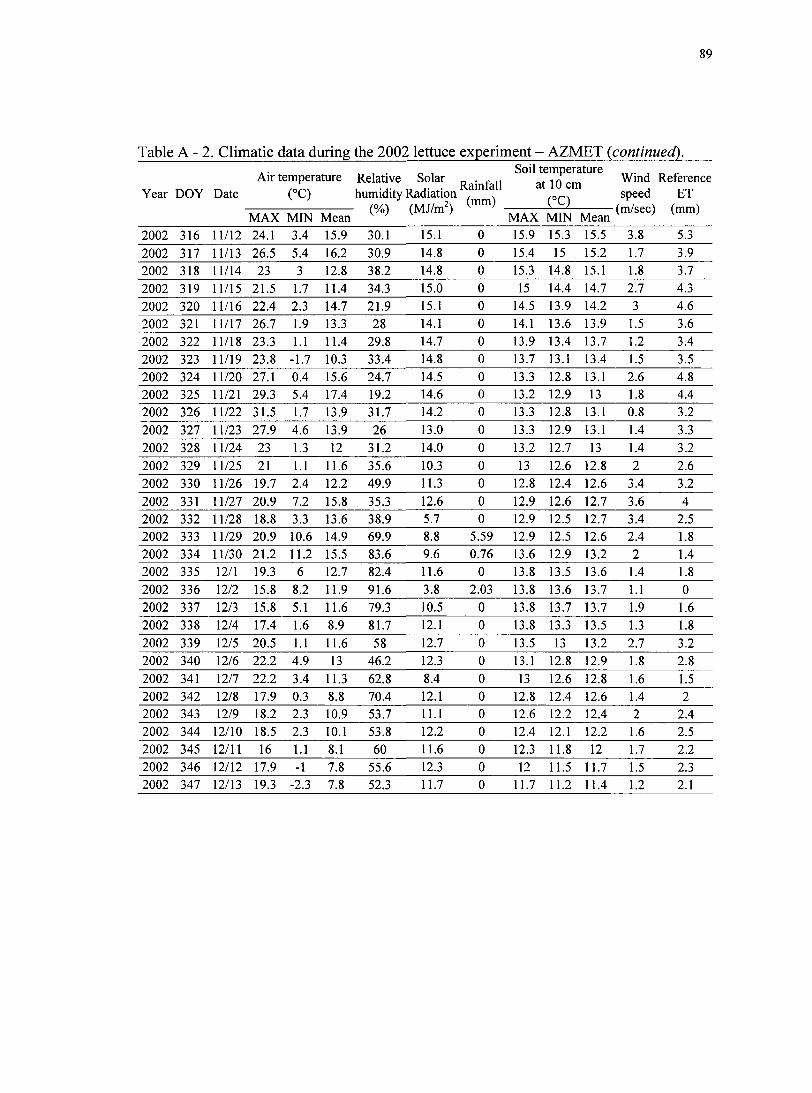
89
Table A - 2. Climatic data during the 2002 lettuce experiment - AZMET {continued).
Air temperature Relative Solar r • ^ n Wind Reference
Year DOY Date (°C) humidity Radiation ^ speed ET
MAX MIN Mean MAX MIN Mean
2002 316 11/12 24.1 3.4 15.9 30.1 15.1 0 15.9 15.3 15.5 3.8 5.3
2002 317 11/13 26.5 5.4 16.2 30.9 14.8 0 15.4 15 15.2 1.7 3.9
2002 318 11/14 23 3 12.8 38.2 14.8 0 15.3 14.8 15.1 1.8 3.7
2002 319 11/15 21.5 1.7 11.4 34.3 15.0 0 15 14.4 14.7 2.7 4.3
2002 320 11/16 22.4 2.3 14.7 21.9 15.1 0 14.5 13.9 14.2 3 4.6
2002 321 11/17 26.7 1.9 13.3 28 14.1 0 14.1 13.6 13.9 1.5 3.6
2002 322 11/18 23.3 1.1 11.4 29.8 14.7 0 13.9 13.4 13.7 1.2 3.4
2002 323 11/19 23.8 -1.7 10.3 33.4 14.8 0 13.7 13.1 13.4 1.5 3.5
2002 324 11/20 27.1 0.4 15.6 24.7 14.5 0 13.3 12.8 13.1 2.6 4.8
2002 325 11/21 29.3 5.4 17.4 19.2 14.6 0 13.2 12.9 13 1.8 4.4
2002 326 11/22 31.5 1.7 13.9 31.7 14.2 0 13.3 12.8 13.1 0.8 3.2
2002 327 11/23 27.9 4.6 13.9 26 13.0 0 13.3 12.9 13.1 1.4 3.3
2002 328 11/24 23 1.3 12 31.2 14.0 0 13.2 12.7 13 1.4 3.2
2002 329 11/25 21 1.1 11.6 35.6 10.3 0 13 12.6 12.8 2 2.6
2002 330 11/26 19.7 2.4 12.2 49.9 11.3 0 12.8 12.4 12.6 3.4 3.2
2002 331 11/27 20.9 7.2 15.8 35.3 12.6 0 12.9 12.6 12.7 3.6 4
2002 332 11/28 18.8 3.3 13.6 38.9 5.7 0 12.9 12.5 12.7 3.4 2.5 2002 333 11/29 20.9 10.6 14.9 69.9 8.8 5.59 12.9 12.5 12.6 2.4 1.8
2002 334 11/30 21.2 11.2 15.5 83.6 9.6 0.76 13.6 12.9 13.2 2 1.4 2002 335 12/1 19.3 6 12.7 82.4 11.6 0 13.8 13.5 13.6 1.4 1.8
2002 336 12/2 15.8 8.2 11.9 91.6 3.8 2.03 13.8 13.6 13.7 1.1 0
2002 337 12/3 15.8 5.1 11.6 79.3 10.5 0 13.8 13.7 13.7 1.9 1.6
2002 338 12/4 17.4 1.6 8.9 81.7 12.1 0 13.8 13.3 13.5 1.3 1.8
2002 339 12/5 20.5 1.1 11.6 58 12.7 0 13.5 13 13.2 2.7 3.2 2002 340 12/6 22.2 4.9 13 46.2 12.3 0 13.1 12.8 12.9 1.8 2.8
2002 341 12/7 22.2 3.4 11.3 62.8 8.4 0 13 12.6 12.8 1.6 1.5 2002 342 12/8 17.9 0.3 8.8 70.4 12.1 0 12.8 12.4 12.6 1.4 2 2002 343 12/9 18.2 2.3 10.9 53.7 11.1 0 12.6 12.2 12.4 2 2.4 2002 344 12/10 18.5 2.3 10.1 53.8 12.2 0 12.4 12.1 12.2 1.6 2.5
2002 345 12/11 16 1.1 8.1 60 11.6 0 12.3 11.8 12 1.7 2.2
2002 346 12/12 17.9 -1 7.8 55.6 12.3 0 12 11.5 11.7 1.5 2.3 2002 347 12/13 19.3 -2.3 7.8 52.3 11.7 0 11.7 11.2 11.4 1.2 2.1

90
Table A - 3. Climatic data during the 2003 cantaloupe experiment - AZMET.
Year DOY Date Air temperature
(°C) Relative Solar humidity Radiation
f o / \ /n^i/ 2s
Rainfall (mm)
Soil temperature at 10 cm
(°C)
Wind speed
(m/sec)
Reference ET
(mm) MAX MIN Mean
y / O ) V^iVlJ/111 J MAX MIN Mean
Wind speed
(m/sec)
Reference ET
(mm)
2003 85 3/26 29.7 6.9 18.2 33.6 23.58 0 15.1 14.1 14.4 1.5 6.8
2003 86 3/27 25.8 9.6 18.6 28.1 20.54 0 15.4 15 15.2 3.9 5.6
2003 87 3/28 20.5 6.2 15.1 16.7 24.4 0 15.1 14.6 14.8 3.5 2.6
2003 88 3/29 20.4 10.6 15.2 19.2 24.77 0 14.7 14.2 14.4 6 3.2
2003 89 3/30 26.6 6.3 17 17.7 25.27 0 14.2 13.8 14 3 5.3
2003 90 3/31 32.2 5.2 19 21 25.07 0 14 13.6 13.9 1.4 7.5
2003 91 4/1 31.3 9.3 22.2 17 24.87 0 14.3 13.9 14 2.4 8
2003 92 4/2 25.7 14.2 21.1 24.6 19.83 0 14.6 14.3 14.4 2.8 7.2
2003 93 4/3 22.5 8 15.4 27.4 23.52 0 14.6 14.3 14.5 3.1 3.7
2003 94 4/4 22.5 4.4 14.7 23.6 25.33 0 14.6 14.2 14.4 1.8 3.2
2003 95 4/5 20.9 6.1 13.8 29.3 25.44 0 14.5 14.2 14.3 3.4 2.7
2003 96 4/6 20.1 2.5 12.9 25.2 25.98 0 14.4 14 14.1 1.9 2.1
2003 97 4/7 24.2 2.1 14.2 22.3 25.92 0 14.2 13.8 14 2.1 3.8
2003 98 4/8 28 3.5 18.7 20.9 25.95 0 14.1 13.9 14 3.9 5.5
2003 99 4/9 31.1 13.5 23.4 13.3 25.19 0 14.4 14.1 14.2 3.7 9.4
2003 100 4/10 30.9 8.9 20.8 18.1 24.79 0 14.7 14.3 14.4 1.9 7.7
2003 101 4/11 29.2 7.5 19.4 17.2 26.57 0 14.8 14.5 14.6 1.4 6.8
2003 102 4/12 30.2 9.8 21.1 17.6 22.93 0 15.1 14.7 14.9 1.6 7.7
2003 103 4/13 30.3 10.2 21.9 22 26.35 0 15.5 15.1 15.2 1.9 7.8
2003 104 4/14 27.5 13.5 21.7 31 15.14 0 15.8 15.5 15.6 2.4 7.7
2003 105 4/15 20 8.4 15 42.5 23.04 1.02 15.8 15.6 15.7 3.5 2.6
2003 106 4/16 27.4 3.2 16 37.7 26.99 0 15.7 15.3 15.5 1.1 5.1
2003 107 4/17 24.8 9.9 17.4 27.4 26.96 0 15.9 15.6 15.7 2.8 5.2
2003 108 4/18 21.5 6.4 15.8 33 24.99 0 15.9 15.5 15.7 2.5 3
2003 109 4/19 21.8 6.1 14.7 36.9 26.71 0 15.8 15.4 15.6 1.5 3.1
2003 110 4/20 30.8 5.1 19.5 27 26.97 0 15.9 15.4 15.6 1.5 6.9
2003 111 4/21 28.3 8.7 20.6 26.8 26.46 0 16.3 15.8 16 2.2 6.5
2003 112 4/22 23.1 8.6 16.8 33.1 25.38 0 16.4 16.1 16.2 3.4 4.1
2003 113 4/23 22.3 6 15 35.2 27.49 0 16.4 15.8 16.1 1.8 3.3
2003 114 4/24 27.1 4.9 16.9 26.2 27.93 0 16.5 15.9 16.2 1.8 5.2
2003 115 4/25 29.2 7.4 20 24.2 27.44 0 16.9 16.1 16.4 1.9 6.6
2003 116 4/26 31.5 10.8 22 24.5 27.55 0 17.5 16.7 16.9 1.8 8.6
2003 117 4/27 31.7 12.4 23.6 21.9 27.04 0 17.8 17.2 17.5 1.7 9.1
2003 118 4/28 31.7 11.3 22.4 22.5 27.91 0 18 17.5 17.7 1.9 8.7
2003 119 4/29 30.1 10.9 21.5 21.2 27.53 0 18.2 17.6 17.9 2.7 7.9
2003 120 4/30 28.2 8.5 19.6 20.9 28.23 0 18.2 17.6 17.9 2.5 6.4
2003 121 5/1 29.2 7.2 19.5 20.1 28.21 0 18.1 17.4 17.7 1.6 6.7
2003 122 5/2 31.8 7.5 21.3 18.5 26.54 0 17.9 17.4 17.6 1.9 7.7
2003 123 5/3 30 13.6 22.5 15.7 24.63 0 18 17.5 17.7 3 9

91
Table A - 3. Climatic data during the 2003 cantaloupe experiment - AZMET {continued).
Year DOY Date Air temperature
(°C) Relative Solar humidity Radiation
Rainfall (mm)
Soil temperature at 10 cm
(°C)
Wind speed
(m/sec)
Reference ET
(mm) MAX MIN Mean
y / o ) MAX MIN Mean
Wind speed
(m/sec)
Reference ET
(mm)
2003 124 5/4 26 15.4 20.4 32.4 28.23 0 18.3 17.7 17.9 2.9 7.9
2003 125 5/5 26.9 8.1 19.4 28.4 28.31 0 18.3 17.7 18 2.2 5.7
2003 126 5/6 29.3 11 21.2 24.4 25.89 0 18.2 17.7 17.9 2 7.6
2003 127 5/7 28.3 12 21.5 22.7 28.57 0 18.3 17.9 18.1 2.6 7.4
2003 128 5/8 27.8 10.7 20.2 26 28.21 0 18.3 17.8 18 2.2 6.8
2003 129 5/9 27.6 8.3 19.2 27.3 28.18 0 18.2 17.7 18 3.2 6.2
2003 130 5/10 25.8 5.6 17.6 21 29.46 0 18.2 17.5 17.8 1.8 4.8
2003 131 5/11 32.1 4.9 20 18.6 26.99 0 18 17.4 17.7 1.2 7.3
2003 132 5/12 35.1 8.9 23.2 15.3 28.86 0 18.3 17.5 17.8 1.3 8.9
2003 133 5/13 36.2 12.3 25.3 14.3 28.2 0 18.8 18.1 18.3 1.7 10.1
2003 134 5/14 36.1 15 27.2 12.6 22.69 0 19.1 18.6 18.8 1.4 11.4
2003 135 5/15 30.6 16 24.8 14.8 29.44 0 19.3 18.8 19 3 10.5
2003 136 5/16 36.9 10.6 25.2 18.3 29.55 0 19.6 18.9 19.2 1.3 9.8
2003 137 5/17 39 13.4 28.2 16.3 27.19 0 20.1 19.4 19.7 1.7 11.1
2003 138 5/18 35.8 15.8 27.1 17 27.71 0 20.2 19.7 20 2.4 11.6
2003 139 5/19 34.9 13.9 26.7 16.7 29.05 0 20.2 19.6 19.9 1.6 10.6
2003 140 5/20 37.2 13.1 27.7 16.9 28.53 0 20.3 19.8 20 1.2 10.6
2003 141 5/21 37.7 22.9 31.4 19.7 26.23 0 20.9 20.2 20.4 2.4 15
2003 142 5/22 36.6 20 29.1 16.4 20.51 0 21 20.7 20.9 1.3 13.7
2003 143 5/23 37.6 16.7 29 19.2 20.85 0 21 20.6 20.8 1.3 12.4
2003 144 5/24 38.3 17.7 28.8 19.2 28.98 0 21.3 20.7 20.9 1.6 12.9
2003 145 5/25 34.3 13.5 26 13.1 30.34 0 21.5 20.9 21.2 1.7 10.3
2003 146 5/26 36.3 15.7 28.2 16.4 29.1 0 21.6 21 21.3 1.9 11.7
2003 147 5/27 40.7 18.3 31.3 15.5 28.52 0 21.6 21 21.3 1.9 13.4
2003 148 5/28 37.3 28.5 32.9 16.6 28.95 0 22.2 21.6 21.8 4.6 17
2003 149 5/29 38.2 22 29.8 34.6 26 3.81 22.4 21.9 22.1 2.1 14.7
2003 150 5/30 36 20.4 26.2 49.6 23.05 0.51 22.5 22 22.2 1.8 13.7
2003 151 5/31 35.8 18.2 27.8 37.8 28.09 0 22.4 21.9 22.2 1.6 12.8
2003 152 6/1 38 17.6 29.6 24.8 29.02 0 22.8 22.2 22.4 1.7 12.8
2003 153 6/2 39.2 18 30.9 16.4 29.3 0 23 22.4 22.7 2.3 13.1
2003 154 6/3 38.1 17.8 30.5 17.4 28.9 0 23.2 22.6 22.9 2.4 12.9
2003 155 6/4 38.1 19 30.4 20.2 28.58 0 23.2 22.7 23 2.5 13.5
2003 156 6/5 37.2 17.8 29.6 14.5 29.7 0 23.1 22.5 22.9 2.6 12.8
2003 157 6/6 36.8 17.9 29.2 15.2 28.89 0 23.1 22.5 22.8 2.2 12.8
2003 158 6/7 37.5 16.1 29.3 16.8 29.35 0 23 22.4 22.7 2.2 12.1
2003 159 6/8 39.7 17.8 30.7 17.3 27.78 0 22.9 22.3 22.6 2 13.1
2003 160 6/9 36.9 24.1 30.6 14.9 28.88 0 23 22.5 22.8 2.3 15.4
2003 161 6/10 34.6 16.5 27.6 22.3 29.67 0 23 22.5 22.8 2.4 11.8
2003 162 6/11 34 16 26.9 19.6 29.98 0 23 22.3 22.6 2.2 11.4
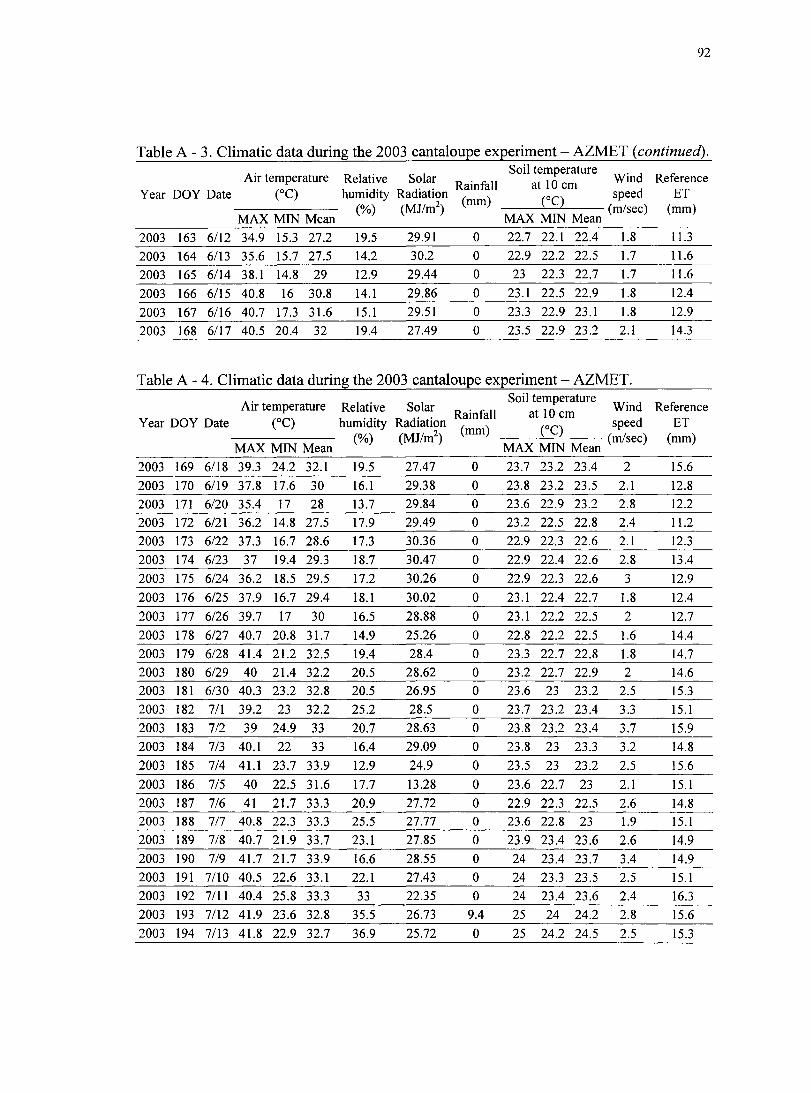
92
Table A - 3. Climatic data during the 2003 cantaloupe experiment - AZMET {continued). Soil temperature
Air temperature Relative Solar n • f n Year DOY Date (°C) humidity Radiation
MAX MIN Mean (MJ/mO
(°C)
MAX MIN Mean
Wind Reference speed ET
(m/sec) (mm)
2003 163 6/12 34.9 15.3 27.2 19.5 29.91 0 22.7 22.1 22.4 1 8 11.3
2003 164 6/13 35.6 15.7 27.5 14.2 30.2 0 22.9 22.2 22.5 1 7 11.6
2003 165 6/14 38.1 14.8 29 12.9 29.44 0 23 22.3 22.7 1 7 11.6
2003 166 6/15 40.8 16 30.8 14.1 29.86 0 23.1 22.5 22.9 1 8 12.4
2003 167 6/16 40.7 17.3 31.6 15.1 29.51 0 23.3 22.9 23.1 1 8 12.9
2003 168 6/17 40.5 20.4 32 19.4 27.49 0 23.5 22.9 23.2 2 1 14.3
Table A - 4. Climatic data during the 2003 cantaloupe experiment - AZMET. Soil temperature . ,
Air temperature Relative Solar r • f ii at 10 cm Wind Reference Year DOY Date (°C) humidity Radiation f'" speed ET
(MJW) (nVsec) (mm) MAX MIN Mean MAX MIN Mean
2003 169 6/18 39.3 24.2 32.1 19.5 27.47 0 23.7 23.2 23.4 2 15.6
2003 170 6/19 37.8 17.6 30 16.1 29.38 0 23.8 23.2 23.5 2.1 12.8
2003 171 6/20 35.4 17 28 13.7 29.84 0 23.6 22.9 23.2 2.8 12.2
2003 172 6/21 36.2 14.8 27.5 17.9 29.49 0 23.2 22.5 22.8 2.4 11.2
2003 173 6/22 37.3 16.7 28.6 17.3 30.36 0 22.9 22.3 22.6 2.1 12.3
2003 174 6/23 37 19.4 29.3 18.7 30.47 0 22.9 22.4 22.6 2.8 13.4
2003 175 6/24 36.2 18.5 29.5 17.2 30.26 0 22.9 22.3 22.6 3 12.9
2003 176 6/25 37.9 16.7 29.4 18.1 30.02 0 23.1 22.4 22.7 1.8 12.4
2003 177 6/26 39.7 17 30 16.5 28.88 0 23.1 22.2 22.5 2 12.7
2003 178 6/27 40.7 20.8 31.7 14.9 25.26 0 22.8 22.2 22.5 1.6 14.4
2003 179 6/28 41.4 21.2 32.5 19.4 28.4 0 23.3 22.7 22.8 1.8 14.7
2003 180 6/29 40 21.4 32.2 20.5 28.62 0 23.2 22.7 22.9 2 14.6
2003 181 6/30 40.3 23.2 32.8 20.5 26.95 0 23.6 23 23.2 2.5 15.3
2003 182 7/1 39.2 23 32.2 25.2 28.5 0 23.7 23.2 23.4 3.3 15.1
2003 183 7/2 39 24.9 33 20.7 28.63 0 23.8 23.2 23.4 3.7 15.9
2003 184 7/3 40.1 22 33 16.4 29.09 0 23.8 23 23.3 3.2 14.8
2003 185 7/4 41.1 23.7 33.9 12.9 24.9 0 23.5 23 23.2 2.5 15.6
2003 186 7/5 40 22.5 31.6 17.7 13.28 0 23.6 22.7 23 2.1 15.1
2003 187 7/6 41 21.7 33.3 20.9 27.72 0 22.9 22.3 22.5 2.6 14.8
2003 188 7/7 40.8 22.3 33.3 25.5 27.77 0 23.6 22.8 23 1.9 15.1
2003 189 7/8 40.7 21.9 33.7 23.1 27.85 0 23.9 23.4 23.6 2.6 14.9
2003 190 7/9 41.7 21.7 33.9 16.6 28.55 0 24 23.4 23.7 3.4 14.9
2003 191 7/10 40.5 22.6 33.1 22.1 27.43 0 24 23.3 23.5 2.5 15.1
2003 192 7/11 40.4 25.8 33.3 33 22.35 0 24 23.4 23.6 2.4 16.3
2003 193 7/12 41.9 23.6 32.8 35.5 26.73 9.4 25 24 24.2 2.8 15.6
2003 194 7/13 41.8 22.9 32.7 36.9 25.72 0 25 24.2 24.5 2.5 15.3

93
Table A - 4. Climatic data during the 2003 cantaloupe experiment - AZMET (continued). „ , . „ , Soil temperature Relative Solar „ • ^ n „+ in u n J- Rainfall at 10 cm humidity Radiation
Air temperature Year DOY Date (°C)
MAX MIN Mean (%) (MJ/mO
(mm) (°C)
MAX MIN Mean
Wind Reference speed ET
(m/sec) (mm)
2003 195 7/14 42.6 24.2 34.4 27.5 26.46 0 25 24.4 24.6 2.4 15.7
2003 196 7/15 42.2 26.2 33.8 27.5 19.29 1.27 25 24.7 24.9 1.9 16.5
2003 197 7/16 42.7 21.5 33.8 28.5 27.18 0 25 24.4 24.7 1.3 14.9
2003 198 7/17 35.7 22.6 31 37.9 11.96 3.56 25 24.6 24.8 2.6 14.7
2003 199 7/18 35 21.4 27.8 61.2 25.33 1.78 24.7 24.2 24.4 1.8 14
2003 200 7/19 38.1 23.6 32 42 26.96 0 25.3 24.7 25 2.3 15.3
2003 201 7/20 40.2 25.8 33.4 34 26.18 1.27 25.4 25 25.2 3.8 16.2
2003 202 7/21 38.2 23.3 31.1 45.5 25.21 0 25.8 25.3 25.5 2.4 15.2
2003 203 7/22 39.1 24.8 32 39.5 26.1 0 25.9 25.6 25.7 2.8 15.8
2003 204 7/23 40.4 25.3 32.2 39.7 23.97 0 26 25.5 25.7 2.1 16.1
2003 205 7/24 39.2 24.9 31.6 40.4 26.23 3.56 26.2 25.9 26.1 2.7 15.9
2003 206 7/25 37.6 22.1 30.6 47.5 23.58 13.21 26.6 25.8 26 2.4 14.7
2003 207 7/26 36.6 23.3 29.3 57.3 24.05 0 26.6 26.1 26.3 2.2 15.1
2003 208 7/27 36.7 24 29.7 49.9 25.69 0 26.5 25.9 26.1 2.2 15.4
2003 209 7/28 34.7 21.7 27.8 52.7 19.54 0 26.6 26.2 26.4 2.1 14.1
2003 210 7/29 34.5 20.8 25.5 64.8 23.34 9.65 26.6 25.9 26.2 2.1 13.7
2003 211 7/30 34.9 20.1 27.5 57.9 25.27 0 26.1 25.6 25.9 1.3 13.5
2003 212 7/31 35 22 28.2 57.4 22.93 0 26.4 25.8 26 1.9 14.4
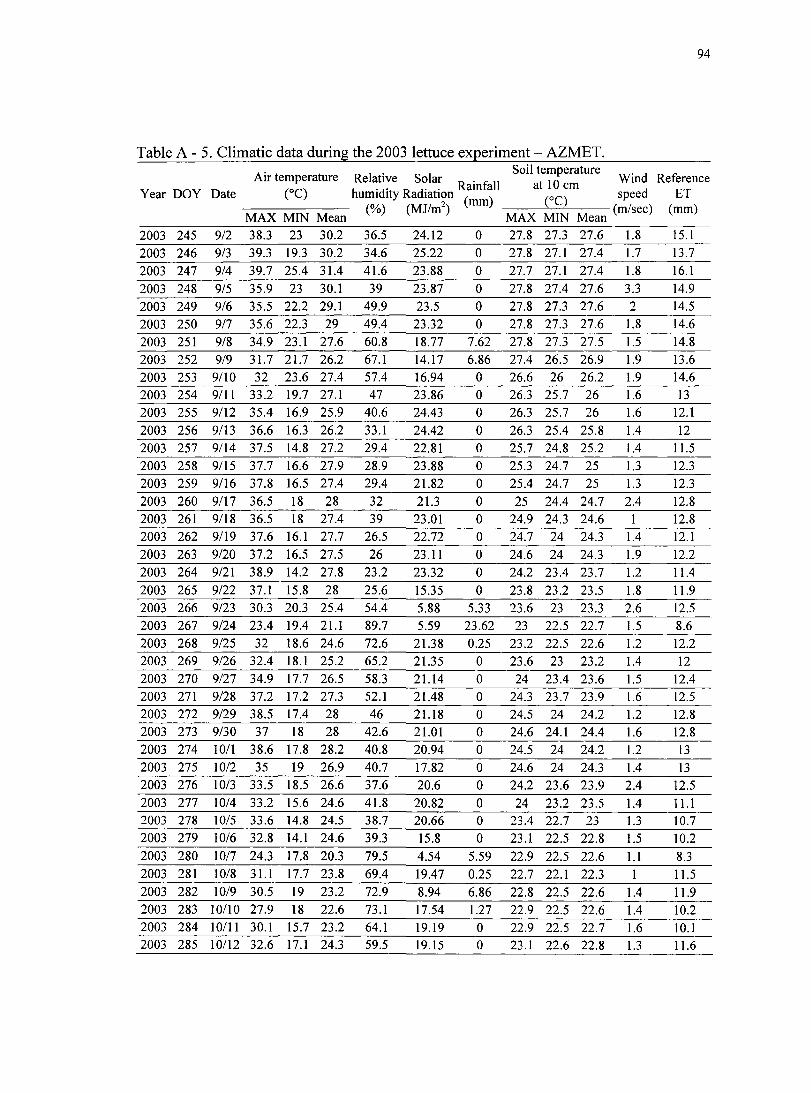
Table A - 5. Climatic data during the 2003 lettuce experiment - AZMET.
Year DOY Date Air temperature
(°C) Relative Solar humidity Radiation
Rainfall (mm)
Soil temperature at 10 cm
(°C)
Wind speed
(m/sec)
Reference ET
(mm) MAX MIN Mean
y/o) MAX MIN Mean
Wind speed
(m/sec)
Reference ET
(mm)
2003 245 9/2 38.3 23 30.2 36.5 24.12 0 27.8 27.3 27.6 1.8 15.1
2003 246 9/3 39.3 19.3 30.2 34.6 25.22 0 27.8 27.1 27.4 1.7 13.7
2003 247 9/4 39.7 25.4 31.4 41.6 23.88 0 27.7 27.1 27.4 1.8 16.1
2003 248 9/5 35.9 23 30.1 39 23.87 0 27.8 27.4 27.6 3.3 14.9
2003 249 9/6 35.5 22.2 29.1 49.9 23.5 0 27.8 27.3 27.6 2 14.5
2003 250 9/7 35.6 22.3 29 49.4 23.32 0 27.8 27.3 27.6 1.8 14.6
2003 251 9/8 34.9 23.1 27.6 60.8 18.77 7.62 27.8 27.3 27.5 1.5 14.8
2003 252 9/9 31.7 21.7 26.2 67.1 14.17 6.86 27.4 26.5 26.9 1.9 13.6
2003 253 9/10 32 23.6 27.4 57.4 16.94 0 26.6 26 26.2 1.9 14.6
2003 254 9/11 33.2 19.7 27.1 47 23.86 0 26.3 25.7 26 1.6 13
2003 255 9/12 35.4 16.9 25.9 40.6 24.43 0 26.3 25.7 26 1.6 12.1
2003 256 9/13 36.6 16.3 26.2 33.1 24.42 0 26.3 25.4 25.8 1.4 12
2003 257 9/14 37.5 14.8 27.2 29.4 22.81 0 25.7 24.8 25.2 1.4 11.5
2003 258 9/15 37.7 16.6 27.9 28.9 23.88 0 25.3 24.7 25 1.3 12.3
2003 259 9/16 37.8 16.5 27.4 29.4 21.82 0 25.4 24.7 25 1.3 12.3
2003 260 9/17 36.5 18 28 32 21.3 0 25 24.4 24.7 2.4 12.8
2003 261 9/18 36.5 18 27.4 39 23.01 0 24.9 24.3 24.6 1 12.8 2003 262 9/19 37.6 16.1 27.7 26.5 22.72 0 24.7 24 24.3 1.4 12.1
2003 263 9/20 37.2 16.5 27.5 26 23.11 0 24.6 24 24.3 1.9 12.2
2003 264 9/21 38.9 14.2 27.8 23.2 23.32 0 24.2 23.4 23.7 1.2 11.4
2003 265 9/22 37.1 15.8 28 25.6 15.35 0 23.8 23.2 23.5 1.8 11.9
2003 266 9/23 30.3 20.3 25.4 54.4 5.88 5.33 23.6 23 23.3 2.6 12.5
2003 267 9/24 23.4 19.4 21.1 89.7 5.59 23.62 23 22.5 22.7 1.5 8.6
2003 268 9/25 32 18.6 24.6 72.6 21.38 0.25 23.2 22.5 22.6 1.2 12.2
2003 269 9/26 32.4 18.1 25.2 65.2 21.35 0 23.6 23 23.2 1.4 12
2003 270 9/27 34.9 17.7 26.5 58.3 21.14 0 24 23.4 23.6 1.5 12.4 2003 271 9/28 37.2 17.2 27.3 52.1 21.48 0 24.3 23.7 23.9 1.6 12.5 2003 272 9/29 38.5 17.4 28 46 21.18 0 24.5 24 24.2 1.2 12.8 2003 273 9/30 37 18 28 42.6 21.01 0 24.6 24.1 24.4 1.6 12.8 2003 274 10/1 38.6 17.8 28.2 40.8 20.94 0 24.5 24 24.2 1.2 13 2003 275 10/2 35 19 26.9 40.7 17.82 0 24.6 24 24.3 1.4 13 2003 276 10/3 33.5 18.5 26.6 37.6 20.6 0 24.2 23.6 23.9 2.4 12.5 2003 277 10/4 33.2 15.6 24.6 41.8 20.82 0 24 23.2 23.5 1.4 11.1 2003 278 10/5 33.6 14.8 24.5 38.7 20.66 0 23.4 22.7 23 1.3 10.7 2003 279 10/6 32.8 14.1 24.6 39.3 15.8 0 23.1 22.5 22.8 1.5 10.2
2003 280 10/7 24.3 17.8 20.3 79.5 4.54 5.59 22.9 22.5 22.6 1.1 8.3 2003 281 10/8 31.1 17.7 23.8 69.4 19.47 0.25 22.7 22.1 22.3 1 11.5 2003 282 10/9 30.5 19 23.2 72.9 8.94 6.86 22.8 22.5 22.6 1.4 11.9 2003 283 10/10 27.9 18 22.6 73.1 17.54 1.27 22.9 22.5 22.6 1.4 10.2 2003 284 10/11 30.1 15.7 23.2 64.1 19.19 0 22.9 22.5 22.7 1.6 10.1 2003 285 10/12 32.6 17.1 24.3 59.5 19.15 0 23.1 22.6 22.8 1.3 11.6
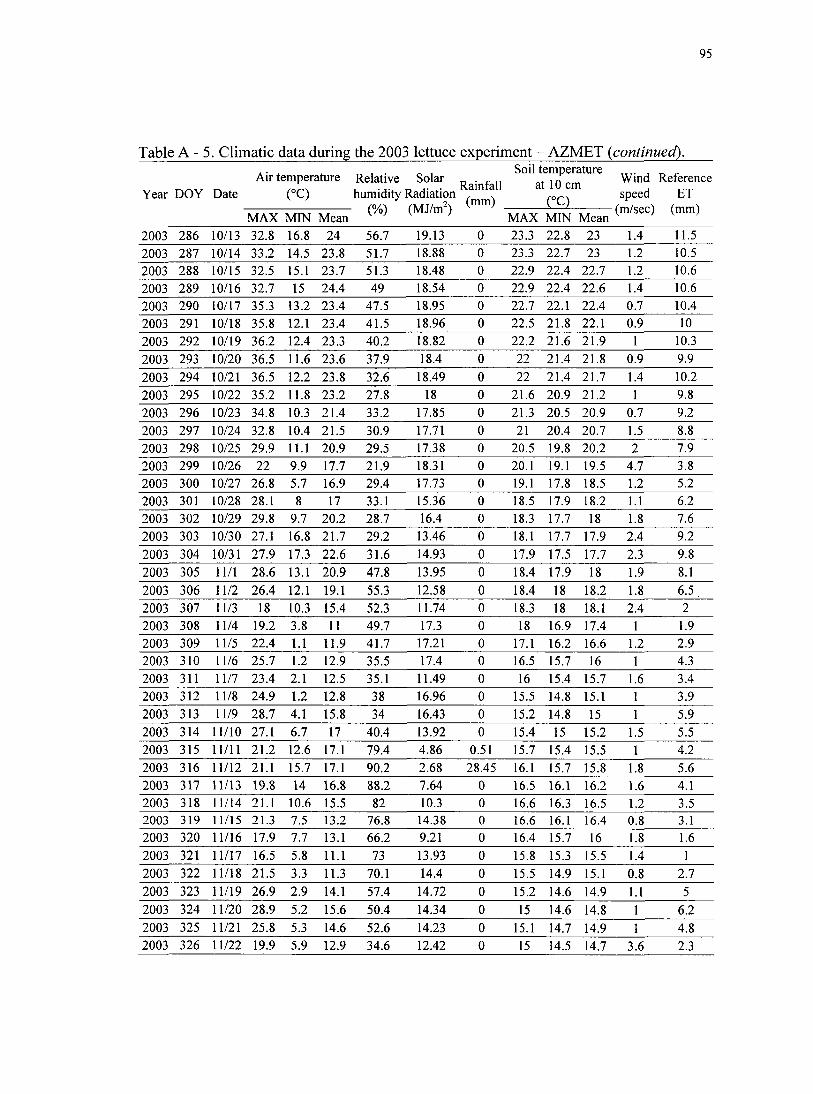
95
Table A - 5. Climatic data during the 2003 lettuce experiment - AZMET {continued).
Air temperature Relative Solar ^ ^Reference Year DOY Date (°C) humidity Radiation ^ , speed ET
MAX MIN Mew <*> """ MAX MIN Mean
2003 286 10/13 32.8 16.8 24 56.7 19.13 0 23.3 22.8 23 1.4 11.5
2003 287 10/14 33.2 14.5 23.8 51.7 18.88 0 23.3 22.7 23 1.2 10.5
2003 288 10/15 32.5 15.1 23.7 51.3 18.48 0 22.9 22.4 22.7 1.2 10.6
2003 289 10/16 32.7 15 24.4 49 18.54 0 22.9 22.4 22.6 1.4 10.6
2003 290 10/17 35.3 13.2 23.4 47.5 18.95 0 22.7 22.1 22.4 0.7 10.4
2003 291 10/18 35.8 12.1 23.4 41.5 18.96 0 22.5 21.8 22.1 0.9 10
2003 292 10/19 36.2 12.4 23.3 40.2 18.82 0 22.2 21.6 21.9 1 10.3
2003 293 10/20 36.5 11.6 23.6 37.9 18.4 0 22 21.4 21.8 0.9 9.9
2003 294 10/21 36.5 12.2 23.8 32.6 18.49 0 22 21.4 21.7 1.4 10.2
2003 295 10/22 35.2 11.8 23.2 27.8 18 0 21.6 20.9 21.2 1 9.8
2003 296 10/23 34.8 10.3 21.4 33.2 17.85 0 21.3 20.5 20.9 0.7 9.2
2003 297 10/24 32.8 10.4 21.5 30.9 17.71 0 21 20.4 20.7 1.5 8.8
2003 298 10/25 29.9 11.1 20.9 29.5 17.38 0 20.5 19.8 20.2 2 7.9
2003 299 10/26 22 9.9 17.7 21.9 18.31 0 20.1 19.1 19.5 4.7 3.8
2003 300 10/27 26.8 5.7 16.9 29.4 17.73 0 19.1 17.8 18.5 1.2 5.2
2003 301 10/28 28.1 8 17 33.1 15.36 0 18.5 17.9 18.2 1.1 6.2
2003 302 10/29 29.8 9.7 20.2 28.7 16.4 0 18.3 17.7 18 1.8 7.6
2003 303 10/30 27.1 16.8 21.7 29.2 13.46 0 18.1 17.7 17.9 2.4 9.2
2003 304 10/31 27.9 17.3 22.6 31.6 14.93 0 17.9 17.5 17.7 2.3 9.8
2003 305 11/1 28.6 13.1 20.9 47.8 13.95 0 18.4 17.9 18 1.9 8.1
2003 306 11/2 26.4 12.1 19.1 55.3 12.58 0 18.4 18 18.2 1.8 6.5
2003 307 11/3 18 10.3 15.4 52.3 11.74 0 18.3 18 18.1 2.4 2
2003 308 11/4 19.2 3.8 11 49.7 17.3 0 18 16.9 17.4 1 1.9
2003 309 11/5 22.4 1.1 11.9 41.7 17.21 0 17.1 16.2 16.6 1.2 2.9
2003 310 11/6 25.7 1.2 12.9 35.5 17.4 0 16.5 15.7 16 1 4.3
2003 311 11/7 23.4 2.1 12.5 35.1 11.49 0 16 15.4 15.7 1.6 3.4
2003 312 11/8 24.9 1.2 12.8 38 16.96 0 15.5 14.8 15.1 1 3.9
2003 313 11/9 28.7 4.1 15.8 34 16.43 0 15.2 14.8 15 1 5.9
2003 314 11/10 27.1 6.7 17 40.4 13.92 0 15.4 15 15.2 1.5 5.5
2003 315 11/11 21.2 12.6 17.1 79.4 4.86 0.51 15.7 15.4 15.5 1 4.2
2003 316 11/12 21.1 15.7 17.1 90.2 2.68 28.45 16.1 15.7 15.8 1.8 5.6 2003 317 11/13 19.8 14 16.8 88.2 7.64 0 16.5 16.1 16.2 1.6 4.1
2003 318 11/14 21.1 10.6 15.5 82 10.3 0 16.6 16.3 16.5 1.2 3.5 2003 319 11/15 21.3 7.5 13.2 76.8 14.38 0 16.6 16.1 16.4 0.8 3.1 2003 320 11/16 17.9 7.7 13.1 66.2 9.21 0 16.4 15.7 16 1.8 1.6
2003 321 11/17 16.5 5.8 11.1 73 13.93 0 15.8 15.3 15.5 1.4 1
2003 322 11/18 21.5 3.3 11.3 70.1 14.4 0 15.5 14.9 15.1 0.8 2.7
2003 323 11/19 26.9 2.9 14.1 57.4 14.72 0 15.2 14.6 14.9 1.1 5
2003 324 11/20 28.9 5.2 15.6 50.4 14.34 0 15 14.6 14.8 1 6.2 2003 325 11/21 25.8 5.3 14.6 52.6 14.23 0 15.1 14.7 14.9 1 4.8 2003 326 11/22 19.9 5.9 12.9 34.6 12.42 0 15 14.5 14.7 3.6 2.3

96
Table A - 5. Climatic data during the 2003 lettuce experiment - AZMET {continued).
Year DOY Date Air temperature
(°C) Relative Solar humidity Radiation
fO/\ /A/.I/
Rainfall (mm)
Soil temperature at 10 cm rc)
Wind speed
(m/sec)
Reference ET
(mm) MAX MIN Mean
y/o) MAX MIN Mean
Wind speed
(m/sec)
Reference ET
(mm)
2003 327 11/23 15.1 -3.3 5.8 40.2 15.09 0 14.5 13.4 13.9 1 0.4
2003 328 11/24 21.6 -3.5 8.7 44.8 12.76 0 13.5 12.6 13 1 2.3
2003 329 11/25 19.3 5.6 11.3 44.9 6.54 0 12.9 12.6 12.7 0.8 2
Table A - 6. Climatic data during the 2004 bell pepper experiment - AZMET. Soil temperature
at 10 cm (°C)
(MJ/mO Year DOY Date
Air temperature
ro Relative Solar humidity Radiation ' , ,
- (o/s (mm) Rainfall
MAX MIN Mean MAX MIN Mean
Wind Reference speed ET
(m/sec) (mm)
2004 111 4/20 25.6 6.5 17.7 26.3 28.38 0 16.9 16.2 16.5 2.2 4.8
2004 112 4/21 28.7 7 18.7 28.4 28.24 0 16.6 16 16.3 2 6.3
2004 113 4/22 28.6 10.9 20.4 23.9 28.46 0 16.6 16.2 16.4 4.1 7.2
2004 114 4/23 25.3 6.2 17.6 23.6 29.29 0 16.5 15.8 16.2 1.9 4.7
2004 115 4/24 27.8 6.4 18.7 30.5 29.05 0 16.5 15.5 15.9 1.7 5.8
2004 116 4/25 31.4 7.6 20.6 26.8 27.19 0 16.7 15.9 16.3 1 7.6
2004 117 4/26 32.9 10.6 24.9 18.8 25.34 0 16.9 16.4 16.6 3.6 8.8 2004 118 4/27 32.3 21.5 26.8 16.3 27.63 0 17.1 16.5 16.8 3 13.7
2004 119 4/28 32.3 15.2 24.3 26.1 22.58 1.27 17.3 16.9 17.1 2.5 10.6 2004 120 4/29 29.1 16.8 23.6 21 30.06 0 17.4 16.9 17.1 4 10.2
2004 121 4/30 25.4 10.7 19.4 25.5 30.91 0.76 17.3 16.7 17 2.5 5.6
2004 122 5/1 29.4 7 20.4 22 31.35 0 17.8 16.9 17.2 1.9 6.7
2004 123 5/2 30.9 16 25.6 14.3 31.05 0 17.8 17.4 17.6 3.4 10.6
2004 124 5/3 34.6 16.4 26 13.8 31.07 0 17.9 17.2 17.5 2.5 11.7 2004 125 5/4 35.9 11 25.6 16.4 30.58 0 18.3 17.6 17.9 1.6 9.6 2004 126 5/5 35 12.4 25.9 18.1 30.78 0 18.6 18.1 18.3 2.1 9.9 2004 127 5/6 34.5 13.9 26.4 17.7 30.35 0 18.7 18.1 18.4 1.8 10.5 2004 128 5/7 35.6 13.5 27.2 18.5 30.29 0 19.6 18.5 18.8 2.1 10.6 2004 129 5/8 35.5 17.1 26.8 21.2 23.71 0 19.6 18.9 19.2 1.1 12.2
2004 130 5/9 36.2 15.1 27.7 21.3 27.84 0 19.6 19 19.2 1.7 11.4
2004 131 5/10 34.8 17.7 27.2 22.7 30.19 0 20.2 19.3 19.6 2.2 12.4 2004 132 5/11 32.4 19.6 26.4 23.9 31.66 0 20.2 19.5 19.7 2.6 12.8 2004 133 5/12 30.5 14.6 24.2 18.6 32.13 0 19.9 19.4 19.6 2.9 9.8 2004 134 5/13 29.6 10.6 21.5 20.7 32.63 0 19.9 19.2 19.5 1.7 7.6 2004 135 5/14 34.5 9.9 23.2 16.9 29.8 0 19.6 19 19.3 1.2 9
2004 136 5/15 36.6 13 26 15.6 31.67 0 19.7 18.9 19.2 1.4 10.5 2004 137 5/16 35.9 13 27 12.8 30.62 0 19.7 19.1 19.4 1.8 10.3 2004 138 5/17 35.3 18 27.6 14.7 30.42 0 20 19.4 19.6 2.5 12.6 2004 139 5/18 36 14.9 27.3 19.5 29.51 0 20.1 19.5 19.9 1.9 11.3 2004 140 5/19 36.4 15.2 27.1 18.6 30.09 0 20.4 19.6 19.9 2 11.5 2004 141 5/20 35.5 13.8 26.3 18.7 29.23 0 20.6 20 20.3 2.6 10.7

97
Table A - 6. Climatic data during the 2004 bell pepper experiment - AZMET {continued).
Air temperature Relative Solar n • f n Wind Reference Year DOY Date (°C) humidity Radiation ^ speed ET
MAX MIN Mean MAX MIN Mean
2004 142 5/21 32.3 14.3 24.8 19.2 30.83 0 20.3 19.5 19.9 2.6 10.2
2004 143 5/22 31.4 11.7 22.8 20 31.22 0 19.8 17.3 18.3 1.9 8.8
2004 144 5/23 33 11.6 24.3 21.5 30.79 0 19.3 18.7 19 2.2 9.2
2004 145 5/24 33.5 14.1 25.5 16.1 30.38 0 19.8 19 19.3 2.4 10.4
2004 146 5/25 31.7 17 25.9 16.5 15.9 0 19.8 19.1 19.3 2 11.3
2004 147 5/26 32.4 20.5 26.2 20.8 24.7 0 19.4 19 19.2 2.7 13.2
2004 148 5/27 30.8 11.9 22.7 17.5 31.48 0 19.8 19.2 19.4 1.2 8.6
2004 149 5/28 34.4 11.9 24.5 18.1 31.13 0 20.2 19.6 19.8 2.2 9.5
2004 150 5/29 32.4 15.2 25 20.8 30.77 0 20.4 19.7 20.1 2.9 10.6
2004 151 5/30 33 14.9 25.9 23.6 30.94 0 20.1 19.5 19.7 2.1 10.6
2004 152 5/31 36.4 13.8 26.6 19.3 31.28 0 20.7 19.7 19.9 1.7 10.8
2004 153 6/1 38.4 14.1 28.1 16.4 31.16 0 20.7 20.1 20.4 1.6 11.3
2004 154 6/2 40.3 15.2 30.2 15.8 31.02 0 21.7 20.3 20.6 1.4 12.1
2004 155 6/3 41 18.2 31.4 14.9 30.85 0 21.8 20.9 21.2 1.8 13.4
2004 156 6/4 41.2 18.7 32 12.9 29.24 0 22.1 21 21.3 2.2 13.6
2004 157 6/5 40.3 17.8 30.8 14.5 30.95 0 22.3 21.4 21.8 1.8 13.2
2004 158 6/6 39.4 18.3 30.9 16.7 31.22 0 22.1 21.1 21.5 1.8 13.2 2004 159 6/7 37.8 18.4 30 16.3 31.57 0 22.5 21.3 21.6 2.1 13.2
2004 160 6/8 36.2 19 29.1 19.8 30.96 0 22.5 21.5 21.8 2.2 13.2
2004 161 6/9 34 21.6 28.1 21.9 30.99 0 22.4 21.5 21.7 3.1 14
2004 162 6/10 32 13 24.3 17.3 31.48 0 22.3 18.8 19.9 2.2 9.5
2004 163 6/11 34.3 13.8 25 17.3 31.61 0 21 20 20.3 1.4 10.4 2004 164 6/12 36.2 14.6 26.7 16 31.36 0 20.9 17.7 19 1.8 11.2 2004 165 6/13 37.9 13.7 28.2 13.2 31.13 0 20.1 19 19.4 1.6 11 2004 166 6/14 39.2 16.1 29.2 12.2 31.32 0 21.6 20 20.3 1.6 12.2 2004 167 6/15 37.5 15.4 29 16.9 31.31 0 21.6 19.2 20.1 1.7 11.8 2004 168 6/16 36.2 18.3 29.2 19.4 31.17 0 22 20.5 20.8 2.1 12.9 2004 169 6/17 37.6 18 28.7 21.1 31.26 0 22 20.1 20.7 1.6 12.9
2004 170 6/18 37.3 18 29.1 16.6 31.25 0 22.2 20.9 21.2 1.9 12.9 2004 171 6/19 38.1 18.8 29.5 19 30.68 0 22.3 20.1 20.9 2.3 13.3
2004 172 6/20 37.5 16.7 29.2 19.3 30.4 0 21.4 20.5 20.8 2.4 12.4 2004 173 6/21 36.4 18 28.8 21.8 29.83 0 22.4 21 21.3 2.3 12.7 2004 174 6/22 36 19.9 28.2 31.3 28.45 0 22.4 20.8 21.3 2.1 13.6 2004 175 6/23 35.2 20.9 28.8 29.9 23.49 0 22.5 21.5 21.7 2.2 13.9 2004 176 6/24 37.2 24.2 31.2 24.3 30.15 0 22.5 21.2 21.8 2.3 15.5 2004 177 6/25 38.5 19.6 30.9 22.1 29.82 0 23.2 22 22.3 2 13.7 2004 178 6/26 39.8 20.3 31.9 15.2 29.87 0 23.4 21.5 22.1 2 14.2 2004 179 6/27 39.4 20.5 30 21 24.16 0.51 22.6 21.8 22.1 1.7 14.2 2004 180 6/28 37.5 19.5 30 23.9 28.58 0 23.2 22 22.3 2 13.5 2004 181 6/29 36 19.8 29.7 19.9 30.84 0 23.3 21.6 22.3 1.9 13.5

98
Table A - 6. Climatic data during the 2004 bell pepper experiment - AZMET {continued).
A - . ^ „ , . „ . Soil temperature ^ Air temperature Relative Solar „ • f n Wind Reference
n Rainfall at 10 cm Year DOY Date ( C) humidity Radiation , . speed ET
MAX MIN Mean MAX MIN Mean
2004 182 6/30 36.6 18.4 28.7 15 31.39 0 23.1 22.2 22.5 2.3 13
2004 183 7/1 37.8 13.5 27.9 13 31.85 0 23 20.5 21.1 1.6 10.9
2004 184 7/2 38.1 13.7 28 11.9 31.49 0 22.4 21.2 21.5 1.6 11.1
2004 185 7/3 37.8 16 29 14.8 30.99 0 22.4 19.4 20.5 2.2 12.1
2004 186 7/4 37.4 16.4 29.1 15.2 30.62 0 21.3 20.2 20.5 1.7 12.2
2004 187 7/5 38.9 18.7 29.7 16.3 29.52 0 22.4 21.1 21.3 1.8 13.4
2004 188 7/6 38.8 17.2 29.5 19.2 26.96 0 22.4 20 21.1 1.7 12.7
2004 189 7/7 38.3 21.6 30.7 18.9 23.9 0 22.3 21.5 21.7 1.9 14.5
2004 190 7/8 36.8 23 29.5 32.2 18.95 0 22.3 21.6 21.9 1.8 15
2004 191 7/9 36.8 24.9 30.3 36.6 22.65 0 23.2 22 22.3 2.4 15.7
2004 192 7/10 39.8 24.6 31 34.6 26.69 0 23.7 22.6 22.9 1.8 15.8
2004 193 7/11 39.7 25.8 32.5 30.2 28.96 0.25 23.7 23.1 23.4 2.2 16.2
2004 194 7/12 39.9 26.2 31.2 41.2 20.84 0 24.7 23.6 23.9 1.8 16.4
2004 195 7/13 37.4 22.4 28.5 56.3 23.63 6.35 24.8 24 24.2 2.4 14.8
2004 196 7/14 30.5 22 26.4 66.5 16.96 3.81 24.5 24 24.2 1.3 13.4
2004 197 7/15 35.4 22.7 29.5 54.5 26.18 0 24.6 24 24.2 2.2 14.7
2004 198 7/16 38 26.3 31.4 39.5 23.86 0 25.8 24.4 24.7 2.3 16.3
2004 199 7/17 38 23.7 30.4 47 23.39 5.08 25.8 24.9 25.2 2.3 15.3
2004 200 7/18 39.2 24.3 30.5 50.4 25.18 0 25.3 24.5 24.8 1.7 15.7
2004 201 7/19 39.7 24.1 31.4 41.3 24.75 0 25.9 24.8 25.1 1.6 15.7
2004 202 7/20 39.8 24.7 33.1 31.6 28.39 0 25.9 25 25.2 2 15.8
2004 203 7/21 39.6 25.2 33.2 33 27.27 0 26.1 25.1 25.4 2.9 16
2004 204 7/22 38.8 27.1 33.5 32.6 26.33 0 26.1 25.4 25.6 3.3 16.6
2004 205 7/23 36.1 26.3 30.1 47 18.01 1.78 25.8 25.3 25.5 2.2 16.2
2004 206 7/24 35.4 24.7 29.6 43.3 21.19 0 25.3 24.3 24.6 2.1 15.5
2004 207 7/25 35.9 25.2 30.4 42 21.65 0 24.9 24.5 24.7 2.3 15.8 2004 208 7/26 36.2 19.8 28.9 48.7 27.4 12.7 25.5 24.6 24.9 2.7 13.5
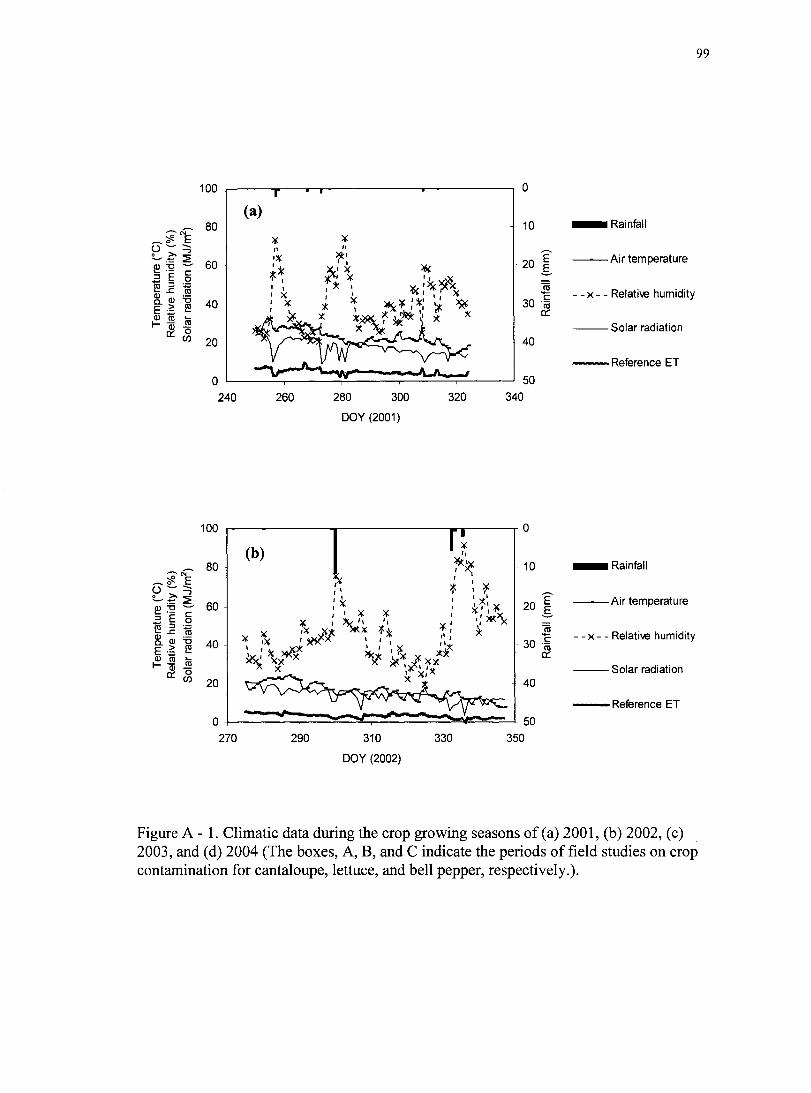
99
100
80
g) ig 3 E e E g. <1) E = « ro I- (1)
q;
60
40
20
240 260 280 300
DOY (2001)
I Rainfall
-Air temperature
- X - - Relative humidity
Solar radiation
• Reference ET
100
• ^ E
0) ';D B £ I Q. 0) E = 0 ra I- 0)
q;
80
60
40
20
270 290 310
DOY (2002)
330 350
I Rainfall
-Air temperature
- X - - Relative humidity
Solar radiation
• Reference ET
Figure A - 1. Climatic data during the crop growing seasons of (a) 2001, (b) 2002, (c) 2003, and (d) 2004 (The boxes, A, B, and C indicate the periods of field studies on crop contamination for cantaloupe, lettuce, and bell pepper, respectively.).

100
100
30 "m
120 160 200 240
DOY (2003)
280 320
I Rainfall
-Air temperature
- X - - Relati\« humidity
Solar radiation
• Reference ET
120 140 160 180
DOY (2004)
I Rain^ll
-Air temperature
- X - - Relative humidity
Solar radiation
• Reference ET
Figure A - 1. Climatic data during the crop growing seasons of (a) 2001, (b) 2002, (c) 2003, and (d) 2004 (The boxes, A, B, and C indicate the periods of field studies on crop contamination for cantaloupe, lettuce, and bell pepper, respectively.)(co«n>7we<50-

101
APPENDIX B - Water use efficiency experiment data
Table B - 1. Total applied water, crop yield and water use efficiency for lettuce.
Year Irrigation system
Irrigation (mm)
Crop yield (tonAia)
Precipitation (mm)
Total applied water (mm)
WUE" (kg/mm/ha)
SDIl 202.2 61.5 5.8 208.0 295.4 SDI2 202.2 58.6 5.8 208.0 281.8 SDI3 202.2 61.2 5.8 208.0 294.4 SDI4 202.2 48.2 5.8 208.0 231.7
2001 Average 202.2 57.4 5.8 208.0 275.8
2001 FIl 201.2 52.7 5.8 207.0 254.7 FI2 201.2 45.7 5.8 207.0 220.7 FI3 201.2 44.5 5.8 207.0 214.7
FI4 201.2 43.1 5.8 207.0 208.1 Average 201.2 46.5 5.8 207.0 224.6
SDIl 139.0 51.5 45.5 184.5 279.1 SDI2 139.0 37.9 45.5 184.5 205.3 SDI3 139.0 44.8 45.5 184.5 242.8 SDI4 139.0 48.1 45.5 184.5 260.7
2002 Average 139.0 45.6 45.5 184.5 247.0
2002 FIl 155.0 43.1 45.5 200.5 215.0 FI2 155.0 43.1 45.5 200.5 215.0 FI3 155.0 34.1 45.5 200.5 170.3 FI4 155.0 52.2 45.5 200.5 260.2
Average 155.0 43.1 45.5 200.5 215.1 SDIl 240.5 68.6 86.6 327.1 327.1 SDI2 238.5 76.7 86.6 325.2 325.2 SDI3 229.5 60.9 86.6 316.1 316.1 SDI4 229.6 73.0 86.6 316.2 316.2
2003 Average 234.5 69.8 86.6 321.1 321.1
2003 FIl 240.5 76.2 86.6 327.1 327.1 FI2 220.4 63.9 86.6 307.0 307.0 FI3 235.3 70.9 86.6 321.9 321.9 FI4 224.9 64.5 86.6 311.5 311.5
Average 230.3 68.8 86.6 316.9 316.9 * SDI; subsurface drip irrigation, FI: furrow irrigation ** WUE: water use efficiency

102
Table B - 2. Total applied water, crop yield and water use efficiency for cantaloupe.
Irrigation Irrigation Precipitation Total applied WUE**
system* (mm) (ton/ha) water (mm) (kg/mm/ha)
SDIl 831.6 187.4 43.7 875.3 214.1 Sl)12 894.1 182.2 43.7 937.8 194.3 SDI3 885.5 137.6 43.7 929.2 148.1
SDI4 924.1 173.8 43.7 967.8 179.6 Average 883.8 170.3 43,7 927.5 184.0
FIl 1299.6 171.8 43.7 1343.3 127.9
FI2 1296.0 196.8 43.7 1339.7 146.9 FI3 1291.6 162.0 43.7 1335.3 121.3 FI4 1289.9 137.8 43.7 1333.6 103.3
Average 1294.3 167.1 43.7 1338.0 124.9 * SDI: subsurface drip irrigation, FI: furrow irrigation ** WUE: water use efficiency
Table B - 3. Total applied water, crop yield and water use efficiency for bell pepper.
Year Irrigation system
Irrigation (mm)
Crop yield
(ton/ha)
Precipitation (mm)
Total applied water (mm)
WUE" (kg/mm/ha)
2003 SDIl 562.3 55.0 19.8 582.1 94.5 SDI2 479.7 53.2 19.8 499.6 106.6 SDI3 517.4 52.5 19.8 537.2 97.8 SDI4 579.2 55.6 19.8 599.0 92.8
Average 534.7 54.1 19.8 554.5 97.9 FIl 930.7 61.3 19.8 950.5 64.4 FI2 970.0 44.5 19.8 989.8 45.0 FI3 965.7 56.6 19.8 985.6 57.5 FI4 977.1 55.4 19.8 996.9 55.5
Average 960.9 54.4 19.8 980.7 55.6 * SDI: subsurface drip irrigation, FI: furrow irrigation ** WUE: water use efficiency

103
APPENDIX C - Crop contamination experiment data
Table C - 1. PRD-1 recoveries from the produce surfaces. Crops Cantaloupe Lettuce Bell pepper
Irrigation Days after PRD-1 E. coli C.perf. PRD-1 E. coli C. petf. PRD-1 E. coli C. perf. systems application (pfu/g) (cfii/g) (cfu/g) (pfii/g) (cfu/g) (cfu/g) (pfu/g) (cfu/g) (cfu/g)
Subsurface drip
irrigation
10
10
10
14
14
14
2.6E-01 5.3E-02 l.lE-01 4,7E-01 9.3E-02 .9E-01 3.2E+00 3.2E-01 6.4E-01
l.lE+00 2.2E-01 4.4E-01 4.2E-01 1,7E-01 1.7E-01 3.8E+00 3.8E-01 7.5E-01
5.2E+01 1.5E+01 4.9E-01 4.4E-01 8.7E-02 1.7E-01 4.5E+00 4.5E-01 9.0E-01
9,1E-01 1.8E-01 3.6E-01 4.3E-01 8.6E-02 1.7E-01 3.4E+00 3,4E-01 6.8E-01
8.3E-01 1.7E-01 3.3E-01 4.4E-01 8.8E-02 1.8E-01 1.2E+00 1.2E-01 2.4E-01
4.3E+02 4.4E+02 5.5E-01 4.7E-01 9.4E-02 1.9E-01 2.5E+00 2.5E-01 4.9E-01
1.6E+01 1.8E-01 3.6E-01 4,4E-01 2.7E+00 1.8E-01 2.2E+00 2.2E-01 4.4E-01
1.9E+01 1.6E+00 7.7E-01 5.0E-01 l.OE-01 2.0E-01 2.5E+00 2.5E-01 4.9E-01
1.3E+01 2.5E-01 5.1E-01 4.7E-01 1.9E-01 1.9E-01 2.2E+00 2.2E-01 4.3E-01
5.4E+01 2.8E-01 5.7E-01 4.7E-01 9.5E-02 1.9E-01 1.8E+00 1.8E-01 3.6E-01
l.OE+00 2.0E-01 4.1E-0I 5.3E-01 8.8E+00 2.1E-01 2.2E+00 2.2E-01 4.4E-01
1.5E+01 2.2E-01 4.4E-01 5.0E-01 2.7E+01 2.0E-01 8.3E-01 8.3E-02 1.7E-01
6.0E+00 2.4E-01 4.8E-01 5,8E-01 6.0E-01 2,3E-01 1.4E+00 1.4E-01 2.8E-01
,lE+00 2.2E-01 4.3E-01 4.1E-01 8.3E-02 1.7E-01 2.3E+00 2.3E-01 4.7E-0I
9.6E-01 1.9E-01 3.9E-01 5.3E-01 l.lE-01 2.1E-01 2.5E+00 2.5E-01 4.9E-01
1.2E+00 2.3E-01 4,6E-01 4.9E-01 9.9E-02 2.0E-01 2.1E+00 2.1E-01 4.2E-01
9.6E-01 1.9E-01 3.8E-01 7.2E+00 3.9E+01 1.7E-01 2.6E+00 2.6E-01 5.2E-01
l,2E+00 2.4E-01 4.7E-01 8.5E+00 1.9E-01 1.9E-01 1.7E+00 1.7E-01 3.4E-01
1.2E+00 2.4E-01 4.7E-01 3.4E+00 8.0E-02 1.6E-01 2.0E+00 2.0E-01 4.0E-01
Furrow irrigation
10
10
10
14
14
3.5E-01 6.9E-02 1.4E-01 5.0E-01 9.9E-02 2.0E-01 1.5E+00 .5E-01 3.0E-01
l.lE+00 2.2E-01 4.4E-01 2.5E+01 2.3E-01 2.3E-01 3.5E+00 3.5E-01 7.0E-01
1.9E+03 1.7E+02 4.0E-01 3.7E+00 9.2E-02 1.8E-01 3.2E+00 3.2E-01 6.5E-01
1.2E+02 2.1E-01 4.3E-01 1.5E+01 l.OE-01 2.0E-01 1.8E+00 1.8E-01 3.7E-01
1.2E+00 2.5E-01 1.5E+00 1.5E+02 9.3E-02 1.9E-01 1.4E+00 1.4E-01 2.8E-01
7.8E+00 1.7E+01 4.2E-01 1.2E+01 l.OE-01 2.0E-01 2.6E+00 2.6E-01 5.3E-01
1.2E+00 2.4E-01 4.7E-01 5,0E-01 2.7E+01 2.0E-01 1.5E+00 1.5E-01 3.0E-01
7.5E+00 2.3E-01 4.6E-01 5.2E+01 6.2E-01 .7E-01 2.6E+00 2.6E-01 5.2E-01
l.lE+00 2.7E+00 4.4E-01 l.OE+02 .5E+00 2.0E-01 2.3E+00 2.3E-01 4.7E-01
1.4E+00 1.7E+01 5.5E-01 1.8E+02 l,7E+00 .8E-01 1.4E+00 1.4E-01 2.8E-01
9.6E-01 1.9E-01 3.9E-01 4.2E+00 2.9E-01 .9E-01 1.7E+00 1.7E-01 3.3E-01
4.3E+01 2.0E-01 3.9E-01 8.5E+01 2.5E+02 2.0E-01 2.4E+00 2.4E-01 4.9E-01
9,6E-01 1.9E-01 3.9E-01 5.8E-01 2.0E+01 2.3E-01 2.7E+00 2.7E-01 5.5E-01
l.OE+00 2.1E-01 4.2E-01 1.5E+02 8.8E-01 1.8E-01 1.9E+00 1.9E-01 3.8E-01
l.lE+00 2.3E-01 4.5E-01 4.4E-01 8.8E-02 1.8E-01 9.2E-01 9.2E-02
1.2E+00 2.3E-01 4.6E-01 1.2E+01 7.6E-02 1.5E-01 1.8E+00
.8E-01
1.8E+00 2.4E-01 1.9E+00 2.1E+00 9.4E-02 1.9E-01 2.7E+00 2.7E-01 5.4E-01
8.3E-01 1.7E-01 3.3E-01 7.9E+01 l.OE-01 2.0E-01 2.0E+00 2.0E-01 3.9E-01
.8E-01 3.6E-0I
14 l,5E+00 2.9E-01 5.8E-01 1.3E+01 7.2E-01 1.7E-01 1.9E+00 1.9E-01 3.9E-01
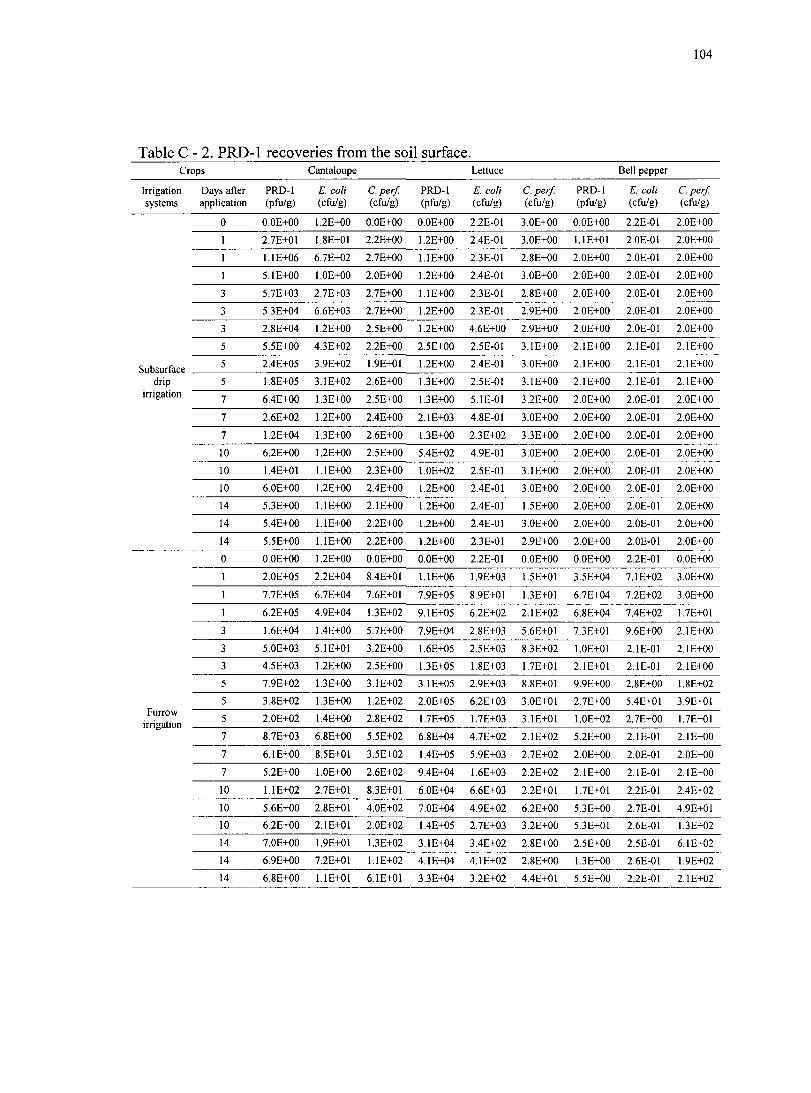
104
Table C - 2. PRD-1 recoveries from the soil surface. Crops Cantaloupe Lettuce Bell pepper
Irrigation Days after PRD-1 E. coli C.perf. PRD-1 E. coli C.perf. PRD-1 E. coli C. perf. systems application (pfu/g) (cfti/g) (cfu/g) (pfu/g) (cfu/g) (cfu/g) (pfu/g) (cfu/g) (cfu/g)
0 O.OE+OO 1.2E+00 O.OE+OO O.OE+OO 2.2E-01 3.0E+00 O.OE+OO 2.2E-01 2.0E+00
1 2.7E+01 1.8E+01 2.2E+00 1.2E+00 2.4E-01 3.0E+00 l.lE+01 2.0E-01 2.0E+00
1 l.lE+06 6.7E+02 2.7E+00 I.IE+OO 2.3E-01 2.8E+00 2.0E+00 2.0E-01 2.0E+00
1 5,lE+00 l.OE+00 2.0E+00 1.2E+00 2.4E-01 3.0E+00 2.0E+00 2.0E-01 2.0E+00
3 5,7E+03 2.7E+03 2.7E+00 l,lE+00 2.3E-01 2.8E+00 2.0E+00 2.0E-01 2.0E+00
3 5.3E+04 6.6E+03 2.7E+00 1.2E+00 2.3E-01 2.9E+00 2.0E+00 2.0E-01 2.0E+00
3 2.8E+04 1.2E+00 2.5E+00 1.2E+00 4.6E+00 2.9E+00 2.0E+00 2.0E-01 2.0E+00
5 5.5E+00 4.3E+02 2.2E+00 2,5E+00 2.5E-01 3.1E+00 2.1E+00 2.1E-01 2,lE+00
Subsurface 5 2.4E+05 3.9E+02 1.9E+01 1.2E+00 2.4E-01 3.0E+00 2.IE+00 2.IE-0I 2.1E+00
drip 5 1.8E+05 3.1E+02 2.6E+00 1.3E+00 2.5E-01 3.1E+00 2.1E+00 2.1E-01 2.1E+00 irrigation
7 6.4E+00 1.3E+00 2.5E+00 1.3E+00 5.1E-01 3.2E+00 2.0E+00 2.0E-01 2.0E+00
7 2.6E+02 1.2E+00 2.4E+00 2.1E+03 4.8E-01 3.0E+00 2.0E+00 2.0E-01 2.0E+00
7 1.2E+04 1.3E+00 2.6E+00 1.3E+00 2.3E+02 3.3E+00 2.0E+00 2.0E-01 2.0E+00
10 6.2E+00 1.2E+00 2.5E+00 5.4E+02 4.9E-01 3.0E+00 2.0E+00 2.0E-0I 2.0E+00
10 1.4E+01 l.lE+00 2.3E+00 l.OE+02 2.5E-01 3.1E+00 2.0E+00 2.0E-01 2.0E+00
10 6.0E+00 1.2E+00 2.4E+00 1.2E+00 2.4E-01 3.0E+00 2.0E+00 2.0E-01 2.0E+00
14 5.3E+00 l.lE+00 2.1E+00 1.2E+00 2.4E-01 1.5E+00 2.0E+00 2.0E-01 2.0E+00
14 5.4E+00 l.lE+00 2.2E+00 1.2E+00 2.4E-01 3.0E+00 2.0E+00 2.0E-01 2.0E+00
14 5.5E+00 l.lE+00 2.2E+00 1.2E+00 2.3E-01 2.9E+00 2.0E+00 2.0E-01 2.0E+00
O.OE+OO 1.2E+00 O.OE+00 O.OE+00 2.2E-01 O.OE+00 O.OE+00 2.2E-01 O.OE+00
2.0E+05 2,2E+04 8.4E+01 l.lE+06 1.9E+03 1.5E+01 3.5E+04 7.1E+02 3.0E+00
7.7E+05 6.7E+04 7.6E+01 7.9E+05 8.9E+01 1.3E+01 6.7E+04 7.2E+02 3.0E+00
6.2E+05 4.9E+04 1.3E+02 9.1E+05 6.2E+02 2.1E+02 6.8E+04 7.4E+02 1.7E+01
Furrow irrigation
3 1.6E+04 l,4E+00 5.7E+00 7.9E+04 2.8E+03 5.6E+01 7.3E+01 9.6E+00 2.1E+00
3 5.0E+03 5.1E+01 3.2E+00 1.6E+05 2.5E+03 8.3E+02 l.OE+01 2.1E-01 2.IE+00
3 4.5E+03 1.2E+00 2.5E+00 1.3E+05 1.8E+03 1.7E+01 2.1E+01 2.1E-01 2.1E+00
5 7.9E+02 1.3E+00 3.1E+02 3.1E+05 2.9E+03 8.8E+01 9.9E+00 2.8E+00 1.8E+02
5 3.8E+02 1.3E+00 1.2E+02 2.0E+05 6.2E+03 3.0E+01 2.7E+00 5.4E+01 3.9E+01
5 2.0E+02 1.4E+00 2.8E+02 1.7E+05 1.7E+03 3.1E+01 l.OE+02 2.7E+00 1.7E+01
7 8,7E+03 6.8E+00 5.5E+02 6.8E+04 4.7E+02 2.1E+02 5.2E+00 2.1E-01 2.1E+00
7 6.1E+00 8.5E+01 3.5E+02 1.4E+05 5.9E+03 2.7E+02 2.0E+00 2.0E-01 2.0E+00
7 5.2E+00 l.OE+00 2.6E+02 9.4E+04 1.6E+03 2.2E+02 2.1E+00 2.1E-01 2.1E+00
10 l.lE+02 2.7E+01 8.3E+01 6,0E+04 6,6E+03 2.2E+01 1.7E+01 2.2E-01 2.4E+02
10 5.6E+00 2.8E+01 4.0E+02 7.0E+04 4.9E+02 6.2E+00 5.3E+00 2.7E-01 4.9E+01
10 6.2E+00 2.1E+01 2.0E+02 1.4E+05 2.7E+03 3.2E+00 5.3E+01 2.6E-01 1.3E+02
14 7,0E+00 1,9E+01 1.3E+02 3.1E+04 3.4E+02 2.8E+00 2.5E+00 2.5E-01 6.1E+02
14 6.9E+00 7,2E+01 l.lE+02 4.1E+04 4.1E+02 2.8E+00 1.3E+00 2.6E-01 1.9E+02
14 6.8E+00 l.lE+01 6.1E+01 3.3E+04 3.2E+02 4.4E+01 5.5E+00 2.2E-01 2.1E+02
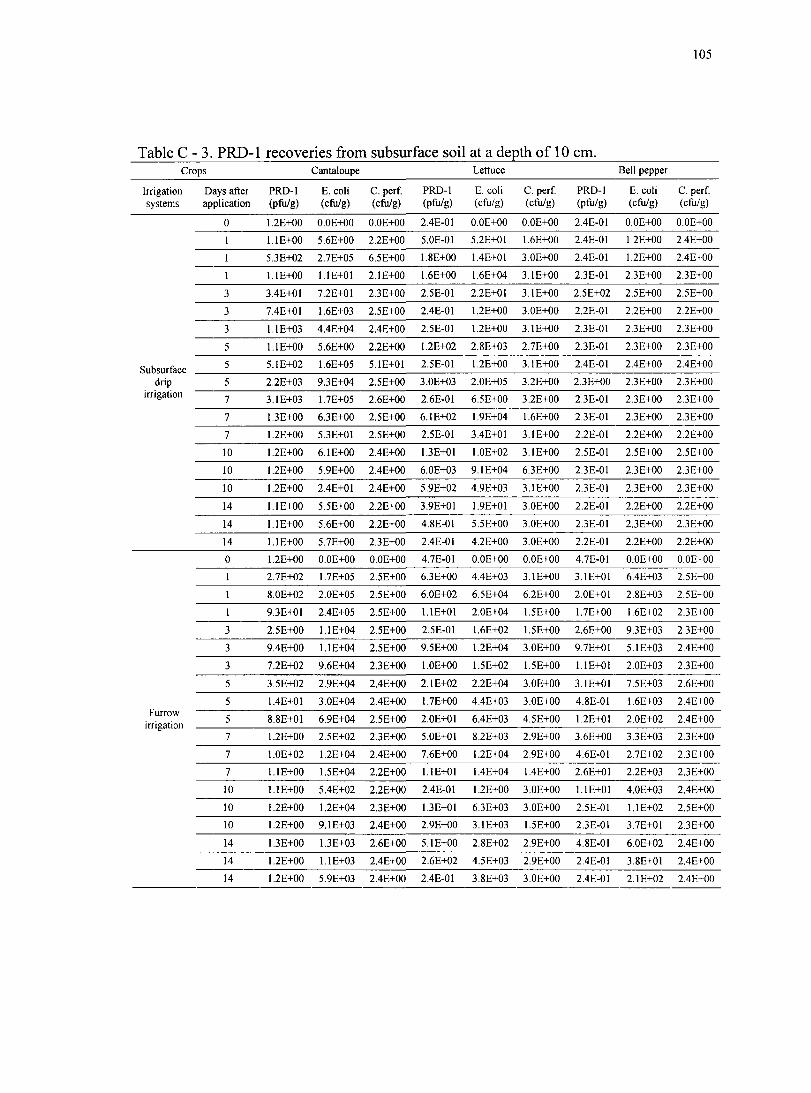
105
Table C - 3. PRD-1 recoveries from subsurface soil at a depth of 10 cm. Crops Cantaloupe Lettuce Bell pepper
Irrigation Days after PRD-1 E. coli C. perf PRD-1 E, coli C. perf PRD-1 E. coli C. perf
systems application (pfli/g) (cfu/g) (cfu/g) (pfu/g) (cfu/g) (cfu/g) (pfu/g) (cfu/g) (cfu/g)
1.2E+00 O.OE+00 O.OE+00 2.4E-01 O.OE+00 O.OE+00 2.4E-01 O.OE+00 O.OE+00
l.lE+00 5.6E+00 2.2E+00 5.0E-01 5.2E+01 1.6E+00 2.4E-01 1.2E+00 2.4E+00
5.3E+02 2.7E+05 6.5E+00 1.8E+00 1.4E+0I 3.0E+00 2.4E-01 1.2E+00 2.4E+00
l.lE+00 l.lE+01 2,lE+00 1.6E+00 1.6E+04 3.1E+00 2.3E-01 2.3E+00 2.3E+00
3.4E+01 7,2E+01 2.3E+00 2.5E-01 2.2E+0I 3.1E+00 2.5E+02 2.5E+00 2.5E+00
Subsurface drip
irrigation
Furrow irrigation
10
10
10
14
14
14
10
10
10
14
14
7.4E+01 1.6E+03 2.5E+00 2.4E-01 1.2E+00 3,0E+00 2.2E-01 2.2E+00 2.2E+00
l.lE+03 4.4E+04 2.4E+00 2.5E-01 1.2E+00 3.1E+00 2.3E-01 2.3E+00 2,3E+00
l.lE+00 5.6E+00 2.2E+00 1.2E+02 2.8E+03 2.7E+00 2.3E-01 2.3E+00 2.3E+00
5.1E+02 1.6E+05 5.1E+01 2.5E-01 1.2E+00 3.1E+00 2.4E-01 2.4E+00 2.4E+00
2.2E+03 9.3E+04 2.5E+00 3.0E+03 2.0E+05 3.2E+00 2.3E+00 2.3E+00 2.3E+00
3.1E+03 1.7E+05 2.6E+00 2.6E-01 6.5E+00 3.2E+00 2.3E-01 2.3E+00 2.3E+00
1.3E+00 6.3E+00 2.5E+00 6.1E+02 1.9E+04 1.6E+00 2.3E-01 2.3E+00 2.3E+00
1.2E+00 5.3E+01 2.5E+00 2.5E-01 3.4E+01 3.1E+00 2.2E-01 2.2E+00 2.2E+00
1.2E+00 6.1E+00 2.4E+00 1.3E+01 l.OE+02 3.1E+00 2.5E-01 2.5E+00 2.5E+00
1.2E+00 5.9E+00 2.4E+00 6.0E+03 9.1E+04 6.3E+00 2.3E-01 2.3E+00 2.3E+00
1.2E+00 2.4E+01 2.4E+00 5.9E+02 4.9E+03 3.1E+00 2.3E-01 2.3E+00 2.3E+00
l,lE+00 5.5E+00 2,2E+00 3,9E+01 1.9E+01 3.0E+00 2.2E-01 2.2E+00 2.2E+00
l.lE+00 5.6E+00 2.2E+00 4.8E-01 5.5E+00 3.0E+00 2.3E-01 2.3E+00 2.3E+00
l.lE+00 5.7E+00 2.3E+00 2.4E-01 4.2E+00 3.0E+00 2.2E-01 2.2E+00 2.2E+00
l,2E+00 O.OE+00 0,0E+00 4,7E-01 O.OE+00 O.OE+00 4.7E-01 O.OE+00 O.OE+00
2.7E+02 1.7E+05 2.5E+00 6.3E+00 4.4E+03 3,lE+00 3.1E+01 6.4E+03 2.5E+00
8.0E+02 2.0E+05 2.5E+00 6.0E+02 6.5E+04 6.2E+00 2.0E+01 2.8E+03 2.5E+00
9.3E+01 2.4E+05 2.5E+00 l.lE+01 2.0E+04 1.5E+00 1.7E+00 I.6E+02 2.3E+00
2.5E+00 l.lE+04 2.5E+00 2.5E-01 1.6E+02 l,5E+00 2.6E+00 9.3E+03 2.3E+00
9.4E+00 l.lE+04 2.5E+00 9.5E+00 1.2E+04 3.0E+00 9.7E+0I 5.1E+03 2.4E+00
7.2E+02 9.6E+04 2.3E+00 l.OE+00 1.5E+02 1.5E+00 I.IE+OI 2.0E+03 2.3E+00
3.5E+02 2.9E+04 2.4E+00 2.1E+02 2.2E+04 3.0E+00 3.1E+01 7.5E+03 2.6E+00
1.4E+01 3.0E+04 2.4E+00 I.7E+00 4.4E+03 3.0E+00 4.8E-01 1.6E+03 2.4E+00
8.8E+01 6.9E+04 2.5E+00 2.0E+01 6,4E+03 4.5E+00 1.2E+01 2.0E+02 2.4E+00
1.2E+00 2.5E+02 2.3E+00 5.0E+01 8.2E+03 2.9E+00 3.6E+00 3.3E+03 2.3E+00
l.OE+02 l,2E+04 2.4E+00 7.6E+00 1.2E+04 2.9E+00 4.6E-01 2.7E+02 2.3E+00
l,lE+00 l,5E+04 2.2E+00 l.lE+01 1.4E+04 .4E+00 2.6E+01 2.2E+03 2.3E+00
l.lE+00 5,4E+02 2.2E+00 2.4E-01 1.2E+00 3.0E+00 l.lE+01 4,0E+03 2.4E+00
1.2E+00 1.2E+04 2.3E+00 1.3E+01 6.3E+03 3.0E+00 2.5E-01 l.lE+02 2.5E+00
1.2E+00 9,lE+03 2.4E+00 2.9E+00 3.1E+03 1.5E+00 2.3E-01 3.7E+01 2.3E+00
1.3E+00 1.3E+03 2.6E+00 5.1E+00 2.8E+02 2.9E+00 4.8E-01 6.0E+02 2.4E+00
1.2E+00 l.lE+03 2.4E+00 2.6E+02 4.5E+03 2.9E+00 2.4E-01 3.8E+01 2.4E+00
14 1.2E+00 5.9E+03 2.4E+00 2.4E-01 3.8E+03 3.0E+00 2.4E-01 2.1E+02 2.4E+00

106
1.0E+06
o> 1.0&-04
3 LL •. k_ O £ 1.0E+02
1,0E+00
F^infall
E coli
PRD-I
C. perf.
5 10
Days after injection
CD
Z)
1.0&-06
1.0E<-04
LL 1.0E+02 O
1 .OEi-OO
Rainfall —0— E coli
-Q— PRI>1 —A— C. perf.
5 10
Days after injection
: 10
20
30 'oj a:
^ 40
50
15
1.0E<-06
Rainfall
•A— C. perf. PRD1
o) 1.0Ef04 •—.
U-
b
£ 1.0E+02 o
1.0E+00
10 0 5 15
Days after injection
Figure C - 1. Field survival curves of the study microorganisms from soil surface in furrow irrigation plots (a, b, and c represent cantaloupe, lettuce, and bell pepper experiment, respectively).

107
1.0&-06
o) 1.0&-04
Rainfall
E coli
PRD-1
o 2 1.0Ef02
C. perf.
1.0&-00 4 5 10
Days after injection
1.0&-08
1.0E+06
O) 13 ^ 1.0E4-04 o 3 Li. O
1.0Ef02
1.0&-00
(b) I Rainfall o E coli
-PRD-1 —A—C. perf.
10 Days after injection
I 10
; 20
15
30 'ra OH
40
50
I.OEi-06
Rainfall —0— E coli
•A— C. perf. •a—PRD-1
ro 1.0Et04 -— 3 Ll-CL
I.OEi-02 Li-o
40
I.OEtOO
0 5 10 15
Days after injection
Figure C - 2. Field survival curves of the study microorganisms from subsurface soil at 10 cm in furrow irrigation plots (a, b, and c represent cantaloupe, lettuce, and bell pepper experiment, respectively).
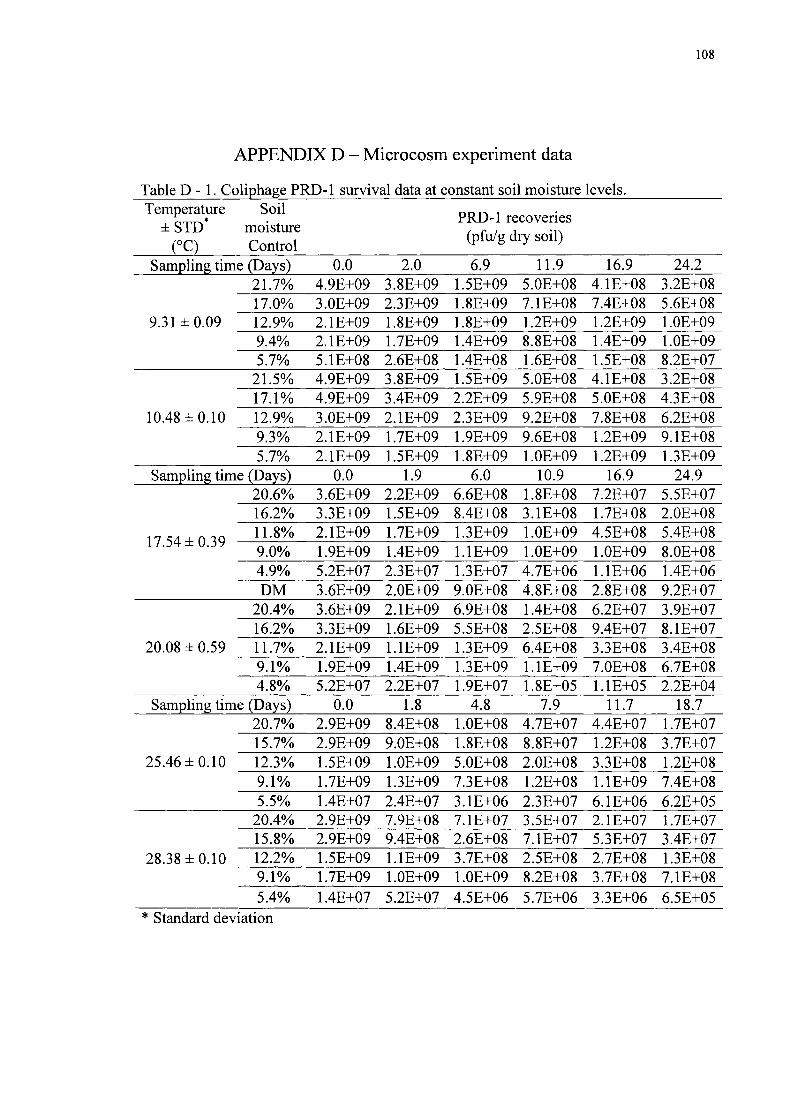
108
APPENDIX D - Microcosm experiment data
Table D - 1. Coliphage PRD-1 survival data at constant soil moisture levels. Temperature Soil
± STD* moisture (°C) Control
PRD-1 recoveries (pfu/g dry soil)
Sampling time (Days) 0.0 2.0 6.9 11.9 16.9 24.2 21.7% 4.9E+09 3.8E+09 1.5E+09 5.0E+08 4.1E+08 3.2E+08 17.0% 3.0E+09 2.3E+09 1.8E+09 7.1E+08 7.4E+08 5.6E+08
9.31 ± 0.09 12.9% 2.1E+09 1.8E+09 1.8E+09 1.2E+09 1.2E+09 l.OE+09 9.4% 2.1E+09 1.7E+09 1.4E+09 8.8E+08 1.4E+09 l.OE+09 5.7% 5.1E+08 2.6E+08 1.4E+08 1.6E+08 1.5E+08 8.2E+07
21.5% 4.9E+09 3.8E+09 1.5E+Q9 5.0E+08 4.1E+08 3.2E+08 17.1% 4.9E+09 3.4E+09 2.2E+09 5.9E+08 5.0E+08 4.3E+08
10.48 ±0.10 12.9% 3.0E+09 2.1E+09 2.3E+09 9.2E+08 7.8E+08 6.2E+08 9.3% 2.1E+09 1.7E+09 1.9E+09 9.6E+08 1.2E+09 9.1E+08 5.7% 2.1E+09 1.5E+09 1.8E+09 l.OE+09 1.2E+09 1.3E+Q9
Sampling time (Days) 0^0 L9 6^0 10.9 16.9 24.9 20.6% 3.6E+09 2.2E+09 6.6E+08 1.8E+08 7.2E+07 5.5E+07 16.2% 3.3E+09 1.5E+09 8.4E+08 3.1E+08 1.7E+08 2.0E+08 11.8% 2.1E+09 1.7E+09 1.3E+09 l.OE+09 4.5E+Q8 5.4E+08
9.0% 1.9E+09 1.4E+09 l.lE+09 l.OE+09 l.QE+09 8.0E+08 4.9% 5.2E+07 2.3E+07 1.3E+07 4.7E+06 l.lE+06 1.4E+06 DM 3.6E+09 2.0E+09 9.0E+08 4.8E+08 2.8E+08 9.2E+07
20.4% 3.6E+09 2.1E+09 6.9E+08 1.4E+08 6.2E+07 3.9E+07 16.2% 3.3E+09 1.6E+09 5.5E+08 2.5E+08 9.4E+07 8.1E+07
20.08 ±0.59 11.7% 2.1E+09 l.lE+09 1.3E+09 6.4E+08 3.3E+08 3.4E+08 9.1% 1.9E+09 1.4E+09 1.3E+09 l.lE+09 7.0E+08 6.7E+08 4.8% 5.2E+07 2.2E+07 1.9E+07 1.8E+05 l.lE+05 2.2E+04
Sampling time (Days) 0^0 L8 48 7^9 11.7 18.7 20.7% 2.9E+09 8.4E+08 l.OE+08 4.7E+07 4.4E+07 1.7E+07 15.7% 2.9E+09 9.0E+08 1.8E+08 8.8E+07 1.2E+08 3.7E+07
25.46 ±0.10 12.3% 1.5E+09 l.OE+09 5.0E+08 2.0E+08 3.3E+08 1.2E+08 9.1% 1.7E+09 1.3E+09 7.3E+08 1.2E+08 l.lE+09 7.4E+08 5.5% 1.4E+07 2.4E+07 3.1E+06 2.3E+07 6.1E+06 6.2E+05
20.4% 2.9E+09 7.9B+08 7.1E+07 3.5E+07 2.1E+Q7 1.7E+07 15.8% 2.9E+09 9.4E+08 2.6E+08 7.1E+07 5.3E+07 3.4E+07
28.38 ±0.10 12.2% 1.5E+09 l.lE+09 3.7E±08 2.5E+08 2.7E+08 1.3E+08 9.1% 1.7E+09 l.OE+09 l.OE+09 8.2E+08 3.7E+08 7.1E+08
5.4% 1.4E+07 5.2E+07 4.5E+06 5.7E+06 3.3E+06 6.5E+05
* Standard deviation

109
Table D - 1. Coliphage PRD-1 survival data at constant soil moisture levels {continued). Temperature
±STD* (°C)
Soil moisture Control
PRD-1 recoveries (pfu/g dry soil)
Sampling time (Days) 0.0 1.8 4.8 7.8 11.8 14.8 20.8% 3.3E±09 5.3E±08 9.7E+07 3.8E±07 1.6E+07 1.4E+07 15.9% 2.5E+09 8.9E+08 1.5E±08 7.2E±07 3.6E±07 3.4E±07
34.57 ±0.47 11.6% 2.1E±09 l.lE+09 5.0E+08 2.8E+08 2.0E+08 1.2E+08
8.2% 1.8E±09 l.lE+09 7.4E±08 3.8E±08 4.8E+08 2.5E+08
4.7% l.OE+07 7.2E+06 1.9E+06 4.4E±04 3.0E+04 2.4E+05
20.7% 3.3E+09 5.1E±08 1.5E+08 5.4E+07 1.6E±07 1.4E+07 15.7% 2.5E+09 9.2E±08 1.6E+08 6.0E+07 3.8E+07 3.7E+07
38.38 ±0.42 11.7% 2.1E+09 9.5E±08 5.1E+08 2.6E+08 1.6E+08 1.2E+08
7.8% 1.8E+09 8.5E±08 4.9E+08 4.3E+08 6.3E+07 9.0E+06
4.3% 1.0E±07 7.7E+05 6.6E+03 2.2E+03 2.2E±03 6.0E+02
* Standard deviation

110
Table D - 2. Coliphage PRD-1 survival in drying soil. Temperature Days after inoculation, microbial recoveries,
(°C) and soil moisture change
Days 0.0 2.0 6.9 11.9 16.9 24.2
9.31 ±0.09 -PRD-1' 4.9E+09 3.3E+09 3.2E+09 1.7E+09 8.7E+08 8.5E+06
9.31 ±0.09 -Soil
moisture 21.77% 20.34% 17.24% 12.33% 10.49% 5.41%
Days 0.0 2.0 6.9 11.9 16.9 24.2
10.48 ±0.10 PRD-1 4.9E+09 3.7E+09 2.1E+09 1.2E+09 4.5E+08 3.3E+05
Soil moisture
21.77% 19.83% 16.10% 10.90% 7.80% 4.41%
Days 0.0 1.9 6.0 10.9 16.9 24.9
17.54 ±0.39 PRD-1 3.6E+09 2.0E+09 9.0E+08 4.8E+08 2.8E±08 9.2E+07
Soil moisture
20.76% 19.84% 17.71% 13.76% 11.84% 9.47%
Days 0.0 1.9 6.0 10.9 16.9 24.9
20.08 ±0.59 PRD-1 3.6E+09 1.9E+09 8.4E+08 3.3E+08 9.8E+07 4.1E+03
Soil moisture
20.76% 19.38% 17.30% 14.97% 10.47% 4.14%
Days 0.0 1.8 4.8 7.9 11.7 18.7
25.46 ±0.10 PRD-1 2.9E+09 1.5E+09 1.7E+08 6.9E+07 2.8E+07 2.9E+05
Soil moisture
20.85% 19.52% 17.31% 14.72% 14.14% 6.60%
Days 0.0 1.8 4.8 7.9 11.7 18.7
28.38 ±0.10 PRD-1 2.9E+09 1.5E+09 9.3E+07 4.6E+07 3.5E+07 1.9E+04
Soil moisture
20.85% 19.48% 15.35% 12.60% 12.72% 4.22%
Days 0.0 1.8 4.8 7.8 11.8 14.8
34.57 ±0.47 PRD-1 5.0E+09 5.9E+08 1.6E+08 6.7E+07 3.8E+06 5.8E±03
Soil moisture
21.33% 18.32% 16.27% 13.47% 7.41% 4.65%
Days 0.0 1.8 4.8 7.8 11.8 14.8
38.38 ±0.42 PRD-1 5.0E+09 8.7E+08 2.8E+08 5.7E+07 7.9E+03 5.1E+00
Soil moisture
21.33% 18.57% 13.18% 11.17% 3.45% 1.71%
* Unit: pfti/g dry soil

I l l
Table D - 3. The selection of a set of the model variables using the "Best Subset Regression option" in MINITAB (T: Temperature (°C), 0: Volumetric soil moisture (%))• 1. Using the data without 5.1 % soil moisture treatment
Best Subsets Regression: kd(l/days) versus T, T^, T^, 0, 0^, 0^
Vars R-Sq R-Sq(adj) C-p S T J2 T3 0 0^ 0^ 1 49.6 48.0 185.1 0.030863 X 1 49.5 47.8 185.8 0.030909 X 2 93.1 92.6 3.3 0.011636 X X 2 92.6 92.1 5.4 0.012050 X X 3 93.6 92.9 3.1 0.011392 X X X 3 93.5 92.7 3.7 0.011521 X X X 4 94.0 93.1 3.6 0.011266 X X X X 4 93.9 93.0 3.8 0.011309 X X X X 5 94.1 92.9 5.0 0.011361 X X X X X 5 94.0 92.9 5.3 0.011416 X X X X X
2. Using the data including 5.1 % soil moisture treatment
Best Subsets Regression: kd(l/days) versus T, T^, T^, 0, 0^, 0^
Vars R-Sq R-Sq(adj) C-p S T j2 T3 0 0^ 0^ 1 47.5 46.2 103.8 0.039370 X 1 46.7 45.3 106.0 0.039677 X 2 53.7 51.2 89.4 0.037493 X X 2 52.7 50.1 92.2 0.037907 X X 3 71.6 69.2 43.7 0.029775 X X X 3 71.1 68.7 44.9 0.030004 X X X 4 87.4 85.9 3.6 0.020127 X X X X 4 86.5 85.0 5.9 0.020782 X X X X 5 87.5 85.7 5.3 0.020327 X X X X X 5 87.4 85.6 5.5 0.020385 X X X X X 6 87.6 85.4 7.0 0.020529 X X X X X X
* Number of regression variables ** The underlined sets in bold are selected for the model regressions. These sets show high R^ values, reasonable variable numbers (C-p value is close to the number of regressors), and small standard deviations.

112
Table D - 4. The results of the model regressions to predict PRD-1 survival in the soil (kd:
inactivation rate (1/days), T: Temperature (°C), 0: Volumetric soil moisture (%)).
Model; =-0.102+0.0037"+ 0.6160
Predictor Coef SE Coef T P Constant -0.102154 0.008743 -11.68 0.000 T 0.003233 0.000208 15.54 0.000 SM 0.616170 0.045590 13.52 0.000
8 = 0.01164 R-Sq = 93.1% R-Sq(adj) = 92.6% PRESS = 0.004913 R-Sq(pred) = 91.34%
Analysis of Variance
Source DF SS MS F P Regression 2 0.052814 0.026407 195.03 0.000 Residual Error 29 0.003927 0.000135 Total 31 0.056741
Model: = 0.390 +0.003T-10.848© + 83.0000' -183.400©'
Predictor Coef SE Coef T P Constant 0.39032 0.04951 7.88 0.000
T 0.00348 0.00033 10.12 0.000
0 -10.84800 1.37600 -7.88 0.000
0' 83.00000 11.67000 7.11 0.000
0' -189.40000 29.93000 -6.33 0.000
S = 0.02078 R-Sq = 86.5 % R-Sq(adj) = 85.0 % PRESS = 0.022303 R-Sq(pred) = 80.14 %
Analysis of Variance
Source DF SS MS F P Regression 4 0.097177 0.024294 56.25 0.000 Residual Error 35 0.015116 0.000432 Total 39 0.112293

1.E+10
(a) 20.9 %
1.E+09 ro "3 "S.
Q a:
1.E+08
.E+07
25 10 15 20 0 5 Days after inoculation
^9.3 °C -B—10.5 °C-6—17.5 °C-©—20.1 °C
^25.5 °C -x-28.4 °C —t—34.6 °C —38.4 °C
1.E+10 (b) 16.2 %
3 1.E+09
£1- 1.E+08
1.E+07
25 30 10 15 20 0 5
Days after inoculation
Figure D -1. Coliphage PRD-1 survival curves from the microcosm experiment (Soil moisture was controlled at 20.9,16.2,12.1, 8.9, and 5.1 %).
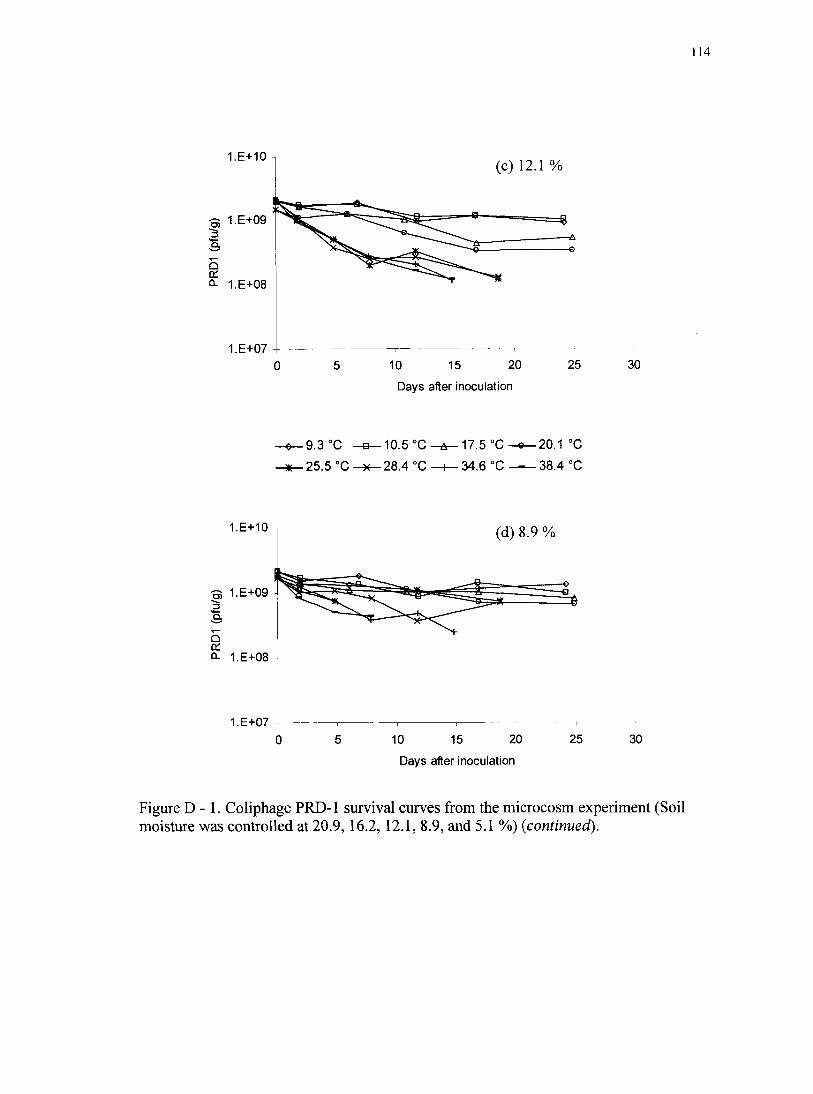
114
1.E+10 (c) 12.1 %
•3 1E+09
a.
Q- 1.E+08
1.E+07
20 25 10 5 15 0
Days after inoculation
^9.3 °C _B_10,5°C^5,-17.5°C-e—20.1 °C
^ 25.5 °C 28.4 °C —^ 34.6 °C 38.4 °C
1.E+10 (d) 8.9 %
3 1.E+09
Q- 1.E+08
1.E+07
20 25 10 15 0 5
Days after inoculation
Figure D - 1. Coliphage PRD-1 survival curves from the microcosm experiment (Soil moisture was controlled at 20.9,16.2,12.1, 8.9, and 5.1 %) {continued).
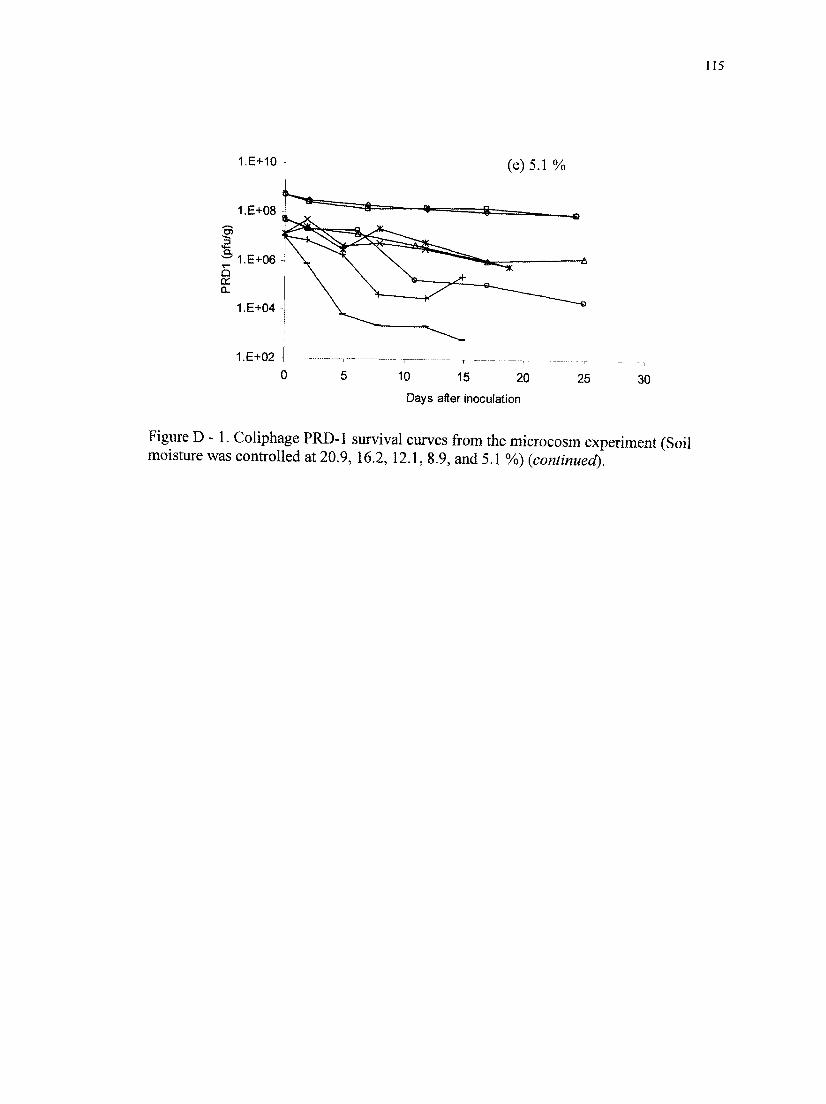
115
1.E+10 (e)5.1 %
1.E+08 ,
O) a Q.
1.E+06 J 5 tr Q.
1.E+04
1.E+02
0 5 10 15
Days after inoculation
Figure D -1. Coliphage PRD-1 survival curves from the microcosm experiment (Soil moisture was controlled at 20.9, 16.2,12.1, 8.9, and 5.1 %) (continued).

116
REFERENCES
Absar, A., Enriquez, C. E., Oron, G., and C. P. Gerba. 2000. Control of viral contamination of reclaimed irrigated vegetables by drip irrigation. Water reuse 2000, San Antonio, Tex.
Adamsen, F. J. 1992. Irrigation method and water quality effects on corn yield in the Mid-Atlantic Coastal Plain. Agron. J. 84(5): 837-843.
Allwood, P. B., Y. S. Malik, C. W. Hedberg, and S. M. Goyal. 2003. Survival of F-Specific RNA Coliphage, Feline Calicivirus, and Escherichia coli in Water: a Comparative Study. Applied and Environmental Microbiology. Vol. 69(9): 5707-5710.
Alum, A., C. E. Enriquez, G. Oron, and Gerba, C. P. 2000. Control of viral contamination of reclaimed irrigated vegetables by drip irrigation. J. Am. Wat. Wks Assoc. San Antonio, TX, Water use conference.
Arar, A. 1989. The future role of the use of sewage effluent for irrigation in the near east. Reuse of low quality water for irrigation. Bari: CIHEAM-IAMB: 59-72.
Armon, R. and P. Payment. 1988. A modified mCP medium for enumeration of Clostridiumperfringens from water supplies. Canad. J. Microbiol. 34: 78-79.
ASAE Standards. 42th Ed. 1995. EP458. Field evaluation of microirrigation systems. St. Joseph, Mich.: ASAE.
Ayers, R. S., and D. W. Westcot. 1985. Water quality for agriculture. FAO irrigation and drainage paper 29.
Bagdasaryan, G. A. 1964. Suvival of viruses of the enterovirus group (poliomyelitis, echo, coxackie) in soil and on vegetables. J. Hyg. Epidemiol. Microbiol. Immunol. Vol. 8: 497-505.
Bitton, G., 1980. Introduction to environmental virology, John Wiley & Sons, New York.
Bralts, V F., and I. P. Wu. 1979. Emitter Flow Variation and Uniformity for Drip Irrigation. ASAE Paper No. 79-2099. ASAE, St. Joseph, ML: 34.

117
Bucks, D. A., L. J. Erie, O. F. French, F. S. Nakayama, and W. D. Pew. 1981. Subsurface trickle irrigation management with multiple cropping. Transactions of the ASAE: 1482-1489.
Caldwell, D. S., W. E. Spurgeon, and H. L. Manges. 1994. Frequency of irrigation for subsurface drip-irrigated com. Transactions of the ASAE 37(4): 1099-1103.
Camp, C. R. 1998. Subsurface drip irrigation: a review. Transactions of the ASAE 41(5): 1353-1367.
Camp, C. R., E. J. Sadler, and W. J. Busscher. 1989. Subsurface and alternate-middle micro irrigation for the southeastern Coastal Plain. Transactions of the ASAE 32(2): 451-456.
Camp, C. R., F. R. Lamm, R. G. Evans, and C. J. Phene. 2000. Subsurface drip irrigation-past, present, and future. National Irrigation Symposium. Proceedings of the 4th Decermial Symposium. Pheonix, Arizona.: 363-372.
Camp, C. R., J. T. Garrett, E. J. Sadler, and W. J. Busscher. 1993. Microirrigation management for double-cropped vegetables in a humid area. Transactions of the ASAE 36(6): 1639-1644.
Carr, T. G., R. L. Edmond, and H. D. Galusha. 1990. Soil and water quality considerations affecting irrigation water duties in central Arizona. Proc. of the 3rd Nat. Irrigation Sym. Oct 28th, Phoenix AZ.
Choi, C. Y., and E. M. Suarez-Rey. 2004. Subsurface drip irrigation for Bermudagrass with reclaimed water. Transactions of the ASAE Vol. 47(6): 1-9.
Choi, C. Y., and I. Song, S. W. Stine, J. Pimentel, and C. P. Gerba. 2004. Role of irrigation and wastewater reuse: Comparison of subsurface drip irrigation with furrow irrigation. Water Science and Technology Vol. 50(2): 61-68.
Christiansen, J. E. 1942. Irrigation by Sprinkling. Bull. 670, Agricultural Exp. Station, University of California, Berkley.
Copeland, S. 1989. Soil Water Potential as Related to the Crop Water Stress Index of Irrigated Cotton. MS Thesis, the University of Arizona, Tucson, AZ.

118
Corradini, M. G. and M. Peleg. 2003. A model of microbial survival curves in water treated with a volatile disinfectant. Journal of Applied Microbiology. Vol. 95: 1268-1276.
Davies, C. M., J. A. H. Long, M. Donald, and N. J. Ashbolt. 1995. Survival of Fecal Microorganisms in Marine and Freshwater Sediments. Applied and Environmental Microbiology Vol. 61(5): 1888-1896.
Davies-Colley, R. J., A. M. Donnison, D. J. Speed, C. M. Ross, and J. W. Nagels. 1999. Inactivation of faecal indicator microorganisms in waste stabilization ponds: interactions of environmental factors with sunlightWater Reaserch, Vol. 33(5): 1220-1230.
Dawood, S. A., and S. N. Hamad. 1985. A comparison of on-farm irrigation systems performance. Proceedings of the Third International Drip/Trickle Irrigation Congress. California, 18-21 November 1985.
DeTar, W. R., C. J. Phene, and D. A. Clark. 1994. Subsurface drip vs furrow irrigation: 4 years of continuous cotton on sandy soil. In Beltwide Cotton Conf, Memphis, Term.: Nat. Cotton Council.: 542-545.
DeTar, W. R., G. T. Browne, C. J. Phene, and B. L. Sanden. 1996. Real-time irrigation scheduling of potatoes with sprinkler and subsurface drip systems. In Proc. IntT. Conf. on Evapotranspiration and Irrigation Scheduling: pp 812-824. St. Joseph, Mich.: ASAE.
Dura'n, A. E., M. Muniesa, X. Me'ndez, F. Valerol, F. Lucena, and J. Jofre. 2002. Removal and inactivation of indicator bacteriophages in fresh waters. Journal of Applied Microbiology. Vol. 92: 338-347.
El-Gindy, A. M., and A. M. El-Araby. 1996. Vegetable crop response to surface and subsurface drip under calcareous soil. In Proc. Int'l. Conf. on Evapotranspiration and Irrigation Scheduling, eds. C. R. Camp, E. J. Sadler, and R. E. Yoder, St. Joseph, Mich.: ASAE.: 1021-1028.
Enriquez, C., A. Alum, E. Suarez-Rey, C. Y. Choi, and C. P. Gerba. 2003. Survival of bacteriophages MS-2 and PRD-1 in turfgrass irrigated by subsurface drip irrigation. ASCE J. Environ. Eng. (in press).
119
Fancis, B. J., J. V. Altamirano, and M. G. Stobierski. 1991. Multi-state outbreak of Salmonella poona infections-United States and Canada. Morbid. Mortal. Weekly Rep. 40: 549-552.
Feachem, R. G., D. J. Bradley, H. Garelick and D. D. Mara, 1983, Sanitation and disease: Health aspects of excreta and wastewater management, John Willey, Chichester.
Fitz-Rodriguez, E., and C. Y. Choi. 2002. Monitoring turfgrss quality using multispectral radiometry. Trans. ASAE 45(3): pp 865-871
Gerba, C. P. 2000. Indicator microorganisms. In R. M. M. 1. L. Pepper, and C. P. Gerba (ed.). Environmental microbiology. Academic Press, San Diego, CA.
Gerba, C. P., and G. E. Schaiberger. 1975. Effect of particulates on virus survival in seawater. J. Water Pollut. Control Fed. 47: 93.
Gerba, C. P., C. Wallis, and J. L. Melnick. 1975. Fate of wastewater bacteria and viruses in soil. J. Irri. and Drain. Div. ASCE. Vol. 101: 157-174.
Governal, R. A. and C. P. Gerba. 1997. Persistence of MS-2 and PRD-1 bacteriophages in an ultra-pure water system. J. Industrial Microbiol. Biotechn. 18: 297-301.
Grant, S. B. 1995. Inactivation kinetics of viral aggregates. Journal of Environmental Engineering. Vol. 121(4): 311-319.
Guerra, L. C., S. I. Bhuiyan, T. P. Tuong, and R. Barker. 1998. Producing more rice with less water. SWIM Paper 5. Colombo, Sri Lanka: International Water Management Institute.
Haas, C. N., J. B. Rose, and C. P. Gerba. 1999. Quantitative Microbial Risk Assessment. John Wiley & Sons, Inc., New York, New York.
Haruvy, N., 1997. Agricultural reuse of wastewater: nation-wide cost-benefit analysis. Agriculture, Ecosystems and Environment. 66: 113-119.
Havelaar, A. H., M. VAN Olphen, and Y. C. Drostl993F-specific RNA bacteriophages are adequate model organisms for enteric viruses in fresh waterApplied and Enviromental Microbiology, Sept.: 2956-2962.
120
Hillel, D. 1997. Small-scale irrigation for arid zones: principles and options. Development Monograph No. 2. United Nations and Good and Agriculture Organization, Rome.
Hillel, D. 1998. Environmental soil physics: water-use efficiency and water conservation. Academic press, chapter 21: 617-651.
Howell, T. A., and E. A. Hiler. 1974. Trickle irrigation lateral design. Transactions of the ASAE 17(5): 902-908.
Hurst, C. J., C. P. Gerba, and I. Cech. 1980. Effects of envirormiental variables and soil characteristics on virus survival in soil. Appl. Environ. Microbiol.. 40(6): 1067-1079.
lAWPRC Study Group on Health Related Water Microbiology. 1991. Bacteriophages as model viruses in water quality control. Water Res. 25: 529-545.
Jensen, M. E. 1980. The role of irrigation in food and fiber production. In Design and operation of farm irrigation systems, ed. M. E. Jensen. Michigan: The American Society of Agricultural Engineers: 15-41.
Kibbey, H. J., C. Hagedom, and E. L. McCoy. 1978. Use of fecal Streptococci as indicators of pollution in soil. Applied and Environmental Microbiology: 711-717.
Maier, R. M., 1. L. Pepper, and C. P. Gerba. 1999. Environmental microbiology: microbial transport (Ch 7). Academic Press.
Mbithi, J. N., V. S. Springthorpe, and S. A. Satter. 1991. Effect of relative humidity and air temperature on survival of hepatitis A virus on environmental surfaces. Appl. Envrion. Microbiol. Vol. 57(5): 1394-1399.
Mead, P. S., L. Slutsker, V. Dietz, L. F. McCaig, J. S. Bressee, C. Shapiro, P. M. Griffin, and R. V. Tauxe. 1999. Food-related illness and death in the United States. Emerg. Infect. Dis. Vol. 5: 607-625.
Mitchell, W. H. 1981. Subsurface irrigation and fertilization of field com. Agron. J. 73(6): 913-916.

121
Moce'-Llivina, L., M. Muniesa, H. Pimenta-Vale, F. Lucena, and J. Jofre. 2003. Survival of Bacterial Indicator Species and Bacteriophages after Thermal Treatment of Sludge and Sewage. Applied and Environmental Microbiology. 69(3): 1452-1456.
Mohle-Boetani, J. C., R. Reporter, and S. B. Werner. 1999. An outbreak of Salmonella serogroup Saphra due to cantaloupe from Mexico. J. Infect. Dis. 180: 1361-1364.
Molden, D. 1997. Accounting for water use and productivity. SWIM Paper 1. Colombo (Sri Lanka): International Irrigation Management Institute.
Oron, G., J. DeMalach, Z. Hoffman, and R. Cibotaru. 1991. Subsurface microirrigation with effluent. J. Irrig. Drain. Engng. 117(1): 25-36.
Oron, G., M. Geomans, Y. Manor, and J. Feyen. 1995. Poliovirus distribution in the soil-plant system under reuse of secondary wastewater, Water Research 29(4): 1069-1078.
Oron, G., Y. DeMalach, and Z. Hoffman. 1992. Effect of effluent quality and application method on agricultural productivity and environmental control. Wat. Sci. Tech. 26(7-8): 1593-1601.
Payment, P., and E. Franco. 1993. Clostridium perfringens and somatic coliphages as indicators of the efficiency of water treatment for viruses and protozoan cysts. Applied and Environmental Microbiology Vol. 59: 2418-2424.
Peleg, M., and M. B. Cole. 1998. Reinterpretation of microbial survival curves. Critical reviews in Food Science, 38 (5): 353-380.
Pescod, M. B. 1989. Health and environmental aspects of wastewater reuse. Reuse of low quality water for irrigation. Bari: CIHEAM-IAMB. 191-204.
Phene, C. J., and R. Ruskin. 1995. Potential of subsurface drip irrigation for management of nitrate in wastewater. In Proc. 5th Int'l. Microirrigation Congress, ed. F. R. Lamm, St. Joseph, Mich.: ASAE. 155-167.
Phene, C. J., W. R. DeTar, and D. A. Clark. 1992. Real-time irrigation scheduling of cotton with an automated pan evaporation system. Applied Engineering in Agriculture. 8(6): 787-793.

122
Pitts, D. J., D. Z. Hainan, and A. G. SMAJSTLA. 1990. Causes and prevention of emitter plugging in microirrigation systems. Gainesville: Florida Cooperative Extension Service, University of Florida, Bulletin 258.
Rose, J. B., and C. P. Gerba, 1991, Use of risk assessment for development of microbial standards. Water Sci. Techno. 24: 29-34.
Rubin, A., T. Greene, and A. Jantrania. 1994. Performance evaluation of drip disposal system for residential treatment. In Proc. of the Seventh Symp. on Individual and Small Community Sewage Systems, ed. E. Collins, 467^74. St. Joseph, Mich.: ASAE.
Rusin, P., S. Meixwell, and C. P. Gerba. 2002. Comparative surface-to-hand and fmgertip-to-mouth transfer efficiency of gram-positive bacteria, gram-negative bacteria, and phage. Journal of Applied Microbiology. 93: 585-592.
Ruskin, R. 1993. Subsurface drip irrigation can reduce pollution. In Management of Irrig. and Drainage Systems Integrated Perspectives, ed. R. G. Allen. 731-738. New York: ASCE.
Ruskin, R. 1992. Reclaimed water and subsurface irrigation. ASAE Paper No. 92-2578. St. Joseph, Mich.: ASAE.
Sadler, E.J., C.R. Camp, and W.J. Busscher. 1995. Emitter flow rate changes caused by excavating subsurface microirrigation tubing. Proceedings of the Fifth International Microirrigation Congress, 2-6 April 1995, Orlando, FL. ASAE, St. Joseph, MI. 763-768.
Sammis, T. W. 1980. Comparison of sprinkler, trickle, subsurface, and furrow irrigation methods for row crops. Agronomy Journal. Vol. 72(5): 701-704.
Schijven, J. F., and S. M. Hassanizadeh. 2000. Removal of viruses by soil passage: Overview of modeling, processes, and parameters. Critical Reviews in Environmental science and Technology. 30(1): 49-127.
Schneider, A. D., and T. A. Howell. 2001 Comparison of SDI, LEPA, and spray irrigation efficiency. ASAE Paper No. 012019. St. Joseph, Mich.: ASAE.
Seymour, I. J., and H. Appleton. 2001. A review: Foodbome viruses and fresh produce. J. of Applied Microbiology 91: 759-773.
123
Shideed, K., T. Oweis, and M. E. Osman. 2003. Enhancing agricuhural productivity through on-farm water-use efficiency: an empirical case study of wheat production in Iraq. United Nations, New York, 2003.
Shrivastava, P. K., M. M. Parikh, N. G. Wawani, and S. Raman. 1994. Effect of drip irrigation on tomato yield. Agricultural Water Management 25(2): 179-184.
Shuval, H. I. 1991. Heath guidelines and standards for wastewater reuse in agriculture: Historical perspectives. Water Science Technology. 23: 2073 - 2080.
Shuval, H., Y. Lampert, and B. Fattal. 1997. Development of a risk assessment approach for evaluating wastewater reuse standards for agriculture. Water Science and Technology. Vol. 35(11): 15-20.
Sinton, L. W., C. H. Hall, P. A. Lynch, and R. J. Davies-Colley. 2002. Sunlight inactivation of fecal indicator bateria and bacteriophages from waste stabilization pond effluent in fresh and saline waters. Appl. Environ. Microbiol. 68(3): 1122-1131.
Sinton, L. W., R. J. Davies-Colley, and R. G. Bell. 1994. Inactivation of Enterococci and fecal coliforms from sewage and meatworks effluents in seawater chambers. Appl. Environ. Microbiol. 60(6): 2040-2048.
Solomon, K. H., and G. Jorgensen. 1992. Subsurface drip irrigation. Grounds Maintenance 27(10): 24-26.
Stine, W. S. 2004. Survival of enteric pathogens on the surface of fresh produce and intake of heterotrophic bacteria in the United States. Ph D Dissertation, the University of Arizona.
Stine, W. S., I. Song, C. Y. Choi, and C. P. Gerba. 2004. Application of microbial risk assessment to the development of standards for enteric pathogens in irrigation water. J. of Food Prot. (submitted).
Straub, T. M., I. L. Pepper, and C. P. Gerba. 1992. Persistence of viruses in desert soils amended with anaerobically digested sewage sludge. Appl. Envrion. Microbiol.. 58(2): 636-641.
Suarez-Rey, E., C. Y. Choi, P. M. Waller, and D. M. Kopec. 2000. Comparison of subsurface drip irrigation and sprinkler irrigation for bermudagrass turf in Arizona. Trans. ASAE 43(3): 631-640.

124
Suttles, J. B. 1998. Crop water requirements of field corn under furrow and subsurface drip irrigations systems in arid zone soils. M. S. Thesis, Dept. of Agricultural and Biosystems Engineering, University of Arizona, Tucson, Az.
Tabbal, D.F., R. M. Lampayan, and S. 1. Bhuiyan 1992. Water-efficient irrigation technique for rice. In Soil and water engineering for paddy field management, ed. V. V. N. Murty, and K. Koga. Proceedings of the International Workshop on Soil and Water Engineering for Paddy Field Management, 28-30 January, Asian Institute of Technology, Bangkok, Thailand. 146-159.
Tajrishy, M., D. J. Hills, and G. Tchobanoglous. 1994. Pretreatment of secondary effluent for drip irrigation. J. of Irrig. And Drainage Division, ASCE 120(4): 716-731.
Tauxe, R. V. (1997). Emerging foodbome diseases; an evolving public health challenge. Emerg. Infect. Dis. 3(4): 425-434.
Theunissen, H. J. H., N. A. L. Doom, A. Burggaraaf, E. Stolz, and M F. Michel. 1993. Influence of temperature and relative humidity on the survival of Chlamydia pneumoniae in aerosols.
Thompson, S. S., and M. R. Yates. 1999. Bacteriophage inactivation at the air-water-solid interface in dynamic batch systems. Appl. Envrion. Microbiol. 65(3): 1186-1190.
Thompson, S. S., M. Flury, and M. V. Yates. 1998. Role of the air-water-solid interface in bacteriophage sorption experiments. Appl. Environ. Microbiol. 64(1): 304-309.
Tuong, T.P., and S. I. Bhuiyan. 1994. Innovations toward improving after-use efficiency of rice. Paper presented at the World Water Resources Seminar, 13-15 December. Lansdovme Conference Resort, Virginia, USA.
USDA-NASS. 2004. Agricultural statistics.
USEPA/USDA. 1992. Guidelines for water reuse. Washington, DC, Environmental Protection Agency, Office of Wastewater Enforcement and Compliance, Technical report No. EPA/625/R-92/004.
Viets, F. G. 1962. Fertilizer and efficient use of water. Adv. Agron. 14: 223-264.
Warrick, A. W., and U. Shani. 1996. Soil-limiting flow from subsurface emitters. II. Effect on uniformity. J. Irrig. Drain. Eng. 122(5): 296-300.
125
WHO, 1989a. Guidelines for the safe use of wastewater and excreta in agriculture and aquaculture: Measures for public health protection. Executive Summary.
WHO, 1989b. Health guidelines for the use of wastewater in agriculture and aquaculture. Report of a WHO Scientific Group. Geneva, World Health Organization, WHO Technical Report Series, No. 778.
WHO. 2000. Guidelines for the microbiological quality of treated wastewater used in agriculture: recommendations for revising WHO guidelines. Bulletin of the World Health Organization, 2000, 78 (9).
Wilcox, J. C., and G. E. Swailes. 1947. Uniformity of Water Distribution by Some Undertree Orchard Sprinklers - Scientific Agriculture, 27 (11).
Welters, W., and M. G. Bos. 1989. Irrigation Performance Assessment and Irrigation Efficiency. ILRI Annual Report, pp. 25-37.
Wu, I. P., and H. M. Gitlin. 1974. Drip irrigation design based on uniformity. Transactions of the ASAE 17(3): 157-168.
Wu, I. P., and J. Barragan. 2000. Design criteria for microirrigation systems. Transactions of the ASAE Vol. 43(5): 1145-1154.
Yahya, M. T., L. Galsomies, C. P. Gerba, and R. C. Bales. 1993. Survival of bacteriophaes MS-2 and PRD-1 in ground water. Wat. Sci. Tech. 27(3-4): 409-412.
Yates, M. V., and S. R. Yates. 1988. Modeling microbial fate in the subsurface environment. CRC Critical Reviews in Environmental Control. 17(4): 307-344.
Yates, M. V., S. R. Yates, J. Wagner, and C. P. Gerba. 1987. Modeling virus survival and transport in the subsurface, J. of Contaminant hydrology. Vol. 1: 329-345.
Yeager, J. G., and R. L. Ward. 1981. Effects of moisture content on long-term survival and regrowth of bacteria in wastewater sludge. Applied and Environmental Microbiology. 1117-1122.

126
Yeager, J. G., and R. T. O'Brien. 1979. Enterovirus inactivation in soil. Appl. Environ. Microbiol. 38(4): 694-701.
Zimmer, A. L., M. J. McFarland, and J. Moore. 1988. Upward free water movement from buried trickle emitters. ASAE Paper No. 88-2063. St. Joseph, Mich.: ASAE.