Embed Size (px)
Citation preview

Are we connected? Assessing bicycle network performance through directness 1
and connectivity measures, a Montreal, Canada case study 2 3 4 5
Geneviève Boisjoly 6 School of Urban Planning 7 McGill University* 8 E-mail: [email protected] 9 10 Ahmed El-Geneidy 11 School of Urban Planning 12 McGill University* 13 E-mail: [email protected] 14 15 16 * McGill University 17 Suite 400, 815 Sherbrooke St. W. 18 Montréal, Québec, H3A 2K6 19 Canada 20 Tel.: 514-398-8741 21 Fax: 514-398-8376 22
23 Word count: 5,946 words text + 6 tables/figures x 250 words (each) = 7,446 words 24
25 26 27 28 29 30
August 1, 2015 31 32
Paper Prepared for Presentation at the Transportation Research Board 95th Annual Meeting 33 Washington, D.C., January 10-14, 2016. 34
35 For citation please use: *Boisjoly, G. & El-Geneidy, A. (2016). Are we connected? Assessing bicycle 36 network performance through directness and connectivity measures, a Montreal, Canada case study. 37 Paper to be presented at the 95th Annual Meeting of the Transportation Research Board, Washington 38 D.C., USA. 39
40
Boisjoly & El-Geneidy 2 ABSTRACT 1 Over the last two decades, cycling has seen a rise in popularity in North American cities, which are 2 continuously expanding their bicycle networks. While studies highlight that a good network should provide 3 direct bicycle routes for cyclists to reach their desired destination, most network assessments measure the 4 length of bicycle facilities or street connectivity. Building on a set of complementary indicators to account 5 for directness of bicycle facilities, this study assesses the performance of the bicycle network in Montreal, 6 Canada. The study uses data from two large-scale online surveys (2,917 and 2,644 respondents) conducted 7 Summer 2009 and 2013. Actual home to work/school routes are generated using bicycle facilities and the 8 street network based on three different cycling route preferences. Diversion and proportion of route on 9 bicycle facilities are calculated to assess directness of bicycle routes. Based on these two indicators, 10 connectivity is measured. The Montreal network did show a low level of connectivity of less than 51% on 11 every level of preference. Areas with low levels of connectivities were then highlighted spatially. Finally, 12 using circuity measures, results showed that the extent to which existing transportation network favors 13 driving with a circuity of 1.22 for home to work trips compared to 1.33 for trips made by bicycle. Using a 14 simple set of performance measures, this study highlights the need to incorporate bicycle network 15 connectivity objectives into transportation plans to improve the efficiency of the network and hence 16 promote bicycle use. Cities wishing to promote bicycle use can use these measures to better evaluate their 17 bicycle network connectivity through a metrics of network efficacy reflecing cyclists’ trade-off when 18 prioritizing the construction of bicycle routes. 19 20 21 Keywords: Biycle network efficiency, Connectivity, Directness, Cycling routes, Mode share 22

Boisjoly & El-Geneidy 3 INTRODUCTION 1 Over the last two decades, cycling has seen a rise in popularity in North American cities in term of use, 2 funding, and policies (1). Research shows that the supply of bicycle facilities generally provides a positive 3 experience for cyclists and is related to higher cycling levels and mode shares (2-5). Accordingly, cities in 4 North America are focused on expanding and improving their bicycle networks (1) to offer an alternative 5 to motorized commuting modes. While the length or density of bicycle facilities is used in most studies and 6 planning documents to assess a city’s network (6-8), these metric indicate little about the efficiency of the 7 network for commuting. An efficient bicycle network should allow cyclists to reach their desired 8 destinations using bicycle-friendly routes without undue detours (4; 9; 10). A lengthy network around a 9 lake or a river can be of great value for recreational purpose but be impractical for commuting. Inversely, a 10 straight route along busy boulevards can provide fast and direct connections, but raise concerns regarding 11 safety and comfort. As there is a trade-off between route directness and quality of route, multiple indicators 12 have to be addressed to assess general bicycle network performance. However, very few quantitative 13 indicators addressing the general network performance, other than length, have been adopted (6; 9). 14
The current study proposes a set of complementary indicators to assess the general performance 15 of bicycle networks. Three indicators were selected, accounting for route directness and presence of bicycle 16 facilities. The first one measures bicycle route diversion compared to the shortest street network distance 17 including short cuts. The second indicator takes into account the presence of bicycle route, measuring the 18 proportion of the trip along bicycle facilities. While the third indicator depends on the directness using 19 circuity, the ratio between network and airline distances (11) to compare the directness across modes (car 20 vs bicycle networks). Building on these three complmentary indicators and on previous work (10), network 21 connectivity is assessed. These three indicators were selected as they reflect cyclists’ route choice 22 preferences and are easy to communicate and interpret. 23
Using these indicators, this paper asseses the performance of the bicycle network on the Island of 24 Montreal, Canada. The study uses data from two large-scale online cycling behavior surveys conducted 25 during the Summers of 2009 (12) and 2013 (4). The 2009 survey provides detailed information on actual 26 bicycle trips including detailed route information, while the 2013 survey provides actual home and 27 work/school locations of cyclists in 2013 in addition to a series of detailed questions about home location 28 choices and travel preference. Although the area of study is the Island of Montreal, this research provides 29 methodological insight on how to assess the general performance of cycling networks in addition to their 30 size, using available data and resources. This methodology can benefit transport engineers and planners 31 around the world as they try to promote bicycle adoption for commuting through the increase in new bicycle 32 facilities. 33 34 LITERATURE REVIEW 35 36 What Makes a Good Bicycle Route? 37
Bicycle commuting is positively related to the provision of off-street paths and on-street lanes, as 38 they provide more positive travelling experiences for cyclists (3; 13). Cyclists are sensitive to the 39 characteristics of the path they use. Altogether, studies report that the presence of bicycle lanes, the low 40 volume of motorized traffic and the suitability and safety of bicycle route are major attribute of an attractive 41 bicycle network (4; 5; 14; 15). Furthermore, cyclists value route directness, high travel speed (4; 14), low 42 travel time (5; 15; 16) and continuous bicycle infrastructure (5). 43
Since cyclists value direct connections and suitable routes, numerous studies have looked into 44 how cyclists balance these two criteria when choosing a route. Hunt & Abraham’s (16) analyzed stated 45 preference regarding bicycle routes and found that time spent in mixed traffic is 2.7 or 4.1 more costly to 46 cyclists than time spent on bicycle paths or bicycle lanes, respectively. Accordingly, cyclists are willing to 47 make detours to use bicycle facilities. In a study in Montreal, Larsen & El-Geneidy (12) found that 48 respondents who used bicycle facilities added an average of 2.2 km to their trips in term of detours 49 compared to non-path users. Similarly, Tilahun et al. (17) reported that cyclists add up to 20 minutes to 50 their trips to use an off-road bicycle trail instead of using an on-road lane with side parking, this study 51 depended on a stated preference survey. Nevertheless, not all cyclists consider such detours, as segmented 52
Boisjoly & El-Geneidy 4 analyses reveal that route choices and stated preferences differ based on types of cyclists. For example, 1 Hunt & Abraham (16) report that cyclists with higher level of comfort and experience in mixed traffic give 2 lower cost value to time spent in mixed traffic. Broach et al. (15) found that commuting cyclists value trip 3 directness more than the presence of infrastuctures, while recreational cyclists are more likely to use bicycle 4 infrastructures (12). A large amount of literature also explores the influence of different types of bicycle 5 paths on cyclists (10; 12; 15). However, this is not the focus of the present study. 6 7 Network Performance Assessment 8
Although a lot of research has been conducted on bicycle route choice and cyclists preferences, 9 few measures have been developed to assess the general performance of cycling networks (9). Based on 10 preferences of cyclists, a good network should provide direct connections requiring minimal detours (9) 11 While most research on network efficiency has focused on transit and street networks (11; 18; 19), some 12 recent studies have developed efficiency measures for bicycle networks. In this regard, Schoner & Levinson 13 (9) measure directness and connectivity of bicycle networks of 74 American cities and find a positive 14 relation between directness of route and bicycle commuting. Connectivity is assessed through various 15 indices of ratios between the numbers of edges and vertices of bicycle facilities. In another vein, Mekuria 16 et al. (10) measure low-stress connectivity of bicycle networks in San José, California. The authors defined 17 low-stress connectivity as the ‘percent of trips connected’ using bicycle-friendly routes and without 18 excessive detours as an indicator of connectivity. 19
Regarding transit and street network, Levinson & El-Geneidy (11) measured car network circuity, 20 defined as the ratio of the shortest network distance divided by Euclidian distance, in 20 cities in the United 21 States. Their findings support that residents select their home location based on direct commuting routes. 22 Building on circuity measures, Lee & Choi (18) proposes another measure of directness for transit networks, 23 comparing the actual transit route to the shortest street network distance. Lee & Choi (19) compare transit 24 circuity and street network circuity in five Korean cities and find that transit ridership is strongly related to 25 the directness of the transit network. Cirrcuity in general is a good measure to asses the differences between 26 networks and their directness. 27
Given the mounting interest in improving cycling networks in North American cities, developing 28 accessible quantitative assessment methods is essential to provide planners and engineers with the necessary 29 tools to design and improve their network. The review of literature reveals that while multiple criteria need 30 to be accounted for when assessing bicycle network performance, very few general performance indicators 31 accounting for multiple factors. This study builds on network performance measures and bicycle route 32 choice literature to offer easy to communicate indicators that are adapted to bicycle networks. The indicators 33 are sensitive to cyclists’ preferences, as they incorporate the proportion of the route on bicycle facilities as 34 well as the route directness. They are also sensitive to local context as the connectivity thresholds are 35 obtained from actual cyslists route choices in Montreal. 36 37 38 STUDY CONTEXT 39 The area of study is the Island of Montreal, in Quebec, Canada, with a population of 1,988,243 residents 40 (20) and an area of 499.1 km2 (21). The agglomeration, an administrative entity encompassing the territory 41 of the Island of Montreal (Figure 1), includes the City of Montreal divided in 19 boroughs, and 13 42 independent municipalities. It is governed by the City of Montreal, with the participation of the independent 43 municipalities. 44
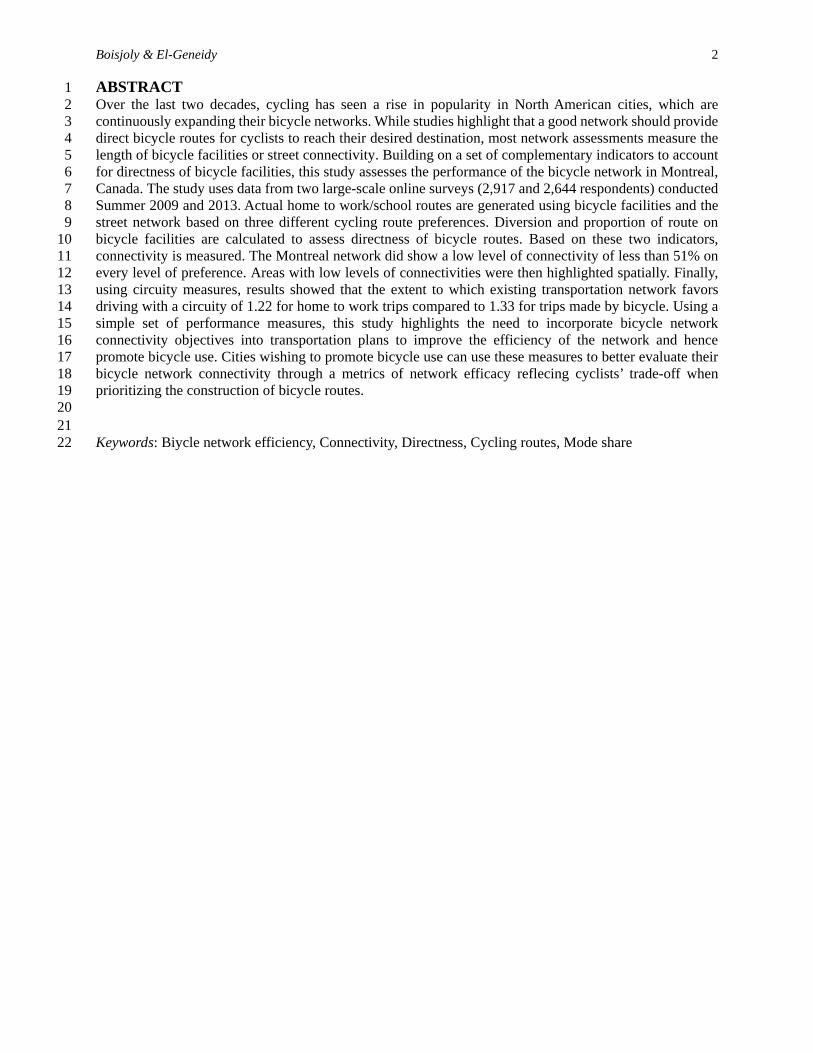
Montreal is generally presented as one of the best cycling cities in the world, and the best cycling 45 city in North America (22-24). In the last ten years, the Island of Montreal has experienced a rise in bicycle 46 popularity, namely with the introduction of the bicycle sharing system, BIXI, in 2009. The total length of 47 bicycle paths has increased continuously, from 400 km in 2009 to 602 in 2013 and 680 km in 2015 (7; 8). 48 Figure 1 illustrates the bicycle network on the Island of Montreal, with the majority of the infrastructure in 49 central Montreal, and one major biycle facility around the island. In 2010, the bicycle share of workers was 50 2.4% (1). 51
Boisjoly & El-Geneidy 5
1
FIGURE 1 Bicycle and Street Networks on the Island of Montreal 2
DATA AND METHODOLOGY 3 Route choice of cyclists in Montreal 4 Data collected in a previous survey in 2009 with 2,917 cyclists in Montreal provides information of actual 5 trips made by bicycle, both for cyclists using bicycle paths and for cyclists not using bicycle paths (12). 6 The survey was an online survey that was heavily advertised through social media, in the local newspapers, 7 and at major cycling events through distributing flyers about the survey to different cyclists. The origin, the 8 destination, as well as the locations where the cyclist got on and off the bicycle facility, if they used any, 9 were collected as part of the survey. The sample included 1,382 (70%) cyclists who used bicycle facilities 10 and 591 (30%) cyclists who did not use bicycle facilities in their daily commute to work or school. This 11 dataset allows calculating the distance each cyclist added to his or her trip in order to use a bicycle facility 12 and the proportion of the trip travelled along bicycle facilities. It thus provides average diversion, together 13 with proportion of trip on facilities, for cyclists who used bicycle paths. Obtaining these measures allows 14 benchmarking the connectivity measures, as will be discussed later. In order to provide performance 15 assessment based on cyclists’ actual behavior, the benchmarks should reflect an average cyclist’s behavior 16 regarding route choice. 17 18 Home and work/school locations 19 In order to assess the extent the bicycle network allows individuals to reach their desired destinations, actual 20 origin and destination locations must be used (10; 11). Accordingly, this study uses two sets of data 21 providing actual home-work/school locations. The first one is a survey conducted by the TRAM research 22 group with 2,644 cyclists in Montreal (4). This survey was conducted online in 2013 using similar 23 advertsing technique as the 2009 survey. Each respondent reported his home, work/school, and shopping 24 locations where they commute to by bicycle. Since the bicycle network evolves rapidly in Montreal, data 25 from 2013 are used as they correspond to the bicycle network that is assessed (2013 map). 26
The second set of data comes from the 2008 Origin-Destination Survey conducted by the Agence 27 métropolitaine de transport de Montréal (AMT). The dataset contains detailed information on respondents’ 28 trips including trip origin, trip destination, main transportation mode and purpose of the trips. The home 29 location of the respondent is also provided. From this database, trips made by bicycle and/or car, originating 30 at home and ending at work or school are selected. This dataset allows exploring route efficiency across 31

Boisjoly & El-Geneidy 6 transportation modes. 1 2 Bicycle Facility-Prioritized Network 3 A first network is generated using a map of the bicycle facilities in Montreal from Summer 2013, obtained 4 through the open data website of the City of Montreal (25). Since most of the cyclists using bicycle facilities 5 do a part of their trip on the street network, it is necessary to generate a network that allows portions of 6 routes to be on streets that are available to cyclists (excluding highways) and other portions to be along the 7 existing facilities. 8
Accordingly, a second network is created, combining bicycle facilities (25) and streets that are 9 available to cyclists (26). Using ArcGIS network analyst, a level of preference can be assigned for bicycle 10 facilities, which sets a lower cost coefficient for bicycle facilities (compared to streets) when calculating 11 the shortest route. In order to account for various cyclists’ preferences for cycling facilities (10; 12), three 12 different levels of preference are assigned (low, medium, high) using the following coefficients: 0.2, 0.5 13 and 0.8. A coefficient of 0.5 means that streets are two-times more costly than bicycle facilities in terms of 14 length. In other word, a bicycle facility of 1 km counts as 0.5 km. 15
16 Performance assessment 17 Using each level of preference, routes are generated for each pair of home-work/school locations from the 18 2013 cycling survey. Using the generated routes, two performance indicators (diversion and percentage of 19 route along a path) are calculated for each level of preference. Diversion, commonly used in the literature 20 (10; 19), is calculated by dividing the detour travelled (shortest route subtracted from actual route) by the 21 shortest route. The proportion of the route along bicycle facilities is calculated through GIS network 22 software, intersecting the actual route with the bicycle network. Once these two indicators are obtained for 23 each route, a normalized value is calculated for each, in order to allow comparative measures. 24 Since there is a tradeoff between proportion of route on bicycle facilities and diversion, it is 25 necessary to assess these two indicators simultaneously. A measure of connectivity is generated, as it allows 26 incorporating multiple criteria and is easy to interpret. Based on previous work (10), connectivity is defined 27 as the number of routes that are connected (as a percentage of the total number of routes) respecting specific 28 criteria. In our case, connectivity is based on route diversion and proportion of route on bicycle facilities. 29 Put simply, routes that travel a minimal proportion along facilities without exceeding a maximal detour are 30 considered connected. The maximal threshold for diversion and the minimal threshold for proportion of 31 route along facilities are set based on Montreal cyclists’ average preferences, obtained through the 2009 32 survey data. Accordingly, connectivity allows measuring the proportion of people that have direct bicycle 33 facilities to reach work or school, taking into account local preferences. Nevertheless, depending on the 34 planning or research objectives, different thresholds can be specified. 35
Finally, spatial analysis is conducted to assess performance disparities across the boroughs on the 36 Island oof Montreal. Routes are assigned to the boroughs, based on home locations. Hence, a route departing 37 in borough 1 and ending in borough 2 will be assigned to borough 1. Out of 34 boroughs/municipalities, 24 38 are included in the analysis, as ten were excluded beause they had fewer than two routes beginning in them. 39 For simplicity reasons, we present the results for only one preference level. For each borough, the average 40 dispersion and proportion on bicycle facilities is calculated. Additionally, the connectivity is calculated for 41 each borough using the same thresholds as above. 42 43 Network performance and mode 44 Latsly, using the 2008 Origin-Destination survey, circuity measures are provided as they allow efficiency 45 comparisons of different networks, in our case, the street network (for trips and made by car) and the bicycle 46 and street network with preference (for trips made by bicycle). Such comparisons is important as it shows 47 to what extent cycling network is underserving cyclists and imposing more travel on them compared to car 48 dirvers. 49 50 Limitations 51 Given the data available, some limitations must be considered. First, driving directions of the streets and 52

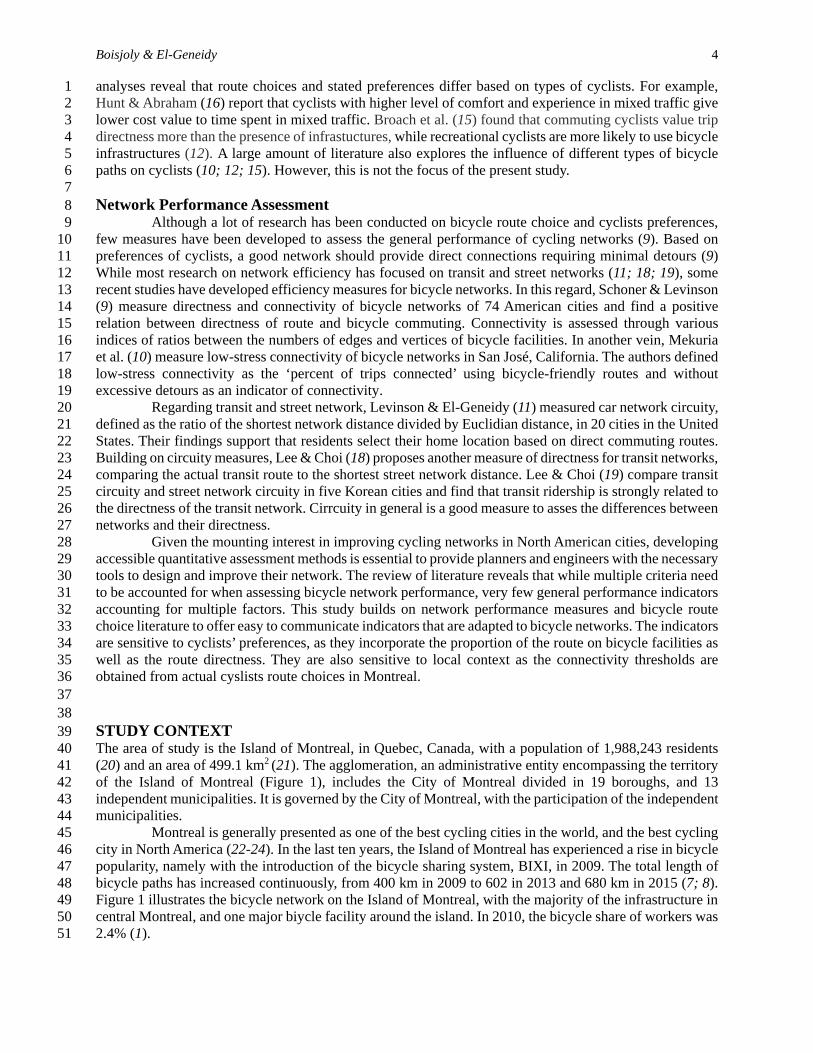
Boisjoly & El-Geneidy 7 bicycle facilities are not included in the network, as they were not provided in the original files. As a result, 1 network distances might be underestimated, allowing routes to use all segments in both directions. Since 2 both bicycle facilities and streets are considered two-way, diversion measures should not be significantly 3 affected. However, the circuity is probably underestimated, since using both directions provides shorter 4 network distances. Additionally, for the spatial analysis, measures are based on the routes originating in the 5 borough. It therefore does not account for the destination. However, since an average is provided for all 6 routes, it gives a good indication of borough interconnectivity. 7 8 RESULTS 9 Route Characteristics of Cyclists in Montreal 10 First, data from the 2009 cycling survey are used to assess cyclists’ route choices in Montreal using the 11 2009 street and bicycle network. For each cyclist surveyed, his/her actual route is generated, based on 12 his/her origin and destination, and based on where he/she got on and off the bicycle facility, if he/she used 13 any. If a cyclist used more than one facility in his/her trip, he/she was asked to report the details of the 14 facility they used the most in their trip in terms of distance. As an example, Figure 2 illustrates the actual 15 route of one respondent, together with the shortest route and the Euclidian distance. Based on these lengths, 16 the detour, the circuity and the portion of the trip on bicycle facilities are calculated (Figure 2). The portion 17 of the trip on bicycle facilities is based on the distance traveled on the main facility, and does not take into 18 account facilities that might have been used to access the main facility from the origin and to access the 19 destination from the facility. 20 21
22 23 24 25 Trip Characteristic 26
Euclidian distance (m) 3046
Length – Shortest Route (m) 3207 Length – Actual Route (m) 4788 Circuity 1.57 Detour (m) 1580 Detour (%) 49 Portion of Trip on Facilities (%) 63
27
FIGURE 2 Shortest Route, Actual Route and Euclidian Distance (Example from the 2009 Survey) 28
The average route characteristics of the cyclists who used a bicycle facility (path-users) and those who did 29 not (non path-users) are presented in Table 1. Results show that for commuting to school or work, path-30 using cyclists divert from the shortest path with an average detour of 12% (695 m) and have a circuity of 31 1.33, compared to 1.22 for the non path-using cyclists. 32
33
Boisjoly & El-Geneidy 8 TABLE 1 Average Route Characteristics for Path-Users and Non Path-Users 1
Route Characterstic Path-Users Non Path-Users
Euclidian distance (km) 4.91 4.23
Length – Shortest Route (km) 6.46 5.02 Length – Actual Route (km) 5.76 5.02 Circuity 1.33 1.20 Detour (m) 695 0 Detour (%) 12 0 Portion of Trip on Facilities (%) 50 0 Connectivity 29 6.0
*Note that values between path-users and non path-users are significantly different from one another, with 2 p-values lower than 0.05. 3 4 Performance of the Bicycle Network 5 Three levels of preference are assessed to account for different types of cyclists, which may have varying 6 preferences in terms of diversion and proportion along facilities. Table 2 presents performance indicators 7 and the average length for every level of preference, using the 2013 home-work/school locations of cyclists. 8 Connectivity is measured based on the 2009 path-user averages, using 12% maximal diversion and 50% 9 minimal proportion of the routes. In other words, only routes with a detour lower than 12 % and with a 10 proportion of route along facilities higher than 50 % are considered as connected. 11
As expected, higher levels of preference for using bicycle facilities yield on average greater 12 diversion and proportion of route on facilities. Generally speaking, the network provides low connectivity 13 (all below 51%). Using only bicycle facilities, the connectivity drops to 5 %. For comparison purpose, the 14 2009 path-users average trip characterstics are included in Table 2. The medium preference aligns best with 15 2009 path-user preferences with an average diversion of 12%. Regarding the portion of the route on bicycle 16 facilities, it is much higher for the medium preference than for the 2009 path-users. This can be explained 17 by the fact that the 2009 portion of the trip on bicycle facilities only includes the main facility used, as 18 explained above. Moreover, 202 km of facilities were added since 2009, possibly explaning this discrepancy. 19 20
TABLE 2 Average Route Characteristics for Every Level of Preference 21
Route Characterstic No Low Medium High Bicycle
facilities only Path-Users
Bicycle facilities cost coefficient
0 0.8 0.5 0.2 Infinite Unknown
Route Length (km) 5.8 6.1 6.5 7.1 5.6 5.8 Diversion 0 4.3 12 24 20 12
Proportion of Route on Facilities (%)
19 32 82 89 100 50
Connectivity (%) 20 36 51 51 5 29 22
For simplicity reasons, only results for the medium level preference are presented in the rest of 23 the paper. This level of preferences was chosen as it provides high connectivity and average diversion 24 similar to the preferences of cyclists of 2009. 25 26 Home location choice and directness 27 In the 2013 survey, several home location questions were included to assess the impacts of bicycle facilities 28 on home location choices. This was done by asking a series of questions about how important was the 29 following criteria when selecting your current home. These criteria included the presence of bicycle paths 30 and others like the size of the home or being near public transport. Surprisingly, the average diversion and 31
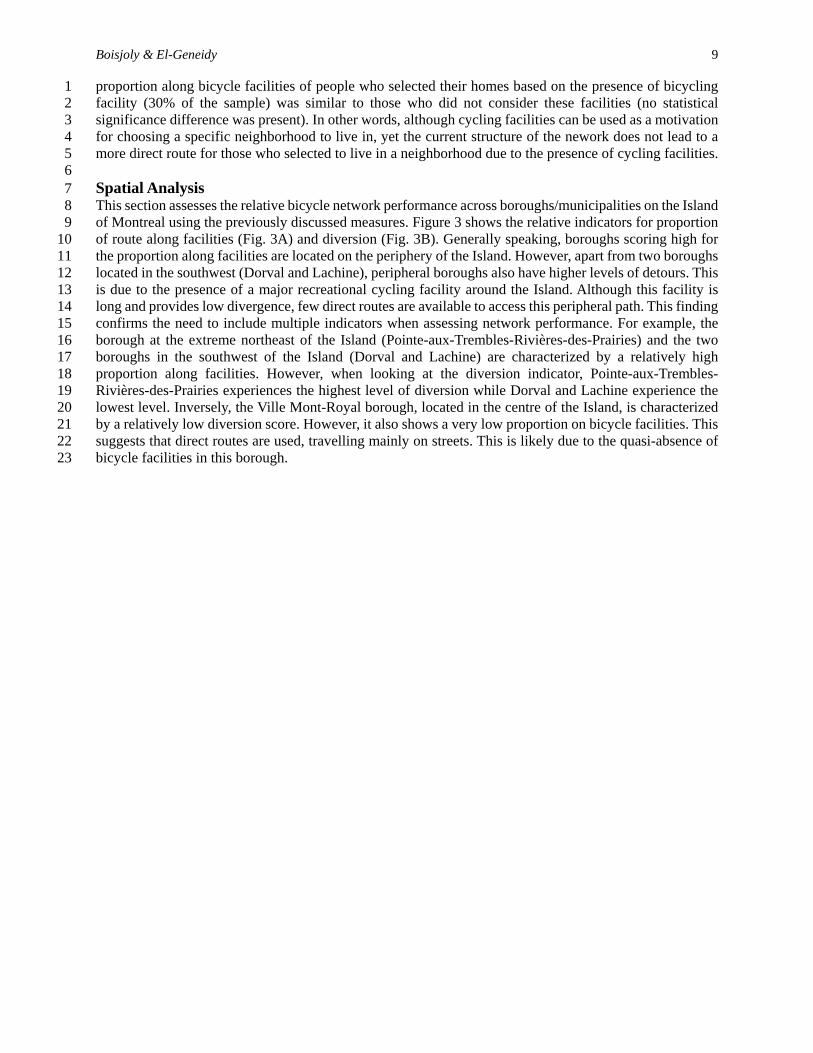
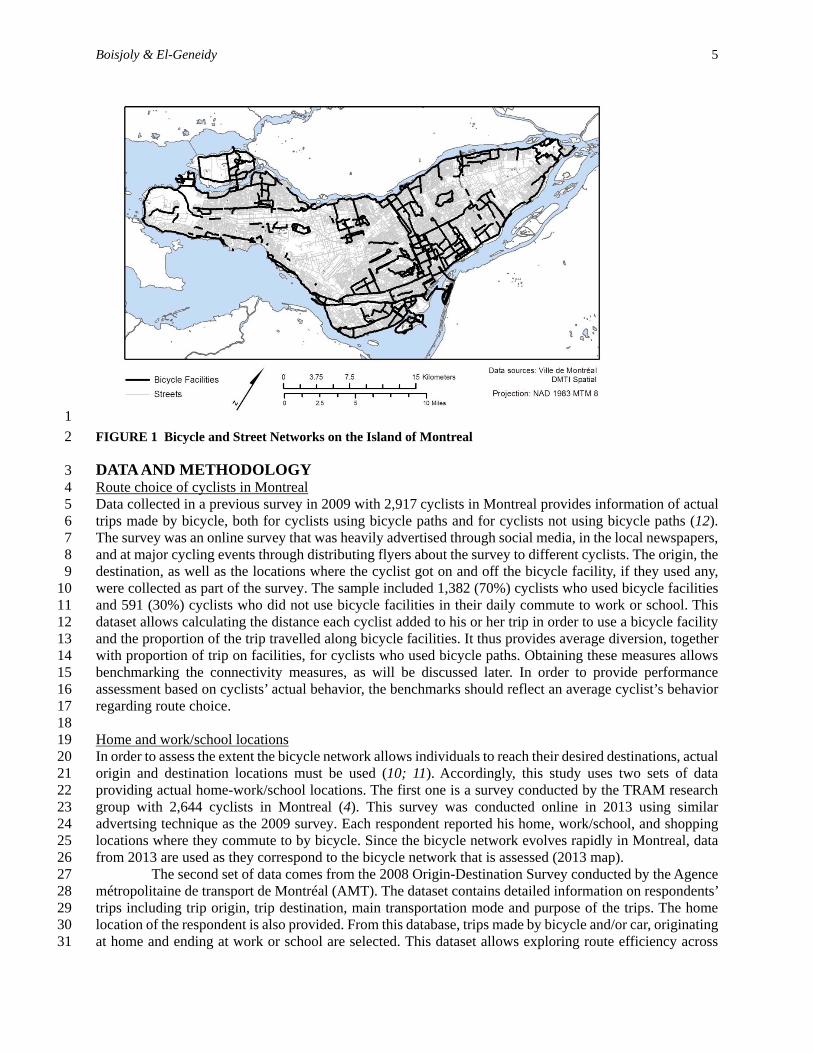
Boisjoly & El-Geneidy 9 proportion along bicycle facilities of people who selected their homes based on the presence of bicycling 1 facility (30% of the sample) was similar to those who did not consider these facilities (no statistical 2 significance difference was present). In other words, although cycling facilities can be used as a motivation 3 for choosing a specific neighborhood to live in, yet the current structure of the nework does not lead to a 4 more direct route for those who selected to live in a neighborhood due to the presence of cycling facilities. 5 6 Spatial Analysis 7 This section assesses the relative bicycle network performance across boroughs/municipalities on the Island 8 of Montreal using the previously discussed measures. Figure 3 shows the relative indicators for proportion 9 of route along facilities (Fig. 3A) and diversion (Fig. 3B). Generally speaking, boroughs scoring high for 10 the proportion along facilities are located on the periphery of the Island. However, apart from two boroughs 11 located in the southwest (Dorval and Lachine), peripheral boroughs also have higher levels of detours. This 12 is due to the presence of a major recreational cycling facility around the Island. Although this facility is 13 long and provides low divergence, few direct routes are available to access this peripheral path. This finding 14 confirms the need to include multiple indicators when assessing network performance. For example, the 15 borough at the extreme northeast of the Island (Pointe-aux-Trembles-Rivières-des-Prairies) and the two 16 boroughs in the southwest of the Island (Dorval and Lachine) are characterized by a relatively high 17 proportion along facilities. However, when looking at the diversion indicator, Pointe-aux-Trembles-18 Rivières-des-Prairies experiences the highest level of diversion while Dorval and Lachine experience the 19 lowest level. Inversely, the Ville Mont-Royal borough, located in the centre of the Island, is characterized 20 by a relatively low diversion score. However, it also shows a very low proportion on bicycle facilities. This 21 suggests that direct routes are used, travelling mainly on streets. This is likely due to the quasi-absence of 22 bicycle facilities in this borough. 23

Boisjoly & El-Geneidy 10
1
FIGURE 3 Relative Indicator Score at the Borough Level 2
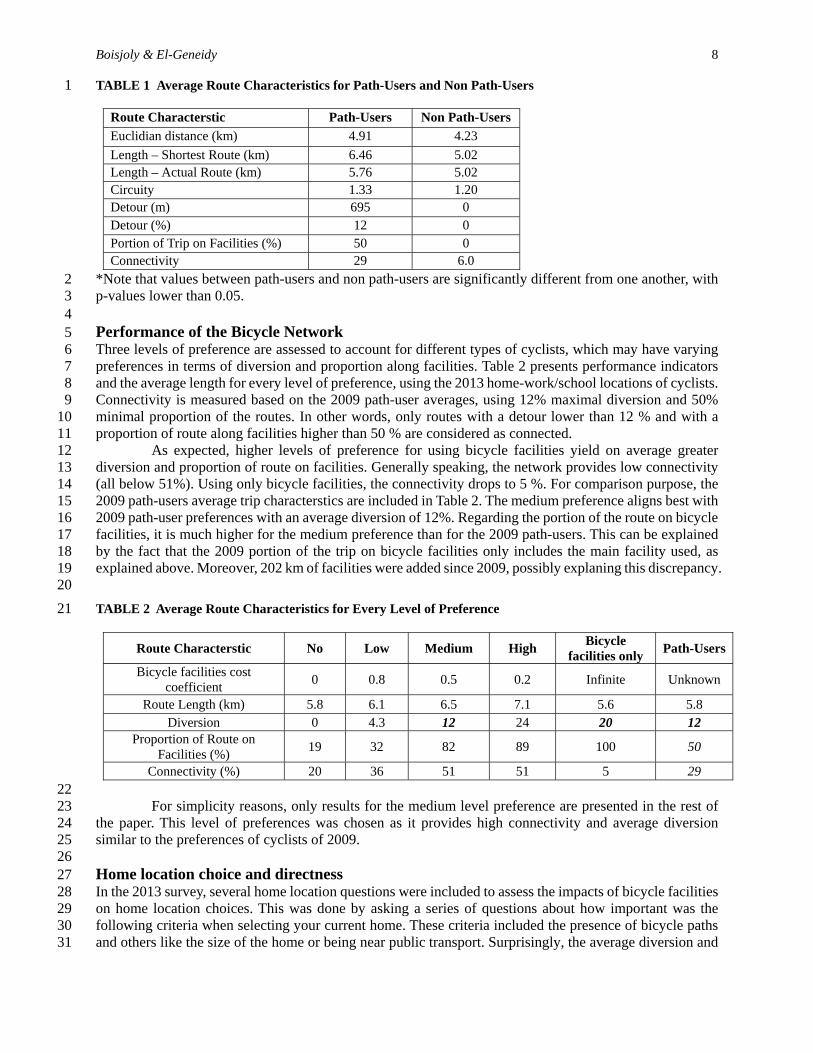
In order to account for proportion of route on facilities and diversion simulatenously, the 3 connectivity measure based on these two indicators is presented in Figure 4. Results show that apart from 4 the Dorval and Lachine boroughs, central boroughs north of downtown experience the highest connectivity. 5 This is due to the presence of bicycle facilities on both north-south and east-west axes, connecting each 6 borough to the boroughs around it. Inveresly, the southern tip of the Island, while encompassing many 7 bicycle facilities, has a major east-west connection, but no north-south facilities connecting to other 8 boroughs, which may explain its low connectivity. Unexpectedly, Dorval and Lachine experience the 9 highest levels of connectivity. A brief assessment of the cyclists’ home location in these boroughs reveals 10 that they mainly reside near the peripheral bicycle facility, which provides a direct link to downtown 11 (compared to the street network). This may account for the high proportion of route on facilities with low 12
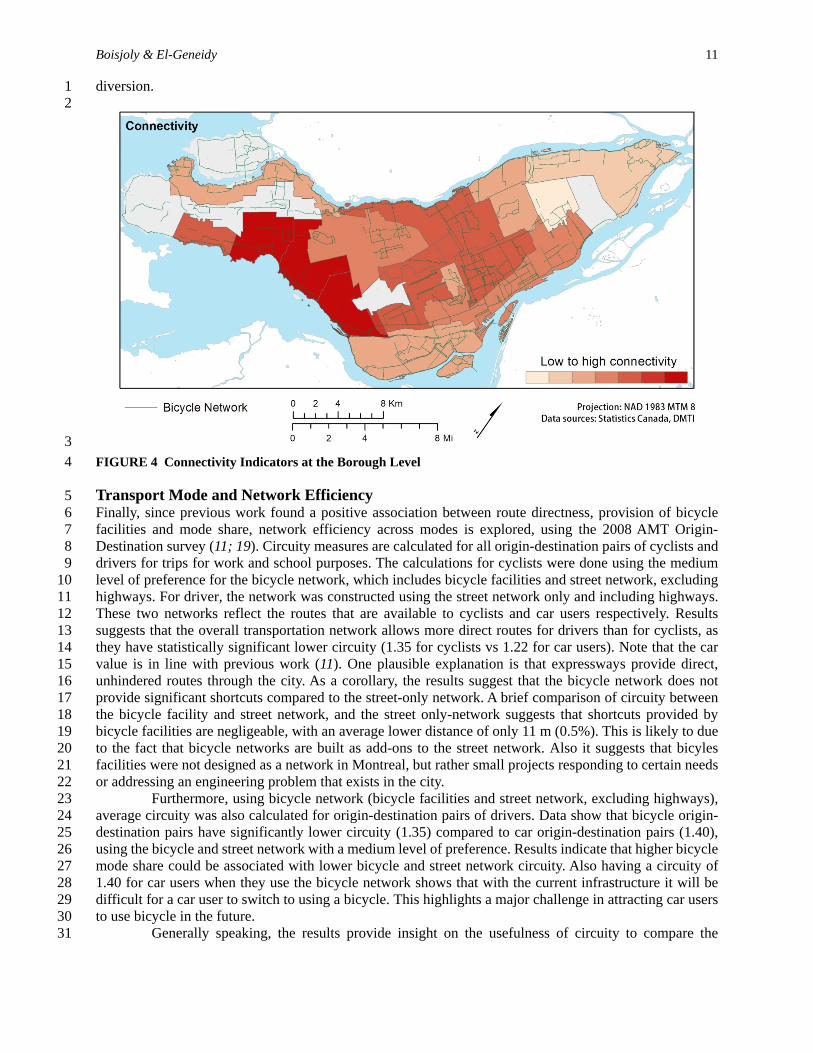
Boisjoly & El-Geneidy 11 diversion. 1
2
3
FIGURE 4 Connectivity Indicators at the Borough Level 4
Transport Mode and Network Efficiency 5 Finally, since previous work found a positive association between route directness, provision of bicycle 6 facilities and mode share, network efficiency across modes is explored, using the 2008 AMT Origin-7 Destination survey (11; 19). Circuity measures are calculated for all origin-destination pairs of cyclists and 8 drivers for trips for work and school purposes. The calculations for cyclists were done using the medium 9 level of preference for the bicycle network, which includes bicycle facilities and street network, excluding 10 highways. For driver, the network was constructed using the street network only and including highways. 11 These two networks reflect the routes that are available to cyclists and car users respectively. Results 12 suggests that the overall transportation network allows more direct routes for drivers than for cyclists, as 13 they have statistically significant lower circuity (1.35 for cyclists vs 1.22 for car users). Note that the car 14 value is in line with previous work (11). One plausible explanation is that expressways provide direct, 15 unhindered routes through the city. As a corollary, the results suggest that the bicycle network does not 16 provide significant shortcuts compared to the street-only network. A brief comparison of circuity between 17 the bicycle facility and street network, and the street only-network suggests that shortcuts provided by 18 bicycle facilities are negligeable, with an average lower distance of only 11 m (0.5%). This is likely to due 19 to the fact that bicycle networks are built as add-ons to the street network. Also it suggests that bicyles 20 facilities were not designed as a network in Montreal, but rather small projects responding to certain needs 21 or addressing an engineering problem that exists in the city. 22
Furthermore, using bicycle network (bicycle facilities and street network, excluding highways), 23 average circuity was also calculated for origin-destination pairs of drivers. Data show that bicycle origin-24 destination pairs have significantly lower circuity (1.35) compared to car origin-destination pairs (1.40), 25 using the bicycle and street network with a medium level of preference. Results indicate that higher bicycle 26 mode share could be associated with lower bicycle and street network circuity. Also having a circuity of 27 1.40 for car users when they use the bicycle network shows that with the current infrastructure it will be 28 difficult for a car user to switch to using a bicycle. This highlights a major challenge in attracting car users 29 to use bicycle in the future. 30
Generally speaking, the results provide insight on the usefulness of circuity to compare the 31
Boisjoly & El-Geneidy 12 efficiency of different transportation networks, in this case bicycle network vs street network. Furthermore, 1 it supports the importance of directness indicators for assessing bicycle network performance and increasing 2 bicycle use. 3 4 DISCUSSION AND CONCLUSION 5 This paper assesses Montreal’s bicycle network performance, building on a set of complementary indicators. 6 Two indicators reflecting a major attribute of good bicycle routes according to cyclist criteria are generated: 7 route diversion and proportion of route along bicycle facilities. These two indicators are then assessed 8 simultaneously, with the connectivity measures. Using these indicators, the performance of Montreal 9 network is asseseed for three levels of preference regarding bicycle facilities, accounting for different types 10 of cyclists. Generally speaking, all levels show low connectivity (all lower than 51%). In other words, using 11 criteria that reflect cyslists’ preferences, the network provides good connectivity to less than 51% of the 12 population. Furthermore, results show a clear trade-off between route directness and proportion of route 13 along bicycle facilities. The spatial analysis illustrates the need to include both indicators to evaluate the 14 performance of the bicycle network. Finally, using circuity measures, results found that the Montreal 15 transportation network generally favors trips made by car, with a circuity of 1.22 compared to 1.33 for trips 16 made by bicycle. 17
From a transportation planning standpoint, the study provides an applicable method for assessing 18 bicycle network performance. First it provides a simple method to generate a bicycle network that reflects 19 various cyslists’ behavior, allowing cyclists to travel on streets while assigning a preference for bicycle 20 facilities. The level of preference for bicycle facilities can be specified to a desired level that can be adjusted 21 depending on planning objectives. Furthermore, connectivity criteria can be set to reflect actual preferences 22 in the real world. A good connected cycling network should be the one where 100% of the cyclists can reach 23 their desired destinations with minimum diversion to use a bicycle facility (less than 12%), travel is along 24 cycling facilities most of the time (more than 50%), and the circuity between the home and destination is 25 the same as other modes (1.2 or less). 26
27 Second, this research suggests indicators that are easy to generate, interpret and communicate, 28
and they are indicators that have shown to impact bicycle use and cyclists’ experience (1; 3; 5). While this 29 study focused on diversion and proportion of route along bicycle facilities, other indicators can be 30 developed to account for more factors influencing route choices. Such factors include travel speed, esthetic 31 of the route and presence of crossing intersections. Performance indicators developed in this study can be 32 generated by planners and researchers to assess different improvement scenarios, as done by Mekuria et al. 33 (10), or to conduct a comparative study across cities as done by Schoner & Levinson (9). Also, as shown 34 in this study, performance indicators can be used to implement spatial analysis and identify the areas that 35 are in need of improvement the most. 36 This study also provides insight on bicycle network performance indicators, which go beyond the 37 simple length of bicycle facilities in a city. While the length of the network provides a good indication of 38 bicycle facilities supply, it does not account for desired trips and for efficient resource allocation. While 39 most planning documents provide quantitative objectives in terms of length, connectivity is increasingly 40 seen as a concern, as it is the case in Montreal (7; 8). Accordingly, the development of quantitative 41 connectivity measures becomes increasingly relevant for practicioners and should be included in transport 42 plans as key performance measures. Moreover, assessing the performance of bicycle network connectivity 43 offers insight into the spatial scale of planning bicycle infrastructures for a city. In Montreal, while the 44 vision for transportation networks is determined at the agglomeration level, boroughs and independent 45 municipalities are responsible for implementing bicycle lanes, perhaps leading to the poor connectivity 46 revealed in this study. 47 Finally, exploring the relation between transportation mode and circuity suggests that the 48 directness of the route could influence mode choice, and more research is needed in this area to confirm 49 our finding. Additionally, the comparative circuity analysis shows that drivers are favoured by the overall 50 transportation network compared to cyclists. Hence, in order to promote bicycle use, cities have to address 51 the directness of their bicycle routes that are provided by the overall network. 52

Boisjoly & El-Geneidy 13 ACKNOWLEDGMENT 1 TheauthorswouldliketothankGabrielDamant‐SiroisandJacobLarsenfortheirworkonprevious2 cyclingsurvey inMontreal.Additionally, thanks toDavidVerbich forhis criticalcommentson the3 paper.Finally, we gratefully acknowledge the financial support received from the Natural Sciences and 4 Engineering Research Council of Canada (NSERC) and the Fonds de recherche du Québec–Nature et 5 technologies (FRQNT). 6 7 REFERENCES 8 [1] Pucher, J., R. Buehler, and M. Seinen. Bicycling renaissance in North America? An update and re-9 appraisal of cycling trends and policies. Transportation Research Part A: Policy and Practice, Vol. 45, No. 10 6, 2011, pp. 451-475. 11 [2] Aultman-Haulm, L., F. L. Hall, and B. B. Baetz. Analysis of bicycle commuter routes using geographic 12 information systems: Implications for bicycle planning Transportation Research Record, No. 1578, 1997, 13 pp. 102-110. 14 [3] Snizek, B., T. A. S. Nielsen, and H. Skov-Petersen. Mapping bicyclists' experiences in Copenhagen. 15 Journal of Transport Geography, Vol. 30, 2013, pp. 227-233. 16 [4] Damant-Sirois, G., M. Grimsrud, and A. El-Geneidy. What's youre type: A multidimensional cyclist 17 typology. Transportation, accepted. 18 [5] Sener, I. N., N. Eluru, and C. R. Bhat. An analysis of bicycle route choice preferences in Texas, US. 19 Transportation, Vol. 36, 2009, pp. 511-539. 20 [6] Pucher, J., J. Dill, and S. Handy. Infrastructure, programs, and policies to increase bicycling: An 21 international review. Preventive Medicine, Vol. 50, Supplement, 2010, pp. S106-S125. 22 [7] Ville de Montréal. Montreal Transportation Plan.In, Montreal, 2008. 23 [8] ---. Demain Montréal: Projet de plan de développement de Montréal.In, Montreal, 2013. 24 [9] Schoner, J. E., and D. Levinson. The missing link: Bicycle infrastructure networks and ridership in 74 25 US cities. 2014. 26 [10] Mekuria, M. C., P. G. Furth, and H. Nixon. Low-stress bicycling and network connectivity.In, Mineta 27 Transportation Institute, San José, 2012. 28 [11] Levinson, D., and A. El-Geneidy. The minimum circuity frontier and the journey to work. Regional 29 Science and Urban Economics, Vol. 39, 2009, pp. 732-738. 30 [12] Larsen, J., and A. El-Geneidy. A travel behavior analysis of urban cycling facilities in Montréal, 31 Canada. Transportation Research Part D: Transport and Environment, Vol. 16, No. 2, 2011, pp. 172-177. 32 [13] Buehler, R., and J. Pucher. Cycling to work in 90 large American cities: New evidence on the role of 33 bike paths and lanes. Transportation, Vol. 39, 2012, pp. 409-432. 34 [14] Ehrgott, M., J. Y. T. Wang, A. Raith, and C. van Houtte. A bi-objective cyclist route choice model. 35 Transportation Research Part A: Policy and Practice, Vol. 46, No. 4, 2012, pp. 652-663. 36 [15] Broach, J., J. Dill, and J. Gliebe. Where do cyclists ride? A route choice model developed with revealed 37 preference GPS data. Transportation Research Part A: Policy and Practice, Vol. 46, 2012, pp. 1730-1740. 38 [16] Hunt, J. D., and J. E. Abraham. Influences on bicycle use. Transportation, Vol. 34, 2007, pp. 453-470. 39 [17] Tilahun, N. Y., D. Levinson, and K. J. Krizek. Trail, lanes, or traffic: Valuing bicycle facilities with 40 an adaptive stated preference survey. Transportation Research Part A: Policy and Practice, Vol. 41, 2007, 41 pp. 287-301. 42 [18] Lee, Y. J. Comparative measures for transit network performance analysis. Journal of the 43 Transportation Research Forum, Vol. 47, No. 3, 2008. 44 [19] Lee, Y. J., and J. Y. Choi. Geographical applications of performance measures for transit network 45 directness. Journal of Public Transportation, Vol. 18, No. 2, 2015. 46 [20] Ville de Montréal. Montréal en statistiques, Montreal. Accessed July 28th 2015, 2015. 47 [21] ---. Population totale et superficie des arrondissements de Montréal et des villes liées, Agglomération 48 de Montréal, 2011.In Montréal en statistiques, Ville de Montréal, 2012. 49 [22] Copenhagenize Desing Company. The 2015 Copenhagenize Index. Bicycle-friendly cities. 50 http://copenhagenize.eu/index/. Accessed July 26th, 2015. 51

Boisjoly & El-Geneidy 14 [23] Walker, P. World's best cycling cities.In CNN, Toronto, 2014. 1 [24] Babin, T. 5 things to learn from North America's (second) most bike-friendly city.In Calgary Herald, 2 Calgary, 2015. 3 [25] Ville de Montréal. Pistes cyclables. http://donnees.ville.montreal.qc.ca/dataset/pistes-cyclables. 4 [26] Hagerstrand, T. What About People in Regional Science? Papers of the Regional Science Association, 5 Vol. 24, 1970, pp. 7-21. 6
7