Embed Size (px)
Citation preview

1
Anne ter Braak
Barbara Deleersnyder
Inge Geyskens
Marnik G. Dekimpe
SLEEPING WITH THE ENEMY: Does Private-Label Production by
National-Brand Manufacturers Create Discounter Goodwill?

2
Current situation Private labels are becoming more and more
important in retailing
>40%
Switzerla
nd
U.K.

Prior empirical research
Determinants of private-label success (Hoch and Banerji, 1993; Dhar and Hoch, 1997; Steenkamp and Dekimpe, 1997; Lamey et al. 2011).
Demographic and psychographic characteristics of PL buyers
(Richardson et al.,1996; Ailawadi et al., 2001; Ailawadi and Keller, 2004).

Prior empirical research
Determinants of private-label success
Demographic and psychographic characteristics of PL buyers
Private-label production: largely ignored

5
Some absolute numbers
European PL market (2010): €431 billion
Wal-Mart PL sales (2009): $132 billion

6
Retailers hardly ever occurs (Mills 1995)
Who produces private labels?

7
Retailers hardly ever occurs (Mills 1995)
Dedicated private label manufacturers
Who produces private labels?
8
Retailers hardly ever occurs (Mills 1995)
Dedicated private label manufacturers: Mostly for commoditized products
National-brand (NB) manufacturers
Who produces private labels?

9
Mixed choices
(Kumar & Steenkamp 2007)
PL production: YES!
PL production: NO!

NB manufacturers are struggling… “Whether to produce PLs or not, is certainly one of
the central dilemmas that preoccupy NB manufacturers.”
(Business Strategy Review 2006, p.42)
Despite the “high level of managerial interest” surprisingly little research has studied this phenomenon. (Sethuraman, Marketing Science 2009, p. 771)
10

Prior research on PL production Game-theoretical models
see e.g.,Gomez-Arias and Bello-Acebron 2008; Kumar, Radhakrishnan, and Rao 2010
Structural Model (1 product category) Chen et al. 2010
Very limited empirical research
11

12
Why still an issue?
Hard to get the data “a true CIA job” (Alfred Dijs, Director Knowledge Management and Transfer, GfK, April 2008)
managers very secretive about it
invalidates survey methodology
13
Major motivation to NOT produce Implications for own brand image, brand
equity

14
Excess capacity
Ability to influence PL quality
To cultivate a better relation with retailers, i.e. to create retailer goodwill
Major motivations to produce PLs
15
Underlying arguments
PL production is cooperative behavior of NB manufacturer
is perceived as a pledge by the retailer(Anderson & Weitz 1992)
may increase relational embeddedness (Kaufman, Jayachandran, and Rose 2006)

16
Mixed support for “goodwill” argument
}o
}-
Dunne & Narasimhan (HBR, 1999)
“For manufacturers who seek closer ties with retailers, private labels may represent a neglected opportunity […]”
Quelch & Harding (HBR, 1996)“[….] no evidence that making PL products enhances a brand
manufacturer’s trade relationships […]”
Kumar & Steenkamp (2007)
“[…] we were never able to uncover hard evidence that making private label products […] leads to preferential merchandising support”
Glemet & Mira (The McKinsey Quarterly, 1993)
“ […] result in a long-term deterioration of overall relationship […] once the honeymoon is over.”
}+

17
Goodwill can manifest itself in:Product (Dunne & Narasimhan 1999; Quelch & Harding 1996)
• Shelf access• Shelf breadth Shelf presence• Shelf length
Selection as category captain
Promotion• Extent of pass-through (Ailawadi & Harlam 2008)
• Promotional calendar (Dunne & Narasimhan 1999; Quelch & Harding 1996)

18
Our setting: PL Production for Discounters Increasingly important channel (30+ market
share in Germany, 2007)

19
KEY CHARACTERISTICS DISCOUNT KEY CHARACTERISTICS DISCOUNT STORESSTORES
Simple, no-frills, store format
Compete on price
More limited assortment depth
Emphasize PL

Recent development
Started to add a few NBs in their assortment
Why? (Deleersnyder et al. 2007)
- Way of differentiation relative to other discounters
- Way to expand customer base
21

Added benefits of discount setting Centralized approach to assortment
management
No (very limited) use of slotting allowances
EDLP setting
22

23
As such:
Discounter goodwill can manifest itself in: NB Shelf presence
Hence:
H1: PL production by a NB manufacturer increases the likelihood of shelf presence
Manufacturer market power
Powerful firms secure high levels of influence on channel members (e.g., Anderson, Lodish, and Weitz 1987; Rao and McLaughlin 1989; Shervani, Frazier, and Challagalla 2007).
H2: NB manufacturer market power increases the likelihood of shelf presence
24
Interaction effect
H3a: PL production enhances (amplifies) the effect of manufacturer market power in increasing the likelihood of shelf presence for a NB manufacturer.
H3b: PL production diminishes the effect of manufacturer market power in increasing the likelihood of shelf presence for a NB manufacturer.
25

26
Moreover….
Not all NB manufacturers are equally willing to participate in PL production.
Not all NB manufacturers are equally appealing to the retailer as PL producer
Both retailer and manufacturer considerations
Observable drivers of PL production by a given manufact.
Unobservable drivers: self-selection model

27
Observable drivers Manufacturer sales growth (H4)
Ease of producing high-quality products (H5)
Manufacturer marketing tools Innovativeness of manufacturer (H6) Extent of advertising support of manufacturer (H7) Price premium manufacturer can charge (H8)
Manufacturer market power (H9)

28
+H2 +/-
H9
-H4
+H1
+H5
+/-H6, H7, H8
Ease of Producing High-Quality Products
Manufacturer Marketing Tools: - Innovations - Advertising - Price Premium over PLs
PL Production
Manufacturer Market Power
Manufacturer Sales Growth
Shelf Presence
+/- H3
Conceptual Framework
CONSEQUENCEANTECEDENTS

Data
Europe’s leading hard discounter:
Europe’s leading soft discounter:
29

30
Data Aldi: 37 categories Mercadona: 53 categories
That contained at least one NBProduct Group ExamplesAssorted foods noodles, jam, riceBeverages beer, mineral water, juiceCandy candy bars, chocolate, bonbonsCanned/bottled foods fish, beans, tomatoCare products shampoo, diapers, toilet tissueCooking fats butter, olive oil, margarineCleaning products bleach, detergent, fabric conditionerDairy products milk, yoghurt, ice creamHousehold supplies basket bin bags, toilet tablets, cellulosesInstant meals ready desserts, ready meals, saladPastry cakes, sweet biscuitsPet products wet dog food, dry dog foodTaste enhancers ketchup, salad dressing, mayonnaise
31
Data collection procedure (1)
1. Derive top 5 NB manufacturers per category
Source: GfK panel data (for Aldi) and Kantar Worldpanel data (for Mercadona)
32
Data collection procedure (2)
2. Collect info on focal variables for 450 observations
(37 * 5)+(53 * 5):
(i) NB shelf presence
Source: GfK panel data (for Aldi) and Kantar Worldpanel data (for Mercadona)

33
Data collection procedure (2)
Source for Mercadona: Kantar Worldpanel data
2. (ii) Private-label production
Sources for Aldi: - address matching (Bell & Zabriskie 1978) - books (Bertram 2006; Schaab & Eschenbek 2008; Schneider 2005, 2006) - websites (e.g. www.ciao.de,.... )- store visits
33

34
Data collection procedure (3)3. Then, combine both:
National brand present?
Private-label Production? Yes No Total
Yes 52 40 92
No 133 225 358
Total 185 265 450
52PL production & NB presence combinations!
)01.(34.11)1(2 p

35
Data collection procedure (4)
4. Collect data on other variables …
Manufacturer sales growth (H4)
Source: GfK panel data (for Aldi) and Kantar Worldpanel data (for Mercadona)

36
Data collection procedure (4)
4. Collect data on other variables …
Ease of producing high-quality products (H5)
Source: consumer survey data (Steenkamp et al., 2010)

37
Data collection procedure (4)
4. Collect data on other variables …
Manufacturer marketing tools
Innovativeness of manufacturer (H6)
Extent of advertising support of manufacturer (H7)
Price premium manufacturer charges (H8)
Source: Product Launch Analytics (formerly Productscan)
Source: Thomson Media Control (for Aldi) and InfoAdex S.A. (for Mercadona)
Source: GfK panel data (for Aldi) and Kantar Worldpanel data (for Mercadona)
38
Data collection procedure (4)
4. Collect data on other variables …
Manufacturer market power
Source: GfK panel data (for Aldi) and Kantar Worldpanel data (for Mercadona)

39
+H2 +/-
H9
-H4
+H1
+H5
-H6, H7, H8
Ease of Producing High-Quality Products
Manufacturer Marketing Tools: - Innovations - Advertising - Price Premium over PLs
PL Production
Manufacturer Market Power
Manufacturer Sales Growth
Shelf Presence
+/- H3
Conceptual Framework
40
Method
Bivariate probit selection model (Heckman 1979)
Two discounters: prior pooling tests
41
Method
Bivariate probit selection model (Heckman 1979)
Two discounters: prior pooling tests
Pooling allowed, three exceptions
Manufacturer power in outcome equation
Role of price premium and innovation in selection equation

Outcome equation:
Strategy-selection equation:
42
Method (2)
PRESENCEijd = β0 + '0 D_MERCd + β1 PLPRODijd
+ β2 (M_POWERijd * D_ALDId) + '2 (M_POWERijd * D_MERCd)
+ β3 (PLPRODijd * M_POWERijd * D_ALDId) + '3 (PLPRODijd * M_POWERijd * D_MERCd)
+ γ1 VALGAPjd + γ2 DISC_SHAREjd + εijd
PLPRODijd = δ0 + '0 D_MERCd + δ1 GROWTHijd + δ2 EASEjd + δ3 ADVijd
+ δ4 (PPREMijd * D_ALDId) + '4 (PPREMijd * D_MERCd)
+ δ5 (INNOVijd * D_ALDId) + '5 (INNOVijd * D_MERCd)
+ δ6 M_POWERijd + η1 VALGAPjd + η2 DISC_SHAREjd + 'ijd
Cd )
Bivariate probit
][ 'ijdijdcorr
43
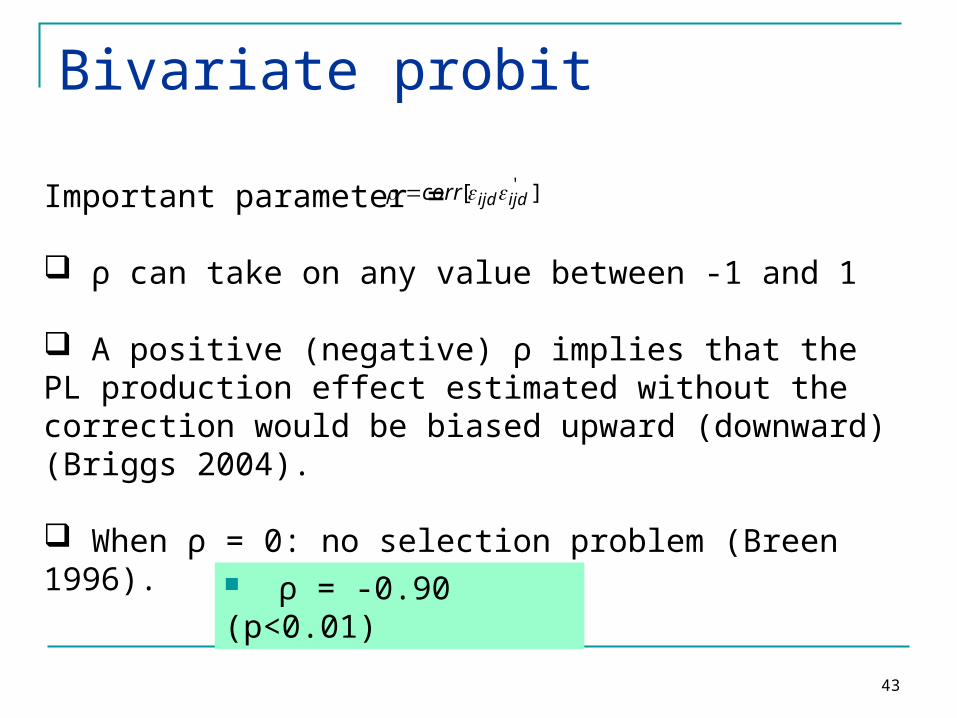
Important parameter =
ρ can take on any value between -1 and 1
A positive (negative) ρ implies that the PL production effect estimated without the correction would be biased upward (downward) (Briggs 2004).
When ρ = 0: no selection problem (Breen 1996).
ρ = -0.90 (p<0.01)

Results
Variable Coefficient (t-value)Outcome Equation (Shelf Presence)
Intercept (β0) -1.46 ††† (-11.46)
PL production (β1) 2.21 *** (11.56)
Manufacturer market power Aldi (β2) -.10 (-1.31)
Manufacturer market power Mercadona (β’2) .48 *** (6.72)
PL production * Manufacturer market power Aldi (β3) .06 (.35)
PL production * Manufacturer market power Mercadona (β’3) -.62 † (-1.67)
Control variables
Value gap (γ1) .03 (.12)
Discounter category share (γ2) .03 (.15)
Discounter dummy (0 = Aldi, 1 = Mercadona) (β’0) 1.35 ††† (8.99)
44
PRESENCEijd = β0 + '0 D_MERCd + β1 PLPRODijd
+ β2 (M_POWERijd * D_ALDId) + '2 (M_POWERijd * D_MERCd)
+ β3 (PLPRODijd * M_POWERijd * D_ALDId) + '3 (PLPRODijd * M_POWERijd *
D_MERCd) + γ1 VALGAPjd + γ2 DISC_SHAREjd + εijd

Results
45
PRESENCEijd = β0 + '0 D_MERCd + β1 PLPRODijd
+ β2 (M_POWERijd * D_ALDId) + '2 (M_POWERijd * D_MERCd)
+ β3 (PLPRODijd * M_POWERijd * D_ALDId) + '3 (PLPRODijd * M_POWERijd *
D_MERCd) + γ1 VALGAPjd + γ2 DISC_SHAREjd + εijd
Variable Coefficient (t-value)Outcome Equation (Shelf Presence)
Intercept (β0) -1.46 ††† (-11.46)
PL production (β1) 2.21 *** (11.56)
Manufacturer market power Aldi (β2) -.10 (-1.31)
Manufacturer market power Mercadona (β’2) .48 *** (6.72)
PL production * Manufacturer market power Aldi (β3) .06 (.35)
PL production * Manufacturer market power Mercadona (β’3) -.62 † (-1.67)
Control variables
Value gap (γ1) .03 (.12)
Discounter category share (γ2) .03 (.15)
Discounter dummy (0 = Aldi, 1 = Mercadona) (β’0) 1.35 ††† (8.99)

Results
46
PRESENCEijd = β0 + '0 D_MERCd + β1 PLPRODijd
+ β2 (M_POWERijd * D_ALDId) + '2 (M_POWERijd * D_MERCd)
+ β3 (PLPRODijd * M_POWERijd * D_ALDId) + '3 (PLPRODijd * M_POWERijd *
D_MERCd) + γ1 VALGAPjd + γ2 DISC_SHAREjd + εijd
Variable Coefficient (t-value)Outcome Equation (Shelf Presence)
Intercept (β0) -1.46 ††† (-11.46)
PL production (β1) 2.21 *** (11.56)
Manufacturer market power Aldi (β2) -.10 (-1.31)
Manufacturer market power Mercadona (β’2) .48 *** (6.72)
PL production * Manufacturer market power Aldi (β3) .06 (.35)
PL production * Manufacturer market power Mercadona (β’3) -.62 † (-1.67)
Control variables
Value gap (γ1) .03 (.12)
Discounter category share (γ2) .03 (.15)
Discounter dummy (0 = Aldi, 1 = Mercadona) (β’0) 1.35 ††† (8.99)

Results
Variable Coefficient t-value
Strategy-Selection Equation (PL Production)
Intercept (δ0) -2.51 † (-1.70)
Manufacturer sales growth (δ1) -.08 (-.46)
Ease of producing high-quality products (δ2) .73 † (1.65)
Manufacturer marketing tools
Advertising (δ3) -.48 * (-1.53)
Price premium over PLs Aldi (δ4) -.96 *** (-3.36)
Price premium over PLs Mercadona (δ’4) .12 (.74)
Innovations Aldi (δ5) .07 (.37)
Innovations Mercadona (δ’5) -.51 † (-1.74)
Manufacturer market power (δ6) .28 †† (2.49)
Control variables
Value gap (η1) .32 (.95)
Discounter category share (η2) .60 †† (2.01)
Discounter dummy (0 = Aldi, 1 = Mercadona) (δ’0) -1.09 ††† (-5.15)
47
PLPRODijd = δ0 + '0 D_MERCd + δ1 GROWTHijd + δ2 EASEjd + δ3 ADVijd
+ δ4 (PPREMijd * D_ALDId) + '4 (PPREMijd * D_MERCd)
+ δ5 (INNOVijd * D_ALDId) + '5 (INNOVijd * D_MERCd)
+ δ6 M_POWERijd + η1 VALGAPjd + η2 DISC_SHAREjd + 'ijd

Results
48
Variable Coefficient t-value
Strategy-Selection Equation (PL Production)
Intercept (δ0) -2.51 † (-1.70)
Manufacturer sales growth (δ1) -.08 (-.46)
Ease of producing high-quality products (δ2) .73 † (1.65)
Manufacturer marketing tools
Advertising (δ3) -.48 * (-1.53)
Price premium over PLs Aldi (δ4) -.96 *** (-3.36)
Price premium over PLs Mercadona (δ’4) .12 (.74)
Innovations Aldi (δ5) .07 (.37)
Innovations Mercadona (δ’5) -.51 † (-1.74)
Manufacturer market power (δ6) .28 †† (2.49)
Control variables
Value gap (η1) .32 (.95)
Discounter category share (η2) .60 †† (2.01)
Discounter dummy (0 = Aldi, 1 = Mercadona) (δ’0) -1.09 ††† (-5.15)
PLPRODijd = δ0 + '0 D_MERCd + δ1 GROWTHijd + δ2 EASEjd + δ3 ADVijd
+ δ4 (PPREMijd * D_ALDId) + '4 (PPREMijd * D_MERCd)
+ δ5 (INNOVijd * D_ALDId) + '5 (INNOVijd * D_MERCd)
+ δ6 M_POWERijd + η1 VALGAPjd + η2 DISC_SHAREjd + 'ijd
Results
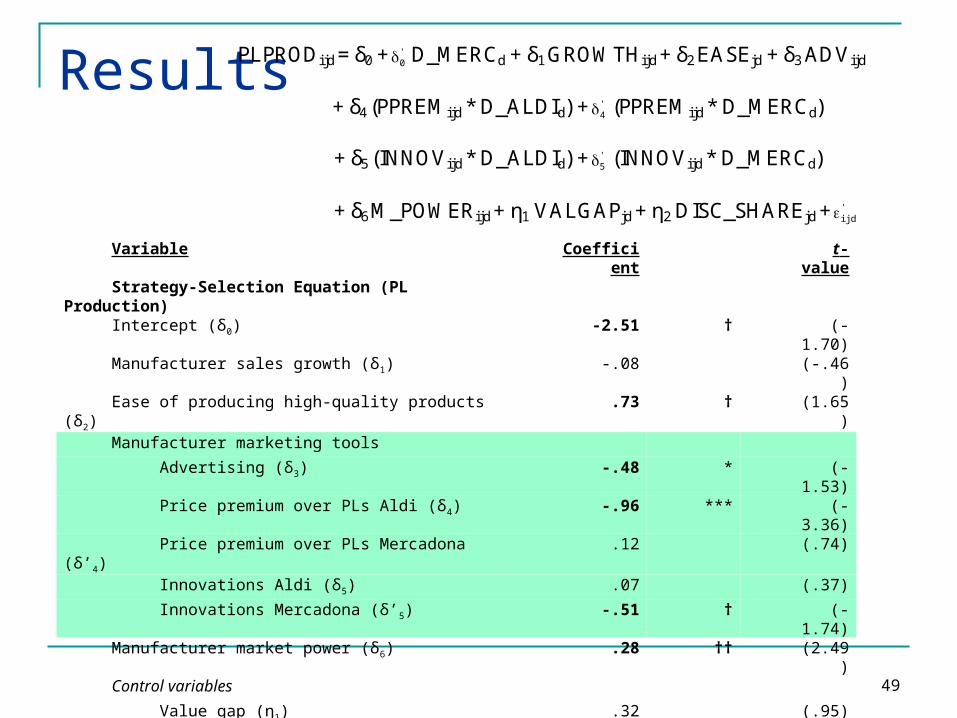
49
Variable Coefficient t-value
Strategy-Selection Equation (PL Production)
Intercept (δ0) -2.51 † (-1.70)
Manufacturer sales growth (δ1) -.08 (-.46)
Ease of producing high-quality products (δ2) .73 † (1.65)
Manufacturer marketing tools
Advertising (δ3) -.48 * (-1.53)
Price premium over PLs Aldi (δ4) -.96 *** (-3.36)
Price premium over PLs Mercadona (δ’4) .12 (.74)
Innovations Aldi (δ5) .07 (.37)
Innovations Mercadona (δ’5) -.51 † (-1.74)
Manufacturer market power (δ6) .28 †† (2.49)
Control variables
Value gap (η1) .32 (.95)
Discounter category share (η2) .60 †† (2.01)
Discounter dummy (0 = Aldi, 1 = Mercadona) (δ’0) -1.09 ††† (-5.15)
PLPRODijd = δ0 + '0 D_MERCd + δ1 GROWTHijd + δ2 EASEjd + δ3 ADVijd
+ δ4 (PPREMijd * D_ALDId) + '4 (PPREMijd * D_MERCd)
+ δ5 (INNOVijd * D_ALDId) + '5 (INNOVijd * D_MERCd)
+ δ6 M_POWERijd + η1 VALGAPjd + η2 DISC_SHAREjd + 'ijd

Results
50
Variable Coefficient t-value
Strategy-Selection Equation (PL Production)
Intercept (δ0) -2.51 † (-1.70)
Manufacturer sales growth (δ1) -.08 (-.46)
Ease of producing high-quality products (δ2) .73 † (1.65)
Manufacturer marketing tools
Advertising (δ3) -.48 * (-1.53)
Price premium over PLs Aldi (δ4) -.96 *** (-3.36)
Price premium over PLs Mercadona (δ’4) .12 (.74)
Innovations Aldi (δ5) .07 (.37)
Innovations Mercadona (δ’5) -.51 † (-1.74)
Manufacturer market power (δ6) .28 †† (2.49)
Control variables
Value gap (η1) .32 (.95)
Discounter category share (η2) .60 †† (2.01)
Discounter dummy (0 = Aldi, 1 = Mercadona) (δ’0) -1.09 ††† (-5.15)
PLPRODijd = δ0 + '0 D_MERCd + δ1 GROWTHijd + δ2 EASEjd + δ3 ADVijd
+ δ4 (PPREMijd * D_ALDId) + '4 (PPREMijd * D_MERCd)
+ δ5 (INNOVijd * D_ALDId) + '5 (INNOVijd * D_MERCd)
+ δ6 M_POWERijd + η1 VALGAPjd + η2 DISC_SHAREjd + 'ijd

51
Robustness check: Timing Issue
PL Production NB presence
Therefore, > for all 52 PL production & NB presence
combinations!
For 30 Aldi observations:
Personal communication to determine temporal ordering
2 cases disconfirmed deleted from sample stable results
)( producept )(listinglt
lt pt
51

52
Conclusion
Benefits for the NB manufacturer?
Evidence of discounter goodwill creation!
SLEEPING WITH THE ENEMY: PRIVATE-LABEL PRODUCTION BY NATIONAL-BRAND MANUFACTURERS

PREVIOUS SETTING
DISCOUNTER SETTING
GOODWILL MEASURE: SHELF PRESENCE

HOW ABOUT
CONVENTIONAL SUPERMARKETS
OTHER GOODWILL METRIC: MARGIN

Prior research on PL margins(Ailawadi & Harlam 2004; Kumar & Steenkamp 2007)
Insight 1: PL margins for the retailer are high
PL suppliers face unfavorable channel relationships Lack of product differentiation
Insight 2: PL margins vary across categories
55

How about within category differences?
1. Multiple PL tiers
2. Heterogeneity in supplier-retailer relationships
3. Different supplier types
56
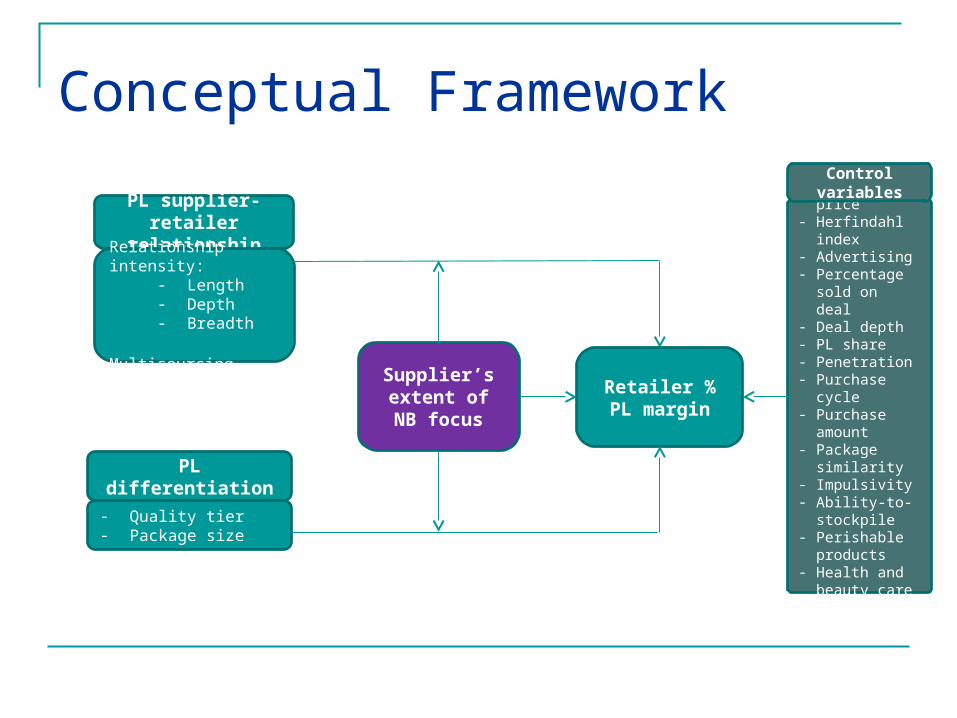
Conceptual Framework
PL differentiation
PL supplier-retailer relationship
Retailer % PL margin
- Retail price- Herfindahl
index- Advertising- Percentage
sold on deal- Deal depth- PL share- Penetration- Purchase cycle- Purchase
amount- Package
similarity- Impulsivity- Ability-to-
stockpile- Perishable
products- Health and
beauty care- Food
Supplier’s extent of NB
focus
- Quality tier- Package size
Relationship intensity:- Length- Depth- Breadth
Multisourcing
Control variables

Supplier NB focus More NB oriented PL suppliers :
Offer more PL quality assurance (Sethuraman 2009) Have more innovative capacity (Kumar & Steenkamp 2007) Have more contact points across the retailer’s business
(IGD 2006) Are valuable for a retailer in terms of their NBs (Dhar &
Hoch 1996)
H5: The more NB oriented a PL supplier is, the lower a retailer’s PL margins
58

Some summary statistics
Average PL margin = 36.6% 38.4% premium 37.5% standard 17.9% economy
189 PL suppliers 562 PL skus are produced by dedicated PL
suppliers 983 PL skus are produced by dual branders
1 – 16 suppliers within a category
59
p <.01
p =.68

Distribution of NB focus
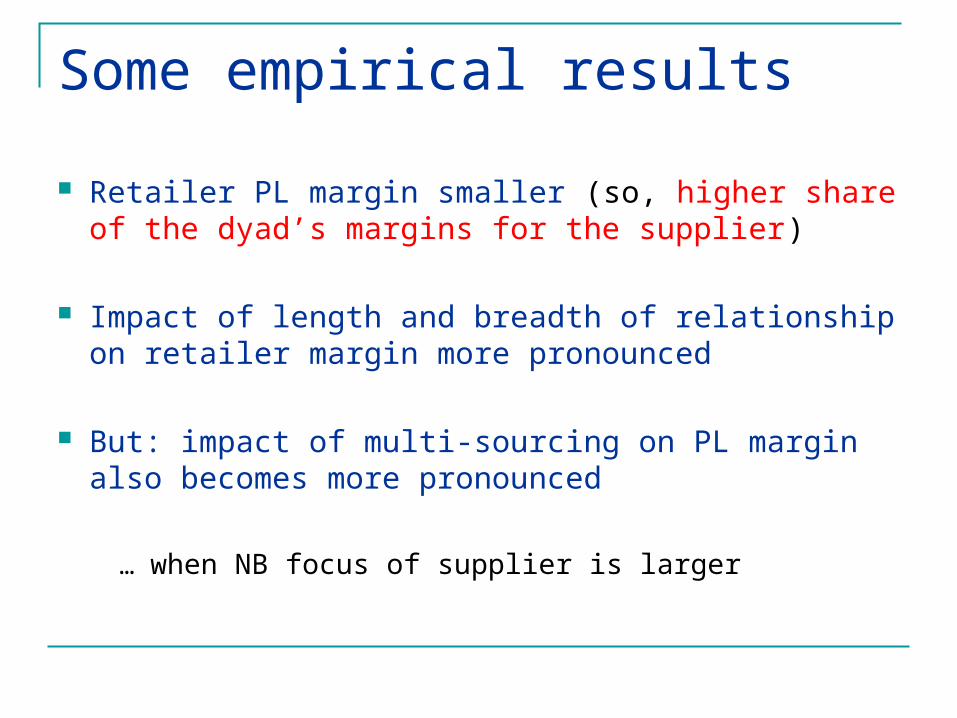
Some empirical results
Retailer PL margin smaller (so, higher share of the dyad’s margins for the supplier)
Impact of length and breadth of relationship on retailer margin more pronounced
But: impact of multi-sourcing on PL margin also becomes more pronounced
… when NB focus of supplier is larger

TO CONCLUDE:
PL production pays off;
With discounters: easier shelf access.
With supermarkets: higher share of the dyad’s margin + relationship quality rewarded more.

BUT:
HOW ABOUT CROSS-CATEGORY IMPLICATIONS?
HOW ABOUT CROSS-RETAILER IMPLICATIONS?

64