Embed Size (px)
Citation preview
1
Analyzing Huntable Wild Turkey Habitat in Minnesota Using Geographic Information Systems (GIS) Benjamin A. Ramseth1,2 1Department of Resource Ananlysis, Saint Mary’s University of Minnesota, Winona, MN 55987; 2Minnesota Department of Natural Resources, Division of Fish and Wildlife, Rochester, MN 55906 Keywords: Wild turkey habitat, GIS, Meleagris gallopavo, hunting permit allocation model, Minnesota. Abstract The Minnesota Department of Natural Resources (MNDNR) uses a model based on forest data to determine numbers of wild turkey hunting permits to allocate per permit area. The wild turkey hunting permits are used to help the wildlife managers meet their management objectives. The model uses amounts of forestland in each permit area as a factor to calculate hunter density. The information is useful for managing wild turkey populations and avoiding overcrowding of hunters. For the spring 2000 hunting season, hunters applied to hunt in one of forty separate permit areas. The MNDNR has identified forty-eight additional permit areas that are assumed to contain suitable habitat for turkey populations. Potentially, these areas could be developed into permit areas for future hunting seasons. In the past, forest abundance was derived from forty-acre parcel landuse/landcover data developed in 1969. This data was both outdated and very general. The goal of this project was to develop more current and accurate data for wild turkey habitat. The MNDNR also wanted to differentiate between the abundance of forest cover, huntable wild turkey habitat, and wild turkey habitat for each permit area using more recent Geographic Information System (GIS) databases. Forest cover was defined as all areas classified as deciduous forest. Wild turkey habitat was defined as forest cover plus one hundred meters of the adjacent land surrounding the forest cover. Huntable wild turkey habitat was defined as forest cover plus fifty meters of the adjacent surrounding land, excluding all areas where hunting is not permitted. These areas include state parks, scientific and natural areas, national wildlife refugees, Indian reservations, and city limits. The method in this paper proves to be a relatively quick and easy way to produce total huntable wild turkey habitat from existing landuse/landcover data. A similar process could be applied to determine huntable habitat for other game species. Introduction The wild turkey has proven to be a modern success in wildlife management (Porter 1997). For years the Minnesota Department of Natural Resources (MNDNR) along with the National Wild Turkey Federation trapped and transported turkeys from Southeastern Minnesota to other parts of the state.
The historic range of wild turkeys in Minnesota is the very Southeastern corner where Houston County exists today. With the help of the trap and transport program, wild turkey range has been expanded to over one half of Minnesota. The release of birds raised in captivity was attempted, but with minimal success in Minnesota (Kimmel 1999a).
2
The MNDNR uses a hunting permit allocation model developed by Dick Kimmel (MNDNR Wildlife Research Biologist) to determine the number of hunting permits allocated to each wild turkey permit area (Kimmel 1999). Up until the year 2000, the model was run using 1969 vintage raster forest data. Current huntable habitat data was needed to replace the old data used to calculate square miles of huntable habitat in the model. Square miles of huntable habitat (per permit area) were divided by the total number of hunters obtaining permits in that area. This provides the number of hunters per square mile in each permit area. The model helps to avoid the overcrowding of hunters in each permit area (Kimmel 1999). This project is based on the International Coalition Land Use/Land Cover 1990 data. This modern day dataset is available for the entire state of Minnesota. From the land use/land cover data, areas of deciduous forest were selected and buffered by one hundred meters to reflect true wild turkey habitat. To produce huntable habitat, the forest areas were buffered by fifty meters and all the lands where hunting is not allowed (state parks, national wildlife refuges, Indian reservations, city limits, scientific and natural areas) were removed. Other lands where hunting is not allowed were also considered (county parks, etc…), but statewide data sets were not available. This, in turn, produces all areas in each permit area that are considered huntable wild turkey habitat. The total number of hunting permits were divided by the newly created total square miles of huntable wild turkey habitat producing a hunter density
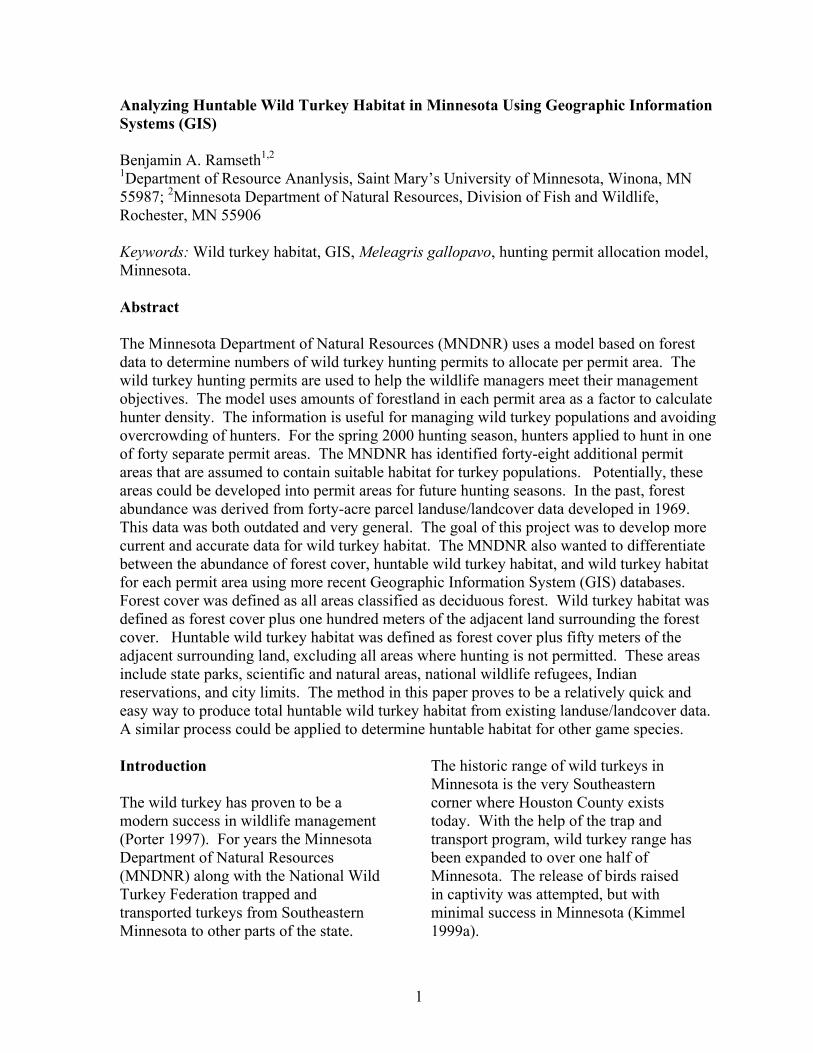
number (hunter’s per square mile of habitat). This information is used to help wildlife managers determine how many permits to issue in each permit area. Phase one included modeling for all lands included in the spring 2000 management plan. In phase two the model was expanded to predict the number of permits to issue in newly developed wild turkey permit areas. Most of the work for this project was completed in later 1999 and early 2000. ArcInfo 7.1 and ArcView 3.1 were used to process and analysis the data. However at that time there was not software available to perform nearest neighbor statistics on large datasets. In 2004 ArcGIS 9 was released with a new spatial statistics toolbox. The nearest neighbor tool in this toolbox was used to calculate the nearest neighbor statistic values found in the HNN field in the turkey permit area shapefile (TPA2000). Study Area The project extent covers the entire state of Minnesota in areas where wild turkey habitat was present. The spring 2000 hunt contains fifty-four permit areas. There were forty-eight additional areas where habitat exists and the areas could be opened up for future hunting seasons. The remaining twenty-seven permit areas did not contain land suitable for wild turkeys (Figure 1). Methods Data Collection All the datasets for this project were acquired through the MNDNR. Some of the datasets were housed at the MNDNR Region 5 office in Rochester, MN.
3
Figure 1. Permit Areas by Season. Datasets not already housed at the MNDNR in Rochester, MN were downloaded from the MNDNR state headquarters using the Unix ArcInfo 7.1 program start_core. This interface allows a regional office to download any data housed at the central office. This made it possible to obtain coverages, shapefiles, or export files clipped to county level. The following landuse/landcover ArcInfo coverages were obtained for this project: • The International Coalition
Landuse/LandCover: produced by the Land Management Information Center (LMIC), Source Photography Date 1990
• LandSat-Based Land Use-Land Cover (Vector): produced by the Manitoba Remote Sensing Centre, Source Imagery Date 1995-1996
• Olmsted County Landuse: produced by the Rochester – Olmsted Planning Department, Source Photography Date 1992
• Metro Area Land Use: produced by the Metropolitan Council and the University of Minnesota – College of Natural Resources, Source Photography/Imagery Data 1990/1991
The following state wide coverages that contain non-huntable lands were obtained for this project:
- State Parks - City Limits - National Wildlife Refuges - Indian Reservations - Scientific and Natural Areas - Lakes
The deer management unit shapefile (DMU25.shp) was obtained from the division of wildlife. This shapefile was later converted into the turkey permit area shapefile, TPA2000. Coverage Creation All of the following processes were completed using ArcInfo 7.1 (ESRI 1998). Even with ArcInfo software running on a Unix platform, some data creation processes in this project took up to 3 hours to run. Arc Marco Language (AML) programming in ArcInfo was used to run the processes over night to save time. Commands were written in a text editor and then linked together by running an AML within an AML. Selecting each permit area individually from the statewide deer management unit shapefile DMU25 created the individual permit area boundaries. The next step was to merge
4
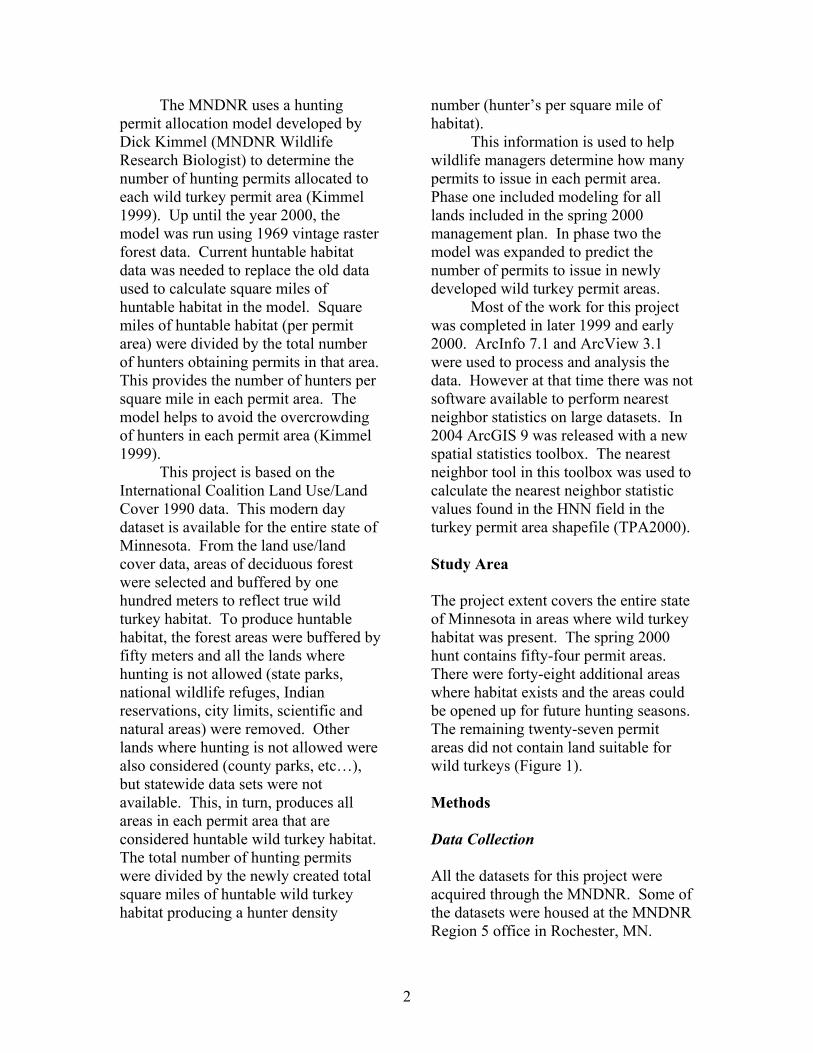
all non-huntable lands coverages together to produce a statewide non-huntable coverage. This new coverage was clipped with each individual permit area to produce non-huntable land coverage for that permit area. To make the forest coverages, the deciduous forest polygons were selected from the land use/land cover coverage. Next, the county forest coverages were merged together to form regional forest coverages. Then, the turkey permit areas were used to clip the regional deciduous forest coverages to the permit area level (Figure 2). Based on field knowledge of the MNDNR wildlife managers, wild turkeys tend to travel an average of one hundred meters from forested areas (Nelson 1999). As a result the next logical step was to buffer all the forest polygons by one hundred meters to create a turkey habitat coverage.
Figure 2. Forest polygons. When buffering forest polygons, the buffer extended out into all different landuse types including water. However, turkeys tend to not be very good swimmers, so statewide lakes coverage was used to erase the buffer areas that extended into the bodies of
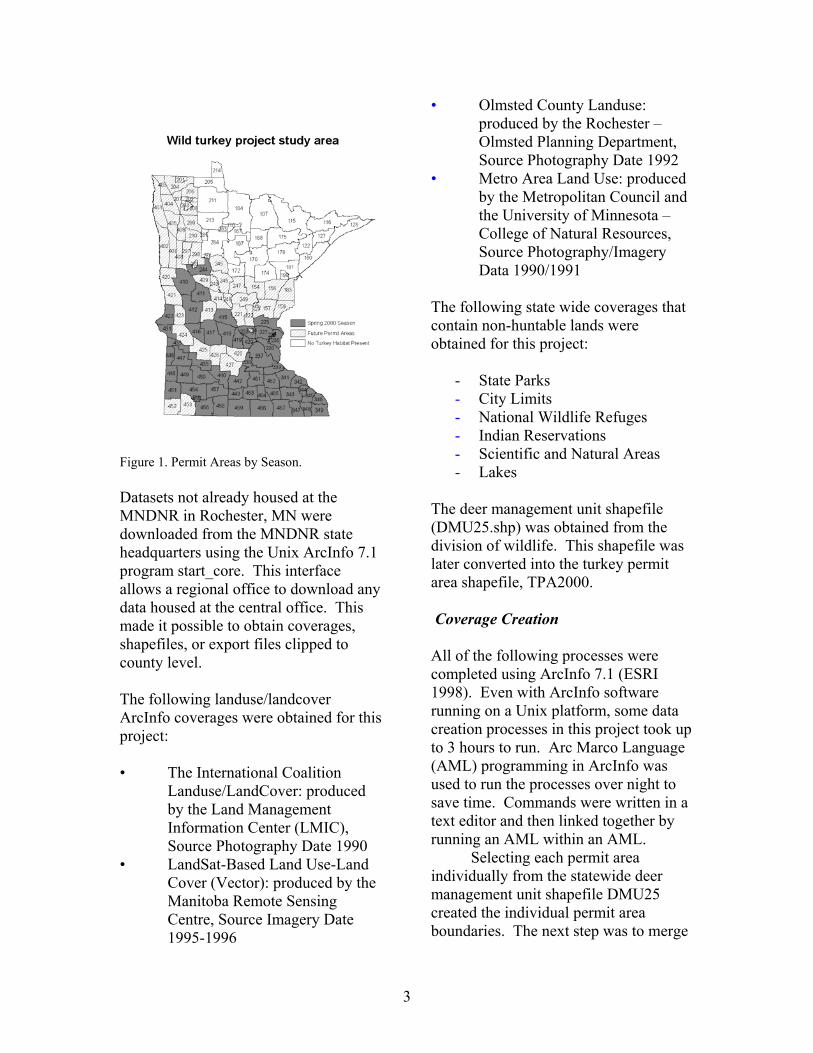
water. The buffer also extended outside of the permit area. Clipping the buffered forest coverage with each individual permit area boundary solves this problem (Figure 3).
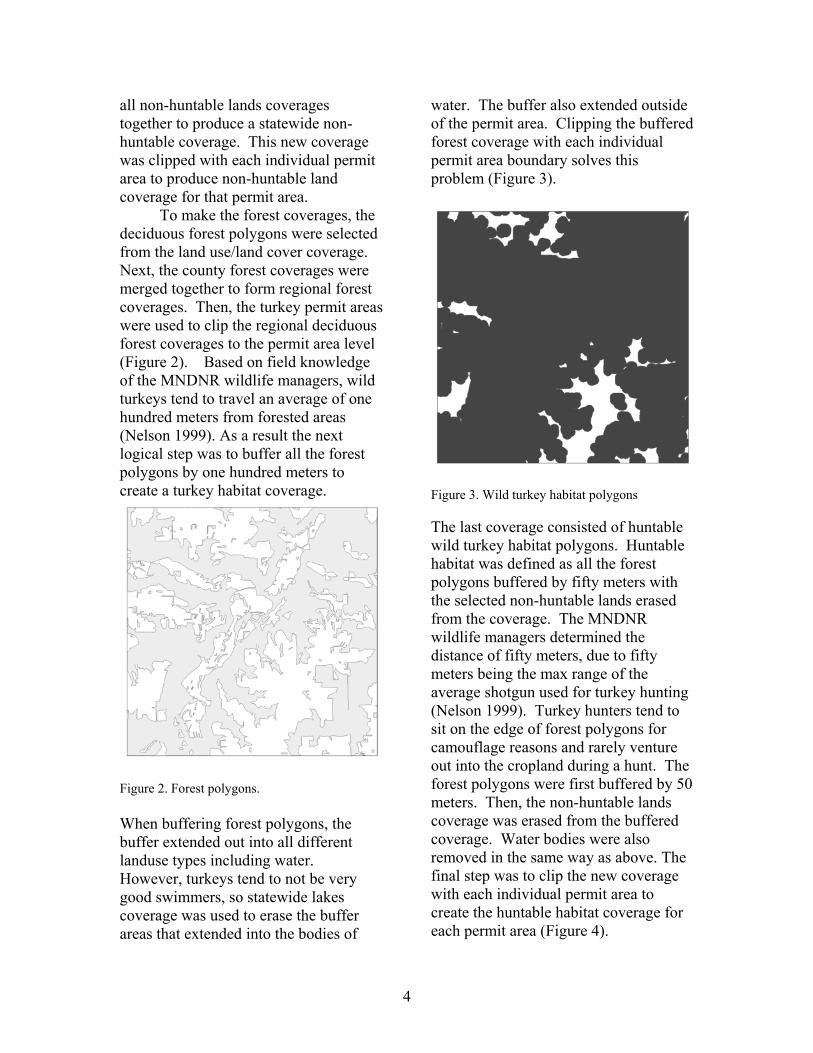
Figure 3. Wild turkey habitat polygons The last coverage consisted of huntable wild turkey habitat polygons. Huntable habitat was defined as all the forest polygons buffered by fifty meters with the selected non-huntable lands erased from the coverage. The MNDNR wildlife managers determined the distance of fifty meters, due to fifty meters being the max range of the average shotgun used for turkey hunting (Nelson 1999). Turkey hunters tend to sit on the edge of forest polygons for camouflage reasons and rarely venture out into the cropland during a hunt. The forest polygons were first buffered by 50 meters. Then, the non-huntable lands coverage was erased from the buffered coverage. Water bodies were also removed in the same way as above. The final step was to clip the new coverage with each individual permit area to create the huntable habitat coverage for each permit area (Figure 4).
5
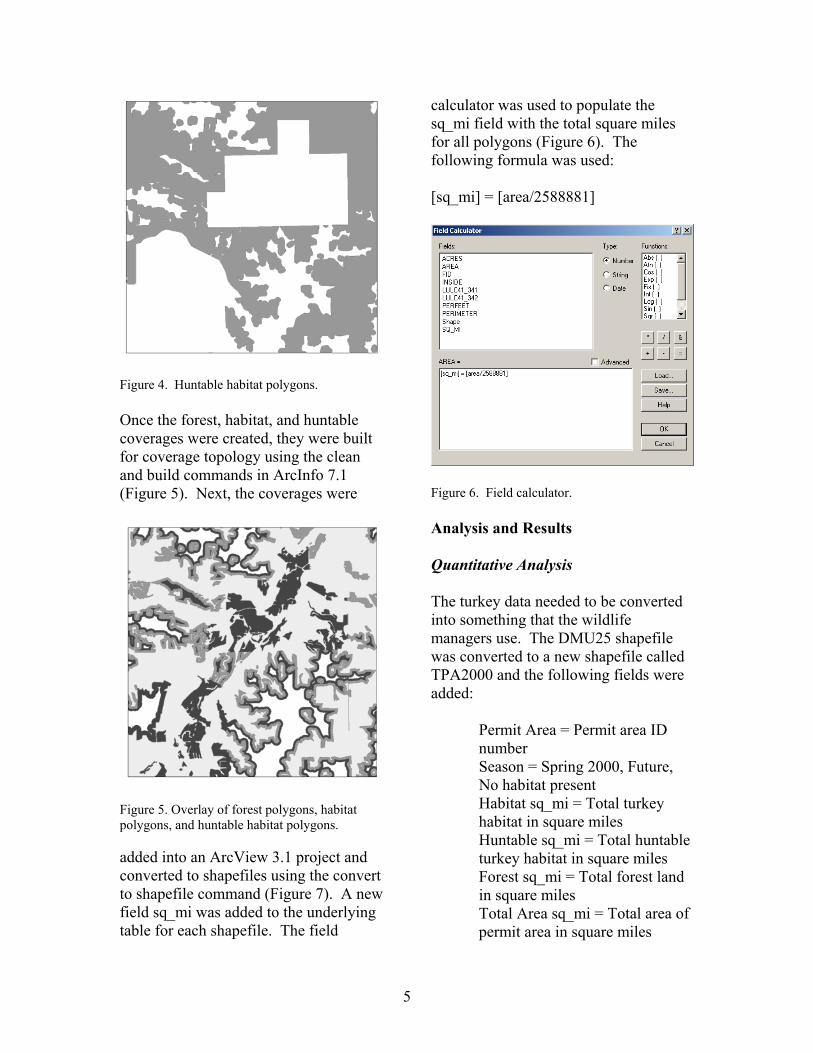
Figure 4. Huntable habitat polygons. Once the forest, habitat, and huntable coverages were created, they were built for coverage topology using the clean and build commands in ArcInfo 7.1 (Figure 5). Next, the coverages were
Figure 5. Overlay of forest polygons, habitat polygons, and huntable habitat polygons. added into an ArcView 3.1 project and converted to shapefiles using the convert to shapefile command (Figure 7). A new field sq_mi was added to the underlying table for each shapefile. The field
calculator was used to populate the sq_mi field with the total square miles for all polygons (Figure 6). The following formula was used: [sq_mi] = [area/2588881]
Figure 6. Field calculator. Analysis and Results Quantitative Analysis The turkey data needed to be converted into something that the wildlife managers use. The DMU25 shapefile was converted to a new shapefile called TPA2000 and the following fields were added:
Permit Area = Permit area ID number Season = Spring 2000, Future, No habitat present Habitat sq_mi = Total turkey habitat in square miles Huntable sq_mi = Total huntable turkey habitat in square miles Forest sq_mi = Total forest land in square miles Total Area sq_mi = Total area of permit area in square miles
6
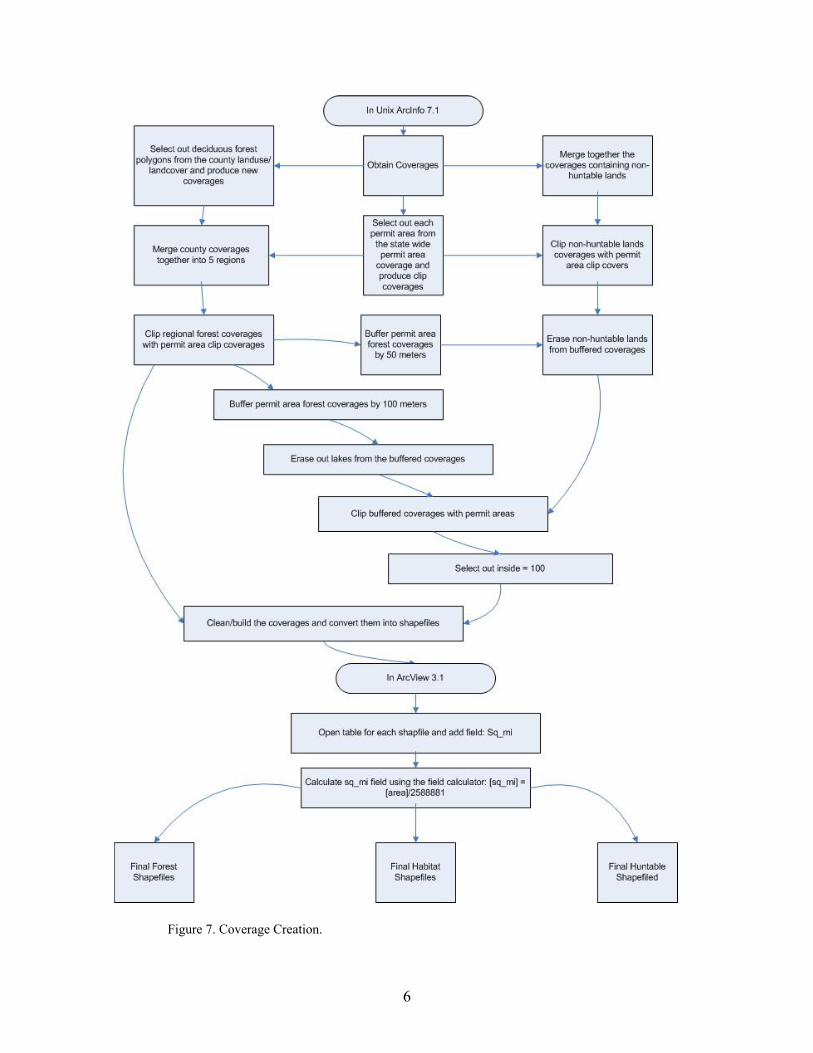
Figure 7. Coverage Creation.
7
% Habitat = Percent turkey habitat (Habitat sq_mi/ Total Area sq_mi) % Huntable = Percent huntable turkey habitat (Huntable sq_mi/ Total Area sq_mi) % Forest = Percent forest land (Huntable sq_mi/ Total Area sq_mi) Hd_ = Habitat distribution factor (from hunting permit allocation model) HR = Habitat ratio (Habitat sq_mi/ Forest sq_mi) HNN = Habitat nearest neighbor (Calculated with ArcGIS 9)
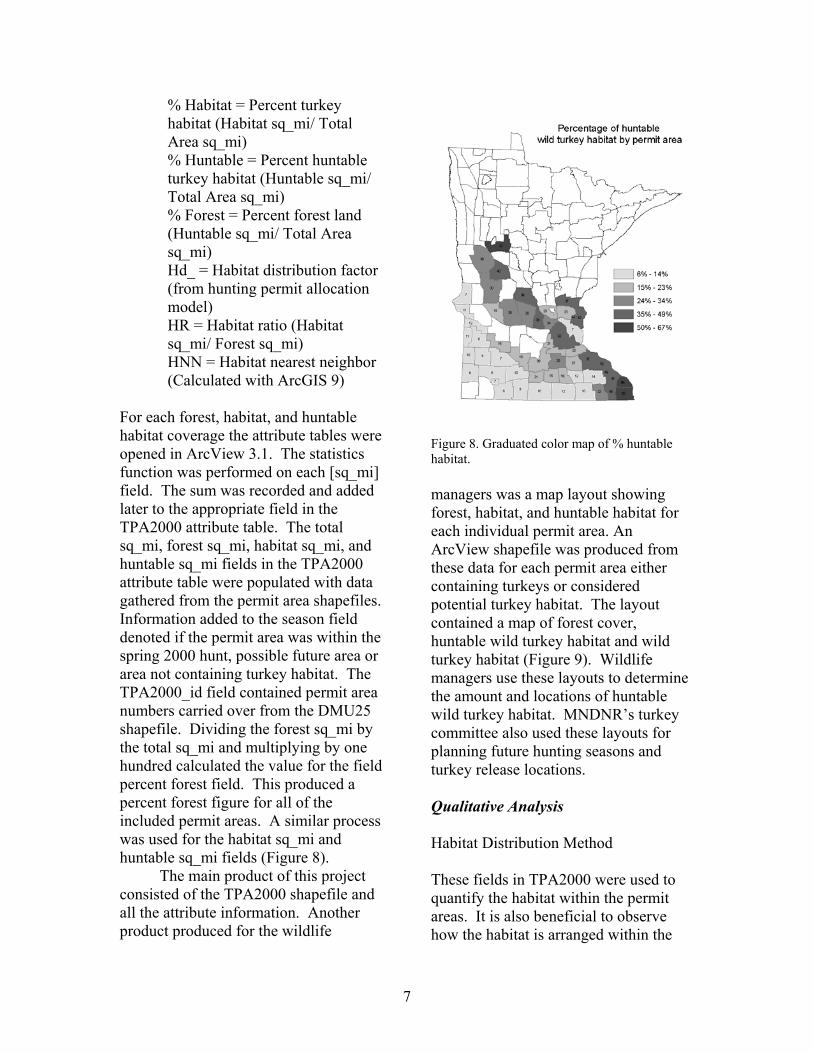
For each forest, habitat, and huntable habitat coverage the attribute tables were opened in ArcView 3.1. The statistics function was performed on each [sq_mi] field. The sum was recorded and added later to the appropriate field in the TPA2000 attribute table. The total sq_mi, forest sq_mi, habitat sq_mi, and huntable sq_mi fields in the TPA2000 attribute table were populated with data gathered from the permit area shapefiles. Information added to the season field denoted if the permit area was within the spring 2000 hunt, possible future area or area not containing turkey habitat. The TPA2000_id field contained permit area numbers carried over from the DMU25 shapefile. Dividing the forest sq_mi by the total sq_mi and multiplying by one hundred calculated the value for the field percent forest field. This produced a percent forest figure for all of the included permit areas. A similar process was used for the habitat sq_mi and huntable sq_mi fields (Figure 8). The main product of this project consisted of the TPA2000 shapefile and all the attribute information. Another product produced for the wildlife
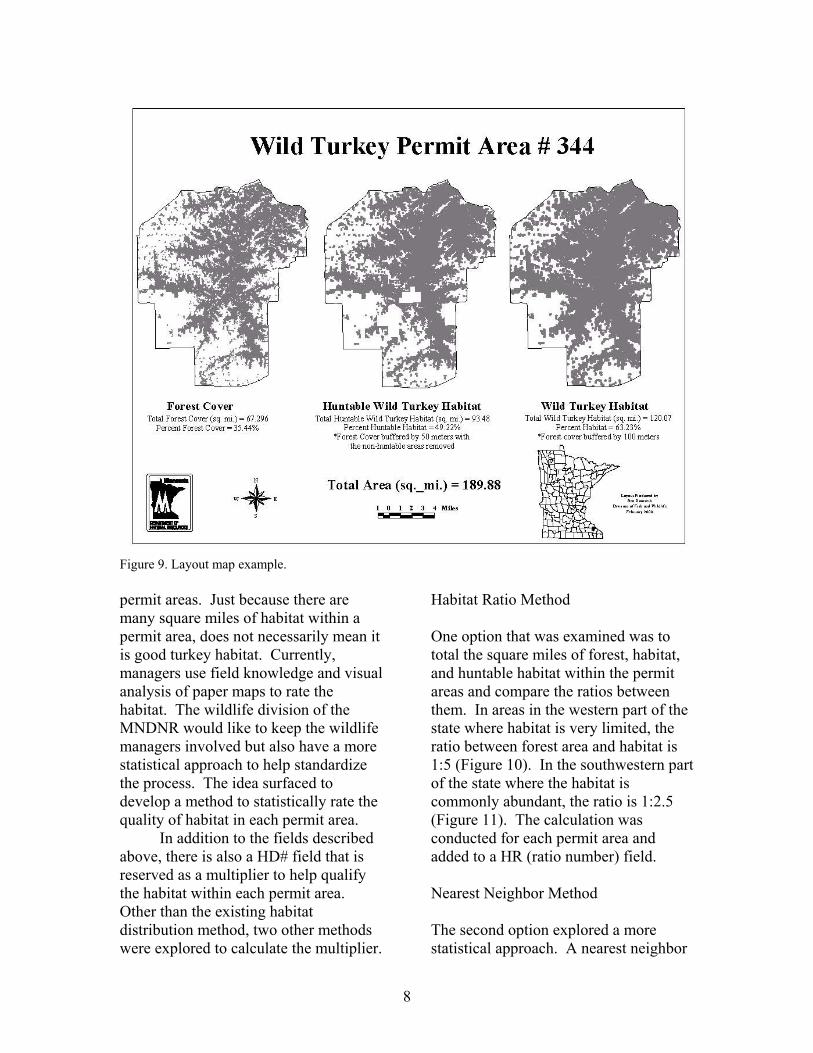
Figure 8. Graduated color map of % huntable habitat. managers was a map layout showing forest, habitat, and huntable habitat for each individual permit area. An ArcView shapefile was produced from these data for each permit area either containing turkeys or considered potential turkey habitat. The layout contained a map of forest cover, huntable wild turkey habitat and wild turkey habitat (Figure 9). Wildlife managers use these layouts to determine the amount and locations of huntable wild turkey habitat. MNDNR’s turkey committee also used these layouts for planning future hunting seasons and turkey release locations. Qualitative Analysis Habitat Distribution Method These fields in TPA2000 were used to quantify the habitat within the permit areas. It is also beneficial to observe how the habitat is arranged within the
8
Figure 9. Layout map example. permit areas. Just because there are many square miles of habitat within a permit area, does not necessarily mean it is good turkey habitat. Currently, managers use field knowledge and visual analysis of paper maps to rate the habitat. The wildlife division of the MNDNR would like to keep the wildlife managers involved but also have a more statistical approach to help standardize the process. The idea surfaced to develop a method to statistically rate the quality of habitat in each permit area. In addition to the fields described above, there is also a HD# field that is reserved as a multiplier to help qualify the habitat within each permit area. Other than the existing habitat distribution method, two other methods were explored to calculate the multiplier.
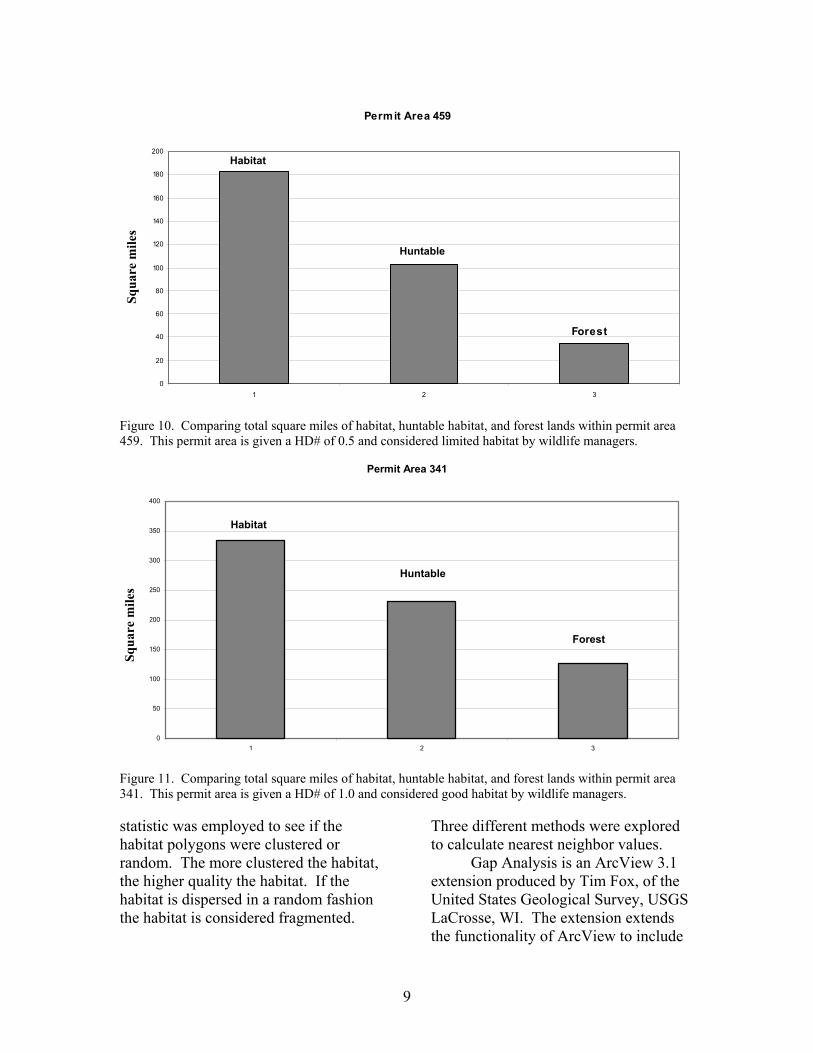
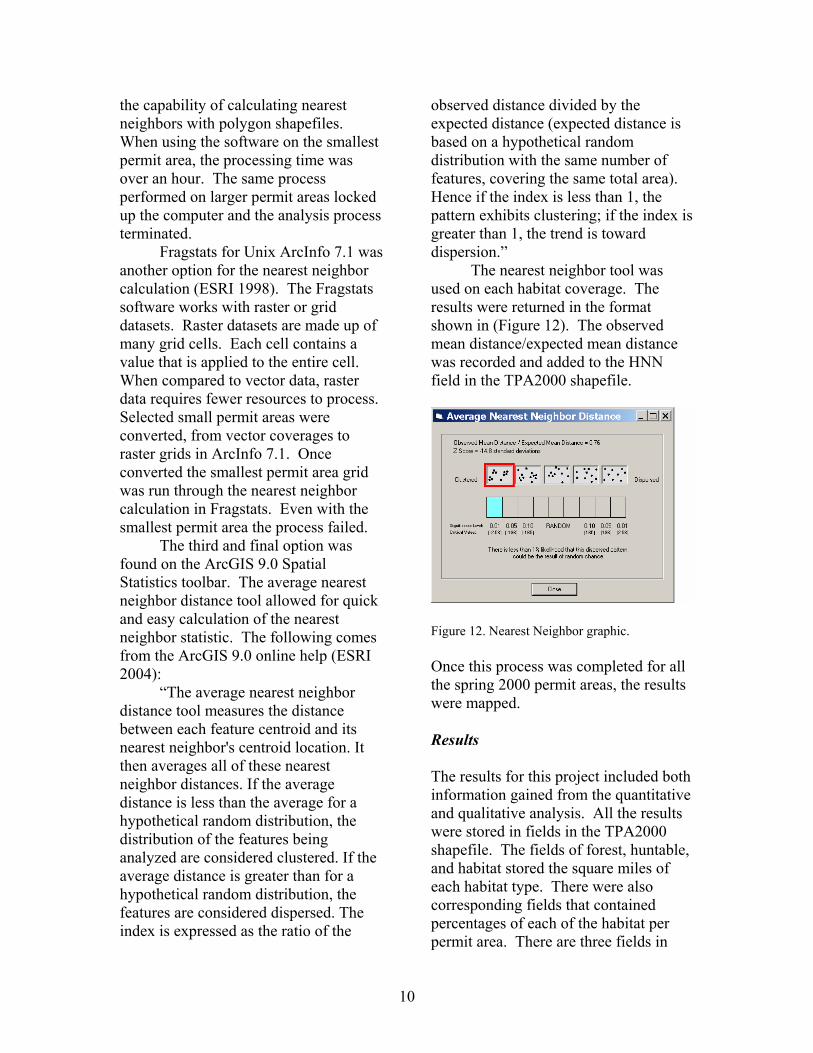
Habitat Ratio Method One option that was examined was to total the square miles of forest, habitat, and huntable habitat within the permit areas and compare the ratios between them. In areas in the western part of the state where habitat is very limited, the ratio between forest area and habitat is 1:5 (Figure 10). In the southwestern part of the state where the habitat is commonly abundant, the ratio is 1:2.5 (Figure 11). The calculation was conducted for each permit area and added to a HR (ratio number) field. Nearest Neighbor Method The second option explored a more statistical approach. A nearest neighbor
9
Permit Area 459
0
20
40
60
80
100
120
140
160
180
200
1 2 3
Habitat
Huntable
Forest
Figure 10. Comparing total square miles of habitat, huntable habitat, and forest lands within permit area 459. This permit area is given a HD# of 0.5 and considered limited habitat by wildlife managers.
Permit Area 341
0
50
100
150
200
250
300
350
400
1 2 3
Squa
re m
iles
Forest
Huntable
Habitat
Figure 11. Comparing total square miles of habitat, huntable habitat, and forest lands within permit area 341. This permit area is given a HD# of 1.0 and considered good habitat by wildlife managers. statistic was employed to see if the habitat polygons were clustered or random. The more clustered the habitat, the higher quality the habitat. If the habitat is dispersed in a random fashion the habitat is considered fragmented.
Three different methods were explored to calculate nearest neighbor values. Gap Analysis is an ArcView 3.1 extension produced by Tim Fox, of the United States Geological Survey, USGS LaCrosse, WI. The extension extends the functionality of ArcView to include
Squa
re m
iles
Huntable
Squa
re m
iles
Habitat
10
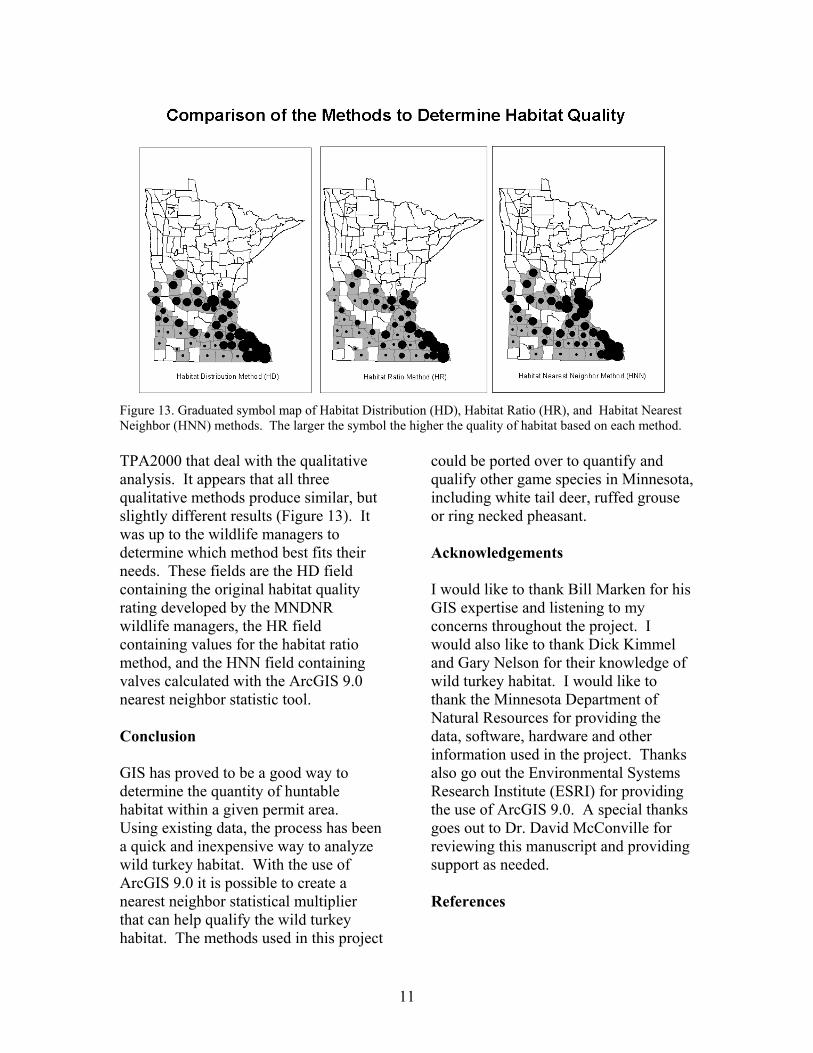
the capability of calculating nearest neighbors with polygon shapefiles. When using the software on the smallest permit area, the processing time was over an hour. The same process performed on larger permit areas locked up the computer and the analysis process terminated. Fragstats for Unix ArcInfo 7.1 was another option for the nearest neighbor calculation (ESRI 1998). The Fragstats software works with raster or grid datasets. Raster datasets are made up of many grid cells. Each cell contains a value that is applied to the entire cell. When compared to vector data, raster data requires fewer resources to process. Selected small permit areas were converted, from vector coverages to raster grids in ArcInfo 7.1. Once converted the smallest permit area grid was run through the nearest neighbor calculation in Fragstats. Even with the smallest permit area the process failed. The third and final option was found on the ArcGIS 9.0 Spatial Statistics toolbar. The average nearest neighbor distance tool allowed for quick and easy calculation of the nearest neighbor statistic. The following comes from the ArcGIS 9.0 online help (ESRI 2004): “The average nearest neighbor distance tool measures the distance between each feature centroid and its nearest neighbor's centroid location. It then averages all of these nearest neighbor distances. If the average distance is less than the average for a hypothetical random distribution, the distribution of the features being analyzed are considered clustered. If the average distance is greater than for a hypothetical random distribution, the features are considered dispersed. The index is expressed as the ratio of the
observed distance divided by the expected distance (expected distance is based on a hypothetical random distribution with the same number of features, covering the same total area). Hence if the index is less than 1, the pattern exhibits clustering; if the index is greater than 1, the trend is toward dispersion.” The nearest neighbor tool was used on each habitat coverage. The results were returned in the format shown in (Figure 12). The observed mean distance/expected mean distance was recorded and added to the HNN field in the TPA2000 shapefile.
Figure 12. Nearest Neighbor graphic. Once this process was completed for all the spring 2000 permit areas, the results were mapped. Results The results for this project included both information gained from the quantitative and qualitative analysis. All the results were stored in fields in the TPA2000 shapefile. The fields of forest, huntable, and habitat stored the square miles of each habitat type. There were also corresponding fields that contained percentages of each of the habitat per permit area. There are three fields in
11
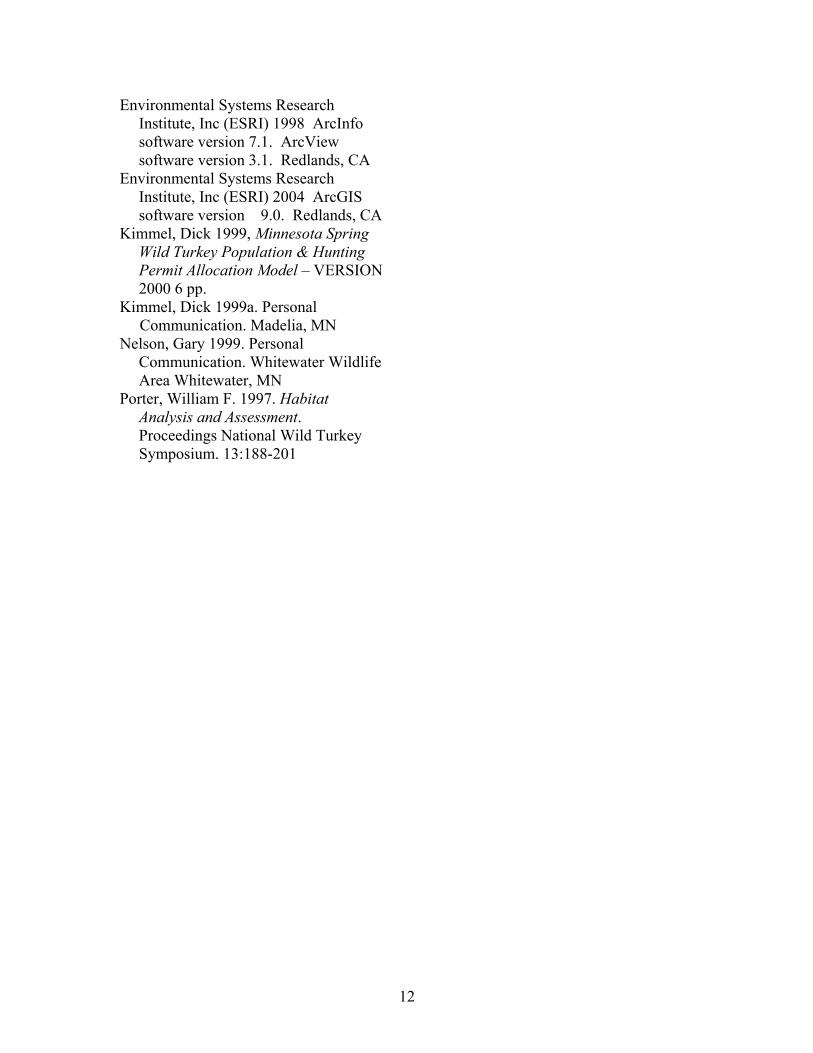
Figure 13. Graduated symbol map of Habitat Distribution (HD), Habitat Ratio (HR), and Habitat Nearest Neighbor (HNN) methods. The larger the symbol the higher the quality of habitat based on each method. TPA2000 that deal with the qualitative analysis. It appears that all three qualitative methods produce similar, but slightly different results (Figure 13). It was up to the wildlife managers to determine which method best fits their needs. These fields are the HD field containing the original habitat quality rating developed by the MNDNR wildlife managers, the HR field containing values for the habitat ratio method, and the HNN field containing valves calculated with the ArcGIS 9.0 nearest neighbor statistic tool. Conclusion GIS has proved to be a good way to determine the quantity of huntable habitat within a given permit area. Using existing data, the process has been a quick and inexpensive way to analyze wild turkey habitat. With the use of ArcGIS 9.0 it is possible to create a nearest neighbor statistical multiplier that can help qualify the wild turkey habitat. The methods used in this project
could be ported over to quantify and qualify other game species in Minnesota, including white tail deer, ruffed grouse or ring necked pheasant. Acknowledgements I would like to thank Bill Marken for his GIS expertise and listening to my concerns throughout the project. I would also like to thank Dick Kimmel and Gary Nelson for their knowledge of wild turkey habitat. I would like to thank the Minnesota Department of Natural Resources for providing the data, software, hardware and other information used in the project. Thanks also go out the Environmental Systems Research Institute (ESRI) for providing the use of ArcGIS 9.0. A special thanks goes out to Dr. David McConville for reviewing this manuscript and providing support as needed. References
12
Environmental Systems Research Institute, Inc (ESRI) 1998 ArcInfo software version 7.1. ArcView software version 3.1. Redlands, CA
Environmental Systems Research Institute, Inc (ESRI) 2004 ArcGIS software version 9.0. Redlands, CA
Kimmel, Dick 1999, Minnesota Spring Wild Turkey Population & Hunting Permit Allocation Model – VERSION 2000 6 pp.
Kimmel, Dick 1999a. Personal Communication. Madelia, MN Nelson, Gary 1999. Personal
Communication. Whitewater Wildlife Area Whitewater, MN
Porter, William F. 1997. Habitat Analysis and Assessment. Proceedings National Wild Turkey Symposium. 13:188-201