Embed Size (px)
Citation preview
1
An Economic and Policy Analysis of the Market for Methylphenidate and Amphetamine
Rick MayesUniversity of Richmond
Farasat Bokhari University of California, Berkeley
NRSA Conference, November 2002National Institutes of Health

2
Background & Significance• What is ADHD?
– behavioral disorder marked by excessive inattentiveness and/or hyperactivity-impulsivity
• So what? Why should anybody care?– the most commonly diagnosed behavioral disorder in children– ~ 3-5% of school-age children have the disorder; some estimates range as high
as 7-12% (range: 1.5-6 million kids)– ~ 75-80% of children diagnosed with ADHD are treated with psychostimulant
drugs– most powerful, addictive drugs that are legal (classified as Schedule II by Drug
Enforcement Administration, DEA)– Society for Neuroscience (2001): Long term use may change the genetic
composition of the brain– ~ $1 billion spent in 2000 on ADHD related drugs
3
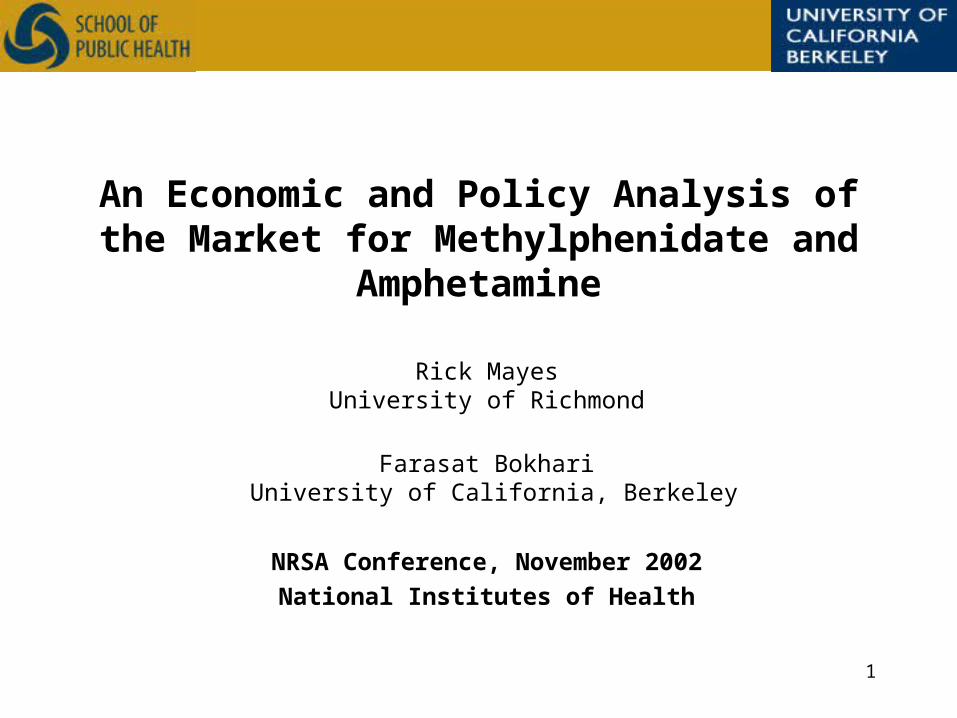
Diagnostic and Prescribing Trends• 400% increase in ADHD diagnoses in 1990s:
– 1990 approximately 800,000 to 950,000 children diagnosed with ADHD
– 2000 approximately 4 to 5 million children diagnosed with ADHD
• Production and prescriptions of methylphenidate and amphetamine for treatment of ADHD have increased by about 800-900% since 1991.Stimulant Prescriptions for ADHD (millions), 1991-2000
0
5
10
15
20
91 92 93 94 95 96 97 98 99 2000
Year
Millions
Prescriptions

4
Per Capita Ritalin Use Over Time (1981-1996)
5
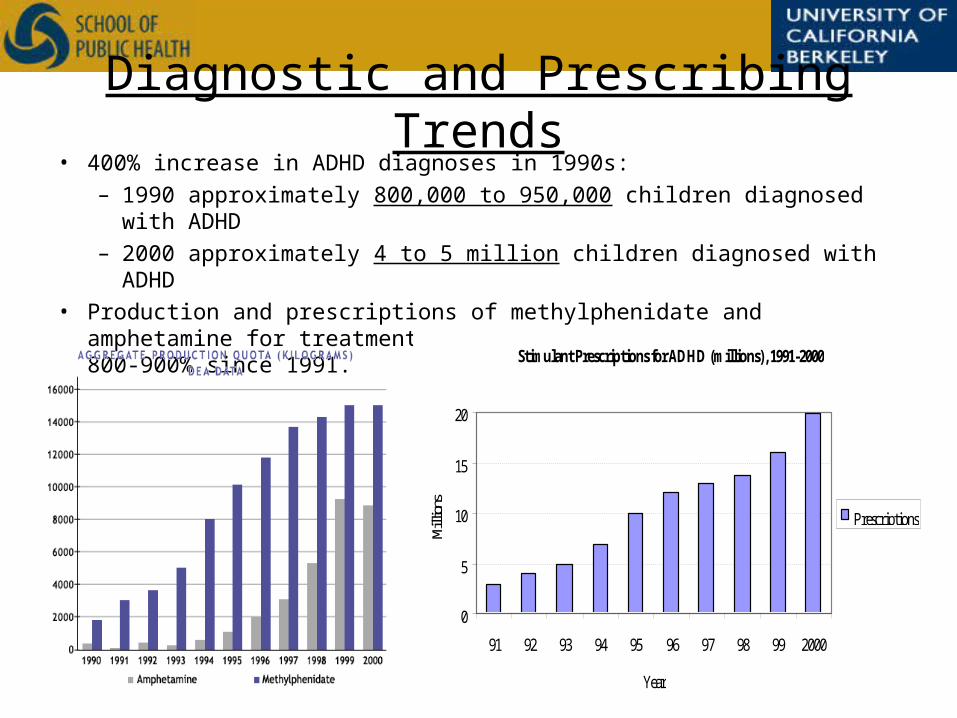
0 to 1600 Low (4.6%)1600 to 3150 Below Average (25.5%)3150 to 5150 Average (43.5%)5150 to 6750 Above Average (19.6%)6750 to 8350 High (4.9%)
grams/per 10,000 Individuals
8350 to 11000 Extremely High (1.8%)
Methylphenidate and Amphetamine Distribution, 2000 (DEA data)
(average=4,150 grams/100,000 individuals)
6
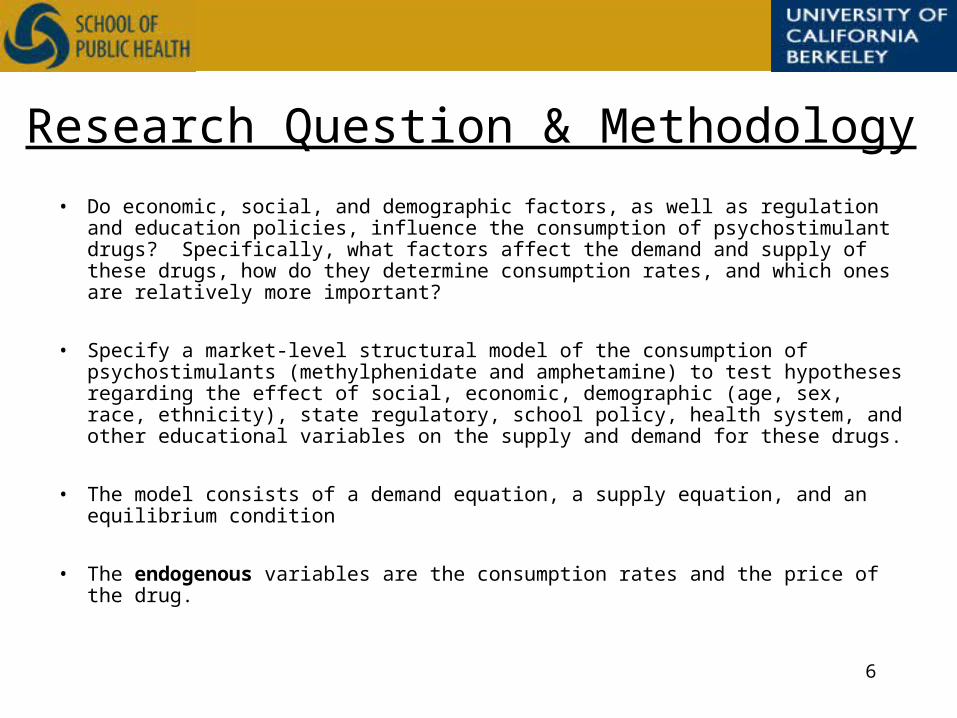
Research Question & Methodology
• Do economic, social, and demographic factors, as well as regulation and education policies, influence the consumption of psychostimulant drugs? Specifically, what factors affect the demand and supply of these drugs, how do they determine consumption rates, and which ones are relatively more important?
• Specify a market-level structural model of the consumption of psychostimulants (methylphenidate and amphetamine) to test hypotheses regarding the effect of social, economic, demographic (age, sex, race, ethnicity), state regulatory, school policy, health system, and other educational variables on the supply and demand for these drugs.
• The model consists of a demand equation, a supply equation, and an equilibrium condition
• The endogenous variables are the consumption rates and the price of the drug.
7
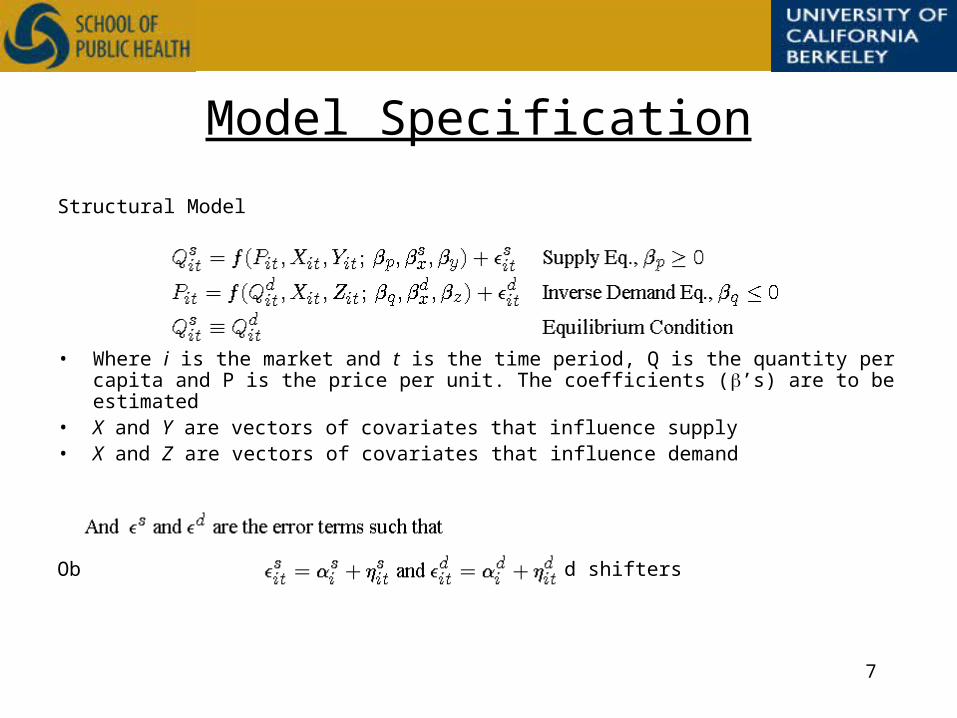
Model Specification
Structural Model
• Where i is the market and t is the time period, Q is the quantity per capita and P is the price per unit. The coefficients (’s) are to be estimated
• X and Y are vectors of covariates that influence supply• X and Z are vectors of covariates that influence demand
Objective: Test hypotheses regarding demand shifters

8
Market Analysis: Exogenous Variables
• Vector Z (exogenous variables in demand equation)– Economic factors (per capita income, unemployment rate) – Demographic Variables (e.g. population density, percent children, gender ratios, race-
ethnic mix)– Educational Policies and School Characteristics (e.g. student attributes, instructional
capacity and resources, instructional structure, teacher accountability and/or financial rewards)
– Medical community (e.g., physicians by specialty, age and experience)
• Vector Y (exogenous variables in supply equation)– Competition among pharmacies (pharmacies per capita),state laws regulating the
interaction between HMOs, providers and pharmacies
• Vector X (exogenous variables in both equations)– State Regulations re monitoring Schedule II drugs; presence of managed care, (HMO
penetration and # of HMOs)
9
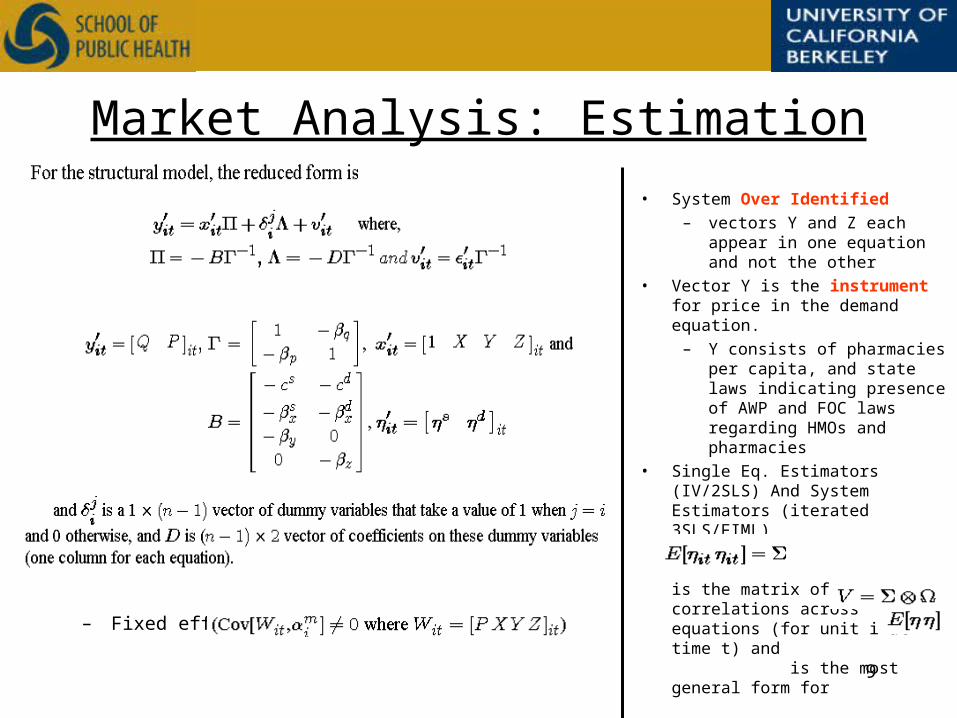
Market Analysis: Estimation
– Fixed effects
• System Over Identified
– vectors Y and Z each appear in one equation and not the other
• Vector Y is the instrument for price in the demand equation.
– Y consists of pharmacies per capita, and state laws indicating presence of AWP and FOC laws regarding HMOs and pharmacies
• Single Eq. Estimators (IV/2SLS) And System Estimators (iterated 3SLS/FIML)
is the matrix of correlations across equations (for unit i at time t) and is the most general form for
10
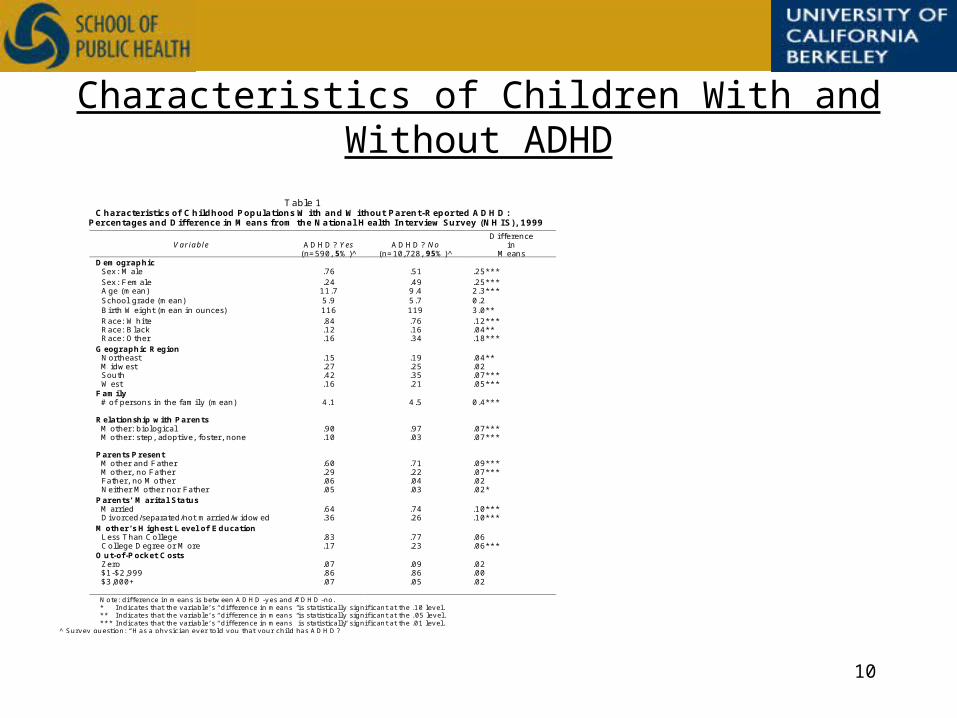
Characteristics of Children With and Without ADHD
T a b le 1 C h a r a c te r is t ic s o f C h i ld h o o d P o p u la t io n s W ith a n d W ith o u t P a r e n t -R e p o r te d A D H D :
P e r c e n ta g e s a n d D if fe r e n c e in M e a n s fr o m th e N a tio n a l H e a lth In te r v ie w S u r v e y (N H IS ) , 1 9 9 9
V a r ia b le
A D H D ? Y es
( n = 5 9 0 , 5 % )^
A D H D ? N o
( n = 1 0 ,7 2 8 , 9 5 % )^
D iffe re n ce in
M e an s D e m o g r a p h ic S e x : M ale .7 6 .5 1
.2 5 * * *
S e x : F e m ale .2 4 .4 9 .2 5 * * * A g e (m e an ) 1 1 .7 9 .4
2 .3 * * * S ch o o l g ra d e (m e a n ) 5 .9 5 .7
0 .2 B i rth W e ig h t (m e a n in o u n ce s) 1 1 6 1 1 9
3 .0 * *
R a ce : W h i te .8 4 .7 6 .1 2 * * * R a ce : B la ck .1 2 .1 6 .0 4 * * R a ce : O th e r
.1 6 .3 4
.1 8 * * *
G e o g r a p h ic R eg io n N o rth e as t .1 5 .1 9 .0 4 * * M id w e st .2 7 .2 5 .0 2 S o u th .4 2 .3 5 .0 7 * * * W es t .1 6 .2 1
.0 5 * * * F a m ily # o f p e r s o n s in th e fa m ily (m e a n ) 4 .1 4 .5 0 .4 * * * R e la t io n s h ip w ith P a r en ts M o th e r : b io lo g ica l .9 0 .9 7 .0 7 * * * M o th e r : s tep , ad o p t iv e , fo s te r , n o n e .1 0 .0 3 .0 7 * * * P a r e n ts P re s e n t M o th e r a n d F a th e r .6 0 .7 1 .0 9 * * * M o th e r, n o F a th e r .2 9 .2 2 .0 7 * * * F a th e r, n o M o th e r .0 6 .0 4 .0 2 N e ith e r M o th e r n o r F a th er
.0 5 .0 3
.0 2 *
P a r e n ts’ M a r ita l S ta tu s M ar rie d .6 4 .7 4 .1 0 * * * D iv o rce d /s e p a ra te d /n o t m ar rie d /w id o w e d
.3 6 .2 6 .1 0 * * *
M o th e r’ s H ig h e st L e v e l o f E d u c a tio n L e ss T h a n C o l le g e .8 3 .7 7 .0 6 C o lle g e D e g re e o r M o re
.1 7 .2 3 .0 6 * * * O u t-o f -P o c k e t C o s t s Z e ro .0 7 .0 9 .0 2 $ 1 -$ 2 ,9 9 9 .8 6 .8 6 .0 0 $ 3 ,0 0 0 + .0 7 .0 5 .0 2
N o t e : d i f fe r e n ce i n m e a n s i s b e t w e e n A D H D -y e s a n d A D H D -n o . * I n d i c a t e s t h a t th e v a r ia b l e ’ s “ d i f fe r e n c e i n m e a n s” i s s ta ti s t i c a ll y s ig n i f i c a n t a t t h e .1 0 le v e l. * * I n d i c a t e s t h a t th e v a r ia b l e ’ s “ d i f fe r e n c e i n m e a n s” i s s ta ti s t i c a ll y s ig n i f i c a n t a t t h e . 0 5 le v e l . * * * I n d i c a t e s t h a t th e v a r ia b l e ’ s “ d i f fe r e n c e i n m e a n s” i s s ta ti s t i c a ll y s ig n i f i c a n t a t t h e .0 1 le v e l.
^ S u rv e y q u e sti o n : “ H a s a p h y s ic ia n e v e r t o ld y o u t h a t y o u r c h il d h a s A D H D ? ”
11
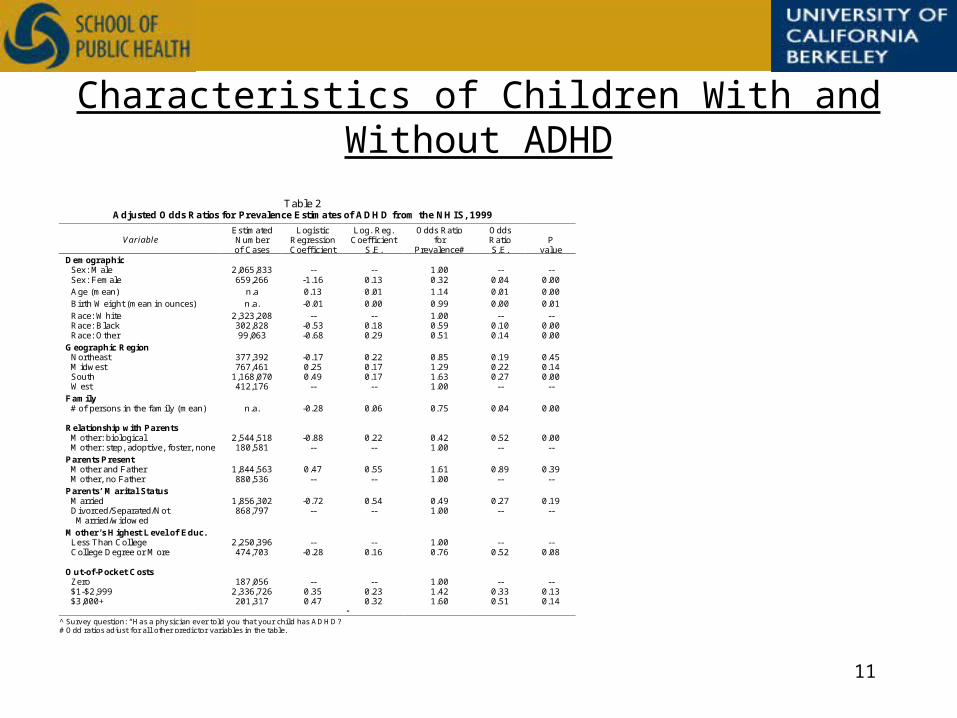
Characteristics of Children With and Without ADHD
Table 2 Adjusted O dds Ratios for Prevalence Estim ates of ADH D fr om the NH IS, 1999
Variable
Estim ated Num ber of Cases
Logistic Regression Coefficient
Log. Reg. Coefficient
S.E .
Odds Ratio for
Prevalence#
Odds Ratio S.E.
P
value Dem ographic Sex: M ale 2,065,833 -- -- 1.00 -- -- Sex: Fem ale
659,266 -1.16 0.13 0.32 0.04 0.00 Age (m ean)
n.a 0.13 0.01 1.14 0.01 0.00
Birth W eight (m ean in ounces)
n.a. -0.01 0.00 0.99 0.00 0.01
Race: W hite 2,323,208 -- -- 1.00 -- -- Race: Black 302,828 -0.53 0.18 0.59 0.10 0.00 Race: O ther
99,063 -0.68 0.29 0.51 0.14 0.00
G eographic Region Northeast 377,392 -0.17 0.22 0.85 0.19 0.45 M idwest 767,461 0.25 0.17 1.29 0.22 0.14 South 1,168,070 0.49 0.17 1.63 0.27 0.00 W est
412,176 -- -- 1.00 -- --
F amily # of persons in the fam ily (m ean) n.a. -0.28 0.06 0.75 0.04 0.00 Relationship with Parents M other: biological 2,544,518 -0.88 0.22 0.42 0.52 0.00 M other: step, adoptive, foster, none
180,581 -- -- 1.00 -- --
P arents P resent M other and Father 1,844,563 0.47 0.55 1.61 0.89 0.39 M other, no Father
880,536 -- -- 1.00 -- --
P arents’ M arital Status M arried 1,856,302 -0.72 0.54 0.49 0.27 0.19 Divorced/Separated/Not M arried/widowed
868,797 -- -- 1.00 -- --
M other’s H ighest Level of Educ. Less Than College 2,250,396 -- -- 1.00 -- -- College Degree or M ore 474,703 -0.28 0.16 0.76 0.52 0.08 O ut-of-P ocket Costs Zero 187,056 -- -- 1.00 -- -- $1-$2,999 2,336,726 0.35 0.23 1.42 0.33 0.13 $3,000+ 201,317 0.47 0.32 1.60 0.51 0.14
^ Survey qu estion: “H a s a physician ever told you that your child ha s AD H D ?” # O dd ratios a djust for a ll other predictor varia bles in the table.

12
Counties With Low and High Ritalin Use
a b l e 4 P s y c h o s t i m u l a n t C o n s u m p t i o n R a t e s ( M e t h y l p h e n i d a t e a n d A m p h e t a m i n e C o m b i n e d ) :
D i f f e r e n c e s i n M e a n s f o r a l l U . S . C o u n t i e s , 1 9 9 9
V a r i a b l e
L o w D i s t r i b u t i o n ( n = 1 , 0 1 7 c o u n t i e s )
H i g h D i s t r i b u t i o n ( n = 1 , 0 1 7 c o u n t i e s )
C o n s u m p t i o n R a t e , G r a m s / p e r 1 0 0 , 0 0 0 I n d i v i d u a l s * * * ( m e a n f o r a l l 3 , 0 3 4 U . S . c o u n t i e s )
1 , 3 1 7 g r a m s / 1 0 0 K ( 4 , 0 4 1 g r a m s / 1 0 0 K )
6 , 7 6 5 g r a m s / 1 0 0 K ( 4 , 0 4 1 g r a m s / 1 0 0 k )
T o t a l P o p u l a t i o n * * *
3 3 , 7 9 6 1 4 5 , 4 0 0
U n e m p l o y m e n t R a t e * * *
5 . 5 %
4 . 4 %
W h i t e P o p u l a t i o n a s P e r c e n t a g e o f T o t a l P o p u l a t i o n * * *
8 7 . 1 % 8 8 . 6 %
B l a c k P o p u l a t i o n a s P e r c e n t a g e o f T o t a l P o p u l a t i o n * *
1 0 . 4 % 9 . 0 %
O t h e r R a c e s a s P e r c e n t a g e o f t h e T o t a l P o p u l a t i o n
2 . 5 % 2 . 4 %
B o y s - t o - G i r l s R a t i o * * *
1 0 7 - t o - 1 0 0
1 0 6 - t o - 1 0 0
C h i l d r e n / A d o l e s c e n t s a s a P e r c e n t a g e o f t h e P o p u l a t i o n * * *
2 9 . 2 %
2 8 . 7 %
S t u d e n t s - t o - T e a c h e r R a t i o * * *
1 4 . 4 - t o - 1
1 5 . 3 - t o - 1
H M O E n r o l l m e n t a s P e r c e n t a g e o f I n s u r a n c e M a r k e t * * *
9 . 0 %
1 5 . 3 %
N u m b e r o f H M O s O p e r a t i n g * * *
3 . 0 5 . 0
M D s / p e r 1 0 0 , 0 0 0 I n d i v i d u a l s * * *
6 9
1 5 5
C h i l d P s y c h i a t r i s t s / p e r 1 0 0 , 0 0 0 I n d i v i d u a l s * * *
0 . 2 1 . 1
P s y c h i a t r i s t s / p e r 1 0 0 , 0 0 0 I n d i v i d u a l s * * *
2 7
G P s , F P s / p e r 1 0 0 , 0 0 0 I n d i v i d u a l s * * *
2 9 3 2
P e d i a t r i c i a n s / p e r 1 0 0 , 0 0 0 I n d i v i d u a l s * * *
4 1 2
N e u r o l o g i s t s / p e r 1 0 0 , 0 0 0 I n d i v i d u a l s * * *
0 . 5 3
C h i l d P s y c h i a t r i s t s a s P e r c e n t a g e o f T o t a l M D s * * *
0 . 2 % 0 . 6 %
P s y c h i a t r i s t s a s P e r c e n t a g e o f T o t a l M D s * * *
2 . 1 % 3 . 8 %
G P s , F P s a s P e r c e n t a g e o f T o t a l M D s * * *
5 1 . 0 % 3 1 . 7 %
P e d i a t r i c i a n s a s P e r c e n t a g e o f T o t a l M D s * * *
4 . 4 % 6 . 5 %
N e u r o l o g i s t s a s P e r c e n t a g e o f T o t a l M D s * * *
0 . 5 % 1 . 3 %
F e m a l e M D s a s P e r c e n t a g e o f T o t a l M D s * *
1 5 . 5 % 1 6 . 7 %
S o u r c e : N D C H e a l t h ’ s “ T e r r i t o r y M a n a g e r ” d a t a b a s e * I n d i c a t e s t h a t t h e v a r i a b l e ’ s “ d i f f e r e n c e i n m e a n s ” i s s t a t i s t i c a l l y s i g n i f i c a n t a t t h e . 1 0 l e v e l .