Embed Size (px)
Citation preview
11
ALM Seminar
Consultation on the Seventh Replenishment of IFAD’s Resources– 3rd Session Rome, 5 July 2005
22
ContentContent1.1. Asset Liability Management (ALM) in IFADAsset Liability Management (ALM) in IFAD
Current and proposed definition of committable resourcesCurrent and proposed definition of committable resources
22.. Track Record of FlowsTrack Record of Flows Contributions, loan reflows, investment income, disbursementsContributions, loan reflows, investment income, disbursements
3.3. Financial ScenariosFinancial Scenarios Cash inflows and outflowsCash inflows and outflows Liquidity projectionsLiquidity projections Stress testing and financial soundness indicators Stress testing and financial soundness indicators
4.4. Comparing IFAD to IFIsComparing IFAD to IFIs Financial soundness comparisonFinancial soundness comparison Liquidity policiesLiquidity policies Use of future loan reflows and resource structureUse of future loan reflows and resource structure
5.5. ConclusionsConclusions
July 2005 – Third session of the Consultation on the 7th replenishment of IFAD’s resources

33
Content of this section:Content of this section:
Role of ALM in IFADRole of ALM in IFAD
Current and proposed definition of committable resourcesCurrent and proposed definition of committable resources
Proposed definition from legal perspectiveProposed definition from legal perspective
Section 1. Asset Liability Management (ALM) in IFADSection 1. Asset Liability Management (ALM) in IFAD

44
Section 1. Asset Liability Management (ALM) in IFADSection 1. Asset Liability Management (ALM) in IFAD
IFAD’s mission isIFAD’s mission is to to “Enable the Rural Poor “Enable the Rural Poor to Overcome Poverty”to Overcome Poverty”
IFAD aims to efficiently IFAD aims to efficiently maximize maximize resources availableresources available to its borrowing to its borrowing Member States while Member States while maintaining IFAD’s maintaining IFAD’s financial soundnessfinancial soundness
This goal can be better achieved through dynamic management of IFAD’s committable resources within the context of Asset Liability Management
55
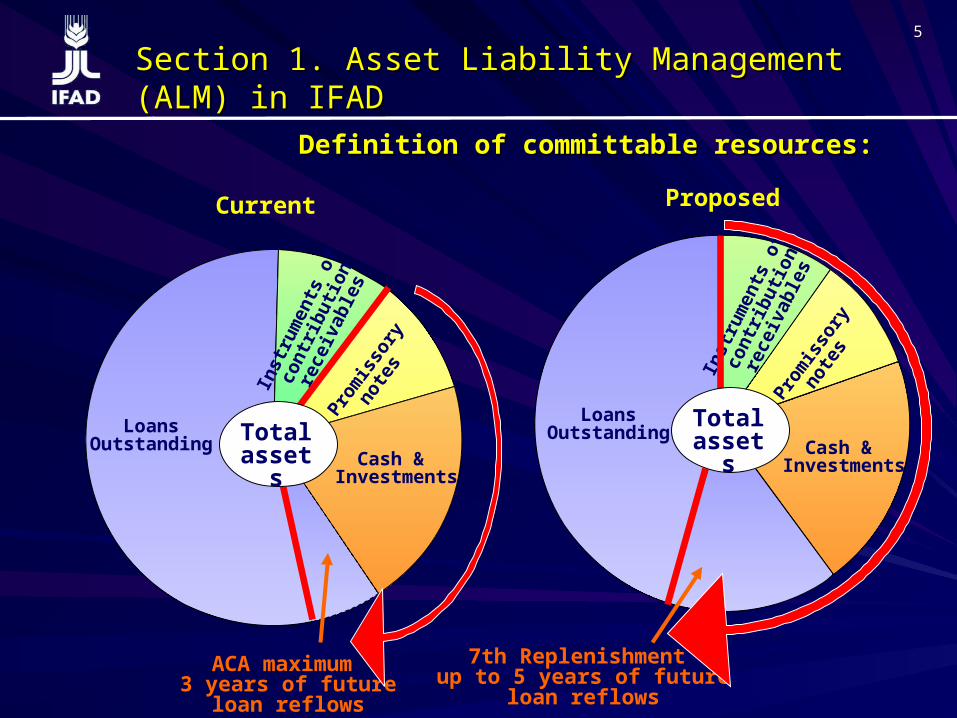
Definition of committable resources:Definition of committable resources:
Section 1. Asset Liability Management (ALM) in IFADSection 1. Asset Liability Management (ALM) in IFAD
Current
ACA maximum 3 years of future
loan reflows
Loans Outstanding
Inst
rum
ents
of
cont
ribu
tion
rece
ivab
les
Prom
isso
ry
note
s
Cash & Investments
7th Replenishment up to 5 years of future
loan reflows
Loans Outstanding
Proposed
Inst
rum
ents
of
cont
ribu
tion
rece
ivab
les
Prom
isso
ry
note
s
Cash & Investments
Total assets
Total assets

66
Section 1. Asset Liability Management (ALM) in IFADSection 1. Asset Liability Management (ALM) in IFAD
Use of future loan reflows for commitments:Use of future loan reflows for commitments:
1 2 3 4 5Future reflow year
Current ACA definition
Proposed definition (but only 95% of principal, interest and net of HIPC foregone reflows)

77
Section 1. Asset Liability Management (ALM) in IFADSection 1. Asset Liability Management (ALM) in IFAD
Current definition: Projected 7th Repl. (2007-2009)FX rate USD/SDR 1.45
Uses
PDFF, Oper. exp.
Sources
Loan reflows 2010-2012 (ACA)*
Programme of Work (loans/grants)
HIPC
Contributions 7th
(Cash and promissory notes)
USD (2 003) M
USD (290) MUSD (137) M
Total: USD 2 240 M USD (2 430) M
USD (190) M
Contributions 6th
Shortfall
USD 800 M
USD 1 088 M
USD 32 M
USD 320 M
Internal resources 2007-2009(Inv. income, loan reflows)
*USD 320 M is based on USD 743 M (3 years future loan reflows 2010-2012) less USD 423 M (projected 6th Repl. ACA carry over)
88
Section 1. Asset Liability Management (ALM) in IFADSection 1. Asset Liability Management (ALM) in IFAD
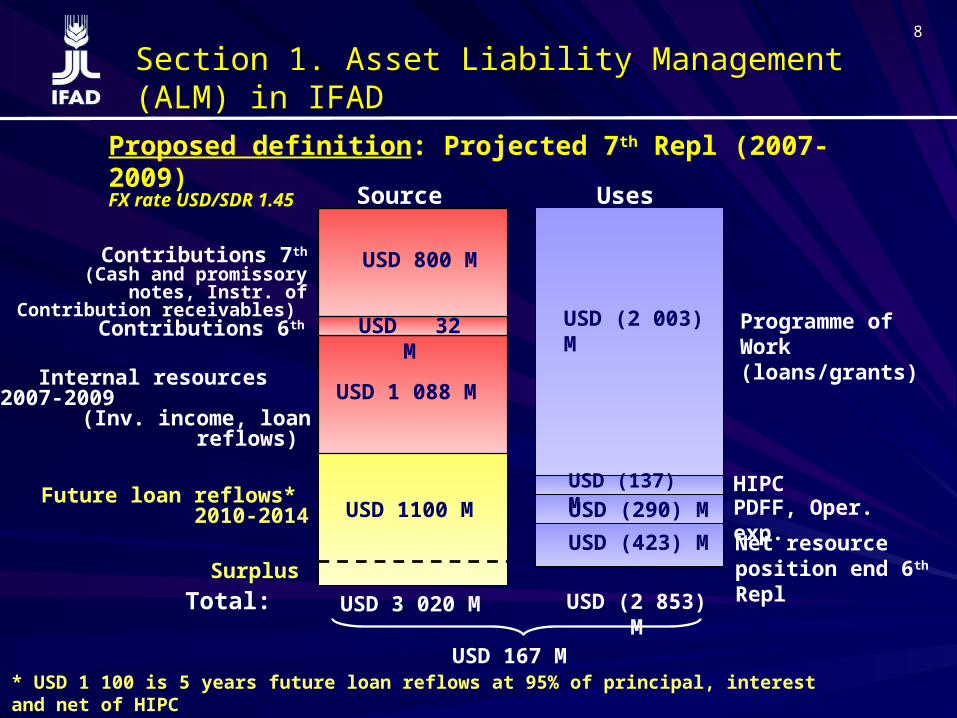
Proposed definition: Projected 7th Repl (2007-2009)FX rate USD/SDR 1.45
Sources Uses
Contributions 7th
(Cash and promissory notes, Instr. of Contribution receivables)
* USD 1 100 is 5 years future loan reflows at 95% of principal, interest and net of HIPC
Internal resources 2007-2009(Inv. income, loan reflows)
Programme of Work (loans/grants)
HIPCPDFF, Oper. exp.
Future loan reflows* 2010-2014
USD (2 003) M
USD (137) M
USD (290) M
USD 3 020 M USD (2 853) M
Contributions 6th
Total:
USD 1 088 M
USD 1100 M
USD 167 M
USD 32 M
USD (423) MSurplus
Net resource position end 6th Repl
USD 800 M
99
Section 1. Asset Liability Management (ALM) in IFADSection 1. Asset Liability Management (ALM) in IFAD
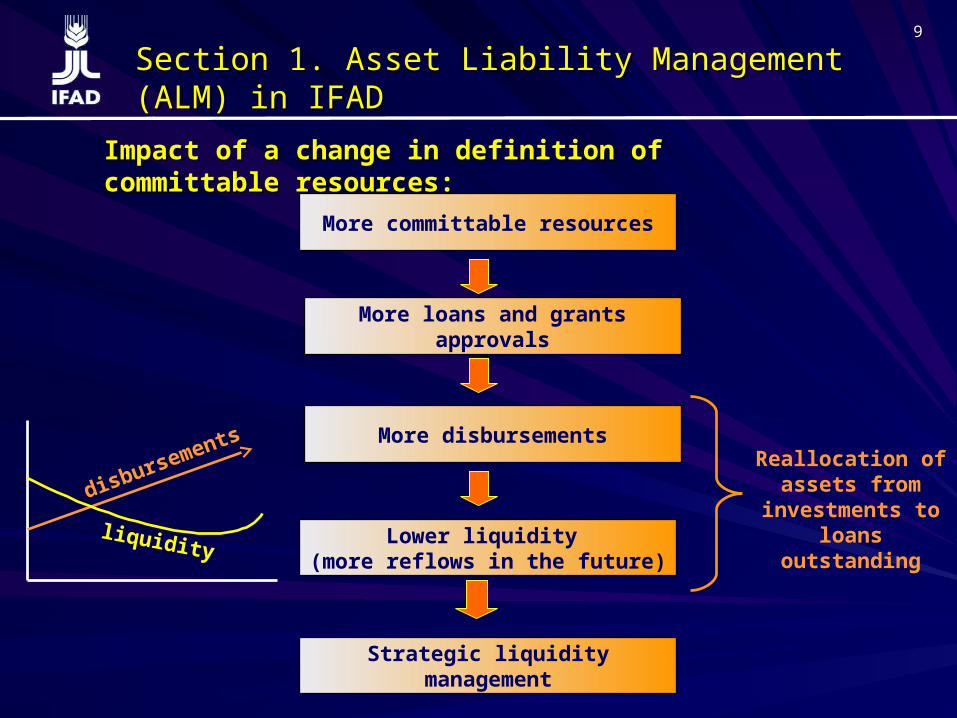
Impact of a change in definition of committable resources:Impact of a change in definition of committable resources:
More committable resources
More loans and grants approvals
More disbursements
Lower liquidity (more reflows in the future)
Strategic liquidity management
Reallocation of assets from
investments to loans outstanding
disbursements
liquidity
1010
Section 1. Asset Liability Management (ALM) in IFADSection 1. Asset Liability Management (ALM) in IFAD
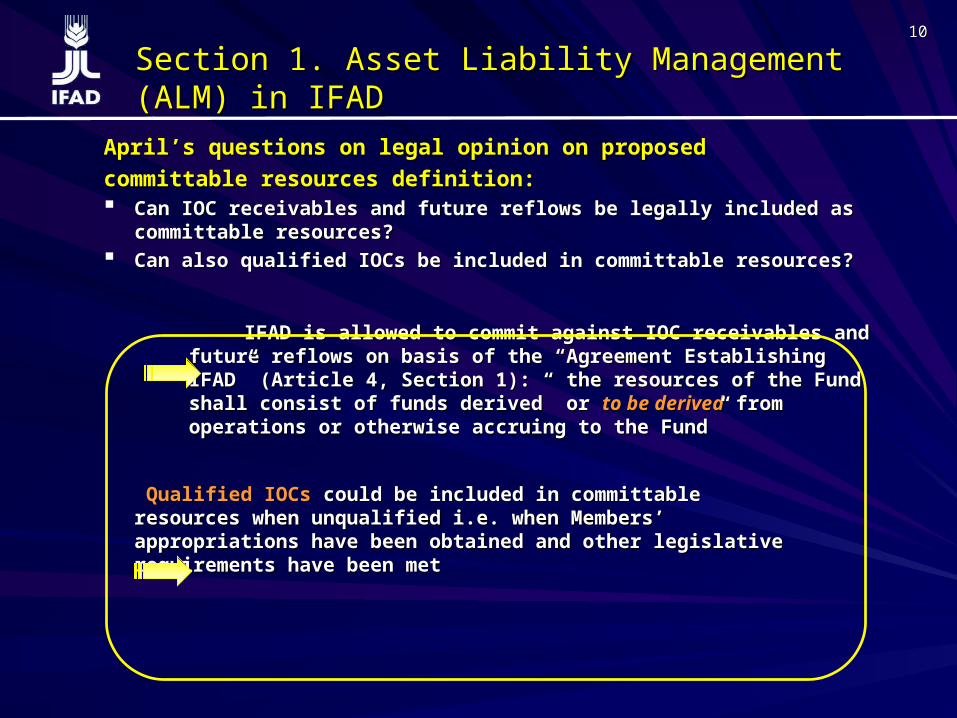
April’s questions on legal opinion on proposedApril’s questions on legal opinion on proposed
committable resources definition: committable resources definition: Can IOC receivables and future reflows be legally included as Can IOC receivables and future reflows be legally included as
committable resources?committable resources? Can also qualified IOCs be included in committable resources?Can also qualified IOCs be included in committable resources?
IFAD is allowed to commit against IOC receivables and future IFAD is allowed to commit against IOC receivables and future reflows on basis of the “Agreement Establishing IFAD” (Article 4, reflows on basis of the “Agreement Establishing IFAD” (Article 4, Section 1): “ the resources of the Fund shall consist of funds Section 1): “ the resources of the Fund shall consist of funds derived or derived or to be derivedto be derived from operations or otherwise accruing to from operations or otherwise accruing to the Fund”the Fund”
Qualified IOCs Qualified IOCs could be included in committable could be included in committable resources when unqualified i.e. when Members’ resources when unqualified i.e. when Members’ appropriations have been obtained and other legislative appropriations have been obtained and other legislative requirements have been metrequirements have been met
1111
Section 2. Track Record of FlowsSection 2. Track Record of Flows
April’s questions on IFAD’s financial flows:April’s questions on IFAD’s financial flows:
Have Members fulfilled their obligations against IOCs?
What is the actual track record of loan arrears?
Content of this section:Content of this section:
Overview of cash flowsOverview of cash flows
Track record of flows: Track record of flows:
•ContributionsContributions
•Loan reflows and arrearsLoan reflows and arrears
•Investment incomeInvestment income
•DisbursementsDisbursements
1212
Section 2. Track Record of FlowsSection 2. Track Record of Flows
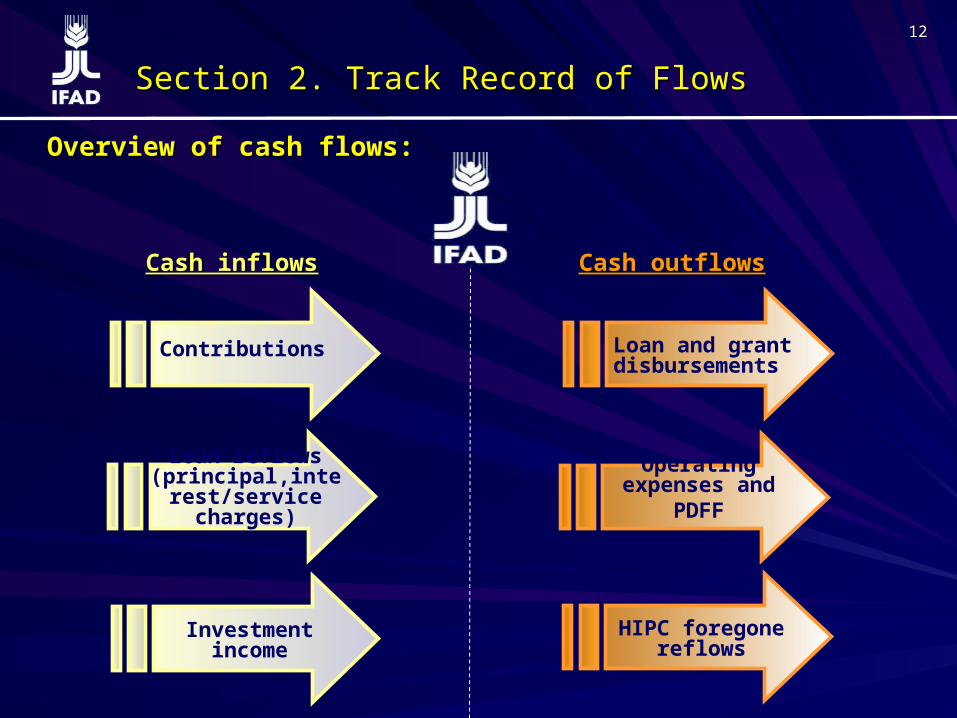
Cash inflowsCash inflows Cash outflowsCash outflows
Loan reflows (principal,interest/service charges)
Contributions
Investment income
Loan and grant disbursements
HIPC foregone reflows
Operating expenses and
PDFF
Overview of cash flows:Overview of cash flows:

1313
Section 2. Track Record of FlowsSection 2. Track Record of Flows
Track record of contributions (as at Dec 2004):Track record of contributions (as at Dec 2004):
Track record of encashments compared to deposited IOCs is record of encashments compared to deposited IOCs is almost 100%!almost 100%!
1 100
100
300
500
700
900
1st 2nd 3rd 4th 5th 6th
US
D M
Deposited IOCs
Encashed payments
Ongoing payments & encashments!
Encashment % compared to deposited IOCs (1st to 6th Repl.)
97% of IOCs
99% of IOCs
98%of IOCs
98% of IOCs
73%of IOCs
21% of IOCs
1414
Section 2. Track Record of FlowsSection 2. Track Record of Flows
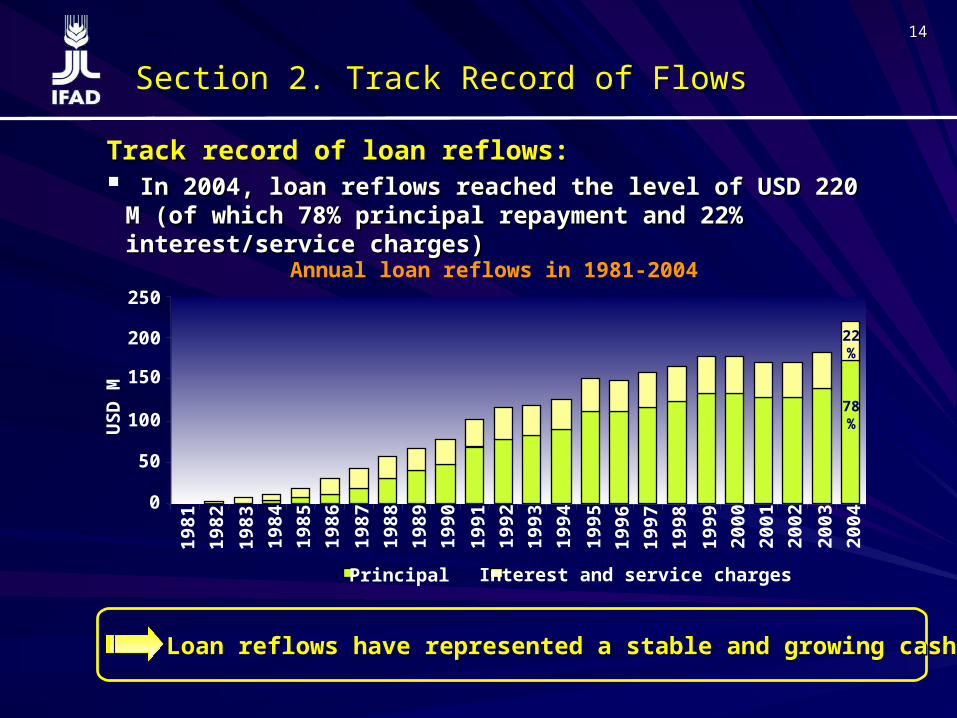
Track record of loan reflows:Track record of loan reflows: In 2004, loan reflows reached the level of USD 220 M (of which In 2004, loan reflows reached the level of USD 220 M (of which
78% principal repayment and 22% interest/service charges)78% principal repayment and 22% interest/service charges)
Annual loan reflows in 1981-2004
0
50
100
150
200
250
198
1
198
2
198
3
198
4
198
5
198
6
198
7
198
8
198
9
199
0
199
1
199
2
199
3
199
4
199
5
199
6
199
7
199
8
199
9
200
0
200
1
200
2
200
3
200
4
US
D M
Principal Interest and service charges
78%
22%
Loan reflows have represented a stable and growing cash inflowLoan reflows have represented a stable and growing cash inflow

1515
Section 2. Track Record of FlowsSection 2. Track Record of Flows
Track record of loan arrears (of 75 days or more): Track record of loan arrears (of 75 days or more): At Dec 2004, total arrears amount USD 81 M At Dec 2004, total arrears amount USD 81 M a)a), representing 3.1%, representing 3.1%
of total amounts billedof total amounts billed 83% of arrears is concentrated in only five countries83% of arrears is concentrated in only five countries
Total amount in arrears versus total billed
0
20
40
60
80
100
198
7
198
8
198
9
199
0
199
1
199
2
199
3
199
4
199
5
199
6
199
7
199
8
199
9
200
0
200
1
200
2
200
3
200
4
US
D M
0.0%1.0%2.0%3.0%4.0%5.0%6.0%
7.0%
%
Arrear amount (USD M) Arrear % on total billed
Total loan arrears are very low (3.1 % of total billed) and Total loan arrears are very low (3.1 % of total billed) and
are concentrated in only few countriesare concentrated in only few countries
a) USD 12 M is covered by HIPC debt relief

1616
Section 2. Track Record of FlowsSection 2. Track Record of Flows
Grant disbursementsLoan disbursements
Annual loan and grant disbursements since 1978
0
50
100
150
200
250
300
350
1978 1981 1984 1987 1990 1993 1996 1999 2002 2004
US
D M
Track record of investment income: Stable expected return of 3.5% with current investment policy Stable expected return of 3.5% with current investment policy
Track record of disbursements: Total loan and grant disbursements reached USD 332 M in 2004Total loan and grant disbursements reached USD 332 M in 2004

1717
Section 2. Track Record of FlowsSection 2. Track Record of Flows
Summary of IFAD’s track record of flows:
The proposal to include IOCs receivables and a portion of loan reflows in the committable resources is supported by:
Excellent track record (almost 100%) of encashments Excellent track record (almost 100%) of encashments
compared to deposited IOCscompared to deposited IOCs
Stable and growing loan reflows Stable and growing loan reflows
Very low loan arrears (at 3.1% of total billed) concentrated Very low loan arrears (at 3.1% of total billed) concentrated in only few countriesin only few countries
1818
Section 3. Financial ScenariosSection 3. Financial Scenarios
April’s questions on financial scenarios:April’s questions on financial scenarios:
What are the annual, projected cash inflows and outflows for the 7What are the annual, projected cash inflows and outflows for the 7thth Replenishment and beyond? Replenishment and beyond?
What is meant by an acceptable limit of risk for liquidity? Can it be quantified?What is meant by an acceptable limit of risk for liquidity? Can it be quantified?
What are the financial indicators of the scenarios?What are the financial indicators of the scenarios?
Content of this section:Content of this section:
Projections of cash inflows and outflowsProjections of cash inflows and outflows
Liquidity projectionsLiquidity projections
Stress testingStress testing
Financial soundness indicatorsFinancial soundness indicators

1919
Section 3. Financial ScenariosSection 3. Financial Scenarios
Assumptions applied in a “Base scenario”:Assumptions applied in a “Base scenario”:
After 7th Repl. Period: neutral assumptions have been made on Replenishment and Programme of Work levels for scenario purposes only
77thth Repl. 2007-2009 Repl. 2007-2009 From 2010 From 2010
Replenishment Replenishment amountamount
USD 800 MUSD 800 MGrowth at Growth at
inflation rateinflation rate
Programme of Work Programme of Work (POW) - current (POW) - current grant policy 10%grant policy 10%
Growth at 10% p.a.Growth at 10% p.a.Growth at Growth at
inflation rate until 2015inflation rate until 2015
Committable Committable resources resources consideredconsidered
Includes IOC receivables and Includes IOC receivables and 95% of 5 years of future loan 95% of 5 years of future loan
reflows (net of HIPC)reflows (net of HIPC)
Includes IOC receivables, Includes IOC receivables, 95% of future loan reflows 95% of future loan reflows
(net of HIPC) subject to (net of HIPC) subject to sustainable liquidity sustainable liquidity
FX rate USD/SDRFX rate USD/SDR1.45 (current and 1.45 (current and
3-year-average rate)3-year-average rate)
1.45 (current and1.45 (current and
3-year-average rate)3-year-average rate)

2020
Section 3. Financial ScenariosSection 3. Financial Scenarios
““Base scenario” compared to information in April 2005:Base scenario” compared to information in April 2005:
USD/SDR rate updated to 1.45 to reflect recent trends USD/SDR rate updated to 1.45 to reflect recent trends (Previous “Base” assumption: 1.5498 as at 31 Dec 2004)(Previous “Base” assumption: 1.5498 as at 31 Dec 2004)
Estimates of HIPC debt relief updated to most recent figures Estimates of HIPC debt relief updated to most recent figures (Estimates subject to change. HIPC contributions per Dec 2004. Previous (Estimates subject to change. HIPC contributions per Dec 2004. Previous “Base” assumption: HIPC debt relief estimates per March 2005)“Base” assumption: HIPC debt relief estimates per March 2005)
After 7After 7thth Repl. period, a “neutral” assumption about Repl. period, a “neutral” assumption about Replenishment and POW levels for scenario purposes: annual Replenishment and POW levels for scenario purposes: annual growth at inflation rate (POW growth is assumed until 2015)growth at inflation rate (POW growth is assumed until 2015)(April’s additional scenario information showed two possible trends for 8(April’s additional scenario information showed two possible trends for 8 thth Replenishment: annual POW growth of 10% or 8% in 2010-2012 and 8Replenishment: annual POW growth of 10% or 8% in 2010-2012 and 8 thth Replenishment level of USD 1 100 M or USD 1 000 M respectively)Replenishment level of USD 1 100 M or USD 1 000 M respectively)
More conservative approach in liquidity projections by applying More conservative approach in liquidity projections by applying a 3% annual reduction on all future loan reflows a 3% annual reduction on all future loan reflows

2121
Section 3. Financial ScenariosSection 3. Financial Scenarios
-
200
400
600
800U
SD
M
Contributions 219 160 223 236 203 252 306 231 295 325 246 313
Inv. Income 109 88 80 79 77 74 73 70 67 66 62 58
Loan Reflows 220 184 193 202 211 223 236 247 260 269 280 290
2004 2005 2006 2007 2008 2009 2010 2011 2012 2013 2014 2015
* “Base scenario” assumptions per page 19
Projected cash inflows in assumed “Base scenario” *:Projected cash inflows in assumed “Base scenario” *:
Investment income decreasing due to gradual reallocation from Investment income decreasing due to gradual reallocation from investments to loans outstandinginvestments to loans outstanding
Annual loan reflows projected to increase some 30% by 2015 and Annual loan reflows projected to increase some 30% by 2015 and could double in 20 years (figures gross of HIPC foregone flows, could double in 20 years (figures gross of HIPC foregone flows, which are shown as expense outflows)which are shown as expense outflows)

2222
Section 3. Financial ScenariosSection 3. Financial Scenarios
Projected cash outflows in assumed “Base scenario” *:Projected cash outflows in assumed “Base scenario” *:-
(800)
(600)
(400)
(200)
US
D M
HIPC - - (11) (42) ( 48) (48) (44) (38) (34) (28) (22) (20)
PDFF (27) (30) (30) (31) (34) (38) (40) (41) (42) (42) (43) (44)
Operating Exp. (57) (63) (69) (71) (74) (83) (84) (86) (88) (89) (91) (93)
Disbursements (332) (420) (413) (417) (423) (438) (462) (489) (515) (540) (565) (589)
2004 2005 2006 2007 2008 2009 2010 2011 2012 2013 2014 2015
* “Base scenario” assumptions per page 19
Annual disbursements projected to increase significantly in 10 years Annual disbursements projected to increase significantly in 10 years and could double in 20 yearsand could double in 20 years

2323
Section 3. Financial ScenariosSection 3. Financial Scenarios
Projected liquidity (cash, investments) and net flows in assumed “Base Projected liquidity (cash, investments) and net flows in assumed “Base scenario”*:scenario”*:
* “Base scenario” assumptions per page 19
After 2015, the “Base scenario” could reach a minimum liquidity in After 2015, the “Base scenario” could reach a minimum liquidity in 2023 (USD 1.0 B), thereafter recovering due to larger loan reflows2023 (USD 1.0 B), thereafter recovering due to larger loan reflows
Liquidity shows a gradual yet sustainable decrease (USD 1.6 B in 2015)Liquidity shows a gradual yet sustainable decrease (USD 1.6 B in 2015)
a) 2004: includes USD 91 M of movement on foreign exchange and USD -20 M of adjustmentsb) 2005: includes USD -176 M of movement on foreign exchange
Net flows 203 (257) (28) (44) (88) (58) (15) (105) (56) (40) (132) (84)
Liquidity 2560 2303 2275 2232 2143 2085 2070 1965 1909 1869 1737 1652
3 000
Liq
uid
ity
Net flo
ws
(300)
(100)
100
300
500
700
600
1 200
1 800
2 400
2004 2005 2006 2007 2008 2009 2010 2011 2012 2013 2014 2015
b)a)
(US
D M
)
(US
D M
)

2424
Section 3. Financial ScenariosSection 3. Financial Scenarios
Stress testing:Stress testing:
What?What? Scenarios showing the projected future impact Scenarios showing the projected future impact from changes in assumptions or from shocksfrom changes in assumptions or from shocks
Why?Why? To check adequacy of long-term liquidityTo check adequacy of long-term liquidity
How?How? By simulating the impact of stress scenarios By simulating the impact of stress scenarios relating to IFAD’s major financial flows:relating to IFAD’s major financial flows:
a)a) DisbursementsDisbursements
b)b) Encashment of contributionsEncashment of contributions
c)c) Loan reflow arrearsLoan reflow arrears
d)d) Movement on foreign exchange (overall impact)Movement on foreign exchange (overall impact)
2525
Section 3. Financial ScenariosSection 3. Financial Scenarios
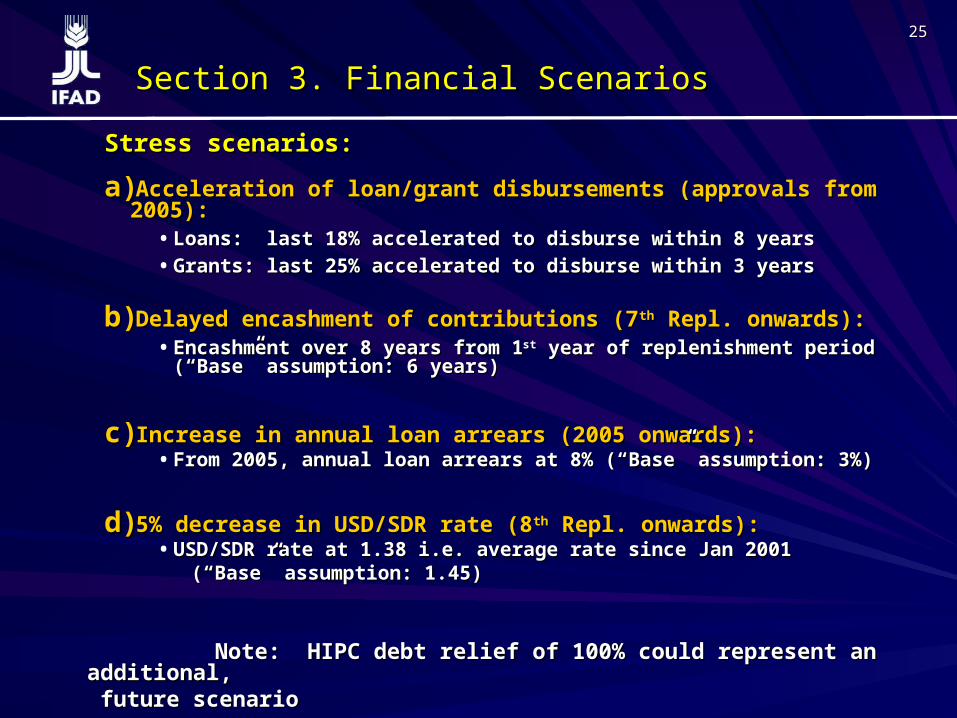
Stress scenarios: Stress scenarios:
a)a)Acceleration of loan/grant disbursements (approvals from 2005):Acceleration of loan/grant disbursements (approvals from 2005):• Loans: last 18% accelerated to disburse within 8 yearsLoans: last 18% accelerated to disburse within 8 years
• Grants: last 25% accelerated to disburse within 3 yearsGrants: last 25% accelerated to disburse within 3 years
b)b)Delayed encashment of contributions (7Delayed encashment of contributions (7thth Repl. onwards): Repl. onwards):• Encashment over 8 years from 1Encashment over 8 years from 1stst year of replenishment period year of replenishment period
(“Base” assumption: 6 years)(“Base” assumption: 6 years)
c)c)Increase in annual loan arrears (2005 onwards):Increase in annual loan arrears (2005 onwards): • From 2005, annual loan arrears at 8% (“Base” assumption: 3%)From 2005, annual loan arrears at 8% (“Base” assumption: 3%)
d)d)5% decrease in USD/SDR rate (85% decrease in USD/SDR rate (8thth Repl. onwards): Repl. onwards):• USD/SDR rate at 1.38 i.e. average rate since Jan 2001 USD/SDR rate at 1.38 i.e. average rate since Jan 2001 (“Base” assumption: 1.45)(“Base” assumption: 1.45)
Note: HIPC debt relief of 100% could represent an additional, Note: HIPC debt relief of 100% could represent an additional, future scenariofuture scenario
2626
Section 3. Financial ScenariosSection 3. Financial Scenarios
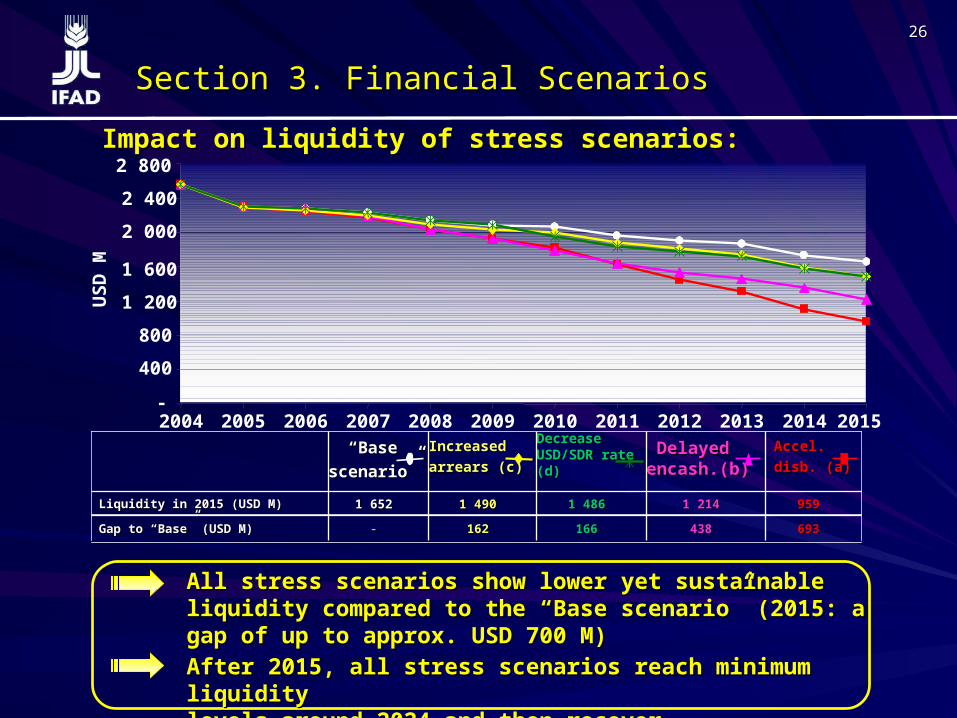
Impact on liquidity of stress scenarios:Impact on liquidity of stress scenarios:
After 2015, all stress scenarios reach minimum liquidity After 2015, all stress scenarios reach minimum liquidity levels around 2024 and then recoverlevels around 2024 and then recover
All stress scenarios show lower yet sustainable liquidity All stress scenarios show lower yet sustainable liquidity compared to the “Base scenario” (2015: a gap of up to approx. compared to the “Base scenario” (2015: a gap of up to approx. USD 700 M)USD 700 M)
-
400
800
1 200
1 600
2 000
2 400
2 800
2004 2005 2006 2007 2008 2009 2010 2011 2012 2013 2014 2015
US
D M
693693438438166166162162-- Gap to “Base” (USD M)Gap to “Base” (USD M)
9599591 2141 2141 4861 4861 4901 4901 6521 652 Liquidity in 2015 (USD M)Liquidity in 2015 (USD M)
Accel.Accel.
disb. (a)disb. (a)
Delayed Delayed encash.(b)encash.(b)
Decrease Decrease USD/SDR rate USD/SDR rate (d)(d)
Increased Increased
arrears (c) arrears (c)
“ “BaseBase
scenario” scenario”

2727
Section 3. Financial ScenariosSection 3. Financial Scenarios
Summary of the “Base scenario” and stress scenarios:Summary of the “Base scenario” and stress scenarios:
The assumed “Base scenario” (with 7The assumed “Base scenario” (with 7thth Repl of USD 800 M) Repl of USD 800 M) shows a gradually decreasing yet sustainable liquidity with shows a gradually decreasing yet sustainable liquidity with the proposed definition of committable resources (which the proposed definition of committable resources (which used more future reflows for commitments)used more future reflows for commitments)
Four stress scenarios show lower yet sustainable liquidity Four stress scenarios show lower yet sustainable liquidity levels; an estimated liquidity reduction of up to approx. levels; an estimated liquidity reduction of up to approx. USD 700 M by 2015 compared to “Base scenario” USD 700 M by 2015 compared to “Base scenario”
Actual materialization of stress events would call for Actual materialization of stress events would call for cautious and timely adjustments in resources and/or cautious and timely adjustments in resources and/or operationsoperations
New scenario simulations are required when there are:New scenario simulations are required when there are: changes in actual situation (“Base scenario”) changes in actual situation (“Base scenario”) risks of new stress events and/or multiple eventsrisks of new stress events and/or multiple events

2828
Section 3. Financial ScenariosSection 3. Financial Scenarios
Indicators of financial soundness for IFAD:Indicators of financial soundness for IFAD:
With proposed definition of committable resources, liquidity:
Projection: Projection: 10 years 10 years
(2015)(2015)
37%37% 30%30% 20%20%
54%54% 65%65% 75%75%
6.26.2 3.73.7 2.32.3
0.90.9 0.60.6 0.40.4
Projection: Projection: end 7end 7thth Repl Repl
(2009)(2009)Actual:Actual:
Dec 2004Dec 2004
Loans outstandingLoans outstandingvsvs
Total assetsTotal assets
LiquidityLiquidityvsvs
Total assetsTotal assets
LiquidityLiquidityvsvs
Annual disbursements Annual disbursements (incl. (incl. operating exp. and PDFF)operating exp. and PDFF)
LiquidityLiquidityvsvs
Total undisbursed balanceTotal undisbursed balance
1.
2.
decreases in favour of higher level of loans outstanding (more in line with IFAD’s mission)continues to adequately cover annual disbursements
1.
2.
Note: Liquidity takes investments (receivables and payables) into account
2929
Section 4. Comparing IFAD to IFIsSection 4. Comparing IFAD to IFIs
April’s questions on comparison to International FinancialApril’s questions on comparison to International FinancialInstitutions (IFIs):Institutions (IFIs):
How many years of future reflows do IFIs include as resources?How many years of future reflows do IFIs include as resources?
Which proportion (85%? 100%?) of annual, future loan reflows (principal and interest) do IFIs include as resources?Which proportion (85%? 100%?) of annual, future loan reflows (principal and interest) do IFIs include as resources?
Does IFAD have any resource transfer from a Bank, like IFIs?Does IFAD have any resource transfer from a Bank, like IFIs?
Content of this section:Content of this section:
Financial soundness indicatorsFinancial soundness indicators
Liquidity policiesLiquidity policies
Use of future loan reflows Use of future loan reflows
Breakdown of total resources Breakdown of total resources

3030
Section 4. Comparing IFAD to IFIsSection 4. Comparing IFAD to IFIs
Financial soundness indicators:Financial soundness indicators:
11%11% 16%16% 19%19% 13%13% 37%37% 30%30% 20%20%
82%82% 73%73% 72%72% 63%63% 54%54% 65%65% 75%75%
1.81.8 2.52.5 4.74.7 2.02.0 6.26.2 3.73.7 2.32.3
0.60.6 0.70.7 0.90.9 0.40.4 0.90.9 0.60.6 0.40.4
Loans outstandingLoans outstandingvsvs
Total assetsTotal assets
LiquidityLiquidityvsvs
Total assetsTotal assets
LiquidityLiquidityvsvs
Annual disburs. Annual disburs. (incl. oper. exp, PDFF)(incl. oper. exp, PDFF)
LiquidityLiquidityvsvs
Total undisbursedTotal undisbursed
IDA2004
FSO2004
AsDF2004
AfDF2004
IFAD
Dec 2004
End 7th Repl
(2009)
In 10 years (2015)
With the proposed definition of committable resources, IFAD is still more conservative but moves closer to IFIs by the 7th Repl
Note: Liquidity takes investments (receivables and payables) into account
3131
Section 4. Comparing IFAD to IFIsSection 4. Comparing IFAD to IFIs
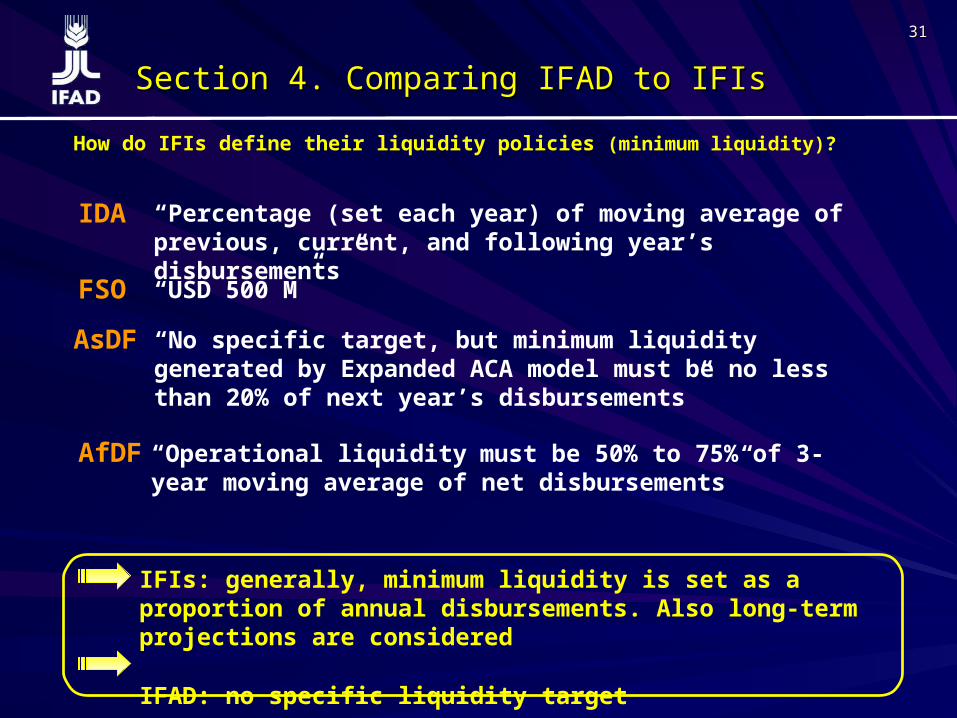
How do IFIs define their liquidity policies (minimum liquidity)?
IDA “Percentage (set each year) of moving average of previous, current, and following year’s disbursements”
FSO “USD 500 M”
AsDF “No specific target, but minimum liquidity generated by Expanded ACA model must be no less than 20% of next year’s disbursements”
“Operational liquidity must be 50% to 75% of 3-year moving average of net disbursements”
AfDF
IFIs: generally, minimum liquidity is set as a proportion of annual disbursements. Also long-term projections are considered
IFAD: no specific liquidity target

3232
Section 4. Comparing IFAD to IFIsSection 4. Comparing IFAD to IFIs
Number of future Number of future reflow yearsreflow years
% of future % of future
annual principalannual principal
% of future % of future annual interestannual interest
IFIs(IDA, FSO,
AsDF, AfDF)Unlimited subject Unlimited subject to liquidity policyto liquidity policy
From 85% to 100%:From 85% to 100%:• IDA: 95%IDA: 95%
• FSO: 100%FSO: 100%
• AsDF: 85%AsDF: 85%
• AfDF: 85%AfDF: 85%
100%*100%*
IFAD: proposal 7th Repl
77thth Repl: up to 5 Repl: up to 5 years (gradual years (gradual
increase)increase) 95%95% 95%95%
Proportion of future loan reflows included as resources:
IFAD: more conservative
IFAD: more conservative
IFAD: in line
IFAD’s proposed use of future loan reflows is in general more conservative than IFIs’ practice
* mostly earmarked for specific expenses

3333
Sample comparison of total resources to commitment level:
IDA: higher proportion of contributions transfer from parent bank (IFAD has no parent bank) future compensation for foregone reflows due to grants access to HIPC Trust Fund with the World Bank
IDA 14th Repl.
(Commitments SDR 23.7 B)
Contributions
IFAD 7th Repl. Proposal
(Commitments USD 2.0 B)
Internal resources (reflows, inv. income)
73.9%
60.0%40.0%42.2%
Incl. bank transfer
57.8%
Transfers from parent Bank
IFAD is depending more on internal resources
Section 4. Comparing IFAD to IFIsSection 4. Comparing IFAD to IFIs

3434
Section 5. ConclusionsSection 5. Conclusions
An expanded definition of committable resources is proposed as a result of financial analyses. This proposed definition requires future strategic liquidity management.
Conclusions:Conclusions:
3535
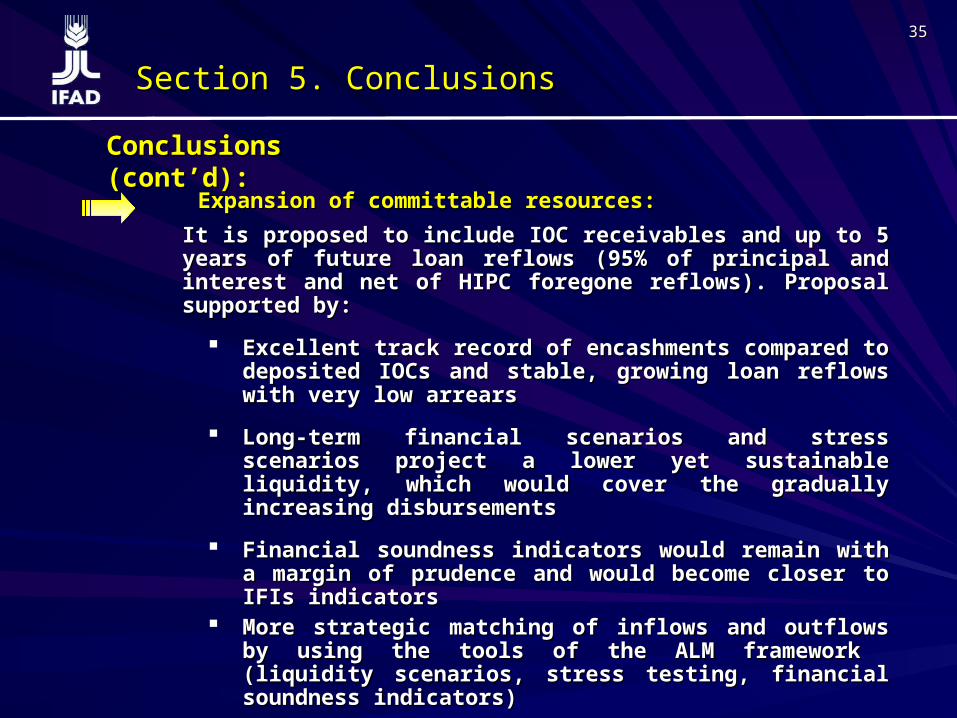
Expansion of committable resources:Expansion of committable resources:
It is proposed to include IOC receivables and up to 5 years of It is proposed to include IOC receivables and up to 5 years of future loan reflows (95% of principal and interest and net of future loan reflows (95% of principal and interest and net of HIPC foregone reflows). Proposal supported by:HIPC foregone reflows). Proposal supported by:
Excellent track record of encashments compared to Excellent track record of encashments compared to deposited IOCs and stable, growing loan reflows with deposited IOCs and stable, growing loan reflows with very low arrearsvery low arrears
Long-term financial scenarios and stress scenarios Long-term financial scenarios and stress scenarios project a lower yet sustainable liquidity, which would project a lower yet sustainable liquidity, which would cover the gradually increasing disbursementscover the gradually increasing disbursements
Financial soundness indicators would remain with a Financial soundness indicators would remain with a margin of prudence and would become closer to IFIs margin of prudence and would become closer to IFIs indicatorsindicators
More strategic matching of inflows and outflows by More strategic matching of inflows and outflows by using the tools of the ALM framework (liquidity using the tools of the ALM framework (liquidity scenarios, stress testing, financial soundness scenarios, stress testing, financial soundness indicators)indicators)
Conclusions (cont’d):Conclusions (cont’d):
Section 5. ConclusionsSection 5. Conclusions