Embed Size (px)
Citation preview
1
Agriculture Statistics Liaison Group18 November 2010
18 November 2010
Presentation by Margaret McLoughlin
CSO, Ireland

22
Presentation Agenda
Welcome & Introductions
CSO Objectives for the Group
ASLG Terms of Reference
Today’s agenda
33
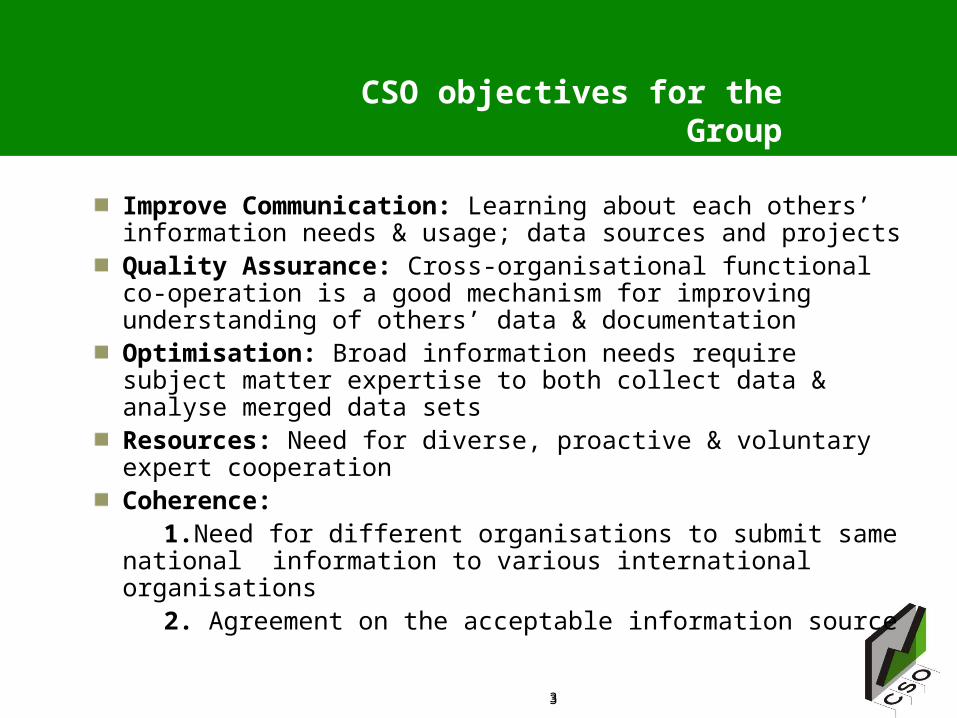
CSO objectives for the Group
Improve Communication: Learning about each others’ information needs & usage; data sources and projectsQuality Assurance: Cross-organisational functional co-operation is a good mechanism for improving understanding of others’ data & documentationOptimisation: Broad information needs require subject matter expertise to both collect data & analyse merged data setsResources: Need for diverse, proactive & voluntary expert cooperationCoherence:
1.Need for different organisations to submit same national information to various international organisations
2. Agreement on the acceptable information source
44
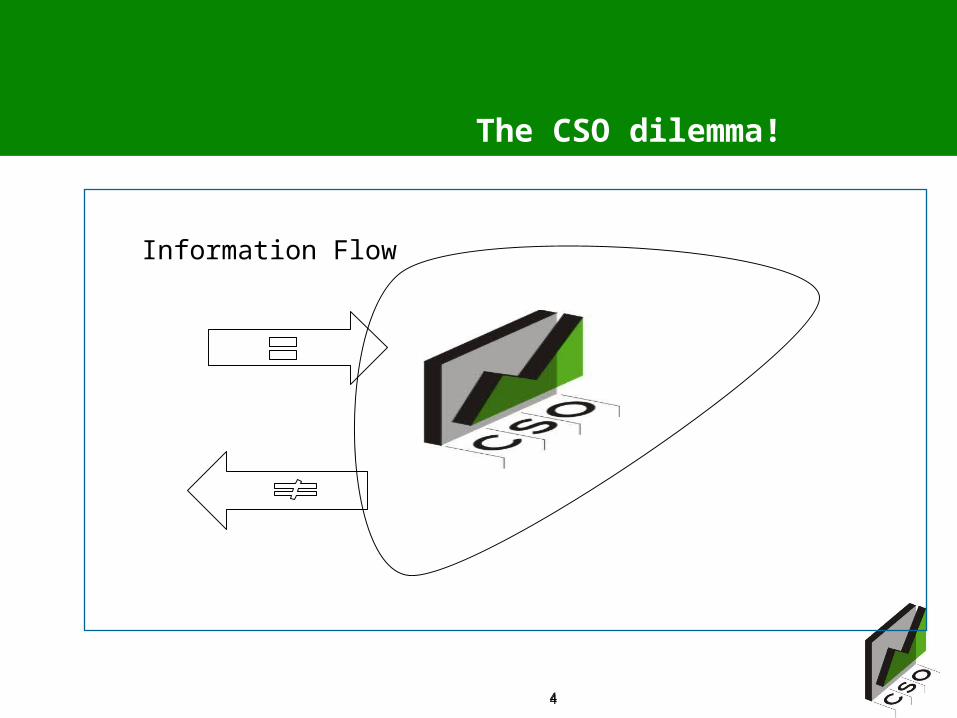
The CSO dilemma!
Information Flow
55
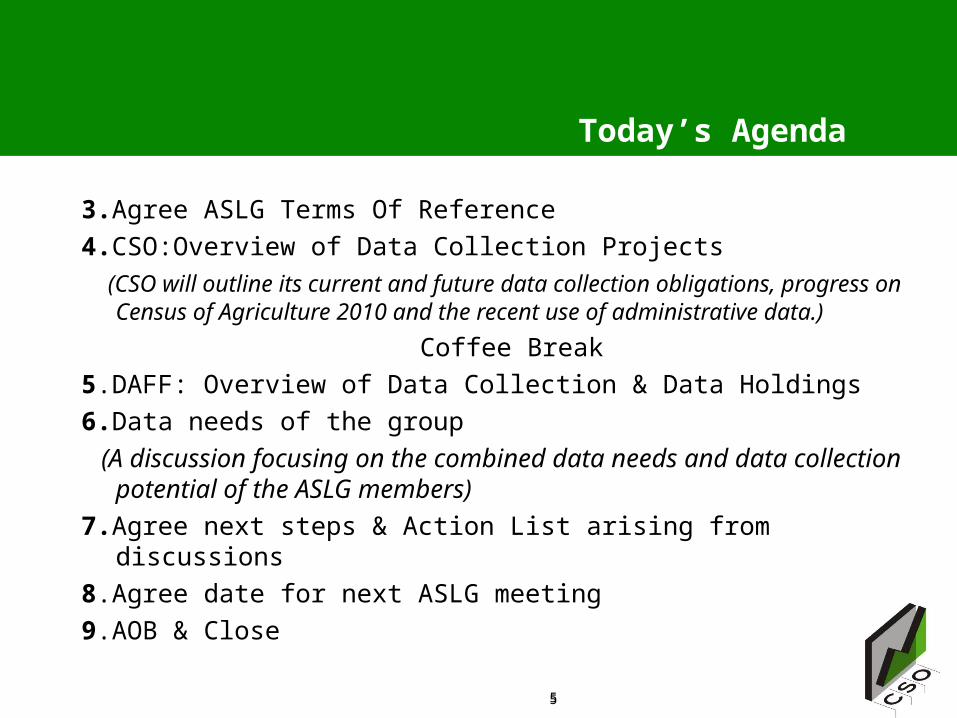
Today’s Agenda
3.Agree ASLG Terms Of Reference
4.CSO:Overview of Data Collection Projects
(CSO will outline its current and future data collection obligations, progress on Census of Agriculture 2010 and the recent use of administrative data.)
Coffee Break
5.DAFF: Overview of Data Collection & Data Holdings
6.Data needs of the group
(A discussion focusing on the combined data needs and data collection potential of the ASLG members)
7.Agree next steps & Action List arising from discussions
8.Agree date for next ASLG meeting
9.AOB & Close
66
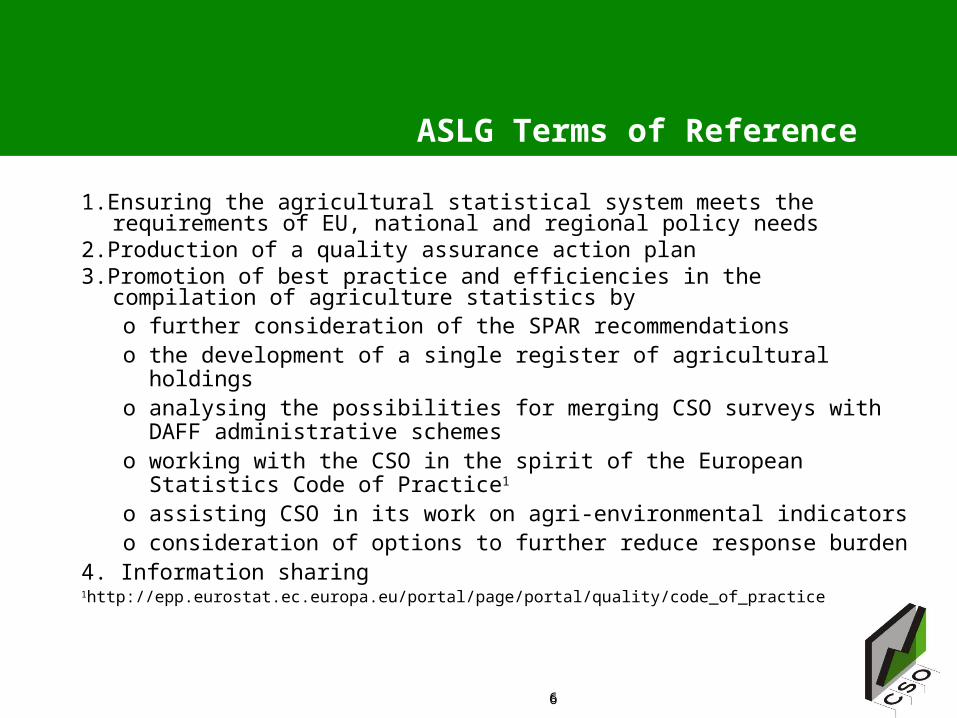
ASLG Terms of Reference
1.Ensuring the agricultural statistical system meets the requirements of EU, national and regional policy needs
2.Production of a quality assurance action plan3.Promotion of best practice and efficiencies in the compilation of
agriculture statistics byo further consideration of the SPAR recommendationso the development of a single register of agricultural holdingso analysing the possibilities for merging CSO surveys with DAFF
administrative schemeso working with the CSO in the spirit of the European Statistics Code
of Practice1
o assisting CSO in its work on agri-environmental indicatorso consideration of options to further reduce response burden
4. Information sharing1http://epp.eurostat.ec.europa.eu/portal/page/portal/quality/code_of_practice
77
Thank you for being here today
8
Agricultural Statistics Liaison GroupNovember 18th 2010
CSO: Overview of Data Collection Projects
Hilda McCarthy
9
Overview
• Background• Structure of CSO Agriculture Division• CSO EU Obligations• CSO Data Collection• Other EU Requests• Challenges• Future Opportunities & Needs
10
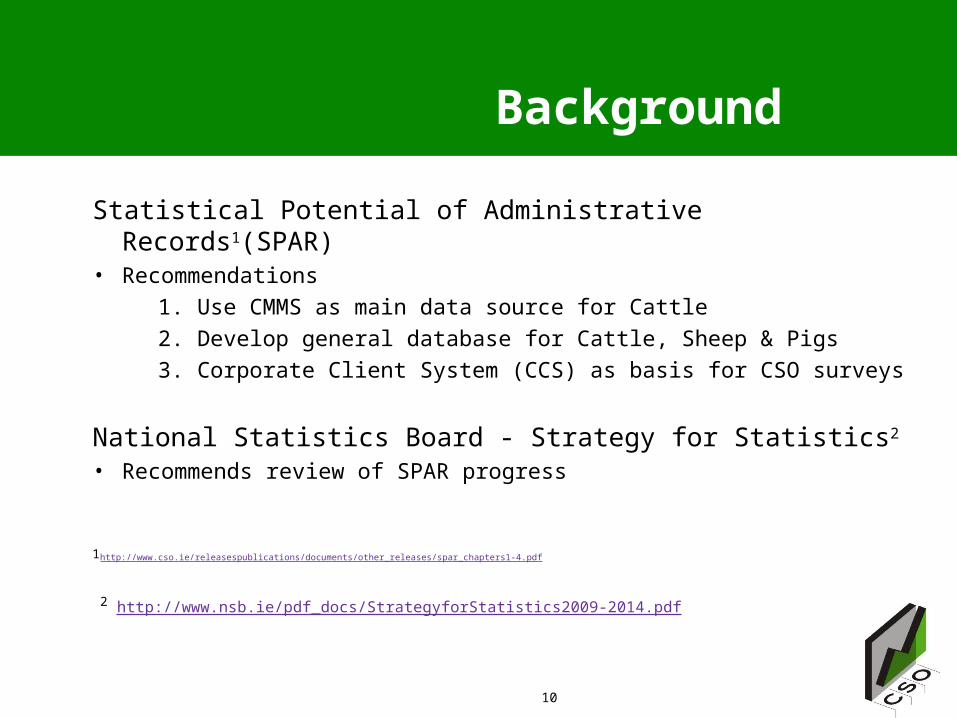
Background
Statistical Potential of Administrative Records1(SPAR)• Recommendations
1. Use CMMS as main data source for Cattle
2. Develop general database for Cattle, Sheep & Pigs
3. Corporate Client System (CCS) as basis for CSO surveys
National Statistics Board - Strategy for Statistics2
• Recommends review of SPAR progress
1http://www.cso.ie/releasespublications/documents/other_releases/spar_chapters1-4.pdf
2 http://www.nsb.ie/pdf_docs/StrategyforStatistics2009-2014.pdf
11
Agriculture Division
Three areas within Agriculture Division
• Agriculture Accounts/Production (Andrew Murray)
• Agriculture Prices/Data (Susan O’Connor/Fiona O’Callaghan)
• Agriculture Register/Census (Hilda McCarthy/Fiona O’Callaghan)
12
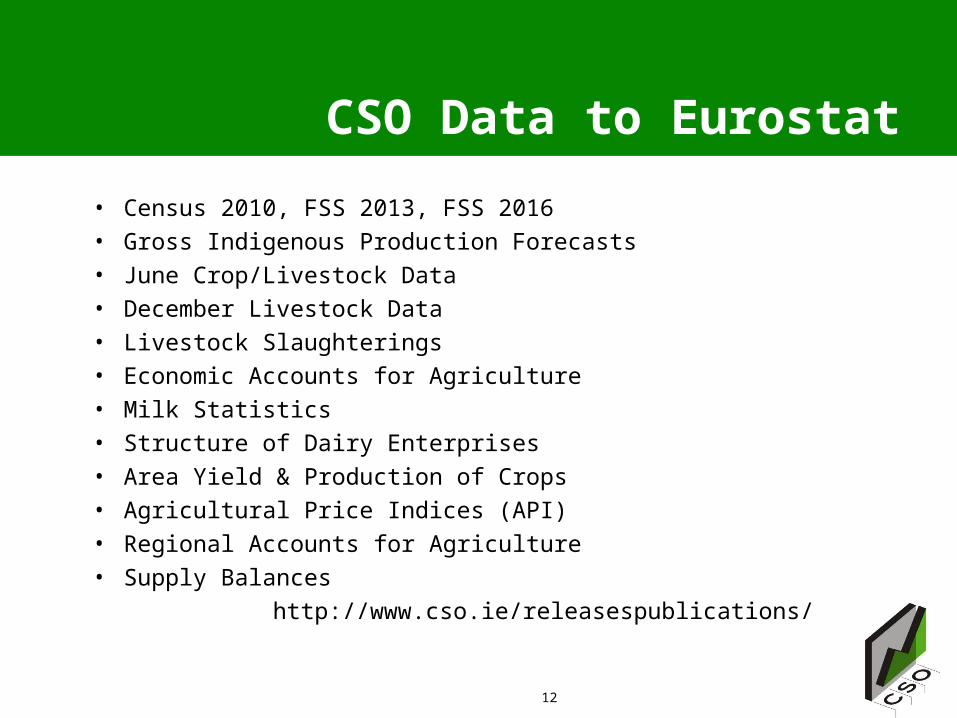
CSO Data to Eurostat
• Census 2010, FSS 2013, FSS 2016 • Gross Indigenous Production Forecasts • June Crop/Livestock Data• December Livestock Data• Livestock Slaughterings • Economic Accounts for Agriculture • Milk Statistics • Structure of Dairy Enterprises • Area Yield & Production of Crops• Agricultural Price Indices (API) • Regional Accounts for Agriculture • Supply Balances
http://www.cso.ie/releasespublications/
13
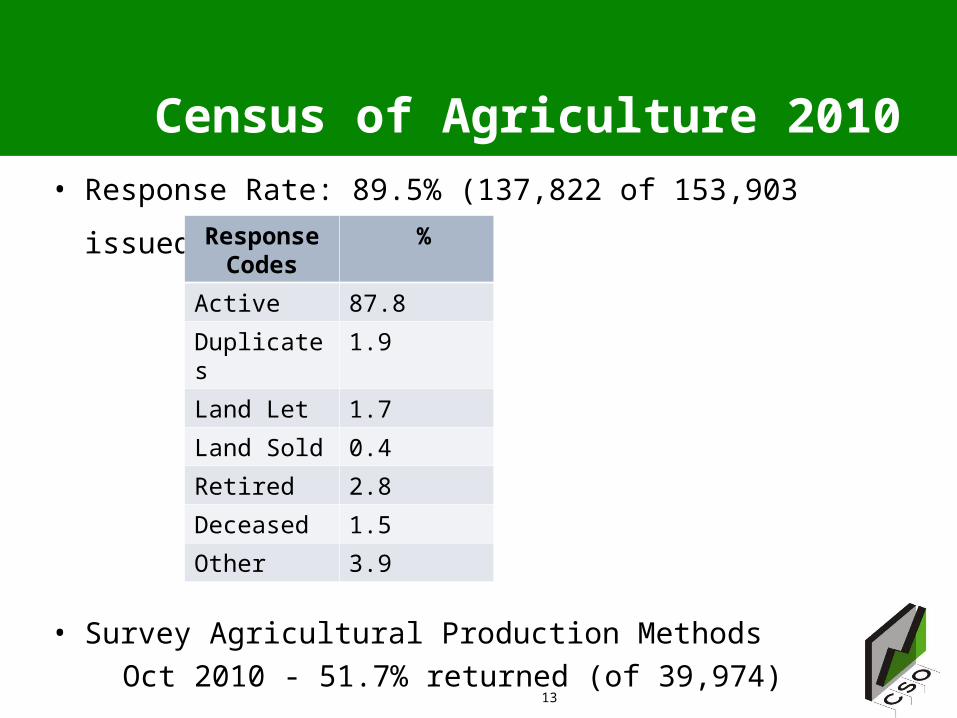
Census of Agriculture 2010
• Response Rate: 89.5% (137,822 of 153,903 issued)
• Survey Agricultural Production Methods
Oct 2010 - 51.7% returned (of 39,974)
Response Codes
%
Active 87.8
Duplicates 1.9
Land Let 1.7
Land Sold 0.4
Retired 2.8
Deceased 1.5
Other 3.9
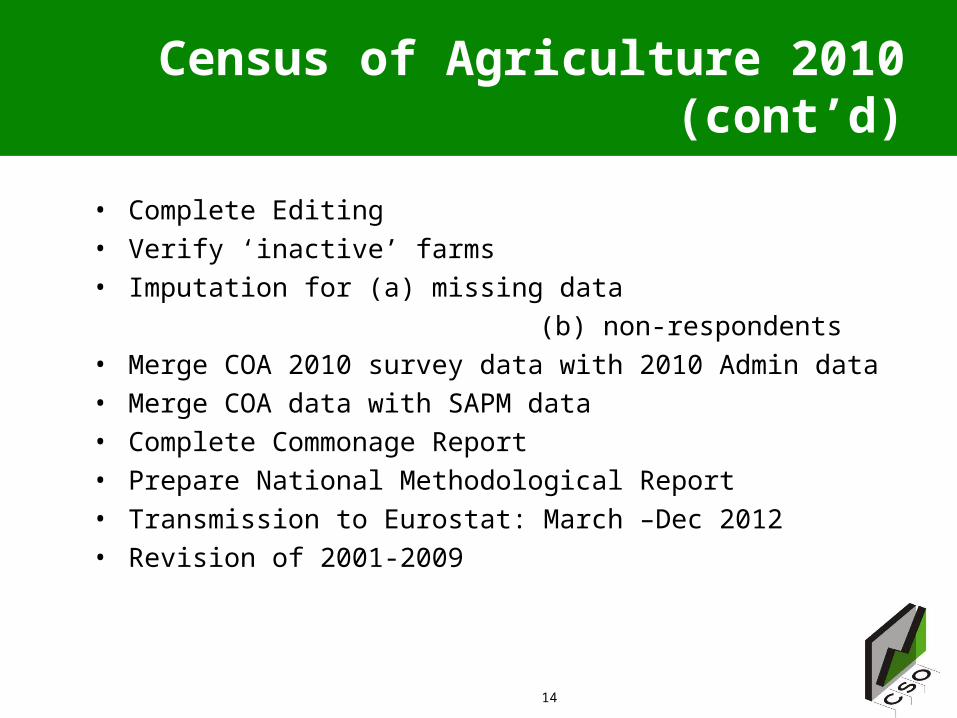
Census of Agriculture 2010 (cont’d)
• Complete Editing• Verify ‘inactive’ farms• Imputation for (a) missing data
(b) non-respondents• Merge COA 2010 survey data with 2010 Admin data• Merge COA data with SAPM data• Complete Commonage Report• Prepare National Methodological Report• Transmission to Eurostat: March –Dec 2012• Revision of 2001-2009
14
15
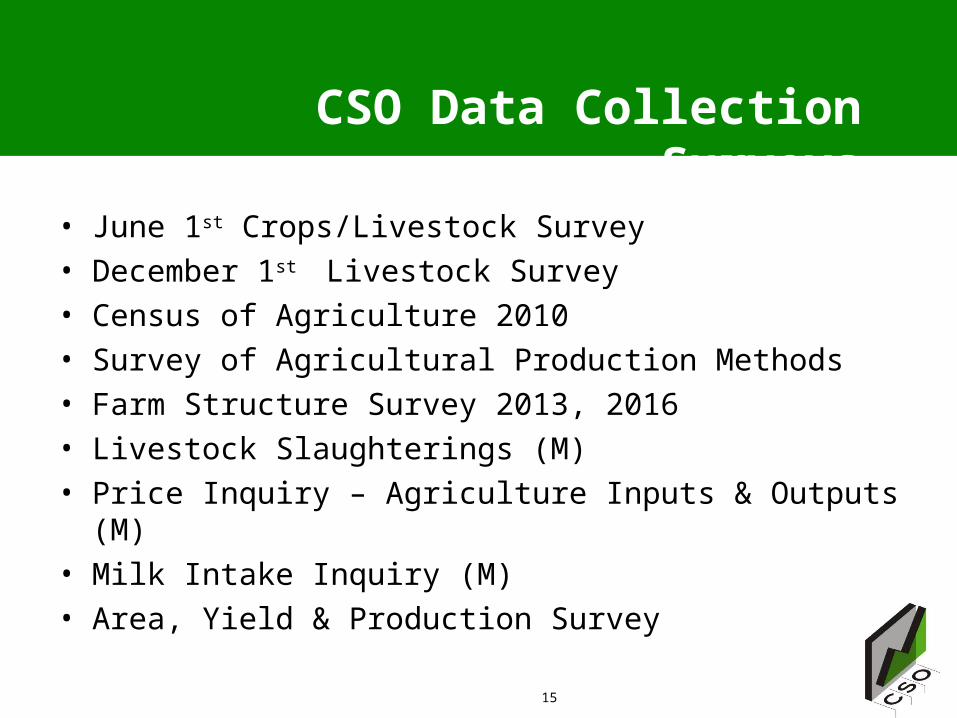
CSO Data Collection Surveys
• June 1st Crops/Livestock Survey• December 1st Livestock Survey• Census of Agriculture 2010• Survey of Agricultural Production Methods• Farm Structure Survey 2013, 2016• Livestock Slaughterings (M)• Price Inquiry – Agriculture Inputs & Outputs (M)• Milk Intake Inquiry (M)• Area, Yield & Production Survey
16
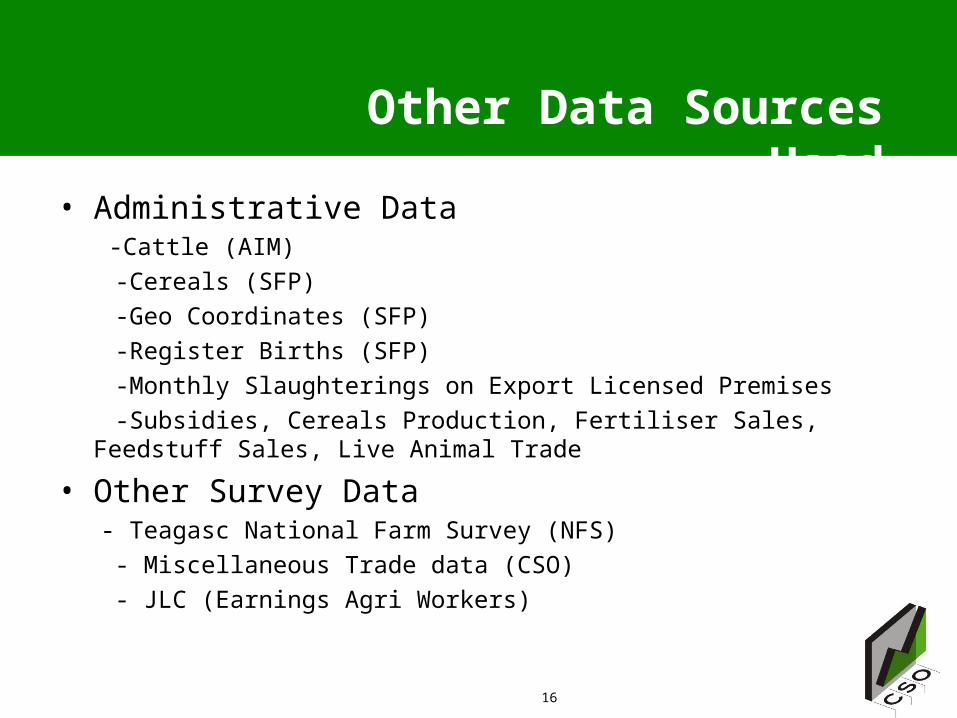
Other Data Sources Used
• Administrative Data -Cattle (AIM)
-Cereals (SFP)
-Geo Coordinates (SFP)
-Register Births (SFP)
-Monthly Slaughterings on Export Licensed Premises
-Subsidies, Cereals Production, Fertiliser Sales, Feedstuff Sales, Live Animal Trade
• Other Survey Data - Teagasc National Farm Survey (NFS)
- Miscellaneous Trade data (CSO)
- JLC (Earnings Agri Workers)
17
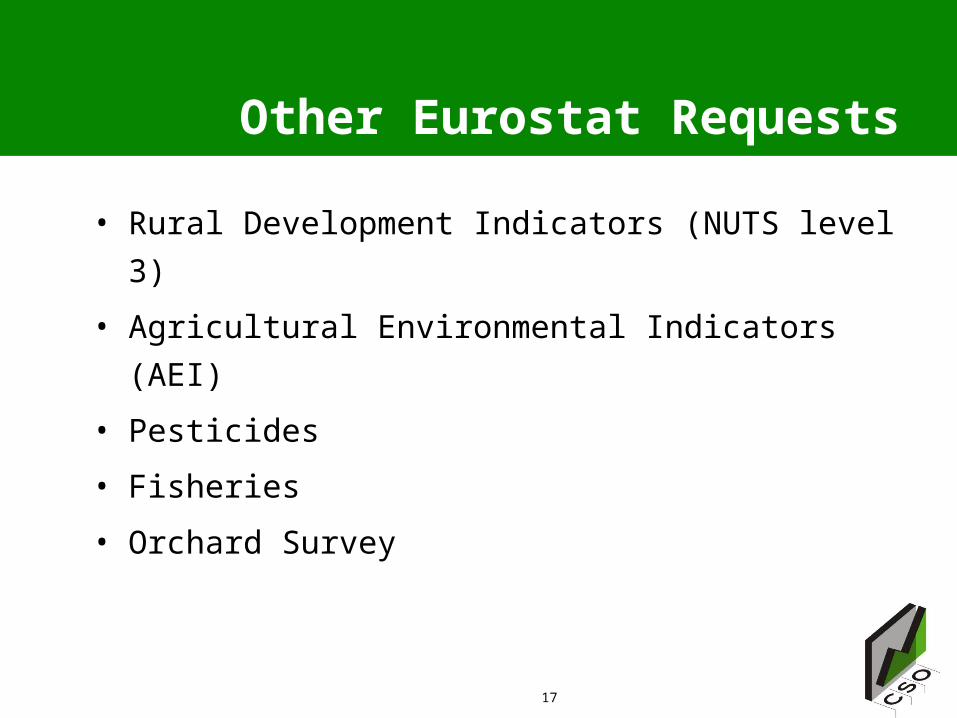
Other Eurostat Requests
• Rural Development Indicators (NUTS level 3)
• Agricultural Environmental Indicators (AEI)
• Pesticides
• Fisheries
• Orchard Survey
18
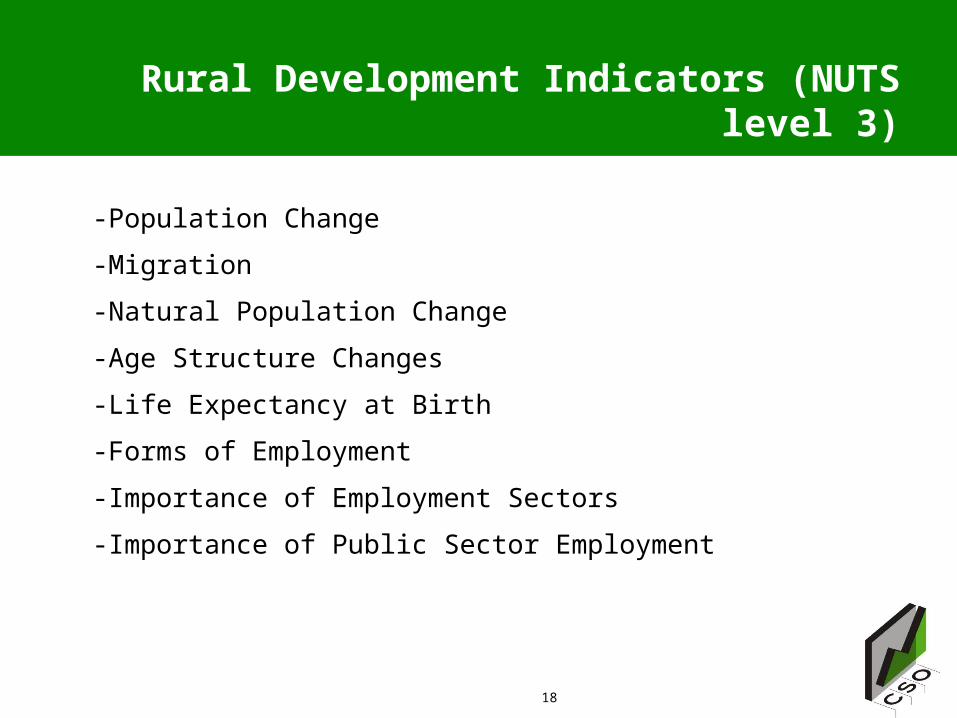
Rural Development Indicators (NUTS level 3)
-Population Change
-Migration
-Natural Population Change
-Age Structure Changes
-Life Expectancy at Birth
-Forms of Employment
-Importance of Employment Sectors
-Importance of Public Sector Employment
19
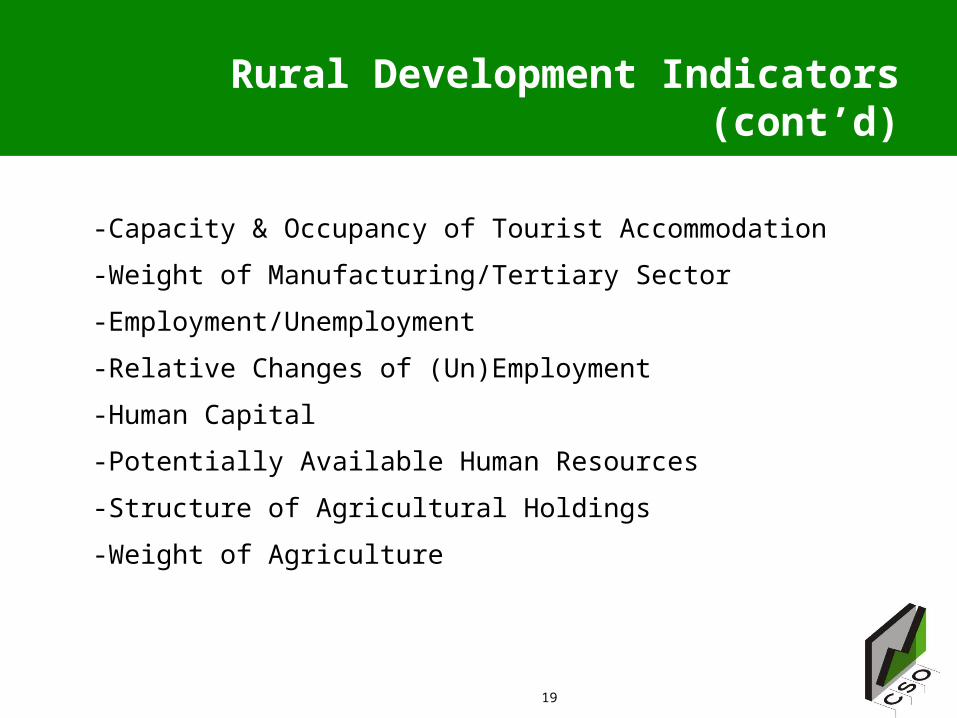
Rural Development Indicators (cont’d)
-Capacity & Occupancy of Tourist Accommodation
-Weight of Manufacturing/Tertiary Sector
-Employment/Unemployment
-Relative Changes of (Un)Employment
-Human Capital
-Potentially Available Human Resources
-Structure of Agricultural Holdings
-Weight of Agriculture
20
Rural Development Indicators (cont’d)
-Productivity of Agricultural Holdings
-Availability of Roads/Railways
-Proximity to Railway Stations
-Supply of & Proximity to Primary/Secondary Schools
-Proximity to University
-Supply of & Proximity to Hospital
-Health & Care
21
Agricultural Environmental Indicators (AEI)
• 28 indicators1. Agri-environmental Commitments
2. Agricultural area under Natura 2000
3. Use of Farm Advisory Services and Farmers Training Level (FSS)
4. Area under Organic Farming (FSS)
5. Mineral Fertiliser Consumption
6. Consumption of Pesticides
7. Irrigation (FSS)
8. Energy use
9. Land Use Charge
10. Cropping/Livestock Patterns (FSS)
22
Agricultural Environmental Indicators (AEI)
11.1 Soil Cover (FSS)
11.2 Tillage Practices
11.3 Manure storage (FSS)
12. Intensification
13. Specialisation (FSS)
14.Risk of Land Abandonment
15. Gross Nitrogen Balances
16. Risk of Pollution by Phosphorus
17. Pesticide Risk
18. Ammonia Emissions
23
Agricultural Environmental Indicators (AEI)
19. GHG Emissions
20. Water Abstraction
21. Soil Erosion
22. Genetic Diversity
23. High Nature Value Farmland
24. Production of Renewable Energy
25. Population in Farmland Birds
26. Soil Quality
27. Water Quality
28. Landscape
24
Challenges
• Maintain Accurate Register of Agriculture Holdings
• Minimize Response Burden
• Maximize Use of Administrative Data
• Maintain Respondent Cooperation
• Meeting Increasing Statistical Demands
• Maintain Timeliness
• Coordination & Quality Assurance Role of CSO
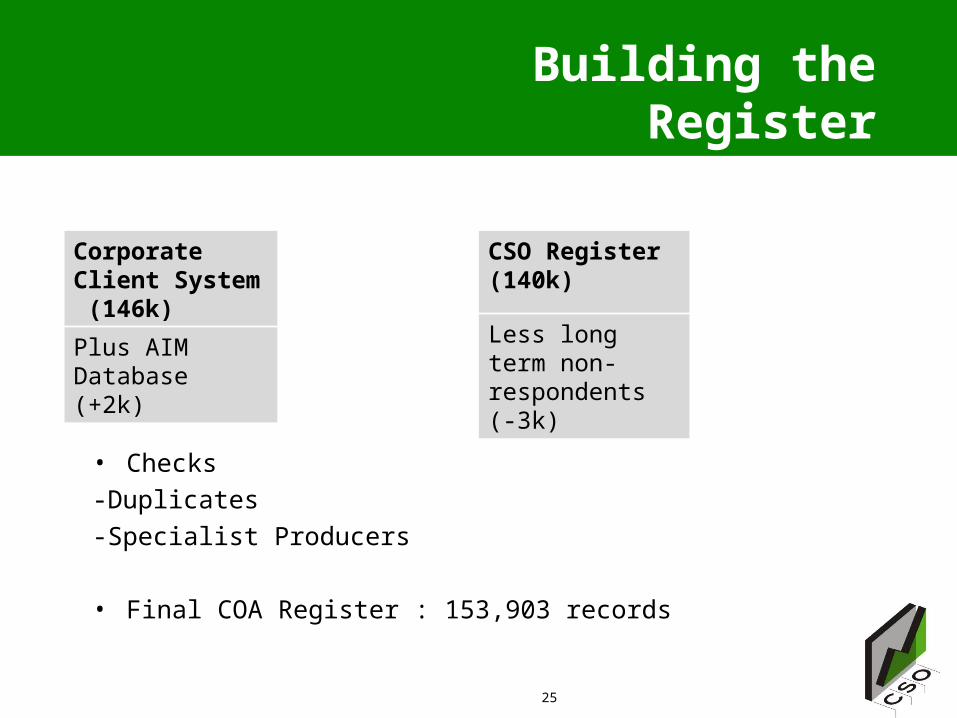
Building the Register
+
• Checks
-Duplicates
-Specialist Producers
• Final COA Register : 153,903 records
25
Corporate Client System (146k)
Plus AIM Database(+2k)
CSO Register (140k)
Less long term non-respondents (-3k)
26
Future Opportunities & Needs
• Rural Development Indicators
• Agri-Environmental Indicators
• Sheep Census
• Web Data Collection
• Combined CSO/DAFF Milk Intake Inquiry
• Soil Quality Indicator Database (EU SILC)
• Agricultural Employment Data (QNHS)
• Meat Supply Balance
• Land Sales
27
Considerations
• Confidentiality
• Response Burden
• Resources
• Professional Independence1
1 Regulation 223/2009 on European Statistics
28
Where to next?
• Final Census 2010 Results
• Utilise DAFF Sheep Census Data
• Combined Milk Inquiry
• Single Farm Register
Over to you………
29
Thank you
Any Questions?
http://www.cso.ie