Embed Size (px)
Citation preview
1
Adjusting Poverty Thresholds Based on Differences in Housing Cost: Application of American Community Survey
Poster Presentation Prepared for the Population Association of America
April 30 – May 2, 2009
Alemayehu BishawPoverty and Health Statistics Branch
2
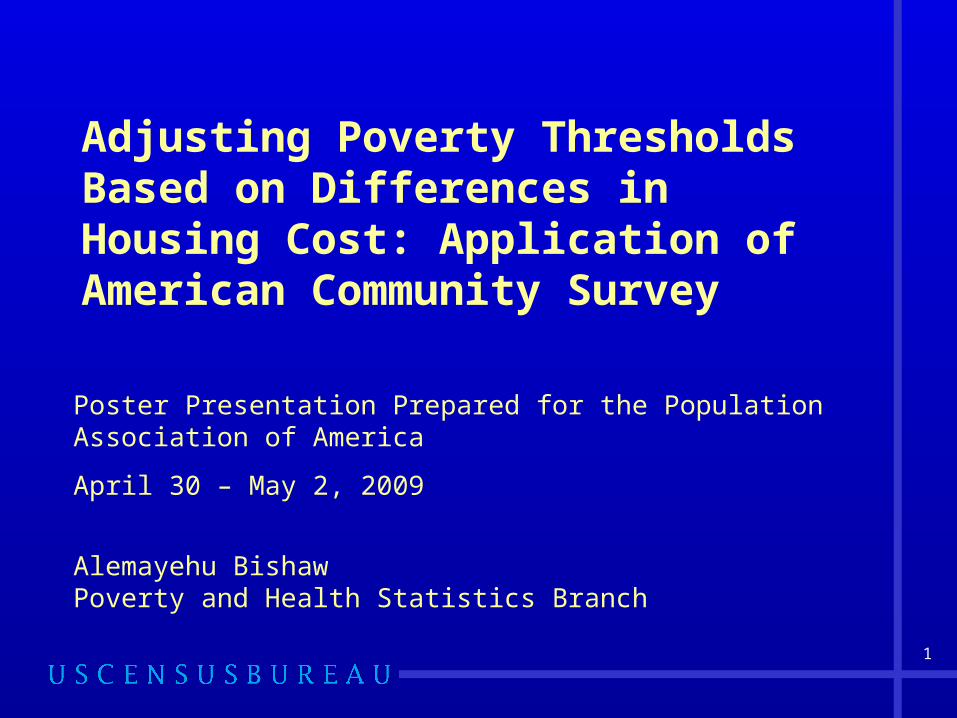
How is Poverty Defined?
Resources Need
Money Income Thresholds (Orshansky)
3
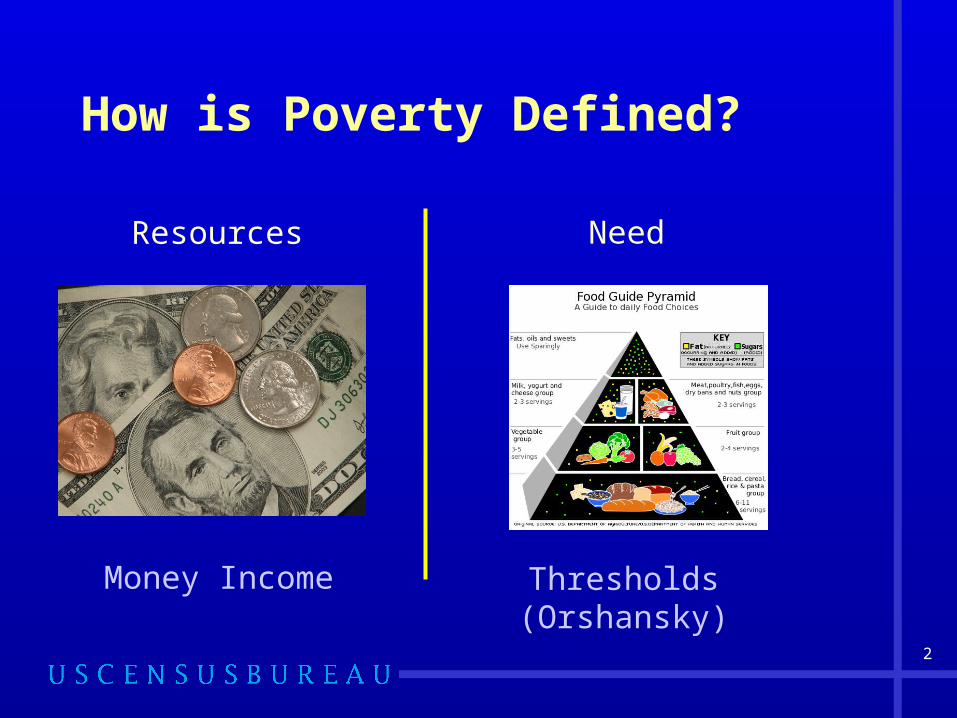
Defining Resources: Income
Poverty status is calculated based on pre-tax money income, which includes earnings, government cash transfers, pensions, property income, child support and regular financial assistance
Does not include government noncash transfers (such as the value of subsidized housing, food stamps, or school lunches) or capital gains
4
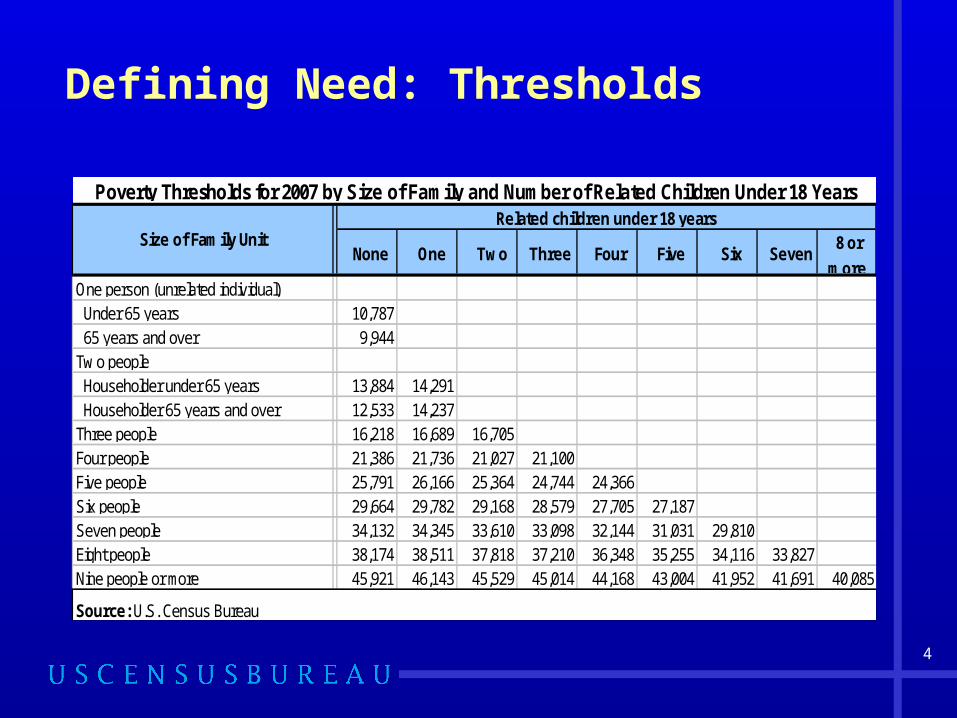
Defining Need: Thresholds
None One Two Three Four Five Six Seven 8 or
moreOne person (unrelated individual) ..Under 65 years 10,787 ..65 years and over 9,944 Two people ..Householder under 65 years 13,884 14,291 ..Householder 65 years and over 12,533 14,237 Three people 16,218 16,689 16,705 Four people 21,386 21,736 21,027 21,100 Five people 25,791 26,166 25,364 24,744 24,366 Six people 29,664 29,782 29,168 28,579 27,705 27,187 Seven people 34,132 34,345 33,610 33,098 32,144 31,031 29,810 Eight people 38,174 38,511 37,818 37,210 36,348 35,255 34,116 33,827 Nine people or more 45,921 46,143 45,529 45,014 44,168 43,004 41,952 41,691 40,085
Source: U.S. Census Bureau
Poverty Thresholds for 2007 by Size of Family and Number of Related Children Under 18 Years
Size of Family UnitRelated children under 18 years
5
Assessment of definition
• Poverty thresholds are based on narrow definition of family need
• Thresholds are applied as one size fits all, that is, they are not adjusted for geographic area cost of living differences
6
NAS Recommendations on Adjusting Poverty thresholds
• Poverty thresholds should be adjusted for differences in cost of housing across geographic areas using decennial census data
• Research should be conducted to determine methods to update the geographic housing cost component of the poverty thresholds between decennial censuses
• Research should be conducted to improve the estimation of geographic cost-of-living differences in housing as well as other components of the poverty budget
7
Data SourcesAmerican Community Survey• Conducted by the U.S. Census Bureau, initial sample of about 3 million addresses
per year, collects data on various housing and population characteristics of the nation
• Serves as a source of poverty estimates for states and lower level of geography.
• Provides housing, person, and household data used to generate geographic price indexes and poverty estimates
HUD Fair Market Rents• Developed by the U.S. Department of Housing and Urban Development for
administration of rental housing subsidies
• Generated with a combination of housing data from decennial census, American Housing Survey (replaced by American Community Survey since FY 2008), and Random Digit Dialing (RDD)
• Fair Market Rents for metro areas and non-metro counties used to generate geographic price indexes
8
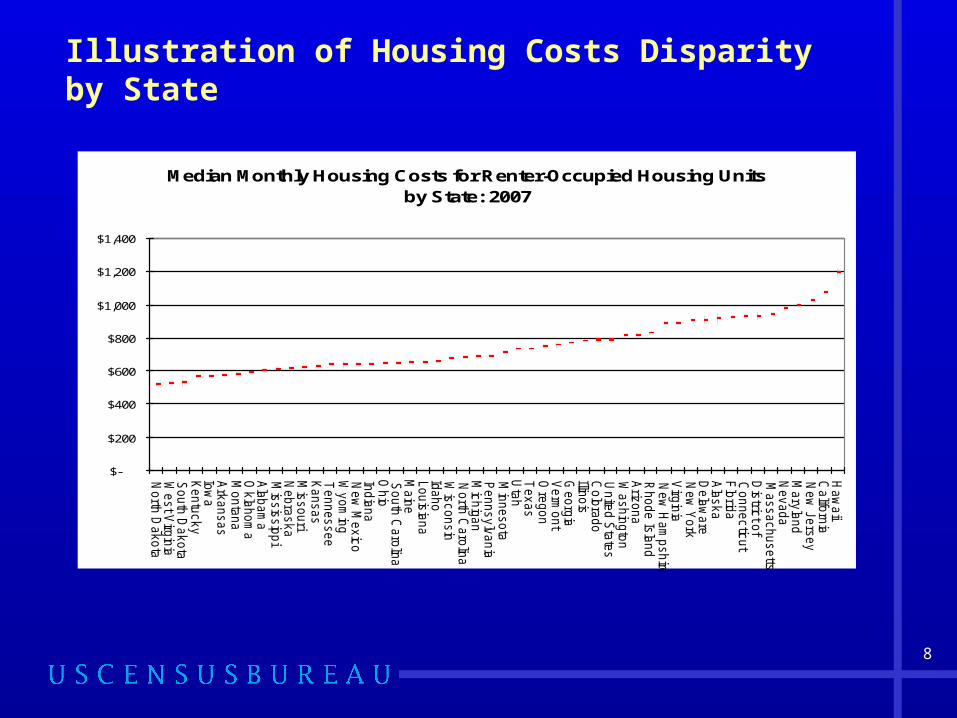
Illustration of Housing Costs Disparity by State
0
10
20
30
40
50
60
70
80
90
1st Qtr 2nd Qtr 3rd Qtr 4th Qtr
East
West
North
Median Monthly Housing Costs for Renter-Occupied Housing Units by State: 2007
$-
$200
$400
$600
$800
$1,000
$1,200
$1,400
North
Dakota
West V
irgin
iaS
outh
Dakota
Kentu
cky
Iow
aA
rkansas
Monta
na
Okla
hom
aA
labam
aM
issis
sip
pi
Nebra
ska
Mis
souri
Kansas
Tennessee
Wyom
ing
New
Mexic
oIn
dia
na
Ohio
South
Caro
lina
Main
eLouis
iana
Idaho
Wis
consin
North
Caro
lina
Mic
hig
an
Pennsylv
ania
Min
nesota
Uta
hT
exas
Ore
gon
Verm
ont
Georg
iaIllin
ois
Colo
rado
Unite
d S
tate
sW
ashin
gto
nA
rizona
Rhode Is
land
New
Ham
pshire
Virg
inia
New
York
Dela
ware
Ala
ska
Flo
rida
Connectic
ut
Dis
trict o
fM
assachusetts
Nevada
Mary
land
New
Jers
ey
Califo
rnia
Haw
aii
9
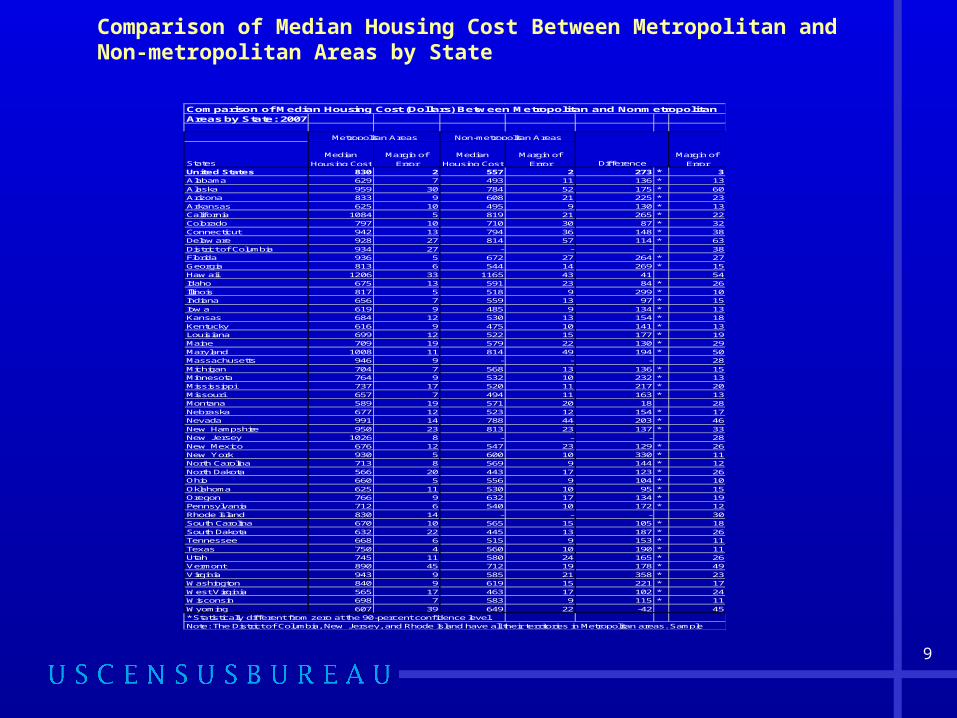
Comparison of Median Housing Cost Between Metropolitan and Non-metropolitan Areas by State
Comparison of Median Housing Cost (Dollars) Between Metropolitan and NonmetropolitanAreas by State: 2007
StatesMedian
Housing Cost
Margin of
Error
Median
Housing Cost
Margin of
ErrorUnited States 830 2 557 2 273 * 3Alabama 629 7 493 11 136 * 13Alaska 959 30 784 52 175 * 60Arizona 833 9 608 21 225 * 23Arkansas 625 10 495 9 130 * 13California 1084 5 819 21 265 * 22Colorado 797 10 710 30 87 * 32Connecticut 942 13 794 36 148 * 38Delaw are 928 27 814 57 114 * 63District of Columbia 934 27 - - - 38Florida 936 5 672 27 264 * 27Georgia 813 6 544 14 269 * 15Haw aii 1206 33 1165 43 41 54Idaho 675 13 591 23 84 * 26Illinois 817 5 518 9 299 * 10Indiana 656 7 559 13 97 * 15Iow a 619 9 485 9 134 * 13Kansas 684 12 530 13 154 * 18Kentucky 616 9 475 10 141 * 13Louisiana 699 12 522 15 177 * 19Maine 709 19 579 22 130 * 29Maryland 1008 11 814 49 194 * 50Massachusetts 946 9 - - - 28Michigan 704 7 568 13 136 * 15Minnesota 764 9 532 10 232 * 13Mississippi 737 17 520 11 217 * 20Missouri 657 7 494 11 163 * 13Montana 589 19 571 20 18 28Nebraska 677 12 523 12 154 * 17Nevada 991 14 788 44 203 * 46New Hampshire 950 23 813 23 137 * 33New Jersey 1026 8 - - - 28New Mexico 676 12 547 23 129 * 26New York 930 5 600 10 330 * 11North Carolina 713 8 569 9 144 * 12North Dakota 566 20 443 17 123 * 26Ohio 660 5 556 9 104 * 10Oklahoma 625 11 530 10 95 * 15Oregon 766 9 632 17 134 * 19Pennsylvania 712 6 540 10 172 * 12Rhode Island 830 14 - - - 30South Carolina 670 10 565 15 105 * 18South Dakota 632 22 445 13 187 * 26Tennessee 668 6 515 9 153 * 11Texas 750 4 560 10 190 * 11Utah 745 11 580 24 165 * 26Vermont 890 45 712 19 178 * 49Virginia 943 9 585 21 358 * 23Washington 840 9 619 15 221 * 17West Virginia 565 17 463 17 102 * 24Wisconsin 698 7 583 9 115 * 11Wyoming 607 39 649 22 -42 45* Statistically different from zero at the 90-percent confidence level.Note: The District of Columbia, New Jersey, and Rhode Island have all their territories in Metropolitan areas. Sample
Margin of
ErrorDifference
Metropolitan Areas Non-metropolitan Areas
10
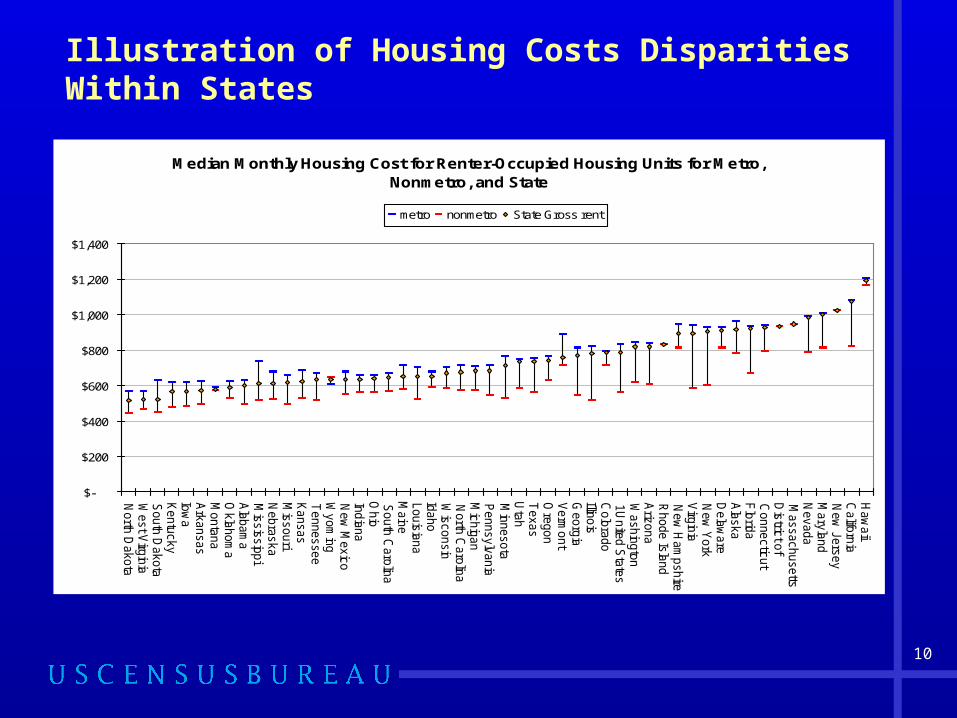
Illustration of Housing Costs Disparities Within States
Median Monthly Housing Cost for Renter-Occupied Housing Units for Metro, Nonmetro, and State
$-
$200
$400
$600
$800
$1,000
$1,200
$1,400
North
Dakota
West V
irgin
iaS
outh
Dakota
Kentu
cky
Iow
aA
rkansas
Monta
na
Okla
hom
aA
labam
aM
issis
sip
pi
Nebra
ska
Mis
souri
Kansas
Tennessee
Wyom
ing
New
Mexic
oIn
dia
na
Ohio
South
Caro
lina
Main
eLouis
iana
Idaho
Wis
consin
North
Caro
lina
Mic
hig
an
Pennsylv
ania
Min
nesota
Uta
hT
exas
Ore
gon
Verm
ont
Georg
iaIllin
ois
Colo
rado
1U
nite
d S
tate
sW
ashin
gto
nA
rizona
Rhode Is
land
New
Ham
pshire
Virg
inia
New
York
Dela
ware
Ala
ska
Flo
rida
Connectic
ut
Dis
trict o
fM
assachusetts
Nevada
Mary
land
New
Jers
ey
Califo
rnia
Haw
aii
metro nonmetro State Gross rent
11
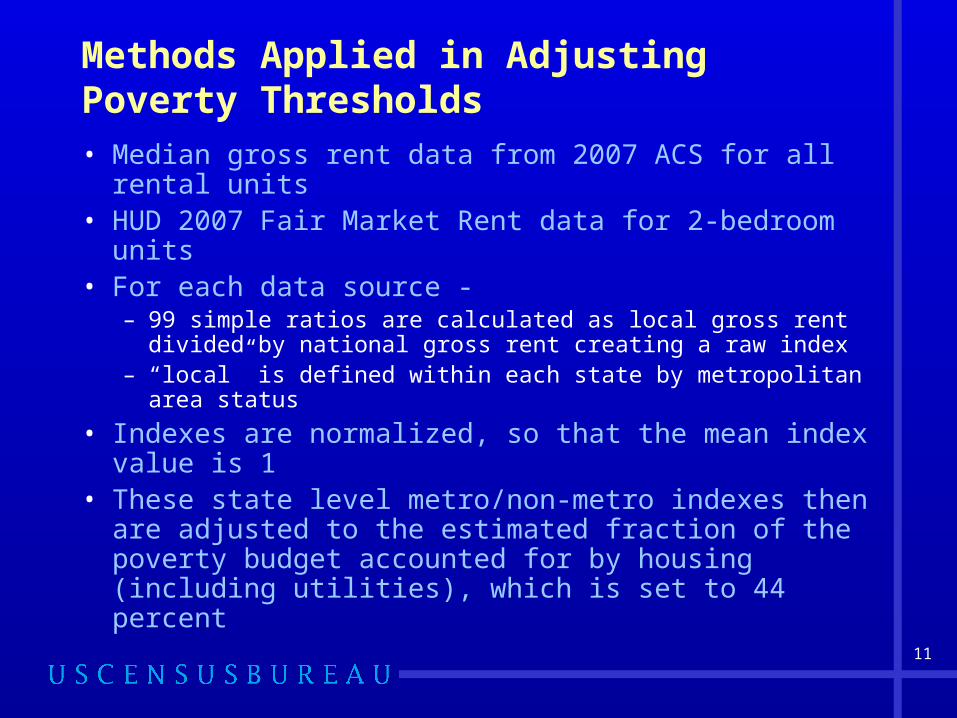
Methods Applied in Adjusting Poverty Thresholds
• Median gross rent data from 2007 ACS for all rental units
• HUD 2007 Fair Market Rent data for 2-bedroom units• For each data source -
– 99 simple ratios are calculated as local gross rent divided by national gross rent creating a raw index
– “local” is defined within each state by metropolitan area status
• Indexes are normalized, so that the mean index value is 1
• These state level metro/non-metro indexes then are adjusted to the estimated fraction of the poverty budget accounted for by housing (including utilities), which is set to 44 percent
12
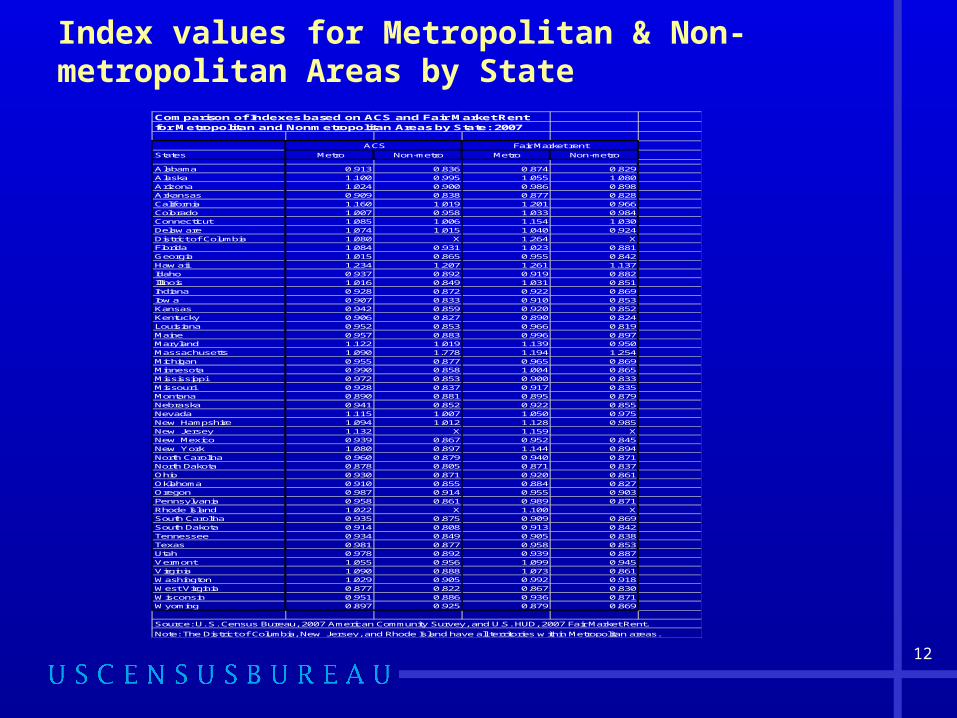
Index values for Metropolitan & Non-metropolitan Areas by State
Comparison of Indexes based on ACS and Fair Market Rentfor Metropolitan and Nonmetropolitan Areas by State: 2007
States Metro Non-metro Metro Non-metro
Alabama 0.913 0.836 0.874 0.829Alaska 1.100 0.995 1.055 1.080Arizona 1.024 0.900 0.986 0.898Arkansas 0.909 0.838 0.877 0.828California 1.160 1.019 1.201 0.966Colorado 1.007 0.958 1.033 0.984Connecticut 1.085 1.006 1.154 1.030Delaw are 1.074 1.015 1.040 0.924District of Columbia 1.080 X 1.264 XFlorida 1.084 0.931 1.023 0.881Georgia 1.015 0.865 0.955 0.842Haw aii 1.234 1.207 1.261 1.137Idaho 0.937 0.892 0.919 0.882Illinois 1.016 0.849 1.031 0.851Indiana 0.928 0.872 0.922 0.869Iow a 0.907 0.833 0.910 0.853Kansas 0.942 0.859 0.920 0.852Kentucky 0.906 0.827 0.890 0.824Louisiana 0.952 0.853 0.966 0.819Maine 0.957 0.883 0.996 0.897Maryland 1.122 1.019 1.139 0.950Massachusetts 1.090 1.778 1.194 1.254Michigan 0.955 0.877 0.965 0.869Minnesota 0.990 0.858 1.004 0.865Mississippi 0.972 0.853 0.900 0.833Missouri 0.928 0.837 0.917 0.835Montana 0.890 0.881 0.895 0.879Nebraska 0.941 0.852 0.922 0.855Nevada 1.115 1.007 1.050 0.975New Hampshire 1.094 1.012 1.128 0.985New Jersey 1.132 X 1.159 XNew Mexico 0.939 0.867 0.952 0.845New York 1.080 0.897 1.144 0.894North Carolina 0.960 0.879 0.940 0.871North Dakota 0.878 0.805 0.871 0.837Ohio 0.930 0.871 0.920 0.861Oklahoma 0.910 0.855 0.884 0.827Oregon 0.987 0.914 0.955 0.903Pennsylvania 0.958 0.861 0.989 0.871Rhode Island 1.022 X 1.100 XSouth Carolina 0.935 0.875 0.909 0.869South Dakota 0.914 0.808 0.913 0.842Tennessee 0.934 0.849 0.905 0.838Texas 0.981 0.877 0.958 0.853Utah 0.978 0.892 0.939 0.887Vermont 1.055 0.956 1.099 0.945Virginia 1.090 0.888 1.073 0.861Washington 1.029 0.905 0.992 0.918West Virginia 0.877 0.822 0.867 0.830Wisconsin 0.951 0.886 0.936 0.871Wyoming 0.897 0.925 0.879 0.869
Source: U. S. Census Bureau, 2007 American Community Survey, and U.S. HUD, 2007 Fair Market Rent.
Note: The District of Columbia, New Jersey, and Rhode Island have all territories w ithin Metropolitan areas.
ACS Fair Market rent
13
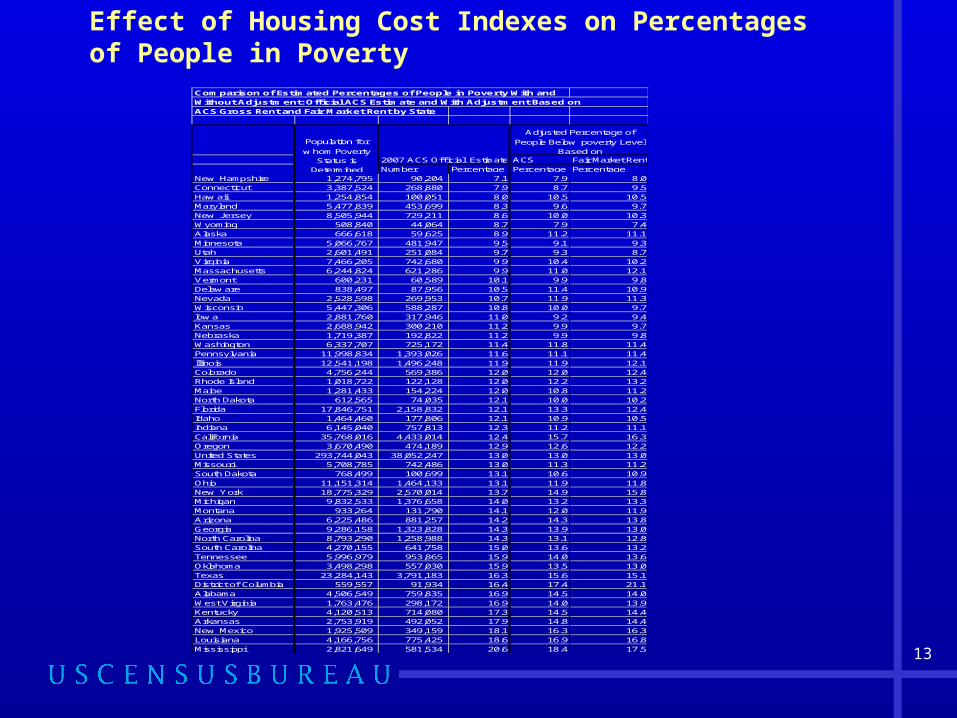
Effect of Housing Cost Indexes on Percentages of People in Poverty
Comparison of Estimated Percentages of People in Poverty With andWithout Adjustment: Official ACS Estimate and With Adjustment Based onACS Gross Rent and Fair Market Rent by State
ACS Fair Market RentNumber Percentage Percentage Percentage
New Hampshire 1,274,795 90,204 7.1 7.9 8.0Connecticut 3,387,524 268,880 7.9 8.7 9.5Hawaii 1,254,854 100,051 8.0 10.5 10.5Maryland 5,477,839 453,699 8.3 9.6 9.7New Jersey 8,505,944 729,211 8.6 10.0 10.3Wyoming 508,840 44,064 8.7 7.9 7.4Alaska 666,618 59,625 8.9 11.2 11.1Minnesota 5,066,767 481,947 9.5 9.1 9.3Utah 2,601,491 251,084 9.7 9.3 8.7Virginia 7,466,205 742,680 9.9 10.4 10.2Massachusetts 6,244,824 621,286 9.9 11.0 12.1Vermont 600,231 60,589 10.1 9.9 9.8Delaware 838,497 87,956 10.5 11.4 10.9Nevada 2,528,598 269,953 10.7 11.9 11.3Wisconsin 5,447,306 588,287 10.8 10.0 9.7Iowa 2,881,760 317,946 11.0 9.2 9.4Kansas 2,688,942 300,210 11.2 9.9 9.7Nebraska 1,719,387 192,822 11.2 9.9 9.8Washington 6,337,707 725,172 11.4 11.8 11.4Pennsylvania 11,998,834 1,393,026 11.6 11.1 11.4Illinois 12,541,198 1,496,248 11.9 11.9 12.1Colorado 4,756,244 569,386 12.0 12.0 12.4Rhode Island 1,018,722 122,128 12.0 12.2 13.2Maine 1,281,433 154,224 12.0 10.8 11.2North Dakota 612,565 74,035 12.1 10.0 10.2Florida 17,846,751 2,158,832 12.1 13.3 12.4Idaho 1,464,460 177,806 12.1 10.9 10.5Indiana 6,145,040 757,813 12.3 11.2 11.1California 35,768,016 4,433,014 12.4 15.7 16.3Oregon 3,670,490 474,189 12.9 12.6 12.2United States 293,744,043 38,052,247 13.0 13.0 13.0Missouri 5,708,785 742,486 13.0 11.3 11.2South Dakota 768,499 100,699 13.1 10.6 10.9Ohio 11,151,314 1,464,133 13.1 11.9 11.8New York 18,775,329 2,570,014 13.7 14.9 15.8Michigan 9,832,533 1,376,658 14.0 13.2 13.3Montana 933,264 131,790 14.1 12.0 11.9Arizona 6,225,486 881,257 14.2 14.3 13.8Georgia 9,286,158 1,323,828 14.3 13.9 13.0North Carolina 8,793,290 1,258,988 14.3 13.1 12.8South Carolina 4,270,155 641,758 15.0 13.6 13.2Tennessee 5,996,979 953,865 15.9 14.0 13.6Oklahoma 3,498,298 557,030 15.9 13.5 13.0Texas 23,284,143 3,791,183 16.3 15.6 15.1District of Columbia 559,557 91,934 16.4 17.4 21.1Alabama 4,506,549 759,835 16.9 14.5 14.0West Virginia 1,763,476 298,172 16.9 14.0 13.9Kentucky 4,120,513 714,080 17.3 14.5 14.4Arkansas 2,753,919 492,052 17.9 14.8 14.4New Mexico 1,925,509 349,159 18.1 16.3 16.3Louisiana 4,166,756 775,425 18.6 16.9 16.8Mississippi 2,821,649 581,534 20.6 18.4 17.5
Adjusted Percentage of
People Below poverty Level Based on
Population for
whom Poverty Status is
Determined
2007 ACS Official Estimate
14
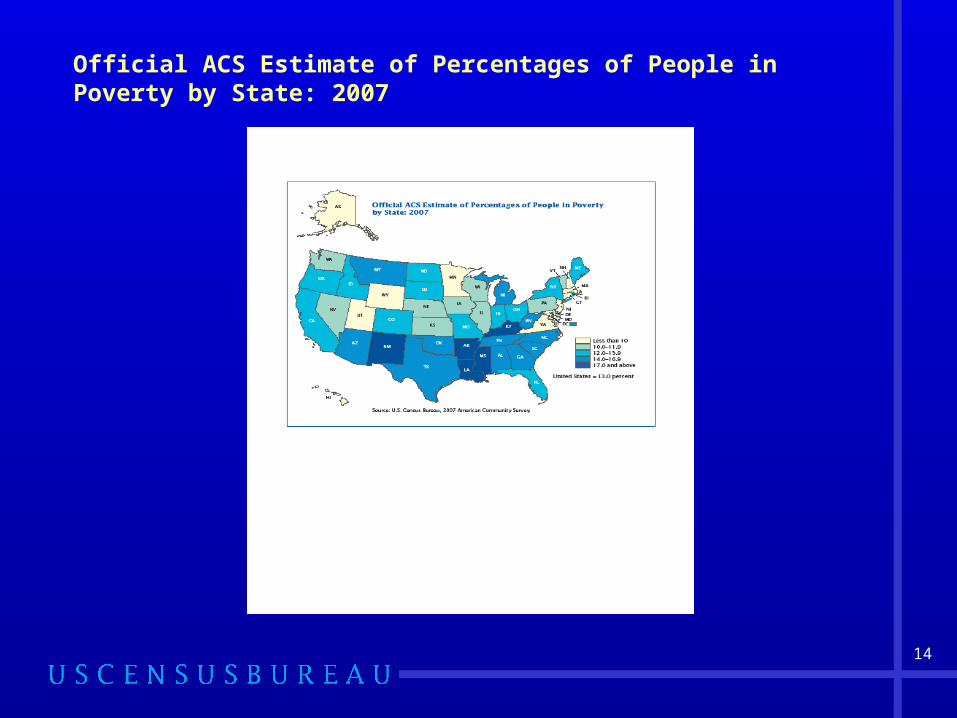
Official ACS Estimate of Percentages of People in Poverty by State: 2007
15
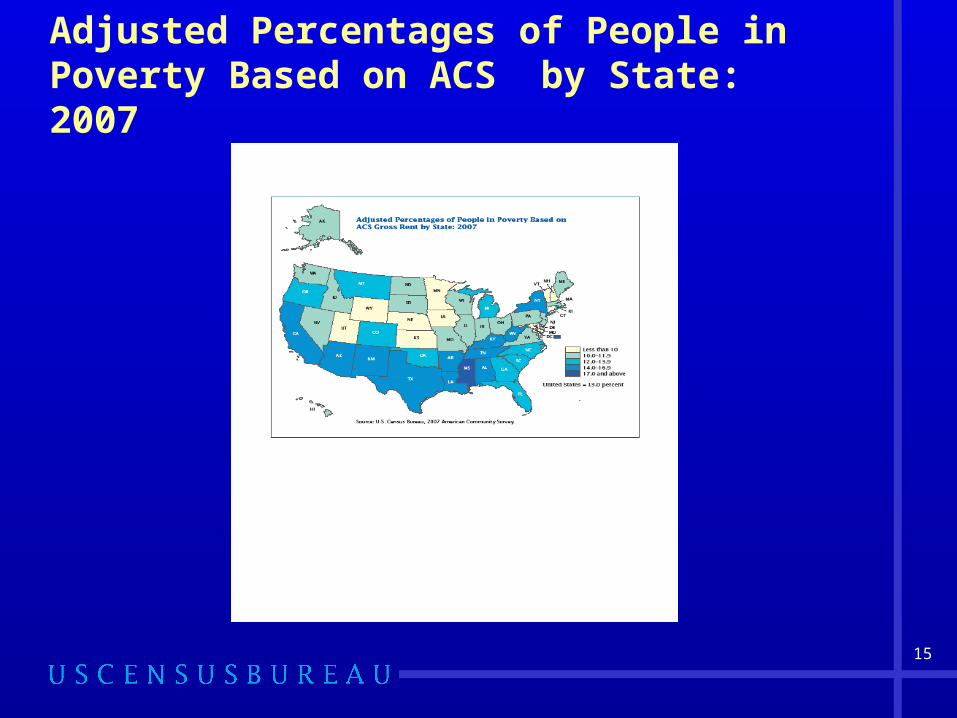
Adjusted Percentages of People in Poverty Based on ACS by State: 2007
16
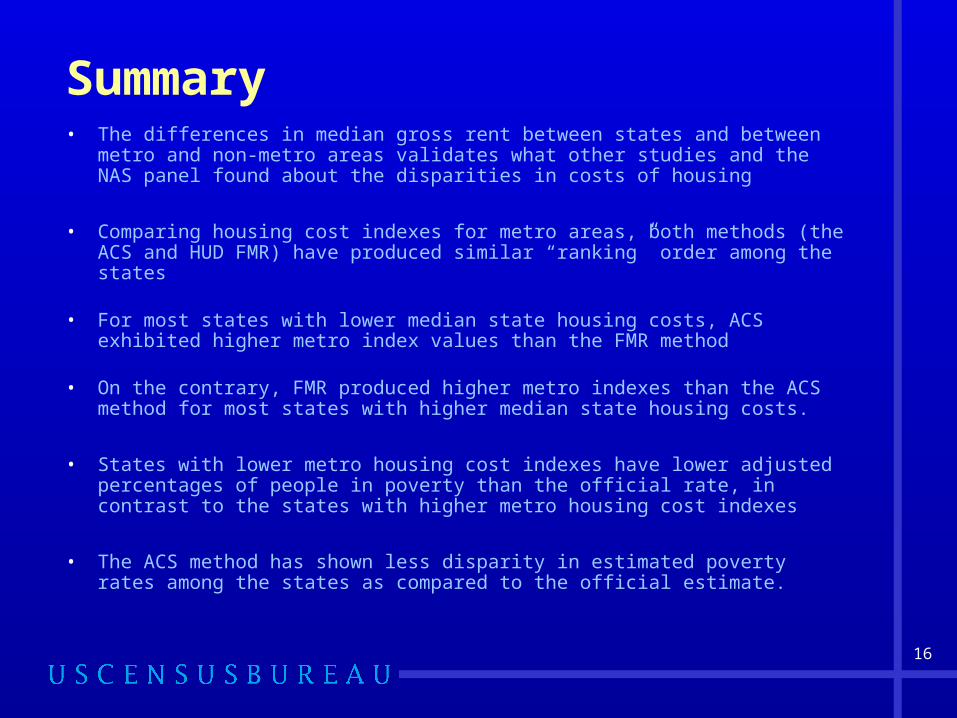
Summary• The differences in median gross rent between states and between metro and
non-metro areas validates what other studies and the NAS panel found about the disparities in costs of housing
• Comparing housing cost indexes for metro areas, both methods (the ACS and HUD FMR) have produced similar “ranking” order among the states
• For most states with lower median state housing costs, ACS exhibited higher metro index values than the FMR method
• On the contrary, FMR produced higher metro indexes than the ACS method for most states with higher median state housing costs.
• States with lower metro housing cost indexes have lower adjusted percentages of people in poverty than the official rate, in contrast to the states with higher metro housing cost indexes
• The ACS method has shown less disparity in estimated poverty rates among the states as compared to the official estimate.
17
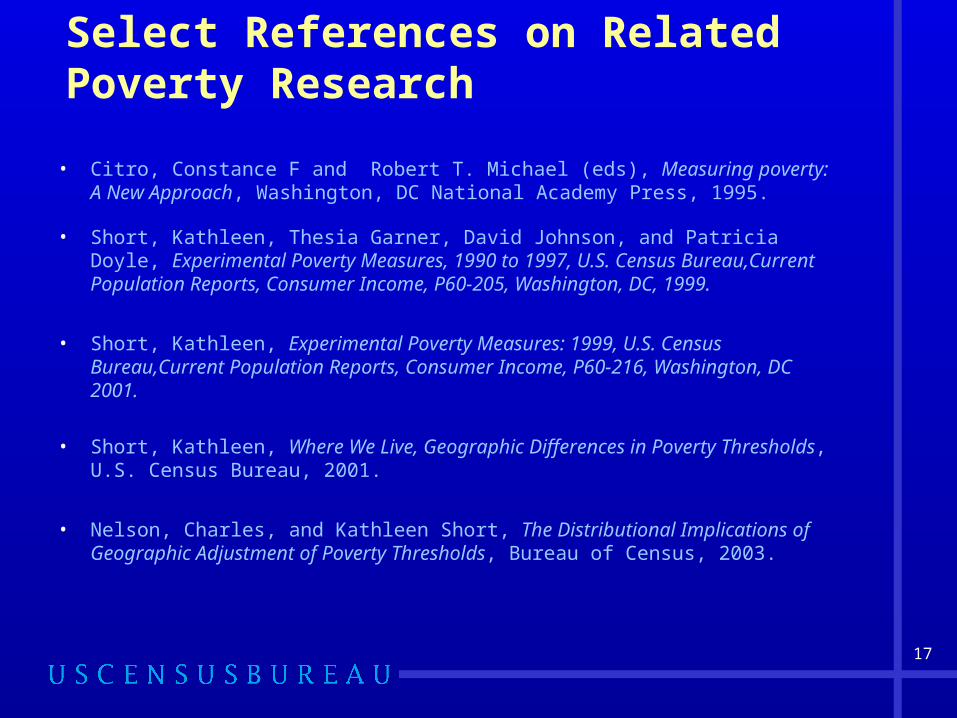
Select References on Related Poverty Research
• Citro, Constance F and Robert T. Michael (eds), Measuring poverty: A New Approach, Washington, DC National Academy Press, 1995.
• Short, Kathleen, Thesia Garner, David Johnson, and Patricia Doyle, Experimental Poverty Measures, 1990 to 1997, U.S. Census Bureau,Current Population Reports, Consumer Income, P60-205, Washington, DC, 1999.
• Short, Kathleen, Experimental Poverty Measures: 1999, U.S. Census Bureau,Current Population Reports, Consumer Income, P60-216, Washington, DC 2001.
• Short, Kathleen, Where We Live, Geographic Differences in Poverty Thresholds, U.S. Census Bureau, 2001.
• Nelson, Charles, and Kathleen Short, The Distributional Implications of Geographic Adjustment of Poverty Thresholds, Bureau of Census, 2003.
18
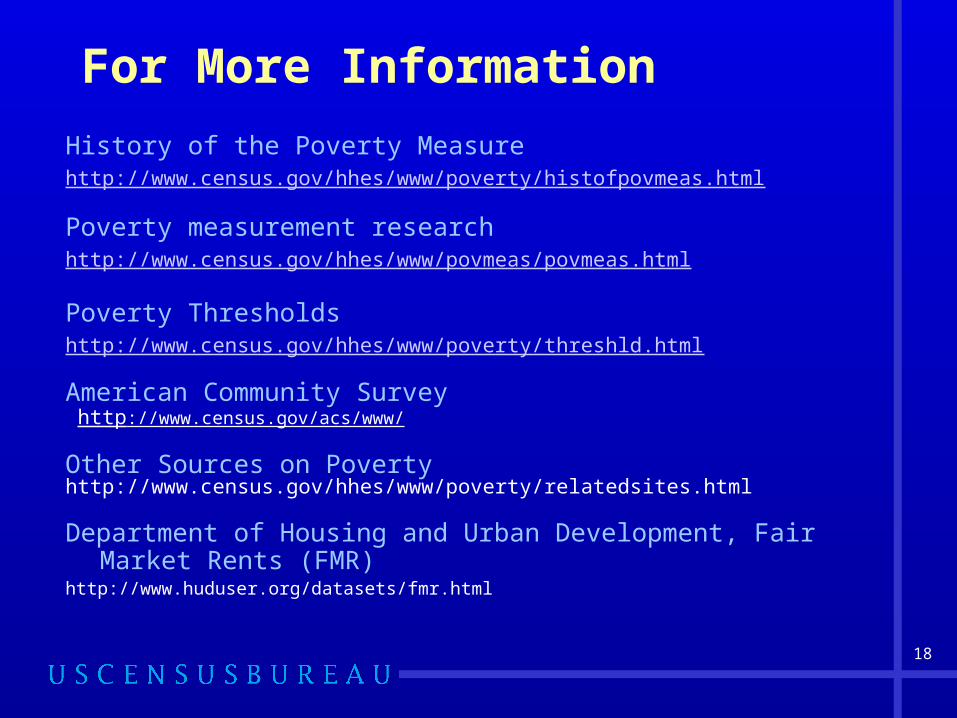
For More Information
History of the Poverty Measurehttp://www.census.gov/hhes/www/poverty/histofpovmeas.html
Poverty measurement researchhttp://www.census.gov/hhes/www/povmeas/povmeas.html
Poverty Thresholdshttp://www.census.gov/hhes/www/poverty/threshld.html
American Community Survey http://www.census.gov/acs/www/
Other Sources on Povertyhttp://www.census.gov/hhes/www/poverty/relatedsites.html
Department of Housing and Urban Development, Fair Market Rents (FMR)
http://www.huduser.org/datasets/fmr.html
19
Further Questions
Alemayehu Bishaw
Poverty and Health Statistics Branch
Housing & and Household Economic Statistics
Bureau of the Census
Department of Commerce
Alemayehu.bishaw@census .gov
(301) 763 5628