Embed Size (px)
Citation preview

1
Adaptive geographical clines in the growth and defense of a native plant 1
2
3
Ellen C. Woods1, Amy P. Hastings1, Nash E. Turley2,3, Stephen B. Heard4, Anurag A. 4
Agrawal1,5,6 5
6
1Department of Ecology and Evolutionary Biology, Cornell University, Corson Hall, 7
Ithaca, NY 14853-2701 (USA) 8
2Department of Plant Biology, Box 7612, North Carolina State University, Raleigh, 9
North Carolina 27695-7612 (USA) 10
3Current address: Department of Biology, University of Toronto Mississauga, 3359 11
Mississauga Road North, Mississauga, Ontario, L5L 1C6 (Canada) 12
4 Department of Biology, University of New Brunswick, Fredericton, New Brunswick, 13
E3B 1R3 (Canada) 14
5Department of Entomology, Cornell University, Comstock Hall, Ithaca, NY 14853 15
(USA) 16
6correspondence: [email protected] 17
18
Running head: Latitude shapes milkweed growth and defense 19
20
21
2
ABSTRACT 22
Broad-scale geographical gradients in the abiotic environment and interspecific 23
interactions should select for clinal adaptation. How trait clines evolve has recently 24
received increased attention because of anticipated climate change and the importance of 25
rapid evolution in invasive species. This issue is particularly relevant for clines in growth 26
and defense of plants, because both sets of traits are closely tied to fitness and because 27
such sessile organisms experience strong local selection. Yet, despite widespread 28
recognition that growth and defense traits are intertwined, the general issue of their joint 29
clinal evolution is not well-resolved. 30
To address heritable clinal variation and adaptation of growth and defense traits of 31
common milkweed (Asclepias syriaca), we planted seed from 22 populations 32
encompassing the species’ latitudinal range in common gardens near the range center 33
(New York [NY]) and towards the range edges (New Brunswick [NB] and North 34
Carolina [NC]). Populations were differentiated in 13 traits, and six traits showed 35
genetically-based latitudinal clines. Higher latitude populations had earlier phenology, 36
lower shoot biomass, more root buds and clonal growth, higher root-to-shoot ratio, and 37
greater latex production. The cline in shoot biomass was consistent in all three locations. 38
Selection on phenology was reversed in NB and NC, with early genotypes favored in the 39
north but not the south. We found no clines in foliar trichomes or toxic cardenolides. 40
Annual precipitation of source populations explained variation in phenology, clonal 41
growth, root-to-shoot ratio, and latex. Across four traits measured in NB and NC, we 42
found garden-by-latitude (and garden-by-precipitation) interactions, indicating plasticity 43
in genetically-based trait clines. 44
3
In the two gardens with substantial herbivory (NY and NC), northern populations 45
showed higher resistance to insects. Resistance to aphids was driven by trichomes and 46
water content, while resistance to monarch caterpillars was driven by latex. However, 47
surveys of natural populations indicated that leaf damage and insect diversity on 48
milkweed are low at the geographical extremes (NB and NC) and higher towards the 49
range center. We speculate that milkweed plants evolved clines in growth traits in 50
response to climate, and that this set the template for tolerance to herbivory, which 51
subsequently shaped the evolution of defensive traits. 52
53
Key Words: clinal adaptation, common milkweed Asclepias syriaca, latitudinal 54
gradients, latex, monarch butterfly Danaus plexippus, phenology, plant-insect 55
interactions, plant life-history strategy, precipitation, reciprocal transplant experiment 56
57
INTRODUCTION 58
Discovering the patterns and processes of adaptation to ecological gradients has 59
been of central importance in the development of population biology (Mayr 1956, Harper 60
1977, Lambers et al. 1998). In particular, deciphering the evolutionary ecology of trait 61
clines aids in understanding how biotic and abiotic factors interact to shape organismal 62
evolution over large geographic scales. When studies of conspecific individuals collected 63
from multiple populations are conducted in common environments, a heritable basis to 64
traits and their clinal variation can be inferred, with genetically-based geographical clines 65
thought to signify adaptation (Turesson 1930, Endler 1977, Hall et al. 2007, Stillwell et 66
al. 2007). Common environment studies are critical because phenotypic plasticity in 67

4
response to growing conditions can also generate clines, and such plasticity can obscure 68
genetically-based trait expression. Thus, reciprocal transplant experiments are the most 69
rigorous way of demonstrating adaptive clines, as the genetic and environmental basis of 70
trait expression can be tied to fitness components in matched and mismatched 71
environments (Clausen et al. 1948, Chapin and Chapin 1981, Santamaría et al. 2003, 72
Maron et al. 2004). Where reciprocal transplants are impractical, as with many animal 73
species, measures of natural selection along the gradient can demonstrate the adaptive 74
value of trait clines (Antoniazza et al. 2010, Stillwell 2010). 75
Studies of latitudinal clines in life-history strategy have recently accelerated 76
because of their importance to two aspects of global change. First, rapid evolution has 77
been recognized in invasive plant and animal species following introduction to new 78
environments (Huey et al. 2000, Kolbe et al. 2004, Colautti et al. 2009). For example, 79
Maron et al. (2004) showed that genetically-based trait clines in native and invasive 80
populations of St. John's Wort (Hypericum perforatum) have converged, suggesting that 81
performance traits are locally adapted. Parallel studies on native and invasive fruit flies 82
have similarly shown rapid evolution of geographical clines (Huey et al. 2000). Second, 83
anticipated global climate change has called attention to the potential for organisms to 84
rapidly adapt to environmental change, but whether species can realize this potential will 85
depend on various ecological factors and intrinsic genetic attributes (Spicer and Chapman 86
1990, Arft et al. 1999, Davis et al. 2005, Skelly et al. 2007, Colautti et al. 2010). 87
The study of geographical clines had been a particular focus for plant ecologists, 88
because climate has very strong impacts on plant performance and because sessile 89
organisms are likely to experience strong local selection. Latitudinal gradients in climatic 90
5
variables, including temperature, growing season length, and precipitation, have shaped 91
intraspecific clines in plant traits, especially those related to life history (Chapin et al. 92
1993). For example, high latitude populations tend to evolve small seededness (Li et al. 93
1998, Moles et al. 2007), earlier phenologies (Turesson 1930, Winn and Gross 1993, 94
Montague et al. 2008), slower growth rates (Chapin and Chapin 1981, Li et al. 1998), and 95
greater investment in clonal over sexual reproduction (Pilon et al. 2003). However, the 96
role of such clines in the broader context of ecogeographic variation (e.g., interspecific 97
interactions) is thus far little explored (Agrawal 2011). 98
A largely separate ecological literature has developed on biogeographic clines in 99
species interactions. Although notions of latitudinal variation in diversity and 100
interactions predate Darwin and Wallace (Helferich 2004), Dobzhansky (1950) solidified 101
the hypothesis that the intensity of biotic interactions increases at lower latitudes, 102
favoring the evolution of exaggerated values of traits that mediate these interactions. In a 103
recent review spanning animal and plant systems, evidence for stronger per capita 104
interactions at lower latitudes was found for predation and herbivory (Schemske et al. 105
2009). Coley and Barone (1996) more specifically summarized clinal variation in 106
herbivory, hypothesizing that the warmer and less seasonal climates of tropical latitudes 107
make higher levels of insect attack possible. Most work in this area, on terrestrial plants 108
and oceanic seaweeds, has been comparative across species and has contrasted temperate 109
versus tropical species (Bolser and Hay 1996, Coley and Barone 1996, Schemske et al. 110
2009). At an intraspecific level, recent work by Pennings and colleagues has shown that 111
genetically-based plant resistance traits are higher at lower latitudes for several temperate 112
6
plant species, and this corresponds to greater levels of herbivory in natural populations 113
and bioassays (Siska et al. 2002, Salgado and Pennings 2005, Pennings et al. 2009). 114
An alternative to latitudinal clines in herbivory is the possibility that distance (in 115
any direction) away from the range center is associated with altered species interactions 116
(Garcia et al. 2000, Alexander et al. 2007, Gaston 2009). The logic behind this prediction 117
is that near the range center, high abundances of the focal species may result in altered 118
interaction strengths compared to sparser populations away from the range-center 119
(Alexander et al. 2007). Interestingly, under the former “latitudinal” hypothesis, clines in 120
climate-related and defense-related traits should be matched, while under the latter “range 121
center” hypothesis, climate-related traits should directionally relate latitude, but defense-122
related traits should peak at intermediate latitudes (i.e., near the range center). In either 123
case, the joint evolution of growth and defensive traits along biogeographical gradients 124
constitutes a remarkable gap in our understanding of plant adaptation. 125
The above logic assumes that growth and defense are able to respond 126
independently to selection, but in fact the growth and defense strategies of plants are 127
evolutionarily intertwined in at least two ways. First, defense is hypothesized to be costly 128
and to compete with growth for resources (Simms 1992, Agrawal et al. 2010), and this 129
should limit maximal adaptation, maintain variation, and promote phenotype-130
environmental matches. Second, plant growth rate has been predicted to evolve in 131
concert with the resource availability of environments (slower growth rates in lower 132
resource environments), and this is thought to set the template for defensive adaptations 133
(Coley et al. 1985, Fine et al. 2004). In particular, because the replacement value of 134
tissues is higher for slower growing plants, intrinsically slow-growing plants are 135
7
somewhat paradoxically predicted to invest in greater levels of defense than faster 136
growing plants (even though low resource availability might make such investment more 137
costly). Biogeographic clines in resource availability and biotic interactions may 138
therefore conspire to impact growth and defense strategies either concordantly or 139
antagonistically. For instance, if both resource availability and the intensity of herbivory 140
increase at lower latitudes, there may be selection for increased growth rates and defense 141
at such latitudes, but the joint evolution of these traits may be constrained. Thus, an 142
integrative approach to studying plant strategies along ecological gradients would address 143
long-standing hypotheses about the population biology of widely distributed organisms 144
and the evolutionary ecology of their interactions with the abiotic and biotic environment 145
(Hunter et al. 1996, Agrawal 2011). 146
Here we focus on how growth and defense traits of native common milkweed 147
(Asclepias syriaca) have adapted along a latitudinal gradient in response to abiotic 148
(climate) and biotic (herbivory) factors (Figure 1). We used common garden experiments 149
in conjunction with observations of natural populations to investigate genetically-based 150
latitudinal clines in plant allocation. Specifically, we grew common milkweed in three 151
geographic locations from 22 populations spanning the approximate range of the species, 152
over 10 degrees of latitude (>1,500 km). We report on clines in growth and defense traits 153
to disentangle how the abiotic and biotic environments may impose natural selection for 154
generating these latitudinal gradients. We also conducted surveys of herbivores and 155
herbivory damage in multiple populations at the edges and center of the species range to 156
address the role of altered biotic interactions in generating the genetically-based clines we 157
observed in the common gardens. 158
8
159
MATERIALS AND METHODS 160
Natural history 161
Common milkweed, Asclepias syriaca L. (Apocynaceae), is a perennial plant 162
whose native range is thought to extend from New Brunswick, Canada to Virginia, USA 163
and as far west as Kansas and North Dakota (Woodson 1954). Near the center of its range 164
in central New York, plants typically emerge from perennial rootstocks in late May, 165
flower in late June through most of July, and mature fruits and disperse seeds well into 166
October. In the past few decades, A. syriaca has expanded its range further north in 167
Canada and as far south in the United States as Georgia and Louisiana, probably due to 168
human-caused disturbance and transport (Wyatt et al. 1993, Wyatt 1996). Asclepias 169
syriaca reproduces both asexually via underground rhizome-like stems and sexually via 170
perfect flowers. After pollination, A. syriaca produces fruit pods (follicles). Because 171
seeds of A. syriaca are sired by insertion of a pollinium, all seeds from one follicle have 172
the same sire and represent a full-sibling genetic family (Gold and Shore 1995). 173
Asclepias syriaca produces a suite of well-known anti-herbivore defenses 174
(Agrawal 2005). These traits are effective against many generalist herbivores, and 175
milkweeds are rarely damaged by vertebrate browsing, or by generalist insects such as 176
grasshoppers (see more on this issue in the next section). The most important agents of 177
herbivore damage to A. syriaca are approximately twelve species of specialist herbivores. 178
In particular, three aphids (Smith et al. 2008), three beetles (Agrawal and Van Zandt 179
2003, Agrawal 2004, Van Zandt and Agrawal 2004), two lygeaid bugs, a leaf mining fly, 180
and three lepidopterans (Agrawal and Malcolm 2002, Agrawal 2005) attack the plant 181
9
near the center of its range in central New York. Asclepias syriaca employs constitutive 182
and induced plant defenses, the most potent of which are latex (Zalucki and Malcolm 183
1999, Van Zandt and Agrawal 2004, Agrawal and Konno 2009) and cardiac glycosides 184
(cardenolides) (Malcolm 1991, Agrawal 2005). Latex in A. syriaca is transported 185
throughout the plant by specialized canals (laticifers), and exudes from plant tissue upon 186
damage (Figure 1). Milkweed latex is extremely gummy, which can result in a physical 187
barrier to feeding, and in addition has several concentrated toxins (Agrawal and Konno 188
2009). Cardenolides are toxic steroids that disrupt cellular sodium-potassium pumps, and 189
are present in all plant tissues, including latex (Malcolm 1991). Other defensive traits that 190
may limit herbivory are leaf toughness, trichomes, volatile organic compounds, and 191
nitrogen content (Agrawal 2005, Mooney et al. 2010). Each of these traits shows 192
heritable variation among full-sib genetic families within populations (Agrawal 2004, 193
Mooney and Agrawal 2008). Despite sequestering plant defenses, specialist herbivores 194
of milkweed are not known to cue in on, or be stimulated by, the main defensive traits 195
(latex, cardenolides, or trichomes) (Agrawal 2005, Mooney et al. 2010). 196
Vertebrate herbivory and generalists. Most research on interactions between 197
Asclepias and herbivores has been conducted with specialist insect herbivores. This 198
excludes the literature on livestock poisoning, which can occur, but is uncommon with 199
Asclepias spp., and occurs in an unnatural setting (Knight and Walter 2002). We focus 200
here on specialist insect herbivores for three reasons. First, most attacks on plants in 201
natural populations are from specialist insect herbivores (personal observations of all 202
authors, and data presented here). Second, specialist insect herbivores impose natural 203
selection for defenses such as latex on A. syriaca (Agrawal 2005), and plant defensive 204
10
traits have imposed natural selection for counter-adaptations in these specialist insects 205
(such as trenching of laticifers, altered sodium pumps, etc.; Agrawal and Malcolm 2002, 206
Agrawal and Konno 2009). Third, our personal observations indicate that in meadows 207
where deer and rabbits frequently browse plants in the Asteraceae and Onagraceae, they 208
rarely touch A. syriaca. 209
Nonetheless, caveats are important here. We have frequently observed that young 210
transplanted plants (i.e., from growth chamber starts) are subject to browsing by rabbits. 211
This tends to be transient, and typically on plants <30cm, but nonetheless can have 212
impacts on the plants, which quickly regrow with new stems following browsing. 213
Regrown plants typically are not rebrowsed. Generalist slugs and snails can be highly 214
abundant in moist old-fields where A. syriaca is common, and can typically be found 215
grazing the oldest, often senescent leaves of A. syriaca. However, in rare cases, these 216
mollusks skeletonize younger leaves. In this study we report on the frequency of 217
vertebrate and mollusk attack in our experiments. Because both vertebrate browsing and 218
molluskan grazing leave distinct signs (clipped meristems and shiny slime trails, 219
respectively), we were able to track their damage. 220
221
Seed collections 222
Because we were interested in north-south clinal variation in A. syriaca, we (and 223
colleagues, see Acknowledgments) collected seeds from 22 natural populations. Most 224
populations occurred in old fields or along roadsides. Sampled populations ranged along 225
Eastern North America, stretching as far north as Quebec City, Quebec, Canada, as far 226
south as Knoxville, Tennessee, USA, and as far west as Urbana, Illinois, USA (Figure 2, 227
11
Supplemental Table 1). Seeds from a single population collected south of Knoxville 228
(Bishop, Georgia, USA) failed to germinate. Three to ten pods (full-sibling families) 229
were collected from each population (mean = 6) from plants separated by at least 5 m. 230
Before seeds were planted, we counted the number of seeds per pod and weighed all the 231
seeds to estimate the mean mass of individual seeds per pod. 232
233
Climatic data 234
We compiled climatic data for the 22 populations using the most recent climate 235
normals (i.e., 30 year averages) 1971-2000 from NOAA (www.noaa.gov) and 236
Environment Canada (www.weatheroffice.gc.ca/canada_e.html), following methods 237
outlined by Montague et al. (2008). The raw data came from the climate stations in 238
closest proximity to the collection sites and all stations but one conformed to World 239
Meteorological Organization standards. Light, temperature, growing degree unit 240
accumulation (an estimate of growing season developed for agricultural crops) and 241
precipitation are major components of the climatic differences across our sample 242
populations and may influence plant growth strategy (Montague et al. 2008). Latitude 243
was a strong predictor of most but not all climatic variables. Using Pearson correlations 244
for the climate variables for each site, we found that latitude was highly correlated with 245
mean annual temperature (range 4-14 oC, n=22, r=-0.94, p<0.001) as well as three other 246
measures of temperature and growing season (Supplemental Table 2). Annual 247
precipitation was not correlated with latitude (range 79 - 135 cm, n=22, r=-0.34, p=0.12), 248
and because precipitation is an important variable that may influence plant allocation 249
(and differed nearly two-fold among our common milkweed populations), we included 250
12
both latitude and total annual precipitation in multiple regression analyses as predictors of 251
plant traits. 252
253
Common garden experiments 254
To evaluate the genetic basis of plant growth and defense trait variation, we 255
established four common gardens: two near the center of the range (Ithaca, NY, USA), 256
one near the northern range edge (Fredericton, New Brunswick, Canada), and one near 257
the southern range edge (Raleigh, NC, USA). 258
259
Main common garden in New York - In May 2008, we germinated seeds from 260
three to five full-sibling families from each population (103 families in total) by placing 261
them between layers of moist paper towels in sealed petri dishes and incubated them at 262
30 oC for five days. We then planted up to ten seedlings from each family in plug trays 263
filled with potting soil. Trays were placed in full sun on an open-air rooftop patio on the 264
Cornell University campus and seedlings were watered as needed. We transported the 265
seedlings to the field site in Dryden, NY, USA 11 days after planting and kept them in a 266
shade house for one week, until they were planted in the field on 4 June. 267
The field plot was a mesic abandoned agricultural field. To prepare the plot, we 268
sprayed it with herbicide and tilled the soil two weeks prior to planting. In a completely 269
randomized design, we planted milkweeds in 4-liter plastic pots fully sunk into the 270
ground and filled with field soil. Pots were used to restrict clonal growth of A. syriaca 271
roots (Agrawal 2004). We watered plants only early in the season to help them establish 272

13
and we weeded the plot periodically through the growing season. By mid-July, 418 plants 273
had established, with nearly 20 plants and three to five genetic families per population. 274
275
Plant traits and insect assays. In the first growing season we measured five plant 276
traits associated with resistance to herbivory: latex exudation, percent leaf water content, 277
specific leaf area (area/dry mass), trichome density, and cardenolide concentration (Van 278
Zandt and Agrawal 2004, Agrawal 2005, Bingham and Agrawal 2010). While no 279
herbivores were placed on the plants, we recorded natural herbivory and the abundance of 280
insect herbivores. Some plants were grazed by invertebrates (typically damage by 281
monarch Danaus plexippus caterpillars, adults of the red milkweed beetle Tetraopes 282
tetraophthalmus, or mollusks), infested by aphids (Aphis nerii), or browsed, typically by 283
rabbits. Nearly all browsed plants regrew new stems. 284
We measured latex on each plant by cutting off the tip (2-3 mm) of the uppermost 285
fully expanded leaf and letting latex exude onto a 1 cm disc of pre-weighed filter paper. 286
When the latex stopped flowing, the disc was removed and placed into a pre-weighed 2 287
mL microcentrifuge tube for subsequent weighing. We have previously found wet and 288
dry mass of latex to be strongly correlated, and wet latex to be a strong predictor of 289
herbivore growth rate and insect abundance in the field (Van Zandt and Agrawal 2004, 290
Agrawal 2005). 291
We assessed specific leaf area, water content and trichome density on each plant 292
by taking a 6 mm diameter leaf punch, centered along the midrib at the tip of the leaf 293
opposite that from which latex was collected. Before the discs were dried, we counted 294
trichomes on the bottoms of the leaf discs under a dissecting microscope. 295
14
To assess cardenolide concentration, we collected the two uppermost, fully 296
expanded leaves from which other measurements were recorded. These leaves were 297
frozen (-80oC) and dried at 45oC, and for each sample,75 mg of tissue was ground using a 298
mixer-mill (Retsch, Haan, Germany) with 3 mm stainless steel beads in a microcentrifuge 299
tube. Extraction and analysis of the cardenolides using HPLC followed the methods of 300
Rasmann et al. (2009). We limited cardenolide analysis to 130 samples, with an average 301
of 5.9 plants from each of the 22 populations. In all cases where we sub-sampled the 302
plants, we took care to maximize the sampling of different genetic families from each 303
population. 304
During the second growing season (2009), we took an early (3 June) and a late 305
(13 Aug) measurement of height and stem number for each plant. Our early season 306
measure of plant emergence from perennial root stocks gave an indication of phenology, 307
because early emerging plants were taller at this time, and populations differed 308
dramatically in this trait (see Results). Later in the season, plant height was not 309
correlated with early season height (n=22, r=-0.20, p>0.25) and did not differ between 310
populations (F21, 156=1.54, p>0.05). We measured cardenolides in the second year of 311
plant growth, as outlined above, except that we used 100 mg of tissue in chemical 312
analyses (n=193, an average of 8.8 plants from each of the 22 populations). 313
During this second growing season, plants became naturally infested with aphids 314
(Myzocallis asclepiadis) , which we counted on a subset of plants (n=156, ≈7 for each of 315
the 22 populations). In addition, we performed a bioassay using neonate monarch 316
butterfly caterpillars (Danaus plexippus) to evaluate insect growth and thus quantify the 317
total effectiveness of defensive traits of the milkweed plants. Here again we used a subset 318
15
of the plants (n=187, ≈8.5 plants from each of the 22 populations). Two freshly hatched 319
D. plexippus caterpillars were placed on the apical leaves of each plant (13 Aug) and 320
protected using a spun polyester sleeve. The caterpillars were allowed to feed for six 321
days, removed from the plants and weighed. If two caterpillars were recovered from an 322
individual milkweed, their mass was averaged for a single data point; where no 323
caterpillars were recovered, the replicate was excluded. 324
325
Second New York common garden - destructive harvest. We established a second 326
garden using the same A. syriaca populations and families for a destructive harvest to 327
examine above- and belowground vegetative allocation. In the second week of June 2008, 328
seeds from each family were germinated and planted in 500-mL pots filled with a 50/50 329
mixture of field topsoil and potting mix. This mixture was used to ensure exposure to the 330
microbial community from field soil, while facilitating root washing to estimate 331
belowground biomass. Here we focused on population variation (n=22) with at least three 332
genetic families represented from each population, but low replication within families 333
(total n=204, mean number of plants per population = 9.2 for most traits). The plants 334
were randomized on an open-air rooftop patio and watered throughout the season as 335
needed. After 82 days of growth, we estimated latex exudation (as above), and then 336
harvested all plant material, washed roots free of soil, weighed total above- and below-337
ground dry biomass (after drying at 45oC), estimated root-to-shoot ratio, and recorded the 338
number of root buds (i.e., asexually reproducing dormant buds). 339
340
16
New Brunswick and North Carolina common gardens – In 2009, we established 341
smaller common gardens near the range edges in Fredericton, New Brunswick, Canada 342
(n=127 plants from12 populations) and Raleigh, North Carolina, USA (n=108 plants 343
from 11 populations). Populations were chosen to span the complete latitudinal range, 344
and 11 of the chosen populations were common to both gardens (Supplemental Table 1). 345
Plots were prepared as in New York and plants were again restricted in their clonal 346
growth, here using 4 L water-permeable cloth tree bags (High Caliper Growing, 347
Oklahoma City, OK) sunken and filled with local field soil. Plants were grown from seed 348
in growth chambers for one month, the aboveground tissue was clipped, and the plants 349
were planted in the field during summer. This procedure was used to allow transplanted 350
plants to regrow aboveground tissues acclimated to field conditions. In 2010, new stems 351
naturally emerged from dormant root stocks at both sites and we measured early season 352
height as an indication of phenology. We also sampled latex and measured final 353
aboveground biomass as dry stem biomass (because some leaves had dropped or 354
senesced). For A. syriaca, stem mass correlates well with total above ground biomass 355
(n=50, r=0.94, p<0.001). 356
All of our common gardens were open to browsing by small mammals (rabbits, 357
groundhogs, voles, etc) and all invertebrates. The New York common garden was fenced 358
and inaccessible to deer, but no fencing was applied in the New Brunswick common 359
garden. Although the North Carolina common garden was protected by an electric deer 360
fence, this fence was breached by deer several times over the two years of the study. We 361
have no evidence that deer herbivory impacts milkweed in natural populations (see also 362
results). 363
17
364
Statistical analyses. We analyzed plant and insect traits using Systat (version 12), 365
with an ANOVA model including population (n=22), and, when possible, full-sibling 366
genetic family nested within population (range 3-5). Family was only included in 367
analyses when all plants were measured in the main New York common garden in 2008, 368
where replication was sufficient to include this term. For traits in which fewer plants 369
were measured, we were careful to sample across all genetic families, but could not 370
include this term in the analysis. In all subsequent analyses, population was considered 371
the unit of replication and family variation was averaged within populations. In addition, 372
for the 2008 data, we included natural levels of herbivory (3 discrete levels: none, 373
invertebrate grazing, browsed by mammals and regrown) and aphid infestation (presence 374
or absence) as additional predictors in the ANOVA model. 375
Genetically-based clines in phenotypic traits were assessed with multiple 376
regression, using latitude and precipitation as predictors. Alternative analyses using 377
distance from range center (estimated near Pittsburgh, Pennsylvania, USA) had much less 378
predictive power and are not presented here. To assess phenotypic plasticity and local 379
adaptation in the range edge common gardens (2010), we conducted analyses 380
(MANCOVA, followed by univariate ANCOVAs) on early season height, number of 381
stems, latex exudation, and final stem mass as predicted by latitude and precipitation at 382
the collection sites and common garden location. All interaction terms were included 383
except the three-way interaction, which never approached statistical significance. 384
To address consistency of the clines across common gardens (i.e., plasticity in 385
the genetically-based phenotypic clines), we focused on the northern and southern 386

18
common gardens, where we measured the same four traits in the same year. Because the 387
New York common garden was established with slightly different protocols, and a year 388
earlier, it could not be directly compared to the northern and southern common gardens. 389
Some caution in interpretation is thus in order because the two sites compared were not 390
replicated at their respective latitudes. We used ANCOVA to address interactions 391
between the common garden site (New Brunswick and North Carolina) and the two 392
predictors (latitude and precipitation of the source populations) for standardized (by the 393
mean of that common garden) trait means from each population (n=11 populations in 394
each garden). Values were standardized to avoid confounding influence of plasticity in 395
the traits per se, or of slight differences in planting protocols. In other words, we focused 396
on whether the slope of the relationship between the predictors and mean population 397
phenotype differed between the two common gardens. In addition, we used regression 398
relationships between traits and growth, analogous to selection analyses (Lande and 399
Arnold 1983), to assess the factors that favored growth in the different common gardens. 400
Because A. syriaca is a long-lived perennial with both above-ground sexual and below-401
ground asexual reproduction, these regressions do not provide good estimates of lifetime 402
selection, but nonetheless reveal important aspects of performance at early life stages. 403
Because we found significant biogeographic clines in growth and defense traits, 404
we attempted to disentangle the causes of these relationships with two path analyses 405
using the RAMONA module of Systat. In the first, we used latitude and precipitation as 406
predictors of seed mass, growth, and latex exudation, and assessed the impact of these 407
factors on caterpillar performance, while accounting for potential intercorrelations among 408
the traits (n=22 population means). In the second, we used latitude and precipitation as 409

19
predictors of seed mass, growth, trichomes, and water content, and assessed the impact of 410
these factors on aphid abundance. We used different sets of plant traits in the two 411
analyses because we had limited power and were unable to include all variables (based on 412
population being the unit of replication, n=22). Instead, we built each path analysis 413
around significant (or marginally significant) predictors from our initial analyses. We 414
employed a correlational matrix, maximum Wishart likelihood, and 95% confidence 415
intervals on the path coefficients. 416
417
Natural population surveys 418
In both 2009 and 2010, we conducted surveys of plant damage on natural 419
populations of A. syriaca from five sites each in the surroundings of Ithaca, Fredericton, 420
and Raleigh. Within each of the three survey regions, sites were at least 3km apart, but 421
often >15km apart. Surveys were conducted at the peak of the growing season at each 422
site. For 25 non-neighboring stems in each site (or slightly fewer in smaller populations) 423
we recorded the percentage of leaves with chewing damage and the identities of all 424
insects present on plants. We were able to differentiate between damage due to the 425
various milkweed specialists and generalist mollusks. We used site means for leaf 426
damage and insect diversity to assess differences in both years (total n=15) using 427
repeated measures MANOVA. 428
429
RESULTS 430
Population variation and clines in growth and defense traits 431
20
All but one of the 13 traits measured showed evidence of interpopulation 432
differences, typically with greater than two-fold variation in trait values (Table 1). 433
Individual seed mass and seed number per pod (both measured from the original 434
collections in the parent populations), varied substantially among populations (Table 1), 435
and individual seed mass showed a latitudinal cline with increasing mass at higher 436
latitudes (Table 2, Supplemental Figure 1). We found no relationship between individual 437
seed mass and seed number per pod at the population (n=22, r=0.060, p=0.79) or 438
individual level (n=133, r=0.070, p=0.42). For the 11 traits measured in common 439
gardens, the only trait not to show population variation was leaf trichome density, for 440
which the population effect was marginal (Table 1). 441
Several aboveground plant traits showed geographical clines. Our measures of 442
aboveground biomass accumulation showed consistently lower biomass of plants from 443
higher latitude populations, irrespective of growing location (Figure 3). In all three 444
common gardens, plants experienced ≈5% decline in biomass per degree of latitude and 445
>50% decline across the studied geographic range. Among other traits measured in the 446
New York common garden, latex production increased with collection latitude and 447
precipitation (Figure 4), but other foliar traits (trichomes, specific leaf area (SLA), water 448
content, and cardenolides) showed no clines (Table 2). The cline in latex was not 449
significant in either of the range edge common gardens (Table 2). Herbivory in the New 450
York common garden (2008) was associated with altered plant traits (latex, trichomes, 451
SLA, and water content; Supplemental Table 3); in particular, as we have reported from 452
experimental studies, grazing by invertebrates induced latex production by 55% 453
21
(Bingham and Agrawal 2010), while vertebrate browsing decreased trichome densities by 454
60%. 455
Allocation to underground traits also showed substantial clines. The number of 456
root buds per plant increased in higher latitude populations (Table 2, Figure 5), with a 457
≈6% increase in root buds per degree of latitude and >75% increase across the studied 458
geographic range. In the second year of plant growth, this cline in root buds drove a 459
tendency for the number of emergent stems to increase with source latitude (significant in 460
the New York common garden, marginal in New Brunswick, but not in the North 461
Carolina garden; Table 2). The three common gardens did not differ in mean numbers of 462
stems emerging in the second year of growth (F2,21=0.090, p=0.91). Although root 463
biomass did not vary clinally, the cline in shoot mass caused root-to-shoot ratio (R/S) to 464
show a greater relative belowground investment at higher latitudes (Figure 5), and higher 465
precipitation showed a similar but weaker effect. 466
While our data suggest that the sample populations were genetically 467
differentiated, we also found evidence for plasticity in the regulation of latitudinal clines 468
when statistically comparing the New Brunswick and North Carolina common gardens. 469
In a MANOVA analysis of the same four traits from 11 populations, measured in the 470
same year, there was both a significant latitude-by-garden and precipitation-by-garden 471
interaction (Table 3). However, the only detectable interaction for individual traits was 472
that between latitude and garden for early stem height (Table 3). In this case, a cline in 473
phenology was detectable in North Carolina, but not in New Brunswick (Table 2, 474
Supplemental Figure 2). A cline showing genetically-based earlier phenology in higher 475
latitude (and higher precipitation) populations was also evident in the New York common 476
22
garden (Table 2, Figure 6), indicating that this trait cline was environmentally obscured at 477
the highest latitude garden only. 478
Despite plasticity in the expression of the cline, an estimate of selection (the 479
relationship between phenology and growth) was consistent with early phenology being 480
adaptive at higher, but not lower, latitudes. In particular, the slope of the relationship 481
between phenology and growth was markedly positive (m = 2) in New Brunswick, but 482
negative (m = -0.8) in North Carolina (F1,18=6.01, p=0.025, Figure 7). A weaker trend 483
for reversal in the benefits of multiple stems was also seen (interaction between common 484
garden and the slope of the relationship between stems and growth F1,18=3.20, p=0.090, 485
see also Table 2). We found no evidence for such an interaction with latex (F1,18=0.473, 486
p=0.500). 487
488
Insect abundance and performance 489
Although few herbivores colonized the New Brunswick common garden, the 490
North Carolina garden was attacked, and plants from lower latitudes were more heavily 491
colonized by herbivores than higher latitude plants (significant MANOVA in Table 4, 492
and significant and marginal clines for two herbivores). Nonetheless, when plant 493
biomass was included as a covariate, these relationships disappeared, suggesting that 494
slower growing northern plants may have simply been smaller targets for herbivores (data 495
not shown). Effects latitudinal collection on herbivores in the New York common 496
garden, however, were due to other factors (not plant size) as discussed below. 497
In the New York common garden, in 2009, a milkweed specialist aphid 498
(Myzocallis asclepiadis) was naturally abundant on plants, and showed larger populations 499

23
on plant populations from lower latitudes and with lower annual precipitation (after 500
including plant size as a covariate) (Table 4, Figure 8). For each degree of lower latitude, 501
plants accumulated >7% more aphids (>60% increase across the range of our source 502
populations). The caterpillar growth bioassay in the New York garden showed a similar 503
trend, with caterpillar mass being higher on plants from lower latitudes (a marginal 504
effect) and with lower annual precipitation (Table 4, Figure 8). Here, because caterpillars 505
were placed on plants and were not food limited, plant size could not contribute to the 506
effect. 507
To address the causes of the clines in insect abundance and performance in the 508
New York common garden, we took two approaches. First, we conducted multiple 509
regression analyses with the log of the mean aphid population abundance or caterpillar 510
mass as the dependent variable and four or five predictors (latex, trichomes, cardenolides, 511
leaf water content, and specific leaf area; but with latex excluded for aphids because they 512
feed intracellularly and do not come into contact with latex). For aphids, trichomes 513
(positively) and water content (negatively) impacted aphid populations: (analysis on 514
population means, model r2=0.45, F4,17=3.51, p=0.029; trichome coefficient = 0.007, 515
t=2.69, p=0.015; water content coefficient = -1.65, t=-3.28, p=0.004). Latex was the only 516
significant predictor of caterpillar mass: (model r2=0.51, F5,16=3.32, p=0.030; latex 517
coefficient = -0.082, t=-3.78, p=0.002). Our second approach involved a path analysis 518
presented in the following section. 519
520
Synthesis via path analysis 521
24
We conducted a path analysis on population means from the New York common 522
garden to link the above data and to explicitly address two issues: the importance of 523
maternal effects via seed size on plant growth, and the potential role of a plant growth – 524
latex tradeoff in driving the patterns observed. Overall, significant path coefficients were 525
moderately predictive and of similar magnitude (≈0.5), with the strongest relationship 526
being that between latitude and plant growth (Figure 9). Although latitude had a strong 527
impact on seed mass, plant growth, and latex, these relationships were largely 528
independent - except that a positive relationship between seed mass and growth emerged 529
despite latitude being positively associated with mass and negatively associated with 530
growth. Thus, seed mass (and associated maternal effects) were clearly not responsible 531
for the slower growth of high latitude populations. Importantly, we found no evidence 532
for a growth-latex tradeoff, and latex was the primary driver of monarch growth, 533
independent of plant growth or its unmeasured correlates (Figure 9). We similarly found 534
no relationship between plant growth and latex in the other two common gardens (New 535
Brunswick, n=12, r=-0.023, p=0.95; North Carolina, n=11, r=-0.073, p=0.83). A separate 536
path analysis for aphid abundance in the New York common garden (supplemental 537
Figure 4) revealed similar relationships among the predictor variables, but foliar water 538
and trichomes exhibited independent effects on aphids from the residual effects of 539
latitude and precipitation. 540
541
Natural population surveys: Herbivore abundance and diversity 542
Although leaf damage varied considerably between years (F1,12=13.0, p=0.004), 543
there was no population-by-year interaction (F2,12=0.799, p=0.47), with total herbivore 544
25
damage (including all specialist insects as well as molluskan damage) over twice as high 545
in New York than in either of the range-edge populations (F2,12=8.76, p=0.005, Figure 546
10). Although mollusks were abundant in New Brunswick and New York, they were 547
absent from our North Carolina censuses; among all of our censuses, mollusks were most 548
damaging in New Brunswick, where their damage accounted for 9% of all damaged 549
leaves. The diversity of specialist insect herbivores was less variable by year (year, 550
F1,12<0.001, p=1.0; population-by-year interaction, F2,12=0.220, p=0.81), but showed the 551
same pattern as leaf damage across populations, with nearly twice the diversity in New 552
York compared to the other two regions (F2,12=25.3, p<0.001, Figure 10). 553
554
Notes on vertebrate grazing and generalists. Vertebrate grazing was uncommon 555
in our experimental populations and surveys of natural populations (typically less than 556
<2% of plants damaged). We did not observe vertebrate damage in either the North 557
Carolina or New Brunswick gardens. In our New York common garden however, did we 558
observe substantial browsing, and this occurred immediately following transplanting in 559
2008 (13% of plants were browsed and all regrew new stems). We emphasize that this 560
appears to be a transient phenomenon associated with transplanting; in 2009 we observed 561
less than 7% of plants being browsed in the same common garden). 562
563
DISCUSSION 564
We examined genetically-based patterns of growth and defense of common 565
milkweed from across the species range to evaluate 1) the independent evolution of 566
growth and defense traits across the north-to-south gradient as predicted by latitudinal 567
26
hypotheses, 2) joint evolution of growth and defense, as predicted by plant defense 568
theory, and 3) the association of defense traits and herbivory with central vs. peripheral 569
locations of the host plant range, as predicted by the distance from range-center 570
hypothesis . We found that plant traits associated with growth and phenology followed a 571
latitudinal gradient, as did the production of a defensive secretion (latex). In common 572
garden experiments, milkweed populations collected from higher latitudes showed 573
evidence for slower growth, higher root:shoot ratios, later phenology, and higher latex 574
exudation than lower latitude populations. The cline in phenology contributed to local 575
adaptation to climate, and the cline in latex enhanced defense against specialist monarch 576
caterpillars, but no growth-defense relationship was implicated as a correlate of clinal 577
evolution. Other traits (including cardenolides, trichomes, and specific leaf area) did not 578
show clines. The extent of herbivory in natural populations roughly matched the distance 579
from species range center hypothesis, as leaf damage and herbivore diversity were 580
greatest in the middle of the species range. Nonetheless, levels of herbivory were not 581
correlated with genetically-based expression of defense. Below we further discuss each 582
of the hypotheses tested. 583
584
Genetically-based geographic clines in growth 585
Our most consistent result was that aboveground plant growth, as measured by 586
shoot biomass accumulation, was lowest among high latitude populations, and linearly 587
increased in plants from lower latitudes. When we assessed growth as a function of 588
distance from the range center, which corresponds to level of insect attack, there was no 589
significant pattern (data not shown). Thus, geographically-driven changing climate 590
27
appears to be a driver of plant growth allocation. Despite extreme environmental 591
differences between our common gardens, the tendency for lower-latitude plants to 592
exhibit higher aboveground growth persisted in each of the three locations (Figure 3). 593
The trend itself did not exhibit plasticity (Table 3) and was almost certainly not caused by 594
variation in seed mass (Figure 9). This is perhaps a surprising result, as it seems to 595
suggest that lower-latitude populations are best adapted at all latitudes; in other words, 596
despite the genetic basis of clines in plant traits, we did not find evidence for local 597
adaptation of growth rate. This seeming paradox has been reported for clines in some 598
animal species as well (Lankford et al. 2001). Nonetheless, in some other transplant 599
studies, reversals of latitudinal trends in performance consistent with local adaptation 600
have been found (Chapin and Chapin 1981, Santamaría et al. 2003, Maron et al. 2004). 601
The apparent paradox of low-latitude plants growing best in all environments can 602
be resolved with the realization that allocation to aboveground and belowground growth 603
must be considered in connection to longer-term fitness. The greater allocation to clonal 604
(belowground) reproduction and root-to-shoot ratio we observed in higher latitude 605
populations (Figure 5) is consistent with a reduced reliance on flowering and pollination 606
there (A. syriaca is largely self-incompatible, Kephart 1981). Indeed, the northern most 607
populations of A. syriaca face a 60-70% shorter growing seasons than at the range center. 608
In addition, allocation of relatively greater resources to underground tissues may help 609
high latitude plants rebound from winter stress and achieve early phenology in their 610
limited growing season (Harris et al. 1983). Consistent with this, higher root-to-shoot 611
ratios were genetically correlated with early phenology in the north (n=22 populations, 612
r=0.764, p<0.001). In other taxa, especially fish, there is strong evidence for geographical 613
28
selection for allocation patterns that maximize over-winter survival (Conover and Present 614
1990, Billerbeck et al. 2000). Taken together, these considerations imply that 615
belowground growth and clonal reproduction are a larger component of fitness at high 616
latitudes and the rapid aboveground growth expressed by low-latitude plants may be 617
maladaptive at high latitudes. We suspect that differential clinal mortality or 618
reproduction, consistent with local adaptation, would have been evident in a longer term 619
study of A. syriaca; however, we terminated our study after just two growing seasons in 620
order to prevent the dispersal and integration of genes from the entire gradient into the 621
study areas. 622
The other growth strategy traits we measured, in addition to above-ground 623
biomass, also showed latitudinal clines, with some evidence for local adaptation. Early 624
phenology correlated positively with growth at our northernmost common garden, but 625
late phenology favored growth at our southernmost common garden (Table 3, Figure 7). 626
The consistency of earlier phenology in higher latitude populations was demonstrated by 627
Turesson (1930) over 80 years ago in his common environment studies of 31 European 628
plant species. Although population variation in phenology appears to be adaptive, we did 629
observe plasticity in the expression of this cline (it was observed in New York and North 630
Carolina, but not New Brunswick, Table 2, Supplemental Figure 2). 631
632
Genetically-based geographic clines in defense and herbivory 633
Much has been written about latitudinal patterns in plant defense and herbivory, 634
including some recent controversy about whether there is any general pattern (Levin 635
1976, Coley and Aide 1991, Lewinsohn 1991, Bolser and Hay 1996, Coley and Barone 636
29
1996, Schemske et al. 2009, Moles et al. 2011, Rasmann and Agrawal 2011). Given the 637
long-held view that the growth and defense of plants is connected physiologically and 638
evolutionarily (Coley et al. 1985, Herms and Mattson 1992), our examination of defenses 639
and herbivory on plants from the 22 populations of A. syriaca was targeted at 640
understanding overall strategies expressed along broad geographic gradients. Although 641
natural herbivory in our study was lower on higher latitude populations in the North 642
Carolina common garden, this effect was driven primarily by plant size, and not 643
defensive traits. In our New York common garden, however, we had better replicated 644
assays of natural aphid attack and a bioassay of monarch caterpillar performance. Plant 645
size was not a factor in either assay and we found higher levels of resistance in higher 646
latitude plant populations, as well as higher resistance in populations with greater levels 647
of annual precipitation. 648
For milkweeds, the most potent aspects of defense are latex and cardenolides. In 649
the current study, resistance to monarchs was driven by latex, while resistance to aphids 650
was driven by trichomes and water content. The direct path between higher latitude, 651
greater latex exudation, and reduced monarch performance (Figure 9) convincingly 652
shows the link between climate, plant defense, and impacts on herbivores. Nonetheless, 653
for aphids, the path between climate, plant traits, and aphid abundance was less clear, and 654
other unmeasured traits are implicated (Supplemental figure 3). 655
Milkweed populations in our experiment varied substantially in foliar 656
cardenolides (Table 1), yet cardenolides did not show the predicted effect on resistance or 657
clines along latitude or precipitation gradients (Table 2). In a study of natural 658
populations, Malcolm (1995) found an east-west gradient in production of cardenolides 659
30
by A. syriaca, but this relationship was relatively weak. A reanalysis of these data, 660
splitting them into east-west and north-south transects, showed some evidence for a cline 661
of increasing cardenolides at higher latitudes (Hunter et al. 1996). Our common garden 662
assessment of cardenolides revealed a marginal correlation with latitude in 2008 (again, 663
higher levels at higher latitudes), but no relationship in 2009. Nonetheless, given the 664
genetically-based cline of greater latex exudation at higher latitudes, and concentrated 665
cardenolides in latex (Agrawal et al. 2008, Agrawal and Konno 2009), cardenolides may 666
indirectly contribute to higher plant resistance at high latitudes. 667
Our results for patterns of defense and herbivory are opposite to the prediction 668
that plants from lower latitudes will invest more in defense (Coley and Barone 1996, 669
Pennings et al. 2001). This finding raises two important issues in the broader ecological 670
context: whether we should expect similar results from comparisons between vs. within 671
species, and whether we should expect within-species patterns that correlate with climate 672
(or its proxy latitude) or instead with population location with respect to the species' 673
geographical range 674
Historically, most arguments about the intensity of biotic interactions increasing 675
at lower latitudes have been comparative (among species), suggesting that species 676
residing at lower latitudes are more likely to possess particular defenses or have greater 677
investment in defense compared to species from higher latitudes. Such comparative 678
assessments have only recently been conducted in a phylogenetic framework, which is 679
essential because the evolutionary history of radiations may not be independent of 680
latitude (Bolser and Hay 1996). For the genus Asclepias, we have found that species from 681
lower latitudes are better defended by toxic cardenolides compared to higher latitude 682
31
species (Rasmann and Agrawal 2011). Thus, despite some controversy (Moles et al. 683
2011), traits that are unequivocally defensive, such as latex (Lewinsohn 1991), alkaloids 684
(Levin 1976), extrafloral nectaries (Pemberton 1998), and cardenolides (Rasmann and 685
Agrawal 2011) show a pattern of increased defense in lower-latitude species. Because 686
such species level comparisons are made among reproductively isolated groups and 687
typically use the mean latitude of a species’ range, the inference made is about climate 688
and macroevolutionary diversification. 689
Intraspecific tests of gradients in defense and herbivory focus on smaller scale 690
local adaptation in the face of gene flow and have taken two forms. First, patterns of 691
damage have been assessed in natural populations. These analyses have had inconsistent 692
results, including positive, negative, and no clines with latitude (Andrew and Hughes 693
2005, Adams and Zhang 2009, Pennings et al. 2009). The ecological and evolutionary 694
importance of these patterns (or lack thereof) is unclear, however, because they reflect 695
both the phenotypic expression of defense (genetic and environmental components) as 696
well as effects of the abundance and preferences of local herbivores. Second, studies have 697
measured damage in common gardens and reciprocal transplants, and some studies have 698
supported the hypothesis of greater herbivory and defense at lower latitudes (Salgado and 699
Pennings 2005, Pennings et al. 2009). However, in a meta-analysis of common garden 700
experiments assessing plant allocation, there was no general trend in genetically-based 701
allocation to defense traits (or in insect damage) across latitude in ten plant species 702
(Colautti et al. 2009). 703
Several studies have shown significant genetically-based latitudinal gradients of 704
higher resistance at higher latitudes, consistent with our findings on common milkweed, 705
32
but opposite to the prevailing view of among-species patterns. Early work by Bryant and 706
colleagues demonstrated higher levels of defense in high latitude boreal trees compared 707
to lower latitude trees (Bryant et al. 1989, Bryant et al. 1994, Swihart et al. 1994). In a 708
common garden study of Melaleuca quinquenervia, collections from higher latitudes had 709
lower levels of insect damage, suggesting greater investment in defense traits (Franks et 710
al. 2008, Colautti et al. 2009). In another common garden study spanning 8o of latitude, 711
Turley et al. (unpublished manuscript), found higher levels of herbivory on lower latitude 712
populations compared to higher latitude populations of black nightshade (Solanum 713
americanum). Finally, in a common garden study of Pinus ponderosa, Gerson et al. 714
(2009) reported that alkaloid production was correlated with mean temperatures 715
(negatively) and precipitation (positively) of the collection sites. Thus, several studies, 716
on both trees and herbaceous plants, demonstrate increasing defense investment at higher 717
latitudes. 718
It remains unclear why gradients in defense are not consistent among studies and 719
may even differ between intra- and inter-specific comparisons. One potential 720
explanation for a diversity of patterns in intraspecific analyses is that latitude or climatic 721
variables per se may be less important in predicting herbivory or other interactions than a 722
population’s position relative to the species’ range. Depending on how specialized the 723
herbivores are, and thus whether alternative food plants are available, range-center 724
populations may be subject to the greatest levels of attack (e.g., Garcia et al. 2000, 725
Alexander et al. 2007). We similarly found that herbivore diversity and leaf damage for 726
common milkweed was greatest towards the center (New York sites) compared to the 727
northern and southern range-edges. Nonetheless, patterns of defense allocation did not 728

33
follow this distance from range-center pattern. We know little about gradients of damage 729
within the central part of the range, which still covers more than six degrees of latitude 730
(Figure 2). The high levels of defense in New Brunswick, despite the low levels of 731
specialist attack there, suggests that protection from generalist herbivores (e.g., mollusks) 732
may be particularly important at higher latitudes; while we observed heavy molluskan 733
herbivory in one year of observations, we lack the long-term data to evaluate this notion. 734
735
Growth – defense relationships in clinal evolution 736
Ultimately the impact of herbivores on plant fitness will determine selection for 737
defenses. We know little about the fitness impacts of milkweed herbivores along the 738
latitudinal gradient. Nonetheless, slower growing genotypes at higher latitudes are less 739
likely to tolerate a given level of herbivory, as has been suggested and found in a variety 740
of other contexts (Coley et al. 1985, Milchunas and Lauenroth 1993, Stowe 1998, Fine et 741
al. 2004). Pennings and Silliman (2005) furthermore suggested that the per capita impact 742
of high versus low latitude herbivores may differ. Such differential interaction strengths 743
could decouple the relationship between plant resistance traits and the local fitness 744
impacts of herbivores. 745
The evolution of slow growth in response to climate or resource availability is 746
predicted to be associated with higher levels of investment in defense, and this pattern 747
appears to be borne out in interspecific comparisons (Janzen 1974, Coley et al. 1985, 748
Arendt 1997, Endara and Coley 2011). Although our overall qualitative pattern was 749
consistent with this hypothesis (i.e., northern populations were slower growing and better 750
defended), we did not find evidence for a quantitative relationship between growth and 751

34
latex production in any of three common gardens (or growth and monarch performance in 752
the New York common garden). This pattern suggests that clines in both growth and 753
defense evolved along the latitudinal gradient, but were not driven by a physiological or 754
genetic link between the two. One possible scenario is that slow growth evolves in 755
response to climate, making plants less tolerant of herbivory, and thereby favoring higher 756
levels of resistance (Coley et al. 1985). There are two important outcomes of this 757
scenario. First, growth and resistance traits would not necessarily be directly correlated. 758
Second, the absolute amount of herbivory at different geographical locations may be less 759
indicative of the investment in defense as the impact of that herbivory on plant 760
performance. 761
More generally, observations of geographic clines in growth have not been 762
well-linked to defense in plants or animals (Arendt 1997, Colautti et al. 2009). An 763
exception is work on the Atlantic silverside fish (Menidia menidia) where northern 764
populations are selected for rapid growth, to promote overwinter survival, and appear to 765
be superior in all aspects of growth compared to more southern populations (Conover and 766
Present 1990, Billerbeck et al. 2000). Nonetheless, more recent work has shown that 767
both genetically-based faster growth rate and phenotypic manipulations of faster growth 768
rate are associated with increased risk of predation compared to slower growing fish 769
(Lankford et al. 2001, Munch and Conover 2003). In summary, we advocate for 770
combined research on growth and defense traits from organisms across geographical 771
gradients. Without the ability to examine the direct correlations between climatic 772
variables (or a proxy, such as latitude) and genetically-based differences in traits, it will 773
be difficult to unravel the drivers of clinal evolution. 774
35
775
Latitudinal clines, climate change, and species invasions 776
The existence of contemporary genetically-based latitudinal clines in traits is 777
suggestive of strong climatic selection and sufficiently limited gene flow to allow for 778
local adaptation (Endler 1977). Current climate change is imposing natural selection on a 779
broad array of organisms (Parmesan 2006). Thus, for species with broad distributions 780
and existing latitudinal clines, adaptation to climate change seems plausible. 781
Nonetheless, the extent of adaptation we can expect has been debated, in part because of 782
genetic constraints and barriers to dispersal and gene flow (Davis et al. 2005, Skelly et al. 783
2007, Aitken et al. 2008, Colautti et al. 2010). For example, classic work on the partridge 784
pea (Chamaecrista fasciculata) indicated that although plant populations were locally 785
adapted, genetic correlations may constrain future adaptation to climate change (Etterson 786
and Shaw 2001, Etterson 2004). In other cases, there appears to be concordance between 787
latitudinal patterns and responses to climate change. In birds, for example, there are 788
within-species latitudinal patterns in body size (i.e., Bergman’s rule, larger sizes at higher 789
latitudes) (Ashton 2002) and this pattern has been reflected in analyses of phenotypic 790
changes associated with climate (Van Buskirk et al. 2010). 791
The rapid evolution of traits of invasive species in response to climatic gradients 792
provides a window into the possibility of adaptation to climate change (Lee 2002). For 793
example, Huey et al.’s landmark study (2000) of Drosophila subobscura’s invasion of 794
North America showed that a latitudinal cline in wing size, present in native populations, 795
took only one to two decades to evolve in the introduced range. These flies have 796
continued to evolve in response to climate change. Indeed, among 22 populations on 797

36
three continents that have experienced warming over the past two decades, 21 showed a 798
pattern of evolution towards lower latitude (i.e., warmer climate) genotypes (Balanya et 799
al. 2006). For plants, which are often more sessile than animals, parallel clines in 800
morphological and life-history traits among native and invasive populations have also 801
lead to the conclusion of rapid evolution to climatic conditions in several systems (Maron 802
et al. 2004, Etterson et al. 2008, Montague et al. 2008, Alexander et al. 2009). While A. 803
syrica was introduced to Europe nearly a century ago, and has spread over at least six 804
degrees of latitude, little is known about adaptation to climate (or herbivores) in that non-805
native range. Finally, although much has been said about characteristics of species or 806
ecological conditions allowing rapid adaptation to changing conditions, we currently 807
have very few tests of these ideas for species facing climate change in the wild (Davis et 808
al. 2005, Skelly et al. 2007, Aitken et al. 2008, Van Buskirk et al. 2010). 809
Adaptation to climatic gradients and the success of invasive species are not 810
necessarily independent (Roura-Pascual et al. 2004). For example, a prominent 811
hypothesis for the success of invasive species, the evolution of increased competitive 812
ability (EICA), suggests that rapid evolution of invasive species, in the absence of their 813
enemies from the native range, will lead to greater competitive ability (Blossey and 814
Nötzold 1995, Bossdorf et al. 2005). Nonetheless, most tests of this hypothesis have not 815
accounted for the fact that invasive species typically proliferate at different latitudes than 816
they inhabit in their native ranges, and may therefore be pre-adapted to some new 817
environments (Colautti et al. 2009). In addition, under climate change, shifts in maximum 818
and minimum temperatures (as opposed to changes in mean temperature), may give 819
invasive species a phenological advantage, as has been suggested for invasive marine 820
37
ascidians (Stachowicz et al. 2002). Finally, for native but weedy A. syriaca, decreasing 821
seed size in southern populations may have contributed to its rapid range expansion 822
southward, given that small milkweed seeds disperse farther than larger seeds (Morse and 823
Schmitt 1985, Wyatt et al. 1993, Wyatt 1996). The continued study of adaptation to 824
climatic gradients, in both native and non-native species, thus holds promise for 825
understanding evolutionary change in response to future environmental challenges. 826
827
CONCLUDING SPECULATION 828
Given the complexity of biogeographic clines in species traits and interactions, a 829
combined approach of studying natural populations and common gardens is essential for 830
deciphering adaptation. For common milkweed, we found strong evidence for within-831
population heritable variation in growth and defense. Population-level adaptation along 832
latitudinal and precipitation gradients appears to have resulted in the differentiation of 833
several of these traits, and independently acts on seed mass, plant growth, and latex 834
production. Although we find that a strong path between biogeographic clines and 835
genetically-based resistance to insects exists via latex production, we have not found a 836
concordant gradient in herbivory that could have driven this pattern. This intriguing 837
mismatch suggests that defenses against herbivory may be evolving as a byproduct of, or 838
as constrained by, adaptation to climate. A key missing component of this story is our 839
understanding of the per capita impact of herbivores on plants across the gradient; we 840
speculate that lower tolerance of high latitude populations may have favored higher levels 841
of resistance. Thus, although there has clearly been adaptive evolution in response to 842
climatic variation in natural populations, and plant defenses may also be affected by 843

38
climate, A. syriaca appears to have evolved a cline in defense independent of the direct 844
relationship between defense and plant growth or insect herbivore attack rates. 845
ACKNOWLEDGEMENTS
For collecting seeds, we are grateful to the following people (listed by population
in latitudinal order from north to south, except for Fredericton, NB, East Lansing, MI and
Ithaca, NY, which were collected by the authors): Gilles Houle, Naomi Cappuccino,
Allison Brody, Becky Irwin, Lynn Adler, Helen Michaels, Casey Delphia, Art Zangerl,
Pat Dubin and Ed Wurtz, Josh Auld, Pete Van Zandt, Don Cipollini, T'ai Roulston, John
Parker, Susan Gallaher, John Styrsky, William Cook, Marc Johnson, Greg Crutsinger.
We are grateful to Robert Wyatt who looked extensively for populations of Asclepias
syriaca in South Carolina and Georgia.
We thank Robin Bingham, Daisy Johnson, Alexis Erwin, and Majorie Weber for help
with field and lab work, and especially Marc Johnson for facilitating the North Carolina
common garden. Thanks to Art Logan, Ed Stinson, and the New Brunswick Department
of Natural Resources for extensive help with the Fredericton common garden. Sergio
Rasmann and Rayko Halitschke provided critical guidance with chemical analyses,
Mônica Kersch-Becker helped with statistical advice, Kurt Reiger (High Caliper
Growing) donated the tree bags, and Rob Colautti, Claudio Gratton, John Maron, Jennifer
Thaler, Liz Wason, and anonymous reviewers provided helpful comments and
discussion. This research was supported by NSF-DEB 0447550 and 0950231 to AAA
(http://www.herbivory.com) and REU supplements that supported ECW, a Natural
39
Sciences and Engineering Research Council (Canada) Discovery Grant to SBH, and an
NSF graduate research fellowship to NET.
846
Literature cited 847
Adams, J. M. and Y. J. Zhang. 2009. Is there more insect folivory in warmer temperate 848
climates? A latitudinal comparison of insect folivory in eastern North America. 849
Journal of Ecology 97:933-940. 850
Agrawal, A. A. 2004. Resistance and susceptibility of milkweed: competition, root 851
herbivory, and plant genetic variation. Ecology 85:2118–2133. 852
Agrawal, A. A. 2005. Natural selection on common milkweed (Asclepias syriaca) by a 853
community of specialized insect herbivores. Evolutionary Ecology Research 854
7:651-667. 855
Agrawal, A. A. 2011. Current trends in the evolutionary ecology of plant defence. 856
Functional Ecology 25:420-432. 857
Agrawal, A. A., J. K. Conner, and S. Rasmann. 2010. Tradeoffs and adaptive negative 858
correlations in evolutionary ecology. Pages 243-268 in M. Bell, W. Eanes, D. 859
Futuyma, and J. Levinton, editors. Evolution After Darwin: the First 150 Years. 860
Sinauer Associates, Sunderland, MA. 861
Agrawal, A. A. and K. Konno. 2009. Latex: a model for understanding mechanisms, 862
ecology, and evolution of plant defense against herbivory. Annual Review of 863
Ecology, Evolution and Systematics 40:311-331. 864
40
Agrawal, A. A., M. J. Lajeunesse, and M. Fishbein. 2008. Evolution of latex and its 865
constituent defensive chemistry in milkweeds (Asclepias): a test of phylogenetic 866
escalation. Entomologia Experimentalis et Applicata 128:126–138. 867
Agrawal, A. A. and S. B. Malcolm. 2002. Once upon a milkweed. Natural History 868
111(7):48-53. 869
Agrawal, A. A. and P. A. Van Zandt. 2003. Ecological play in the coevolutionary theatre: 870
genetic and environmental determinants of attack by a specialist weevil on 871
milkweed. Journal of Ecology 91:1049-1059. 872
Aitken, S. N., S. Yeaman, J. A. Holliday, T. L. Wang, and S. Curtis-McLane. 2008. 873
Adaptation, migration or extirpation: climate change outcomes for tree 874
populations. Evolutionary Applications 1:95-111. 875
Alexander, H. M., S. Price, R. Houser, D. Finch, and M. Tourtellot. 2007. Is there 876
reduction in disease and pre-dispersal seed predation at the border of a host plant's 877
range? Field and herbarium studies of Carex blanda. Journal of Ecology 95:446-878
457. 879
Alexander, J. M., P. J. Edwards, M. Poll, C. G. Parks, and H. Dietz. 2009. Establishment 880
of parallel altitudinal clines in traits of native and introduced forbs. Ecology 881
90:612-622. 882
Andrew, N. R. and L. Hughes. 2005. Herbivore damage along a latitudinal gradient: 883
relative impacts of different feeding guilds. Oikos 108:176-182. 884
Antoniazza, S., R. Burri, L. Fumagalli, J. Goudet, and A. Roulin. 2010. Local adaptation 885
maintains clinal variation in melanin-based coloration of european barn owls 886
(Tyto alba). Evolution 64:1944-1954. 887
41
Arendt, J. D. 1997. Adaptive intrinsic growth rates: An integration across taxa. Quarterly 888
Review of Biology 72:149-177. 889
Arft, A. M., M. D. Walker, J. Gurevitch, J. M. Alatalo, M. S. Bret-Harte, M. Dale, M. 890
Diemer, F. Gugerli, G. H. R. Henry, M. H. Jones, R. D. Hollister, I. S. Jonsdottir, 891
K. Laine, E. Levesque, G. M. Marion, U. Molau, P. Molgaard, U. Nordenhall, V. 892
Raszhivin, C. H. Robinson, G. Starr, A. Stenstrom, M. Stenstrom, O. Totland, P. 893
L. Turner, L. J. Walker, P. J. Webber, J. M. Welker, and P. A. Wookey. 1999. 894
Responses of tundra plants to experimental warming: Meta-analysis of the 895
international tundra experiment. Ecological Monographs 69:491-511. 896
Ashton, K. G. 2002. Patterns of within-species body size variation of birds: strong 897
evidence for Bergmann's rule. Global Ecology and Biogeography 11:505-523. 898
Balanya, J., J. M. Oller, R. B. Huey, G. W. Gilchrist, and L. Serra. 2006. Global genetic 899
change tracks global climate warming in Drosophila subobscura. Science 900
313:1773-1775. 901
Billerbeck, J. M., E. T. Schultz, and D. O. Conover. 2000. Adaptive variation in energy 902
acquisition and allocation among latitudinal populations of the Atlantic silverside. 903
Oecologia 122:210-219. 904
Bingham, R. A. and A. A. Agrawal. 2010. Ecological genetics of herbivore-specific 905
induced defenses in common milkweed. Journal of Ecology 98:1014–1022. 906
Blossey, B. and R. Nötzold. 1995. Evolution of increased competitive ability in invasive 907
nonindigenous plants: a hypothesis. Journal of Ecology 83:887-889. 908
Bolser, R. C. and M. E. Hay. 1996. Are tropical plants better defended? Palatability and 909
defenses of temperate vs. tropical seaweeds. Ecology 77:2269-2286. 910
42
Bossdorf, O., H. Auge, L. Lafuma, W. E. Rogers, E. Siemann, and D. Prati. 2005. 911
Phenotypic and genetic differentiation between native and introduced plant 912
populations. Oecologia 144:1-11. 913
Bryant, J. P., R. K. Swihart, P. B. Reichardt, and L. Newton. 1994. Biogeography of 914
woody plant chemical defense against snowshoe hare browsing: comparison of 915
alaska and eastern north america. Oikos 70:385-395. 916
Bryant, J. P., J. Tahvanainen, M. Sulkinoja, R. Julkunentiitto, P. Reichardt, and T. Green. 917
1989. Biogeographic evidence for the evolution of chemical defense by boreal 918
birch and willow against mammalian browsing. American Naturalist 134:20-34. 919
Chapin, F. S., K. Autumn, and F. Pugnaire. 1993. Evolution of suites of traits in response 920
to environmental stress. American Naturalist 142: S78-S92. 921
Chapin, F. S. and M. C. Chapin. 1981. Ecotypic differentiation of growth-processes in 922
Carex aquatilis along latitudinal and local gradients. Ecology 62:1000-1009. 923
Clausen, J., D. Keck, and W. Hiesey. 1948. Experimental studies on the nature of species 924
III. Carnegie Institute of Washington Publication 581. Carnegie Institute of 925
Washington, Washington DC, USA. 926
Colautti, R. I., C. G. Eckert, and S. C. H. Barrett. 2010. Evolutionary constraints on 927
adaptive evolution during range expansion in an invasive plant. Proceedings of 928
the Royal Society B-Biological Sciences 277:1799-1806. 929
Colautti, R. I., J. L. Maron, and S. C. H. Barrett. 2009. Common garden comparisons of 930
native and introduced plant populations: latitudinal clines can obscure 931
evolutionary inferences. Evolutionary Applications 2:187-199. 932
43
Coley, P. D. and T. M. Aide. 1991. Comparison of herbivory and plant defenses in 933
temperate and tropical broad-leaved forests.in P. W. Price, T. M. Lewinsohn, G. 934
W. Fernandes, and W. W. Benson, editors. Plant-Animal Interactions: 935
Evolutionary Ecology in Tropical and Temperate Regions. John Wiley & Sons, 936
Inc. 937
Coley, P. D. and J. A. Barone. 1996. Herbivory and plant defenses in tropical forests. 938
Annual Review of Ecology and Systematics 27:305-335. 939
Coley, P. D., J. P. Bryant, and F. S. Chapin. 1985. Resource availability and plant 940
antiherbivore defense. Science 230:895-899. 941
Conover, D. O. and T. M. C. Present. 1990. Countergradient variation in growth-rate. 942
Compensation for length of the growing-season among Atlantic silversides from 943
different latitudes. Oecologia 83:316-324. 944
Davis, M. B., R. G. Shaw, and J. R. Etterson. 2005. Evolutionary responses to changing 945
climate. Ecology 86:1704-1714. 946
Dobzhansky, T. 1950. Evolution in the tropics. American Scientist 38:209-221. 947
Endara, M. J. and P. D. Coley. 2011. The resource availability hypothesis revisited: a 948
meta-analysis. Functional Ecology 25:389-398. 949
Endler, J. A. 1977. Geographic variation, speciation, and clines. Princeton University 950
Press, Princeton, NJ, USA. 951
Etterson, J. R. 2004. Evolutionary potential of Chamaecrista fasciculata in relation to 952
climate change. 1. Clinal patterns of selection along an environmental gradient in 953
the great plains. Evolution 58:1446-1458. 954
44
Etterson, J. R., D. E. Delf, T. P. Craig, Y. Ando, and T. Ohgushi. 2008. Parallel patterns 955
of clinal variation in Solidago altissima in its native range in central USA and its 956
invasive range in Japan. Botany-Botanique 86:91-97. 957
Etterson, J. R. and R. G. Shaw. 2001. Constraint to adaptive evolution in response to 958
global warming. Science 294:151-154. 959
Fine, P. V. A., I. Mesones, and P. D. Coley. 2004. Herbivores promote habitat 960
specialization by trees in amazonian forests. Science 305:663-665. 961
Franks, S. J., P. D. Pratt, F. A. Dray, and E. L. Simms. 2008. No evolution of increased 962
competitive ability or decreased allocation to defense in Melaleuca quinquenervia 963
since release from natural enemies. Biological Invasions 10:455-466. 964
Garcia, D., R. Zamora, J. M. Gomez, P. Jordano, and J. A. Hodar. 2000. Geographical 965
variation in seed production, predation and abortion in Juniperus communis 966
throughout its range in Europe. Journal of Ecology 88:436-446. 967
Gaston, K. J. 2009. Geographic range limits: achieving synthesis. Proceedings of the 968
Royal Society B-Biological Sciences 276:1395-1406. 969
Gerson, E. A., R. G. Kelsey, and J. B. St Clair. 2009. Genetic variation of piperidine 970
alkaloids in Pinus ponderosa: a common garden study. Annals of Botany 971
103:447-457. 972
Gold, J. J. and J. S. Shore. 1995. Multiple paternity in Asclepias syriaca using a paired-973
fruit analysis. Canadian Journal of Botany 73:1212-1216. 974
Hall, D., V. Luquez, V. M. Garcia, K. R. St Onge, S. Jansson, and P. K. Ingvarsson. 975
2007. Adaptive population differentiation in phenology across a latitudinal 976
45
gradient in European Aspen (Populus tremula, L.): A comparison of neutral 977
markers, candidate genes and phenotypic traits. Evolution 61:2849-2860. 978
Harper, J. L. 1977. Population Biology of Plants. Academic Press, London. 979
Harris, W., I. Rhodes, and S. S. Mee. 1983. Observations on environmental and 980
genotypic influences on the overwintering of white clover. Journal of Applied 981
Ecology 20:609-624. 982
Helferich, G. 2004. Humboldt's Cosmos: Alexander von Humboldt and the Latin 983
American Journey that Changed the World. Gotham Books, New York. 984
Herms, D. A. and W. J. Mattson. 1992. The dilemma of plants: to grow or defend. 985
Quarterly Review of Biology 67:283-335. 986
Huey, R. B., G. W. Gilchrist, M. L. Carlson, D. Berrigan, and L. Serra. 2000. Rapid 987
evolution of a geographic cline in size in an introduced fly. Science 287:308-309. 988
Hunter, M. D., S. B. Malcolm, and S. E. Hartley. 1996. Population-level variation in 989
plant secondary chemistry, and the population biology of herbivores. 990
Chemoecology 7:45-56. 991
Janzen, D. H. 1974. Tropical blackwater rivers, animals, and mast fruiting by the 992
Dipterocarpaceae. Biotropica 6:69-103. 993
Kephart, S. R. 1981. Breeding systems in Asclepias incarnata L., Asclepias syriaca L., 994
and Asclepias verticillata L. American Journal of Botany 68:226-232. 995
Kolbe, J. J., R. E. Glor, L. R. G. Schettino, A. C. Lara, A. Larson, and J. B. Losos. 2004. 996
Genetic variation increases during biological invasion by a Cuban lizard. Nature 997
431:177-181. 998
46
Lambers, H., F. S. Chapin, and T. L. Pons. 1998. Plant physiological ecology. Springer, 999
New York. 1000
Lande, R. and S. J. Arnold. 1983. The measurement of selection on correlated characters. 1001
Evolution 37:1210-1226. 1002
Lankford, T. E., J. M. Billerbeck, and D. O. Conover. 2001. Evolution of intrinsic growth 1003
and energy acquisition rates. II. Trade-offs with vulnerability to predation in 1004
Menidia menidia. Evolution 55:1873-1881. 1005
Lee, C. E. 2002. Evolutionary genetics of invasive species. Trends in Ecology & 1006
Evolution 17:386-391. 1007
Levin, D. A. 1976. Alkaloid-bearing plants - Ecogeographic perspective. American 1008
Naturalist 110:261-284. 1009
Lewinsohn, T. M. 1991. The geographical distribution of plant latex. Chemoecology 1010
2:64-68. 1011
Li, B., J. I. Suzuki, and T. Hara. 1998. Latitudinal variation in plant size and relative 1012
growth rate in Arabidopsis thaliana. Oecologia 115:293-301. 1013
Malcolm, S. B. 1991. Cardenolide-mediated interactions between plants and herbivores. 1014
Pages 251-296 in G. A. Rosenthal and M. R. Berenbaum, editors. Herbivores: 1015
Their interactions with secondary plant metabolites, Second edition, Vol. I: The 1016
chemical participants. Academic Press, San Diego. 1017
Malcolm, S. B. 1995. Milkweeds, monarch butterflies and the ecological significance of 1018
cardenolides. Chemoecology 5/6:101-117. 1019
Maron, J. L., M. Vila, R. Bommarco, S. Elmendorf, and P. Beardsley. 2004. Rapid 1020
evolution of an invasive plant. Ecological Monographs 74:261-280. 1021
47
Mayr, E. 1956. Geographical character gradients and climatic adaption. Evolution 1022
10:105-108. 1023
Milchunas, D. G. and W. K. Lauenroth. 1993. Quantitative effects of grazing on 1024
vegetation and soils over a global range of environments. Ecological Monographs 1025
63:327-366. 1026
Moles, A. T., D. D. Ackerly, J. C. Tweddle, J. B. Dickie, R. Smith, M. R. Leishman, M. 1027
M. Mayfield, A. Pitman, J. T. Wood, and M. Westoby. 2007. Global patterns in 1028
seed size. Global Ecology and Biogeography 16:109-116. 1029
Moles, A. T., S. P. Bonser, A. G. B. Poore, I. R. Wallis, and W. J. Foley. 2011. Assessing 1030
the evidence for latitudinal gradients in plant defence and herbivory. Functional 1031
Ecology 25:380-388. 1032
Montague, J. L., S. C. H. Barrett, and C. G. Eckert. 2008. Re-establishment of clinal 1033
variation in flowering time among introduced populations of purple loosestrife 1034
(Lythrum salicaria, Lythraceae). Journal of Evolutionary Biology 21:234-245. 1035
Mooney, K. A. and A. A. Agrawal. 2008. Plant genotype shapes ant-aphid interactions: 1036
Implications for community structure and indirect plant defense. American 1037
Naturalist 171:E195-E205. 1038
Mooney, K. A., R. Halitschke, A. Kessler, and A. A. Agrawal. 2010. Evolutionary trade-1039
offs in plants mediate the strength of trophic cascades. Science 327:1642-1644. 1040
Morse, D. H. and J. Schmitt. 1985. Propagule size, dispersal ability, and seedling 1041
performance in Asclepias syriaca. Oecologia 67:372-379. 1042
Munch, S. B. and D. O. Conover. 2003. Rapid growth results in increased susceptibility 1043
to predation in Menidia menidia. Evolution 57:2119-2127. 1044
48
Parmesan, C. 2006. Ecological and evolutionary responses to recent climate change. 1045
Annual Review of Ecology Evolution and Systematics 37:637-669. 1046
Pemberton, R. W. 1998. The occurrence and abundance of plants with extrafloral 1047
nectaries, the basis for antiherbivore defensive mutualisms, along a latitudinal 1048
gradient in east Asia. Journal of Biogeography 25:661-668. 1049
Pennings, S. C., C. K. Ho, C. S. Salgado, K. Wieski, N. Dave, A. E. Kunza, and E. L. 1050
Wason. 2009. Latitudinal variation in herbivore pressure in Atlantic Coast salt 1051
marshes. Ecology 90:183-195. 1052
Pennings, S. C. and B. R. Silliman. 2005. Linking biogeography and community ecology: 1053
latitudinal variation in plant-herbivore interaction strength. Ecology 86:2310–1054
2319. 1055
Pennings, S. C., E. L. Siska, and M. D. Bertness. 2001. Latitudinal differences in plant 1056
palatability in Atlantic coast salt marshes. Ecology 82:1344-1359. 1057
Pilon, J., L. Santamaría, M. Hootsmans, and W. van Vierssen. 2003. Latitudinal variation 1058
in life-cycle characteristics of Potamogeton pectinatus L.: vegetative growth and 1059
asexual reproduction. Plant Ecology 165:247-262. 1060
Rasmann, S. and A. A. Agrawal. 2011. Latitudinal patterns in plant defense: evolution of 1061
cardenolides, their toxicity and induction following herbivory. Ecology Letters 1062
14:476–483. 1063
Rasmann, S., M. D. Johnson, and A. A. Agrawal. 2009. Induced responses to herbivory 1064
and jasmonate in three milkweed species. Journal of Chemical Ecology 35:1326-1065
1334. 1066
49
Roura-Pascual, N., A. V. Suarez, C. Gomez, P. Pons, Y. Touyama, A. L. Wild, and A. T. 1067
Peterson. 2004. Geographical potential of Argentine ants (Linepithema humile 1068
Mayr) in the face of global climate change. Proceedings of the Royal Society of 1069
London Series B-Biological Sciences 271:2527-2534. 1070
Salgado, C. S. and S. C. Pennings. 2005. Latitudinal variation in palatability of salt-marsh 1071
plants: Are differences constitutive? Ecology 86:1571-1579. 1072
Santamaría, L., J. Figuerola, J. J. Pilon, M. Mjelde, A. J. Green, T. De Boer, R. A. King, 1073
and R. J. Gornall. 2003. Plant performance across latitude: The role of plasticity 1074
and local adaptation in an aquatic plant. Ecology 84:2454-2461. 1075
Schemske, D. W., G. G. Mittelbach, H. V. Cornell, J. M. Sobel, and K. Roy. 2009. Is 1076
there a latitudinal gradient in the importance of biotic interactions? Annual 1077
Review of Ecology Evolution and Systematics 40:245-269. 1078
Simms, E. L. 1992. Costs of plant resistance to herbivores. Pages 392-425 in R. S. Fritz 1079
and E. L. Simms, editors. Plant Resistance to Herbivores and Pathogens. Ecology, 1080
Evolution, and Genetics. University of Chicago Press, Chicago. 1081
Siska, E. L., S. C. Pennings, T. L. Buck, and M. D. Hanisak. 2002. Latitudinal variation 1082
in palatability of salt-marsh plants: Which traits are responsible? Ecology 1083
83:3369-3381. 1084
Skelly, D. K., L. N. Joseph, H. P. Possingham, L. K. Freidenburg, T. J. Farrugia, M. T. 1085
Kinnison, and A. P. Hendry. 2007. Evolutionary responses to climate change. 1086
Conservation Biology 21:1353-1355. 1087
Smith, R. A., K. A. Mooney, and A. A. Agrawal. 2008. Coexistence of three specialist 1088
aphids on common milkweed, Asclepias syriaca. Ecology 89:2187-2196. 1089
50
Spicer, R. A. and J. L. Chapman. 1990. Climate change and the evolution of high-latitude 1090
terrestrial vegetation and floras. Trends in Ecology & Evolution 5:279-284. 1091
Stachowicz, J. J., J. R. Terwin, R. B. Whitlatch, and R. W. Osman. 2002. Linking climate 1092
change and biological invasions: Ocean warming facilitates nonindigenous 1093
species invasions. Proceedings of the National Academy of Sciences of the United 1094
States of America 99:15497-15500. 1095
Stillwell, R. C. 2010. Are latitudinal clines in body size adaptive? Oikos 119:1387-1390. 1096
Stillwell, R. C., G. E. Morse, and C. W. Fox. 2007. Geographic variation in body size and 1097
sexual size dimorphism of a seed-feeding beetle. American Naturalist 170:358-1098
369. 1099
Stowe, K. A. 1998. Experimental evolution of resistance in Brassica rapa: Correlated 1100
response of tolerance in lines selected for glucosinolate content. Evolution 1101
52:703-712. 1102
Swihart, R. K., J. P. Bryant, and L. Newton. 1994. Latitudinal patterns in consumption of 1103
woody giants by snowshoe hares in the eastern United States. Oikos 70:427-434. 1104
Turesson, G. 1930. The selective effect of climate upon the plant species. Hereditas 1105
14:99-152. 1106
Van Buskirk, J., R. S. Mulvihill, and R. C. Leberman. 2010. Declining body sizes in 1107
North American birds associated with climate change. Oikos 119:1047-1055. 1108
Van Zandt, P. A. and A. A. Agrawal. 2004. Specificity of induced plant responses to 1109
specialist herbivores of the common milkweed, Asclepias syriaca. Oikos 104:401-1110
409. 1111

51
Winn, A. A. and K. L. Gross. 1993. Latitudinal variation in seed weight and flower 1112
number in Prunella vulgaris. Oecologia 93:55-62. 1113
Woodson, R. E. 1954. The North American species of Asclepias L. Annals of the 1114
Missouri Botanical Garden 41:1-211. 1115
Wyatt, R. 1996. More on the southward spread of common milkweed, Asclepias syriaca 1116
L. Bulletin of the Torrey Botanical Club 123:68-69. 1117
Wyatt, R., A. Stoneburner, S. B. Broyles, and J. R. Allison. 1993. Range extension 1118
southward in common milkweed, Asclepias syriaca L. Bulletin of the Torrey 1119
Botanical Club 120:177-179. 1120
Zalucki, M. P. and S. B. Malcolm. 1999. Plant latex and first-instar monarch larval 1121
growth and survival on three North American milkweed species. Journal of 1122
Chemical Ecology 25:1827-1842. 1123
1124
52
Ecological Archives (short descriptions) 1125
1126
Appendix A: Population collections of Asclepias syriaca used in this study and climatic 1127
data are available at ESA’s Electronic Data Archive: Ecological Archives (tba) 1128
1129
Appendix B: A table of the correlations between latitude and four climatic variables is 1130
available at ESA’s Electronic Data Archive: Ecological Archives (tba) 1131
1132
Appendix C: A table of the impacts of herbivory on phenotypic measures of common 1133
milkweed in the New York common garden (2008) is available at ESA’s Electronic Data 1134
Archive: Ecological Archives (tba) 1135
1136
Appendix D: A figure of the correlation between latitude and seed mass is available at 1137
ESA’s Electronic Data Archive: Ecological Archives (tba) 1138
1139
Appendix E: A figure of the correlation between latitude of the collection sites and early 1140
season height in the New Brunswick and North Carolina common gardens is available at 1141
ESA’s Electronic Data Archive: Ecological Archives (tba) 1142
1143
Appendix F. Path analysis for effects of latitude and precipitation of the collection sites 1144
on plant traits and abundance of aphids (Myzocallis asclepiadis) is available at ESA’s 1145
Electronic Data Archive: Ecological Archives (tba) 1146
53
Table 1. The effects of population origin on plant characteristics of Asclepias syriaca. Parental seed stock was collected from 1147
populations along a latitudinal gradient from Quebec City, Quebec, Canada in the north to Knoxville, Tennessee, USA in the south, 1148
and grown in field common gardens (Figure 2). Seed data was analyzed using the parental stock (not a common garden), with each 1149
family within-population contributing one data point (i.e., seeds from one fruit). For the New York common garden, n=22 populations 1150
and full-sib family was nested within each population (mean of 4.6 families per population). Analysis of family was not possible in 1151
other analyses because there was little replication within families. Naturally-occurring herbivory was recorded in the 2008 New York 1152
common garden and included in the complete analysis (Appendix B). The New Brunswick and North Carolina common gardens were 1153
represented by a subset of the 22 populations (12 and 11 populations, respectively). Error degrees of freedom are indicated as a 1154
subscript after the traits. *** P<0.001, ** P<0.01, * P<0.05, †P<0.1. Values in bold are statistically significant using ANOVA. 1155
1156
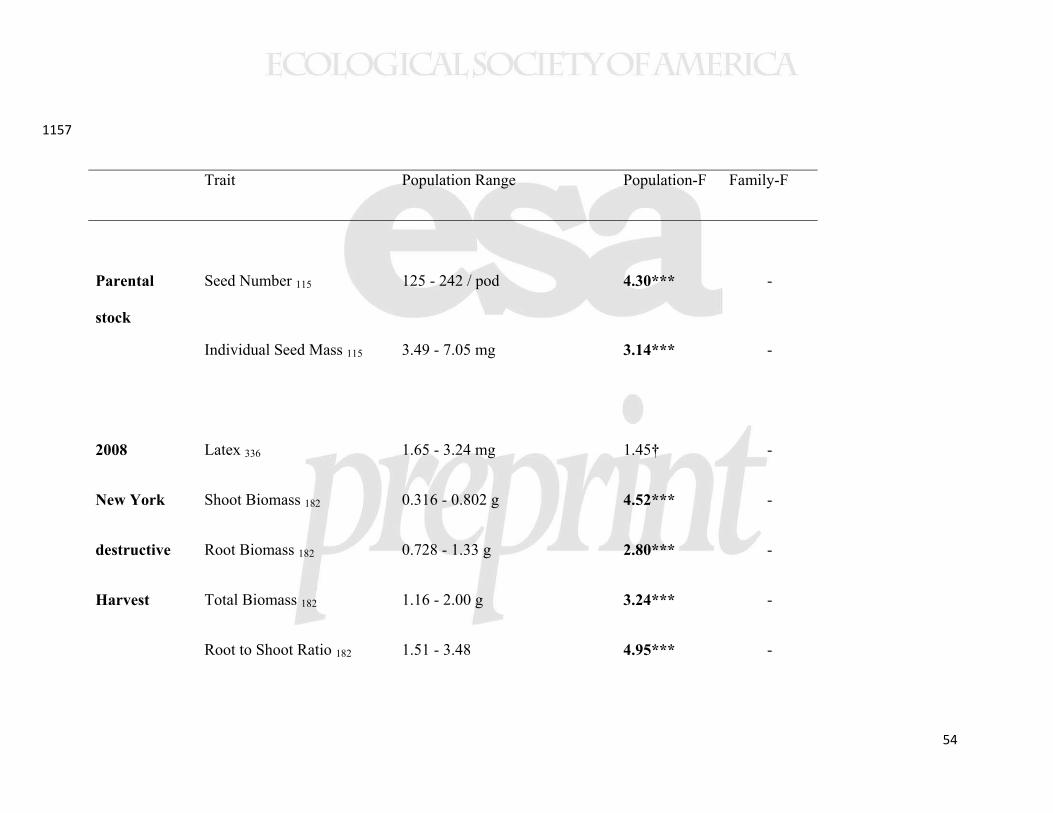
54
1157
Trait Population Range Population-F Family-F
Parental
stock
Seed Number 115 125 - 242 / pod 4.30*** -
Individual Seed Mass 115
3.49 - 7.05 mg
3.14***
-
2008 Latex 336 1.65 - 3.24 mg 1.45† -
New York Shoot Biomass 182 0.316 - 0.802 g 4.52*** -
destructive Root Biomass 182 0.728 - 1.33 g 2.80*** -
Harvest Total Biomass 182 1.16 - 2.00 g 3.24*** -
Root to Shoot Ratio 182 1.51 - 3.48 4.95*** -
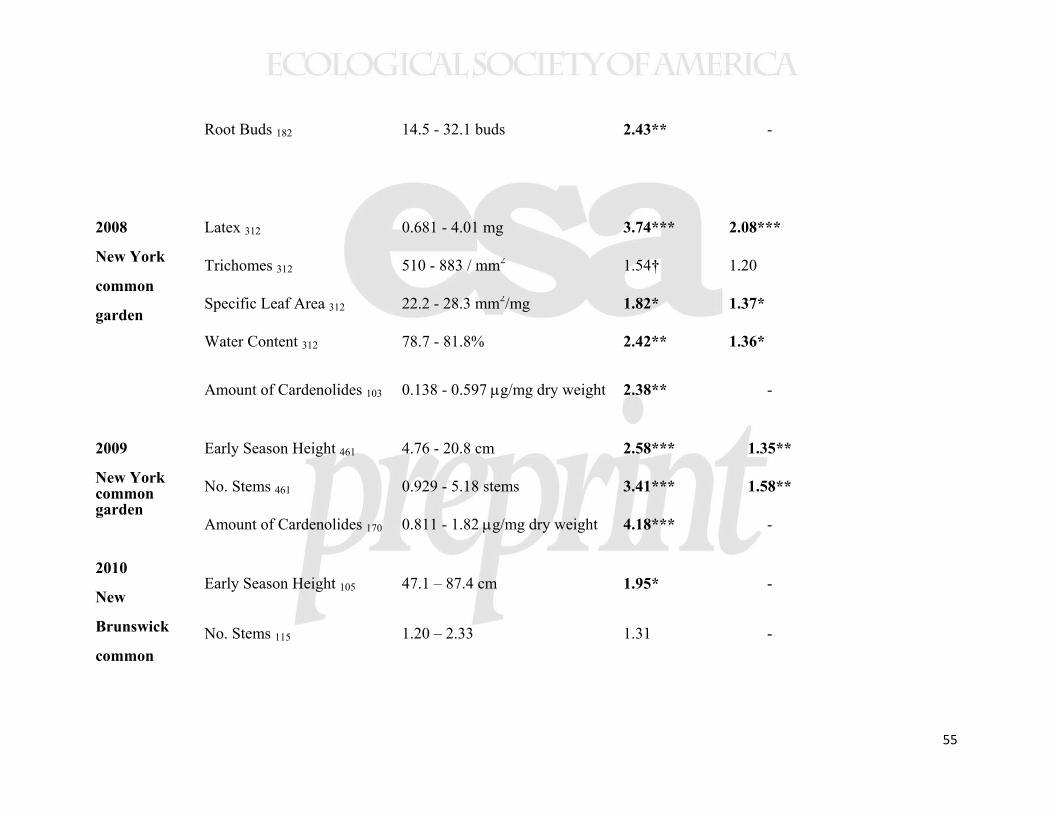
55
Root Buds 182 14.5 - 32.1 buds 2.43** -
2008
New York
common
garden
Latex 312 0.681 - 4.01 mg 3.74*** 2.08*** Trichomes 312 510 - 883 / mm2 1.54† 1.20 Specific Leaf Area 312 22.2 - 28.3 mm2/mg 1.82* 1.37* Water Content 312 78.7 - 81.8% 2.42** 1.36*
Amount of Cardenolides 103 0.138 - 0.597 g/mg dry weight
2.38** -
2009
New York common garden
2010
New
Brunswick
common
Early Season Height 461 4.76 - 20.8 cm 2.58*** 1.35** No. Stems 461 0.929 - 5.18 stems 3.41*** 1.58** Amount of Cardenolides 170 0.811 - 1.82 g/mg dry weight 4.18*** -
Early Season Height 105
No. Stems 115
47.1 – 87.4 cm
1.20 – 2.33
1.95*
1.31
-
-
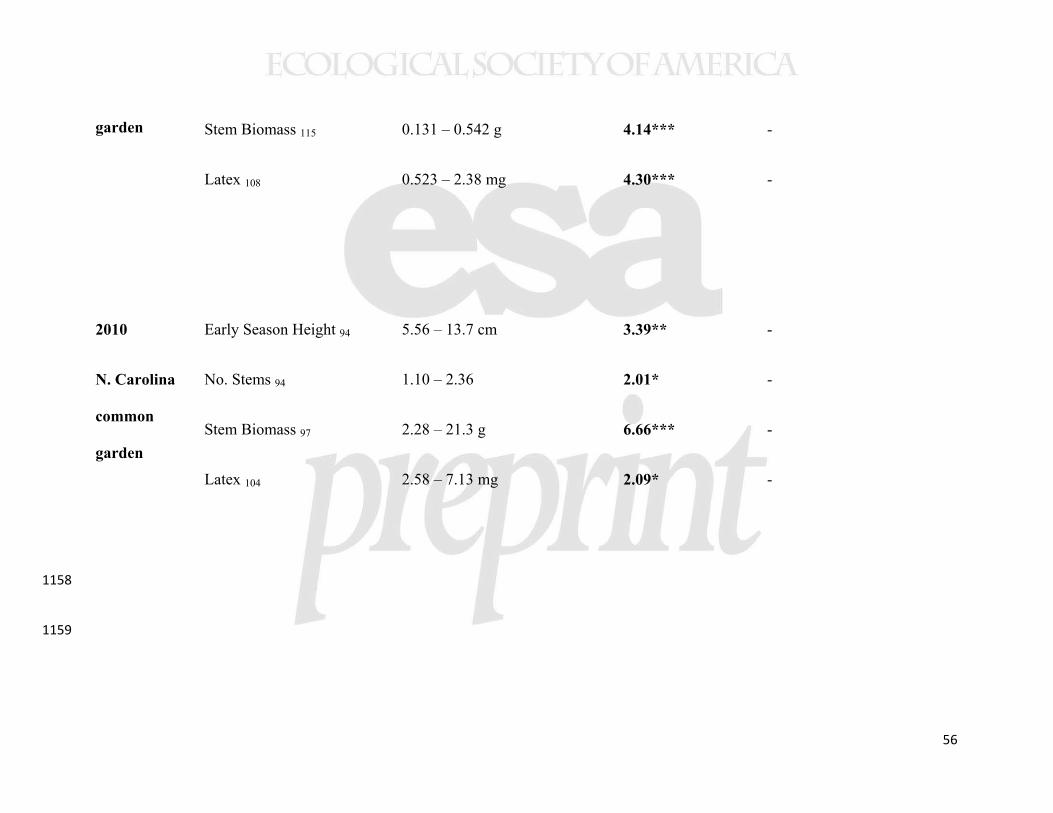
56
garden Stem Biomass 115
Latex 108
0.131 – 0.542 g
0.523 – 2.38 mg
4.14***
4.30***
-
-
2010
N. Carolina
common
garden
Early Season Height 94
No. Stems 94
Stem Biomass 97
Latex 104
5.56 – 13.7 cm
1.10 – 2.36
2.28 – 21.3 g
2.58 – 7.13 mg
3.39**
2.01*
6.66***
2.09*
-
-
-
-
1158
1159
57
Table 2. Analysis of population, latitude, and precipitation as predictors of plant characteristics of Asclepias syriaca population means 1160
using multiple regression. Traits were significantly different among populations in the common gardens in all cases except for latex in 1161
the New York destructive harvest and number of stems in the New Brunswick Common Garden (Table 1). The number of populations 1162
sampled is indicated by sample size. *** P<0.001, ** P<0.01, * P<0.05, †P<0.1. Values in bold are statistically significant. 1163
1164
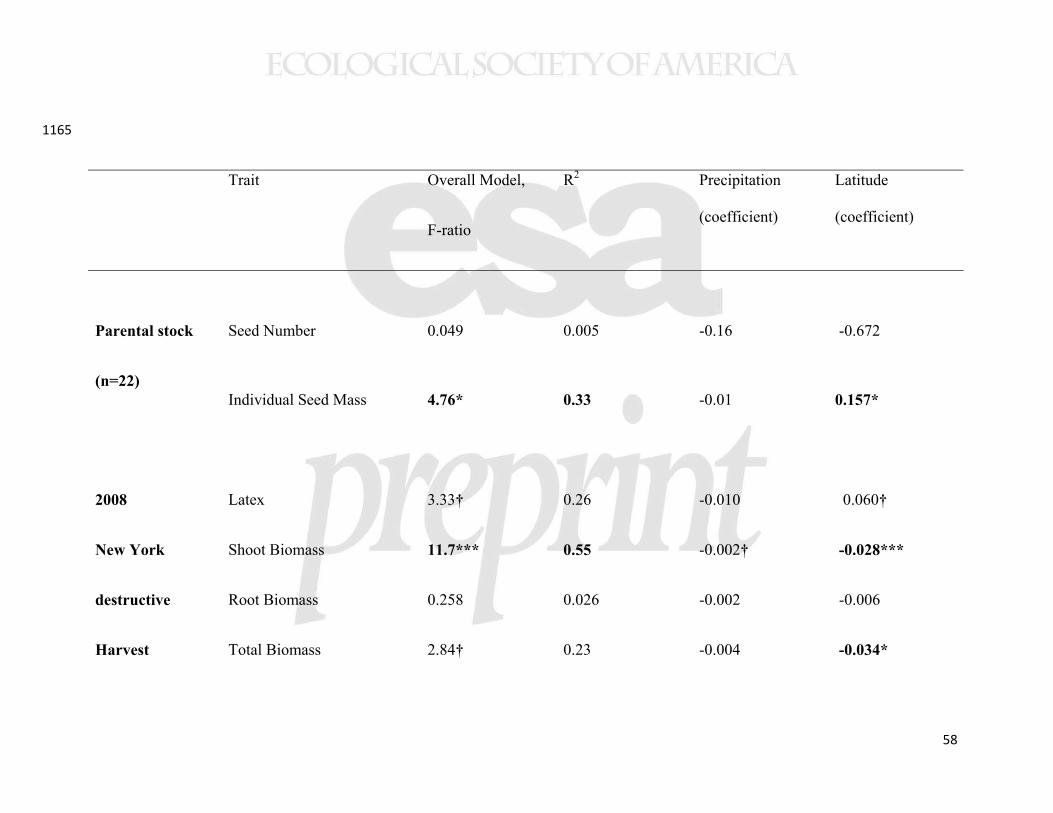
58
1165
Trait Overall Model,
F-ratio
R2 Precipitation
(coefficient)
Latitude
(coefficient)
Parental stock
(n=22)
Seed Number 0.049 0.005 -0.16 -0.672
Individual Seed Mass
4.76*
0.33
-0.01
0.157*
2008 Latex 3.33† 0.26 -0.010 0.060†
New York Shoot Biomass 11.7*** 0.55 -0.002† -0.028***
destructive Root Biomass 0.258 0.026 -0.002 -0.006
Harvest Total Biomass 2.84† 0.23 -0.004 -0.034*
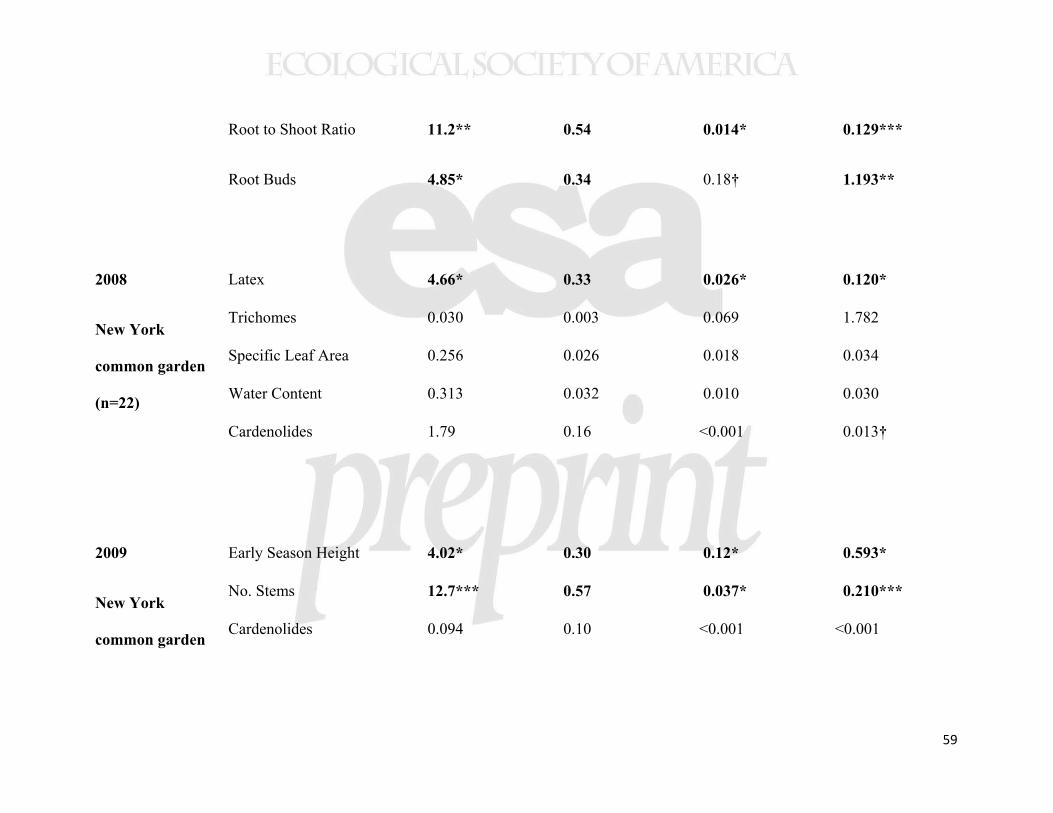
59
Root to Shoot Ratio 11.2** 0.54 0.014* 0.129***
Root Buds 4.85* 0.34 0.18† 1.193**
2008
New York
common garden
(n=22)
Latex 4.66* 0.33 0.026* 0.120* Trichomes 0.030 0.003 0.069 1.782 Specific Leaf Area 0.256 0.026 0.018 0.034 Water Content 0.313 0.032 0.010 0.030 Cardenolides 1.79 0.16 <0.001 0.013†
2009
New York
common garden
Early Season Height 4.02* 0.30 0.12* 0.593* No. Stems 12.7*** 0.57 0.037* 0.210*** Cardenolides 0.094 0.10 <0.001 <0.001
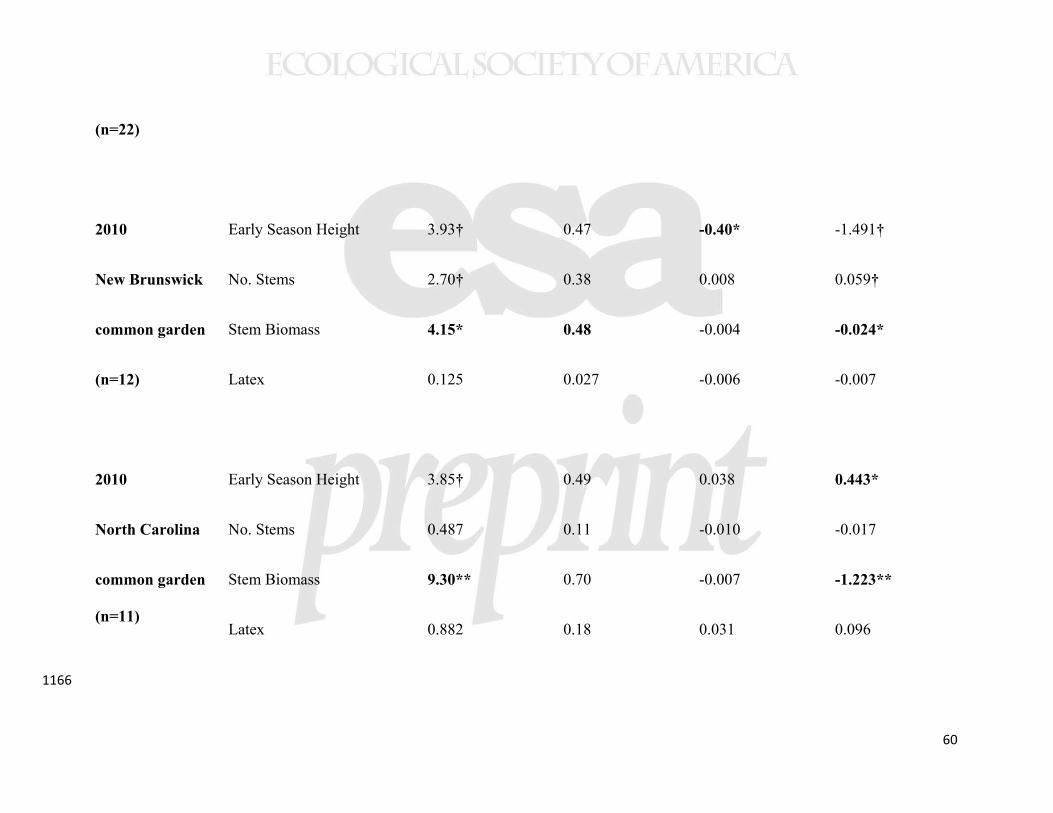
60
(n=22)
2010 Early Season Height 3.93† 0.47 -0.40* -1.491†
New Brunswick No. Stems 2.70† 0.38 0.008 0.059†
common garden Stem Biomass 4.15* 0.48 -0.004 -0.024*
(n=12)
Latex 0.125 0.027 -0.006 -0.007
2010 Early Season Height 3.85† 0.49 0.038 0.443*
North Carolina No. Stems 0.487 0.11 -0.010 -0.017
common garden
(n=11)
Stem Biomass
Latex
9.30**
0.882
0.70
0.18
-0.007
0.031
-1.223**
0.096
1166
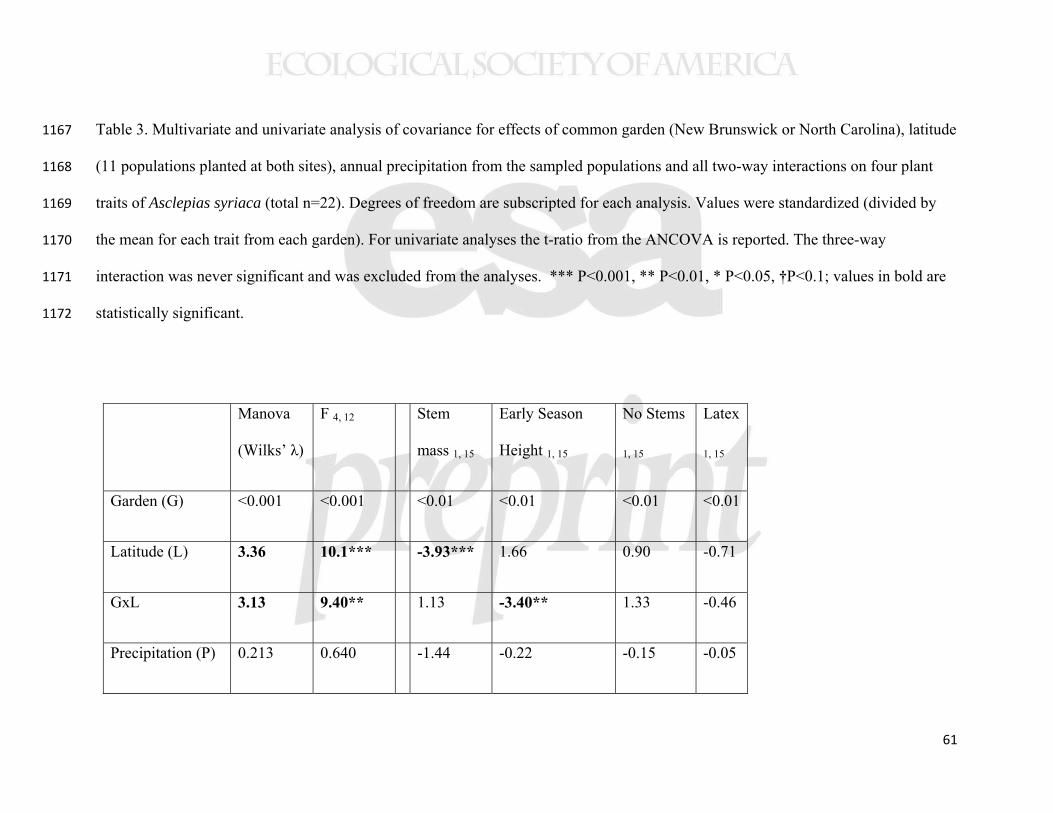
61
Table 3. Multivariate and univariate analysis of covariance for effects of common garden (New Brunswick or North Carolina), latitude 1167
(11 populations planted at both sites), annual precipitation from the sampled populations and all two-way interactions on four plant 1168
traits of Asclepias syriaca (total n=22). Degrees of freedom are subscripted for each analysis. Values were standardized (divided by 1169
the mean for each trait from each garden). For univariate analyses the t-ratio from the ANCOVA is reported. The three-way 1170
interaction was never significant and was excluded from the analyses. *** P<0.001, ** P<0.01, * P<0.05, †P<0.1; values in bold are 1171
statistically significant. 1172
Manova
(Wilks’ λ)
F 4, 12 Stem
mass 1, 15
Early Season
Height 1, 15
No Stems
1, 15
Latex
1, 15
Garden (G) <0.001 <0.001 <0.01 <0.01 <0.01 <0.01
Latitude (L) 3.36 10.1*** -3.93*** 1.66 0.90 -0.71
GxL 3.13 9.40** 1.13 -3.40** 1.33 -0.46
Precipitation (P) 0.213 0.640 -1.44 -0.22 -0.15 -0.05
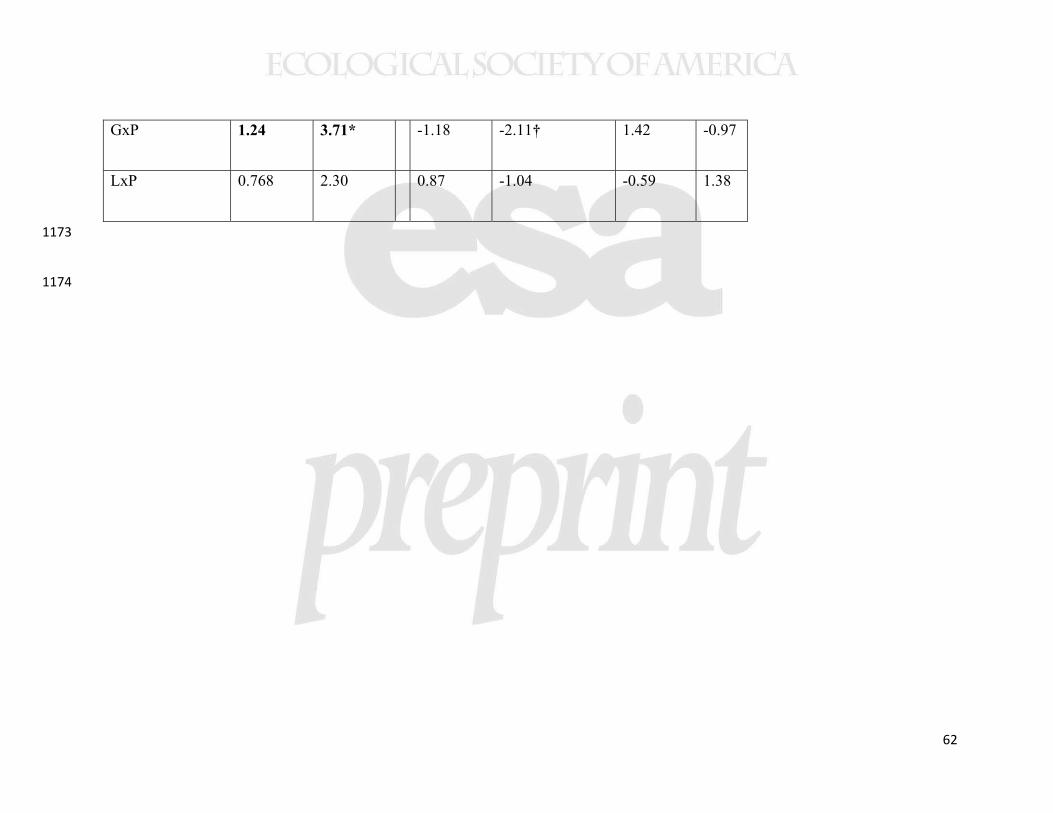
62
GxP 1.24 3.71* -1.18 -2.11† 1.42 -0.97
LxP 0.768 2.30 0.87 -1.04 -0.59 1.38
1173
1174
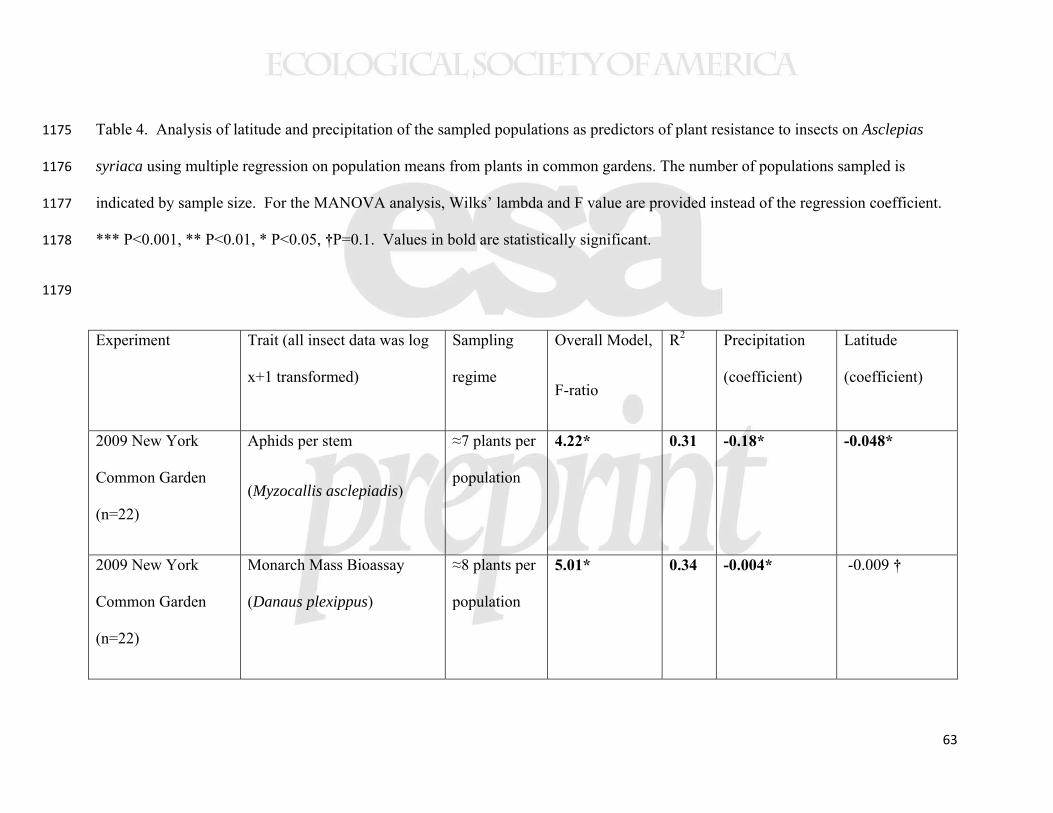
63
Table 4. Analysis of latitude and precipitation of the sampled populations as predictors of plant resistance to insects on Asclepias 1175
syriaca using multiple regression on population means from plants in common gardens. The number of populations sampled is 1176
indicated by sample size. For the MANOVA analysis, Wilks’ lambda and F value are provided instead of the regression coefficient. 1177
*** P<0.001, ** P<0.01, * P<0.05, †P=0.1. Values in bold are statistically significant. 1178
1179
Experiment Trait (all insect data was log
x+1 transformed)
Sampling
regime
Overall Model,
F-ratio
R2 Precipitation
(coefficient)
Latitude
(coefficient)
2009 New York
Common Garden
(n=22)
Aphids per stem
(Myzocallis asclepiadis)
≈7 plants per
population
4.22* 0.31 -0.18* -0.048*
2009 New York
Common Garden
(n=22)
Monarch Mass Bioassay
(Danaus plexippus)
≈8 plants per
population
5.01* 0.34 -0.004* -0.009 †
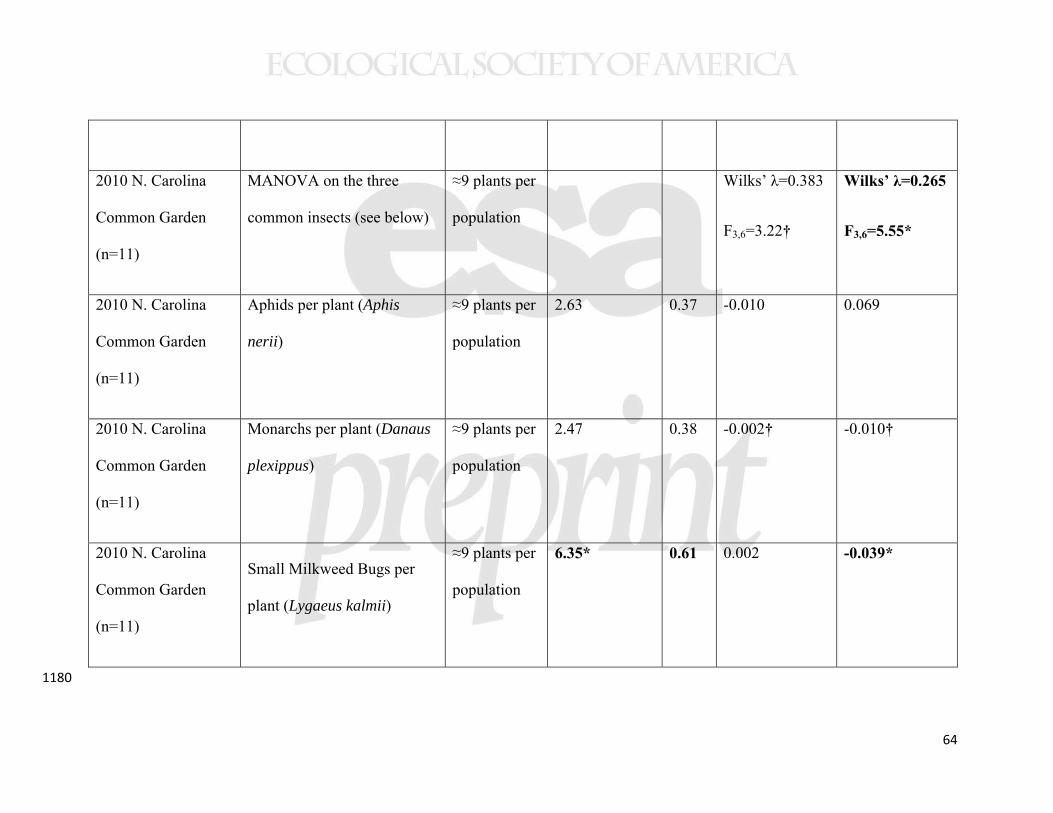
64
2010 N. Carolina
Common Garden
(n=11)
MANOVA on the three
common insects (see below)
≈9 plants per
population
Wilks’ λ=0.383
F3,6=3.22†
Wilks’ λ=0.265
F3,6=5.55*
2010 N. Carolina
Common Garden
(n=11)
Aphids per plant (Aphis
nerii)
≈9 plants per
population
2.63 0.37 -0.010 0.069
2010 N. Carolina
Common Garden
(n=11)
Monarchs per plant (Danaus
plexippus)
≈9 plants per
population
2.47 0.38 -0.002† -0.010†
2010 N. Carolina
Common Garden
(n=11)
Small Milkweed Bugs per
plant (Lygaeus kalmii)
≈9 plants per
population
6.35* 0.61 0.002 -0.039*
1180
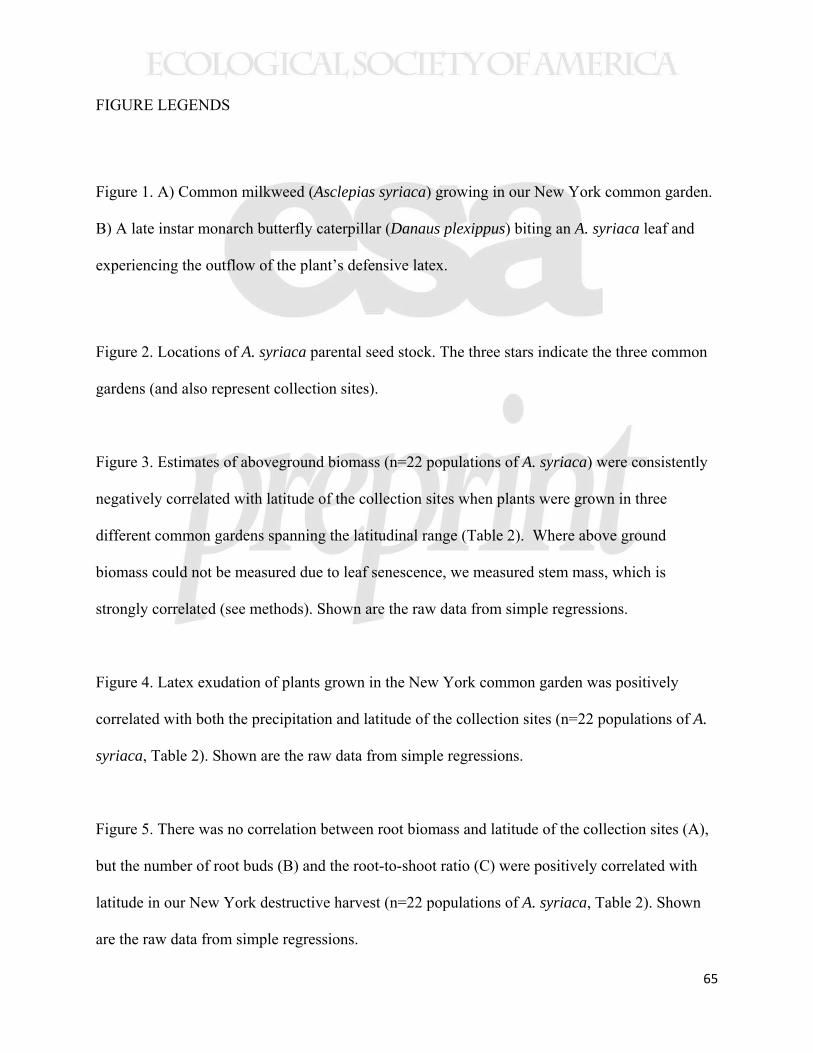
65
FIGURE LEGENDS
Figure 1. A) Common milkweed (Asclepias syriaca) growing in our New York common garden.
B) A late instar monarch butterfly caterpillar (Danaus plexippus) biting an A. syriaca leaf and
experiencing the outflow of the plant’s defensive latex.
Figure 2. Locations of A. syriaca parental seed stock. The three stars indicate the three common
gardens (and also represent collection sites).
Figure 3. Estimates of aboveground biomass (n=22 populations of A. syriaca) were consistently
negatively correlated with latitude of the collection sites when plants were grown in three
different common gardens spanning the latitudinal range (Table 2). Where above ground
biomass could not be measured due to leaf senescence, we measured stem mass, which is
strongly correlated (see methods). Shown are the raw data from simple regressions.
Figure 4. Latex exudation of plants grown in the New York common garden was positively
correlated with both the precipitation and latitude of the collection sites (n=22 populations of A.
syriaca, Table 2). Shown are the raw data from simple regressions.
Figure 5. There was no correlation between root biomass and latitude of the collection sites (A),
but the number of root buds (B) and the root-to-shoot ratio (C) were positively correlated with
latitude in our New York destructive harvest (n=22 populations of A. syriaca, Table 2). Shown
are the raw data from simple regressions.
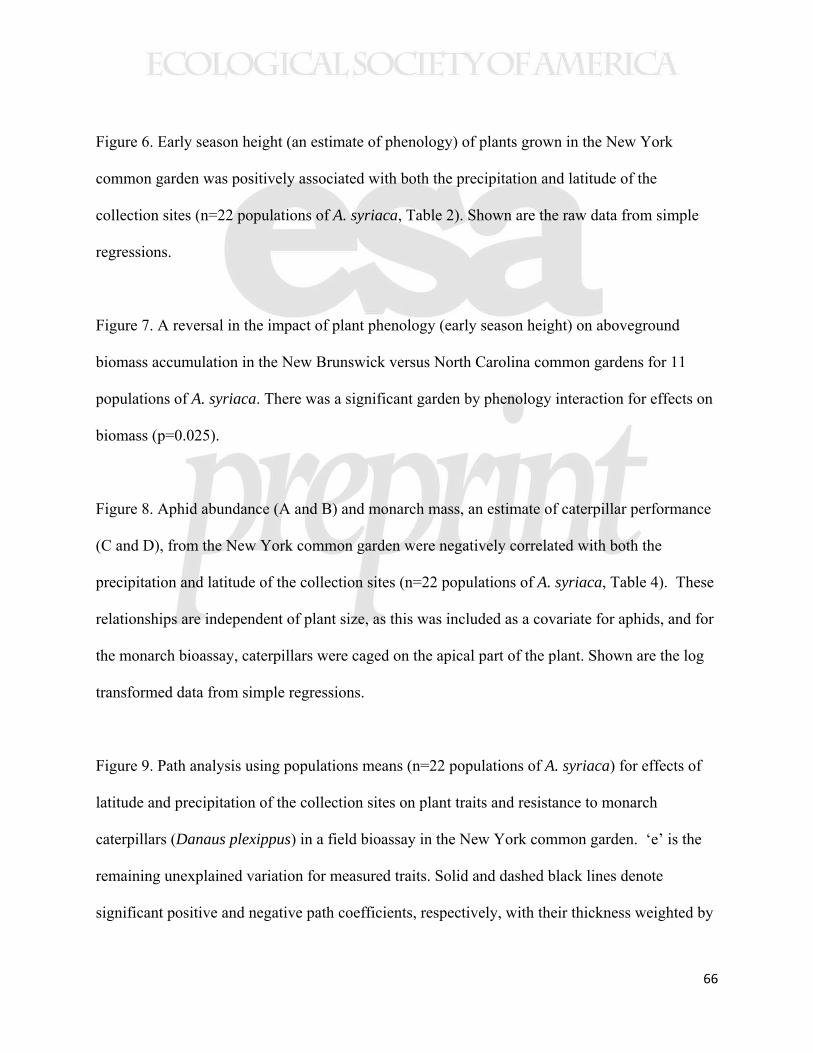
66
Figure 6. Early season height (an estimate of phenology) of plants grown in the New York
common garden was positively associated with both the precipitation and latitude of the
collection sites (n=22 populations of A. syriaca, Table 2). Shown are the raw data from simple
regressions.
Figure 7. A reversal in the impact of plant phenology (early season height) on aboveground
biomass accumulation in the New Brunswick versus North Carolina common gardens for 11
populations of A. syriaca. There was a significant garden by phenology interaction for effects on
biomass (p=0.025).
Figure 8. Aphid abundance (A and B) and monarch mass, an estimate of caterpillar performance
(C and D), from the New York common garden were negatively correlated with both the
precipitation and latitude of the collection sites (n=22 populations of A. syriaca, Table 4). These
relationships are independent of plant size, as this was included as a covariate for aphids, and for
the monarch bioassay, caterpillars were caged on the apical part of the plant. Shown are the log
transformed data from simple regressions.
Figure 9. Path analysis using populations means (n=22 populations of A. syriaca) for effects of
latitude and precipitation of the collection sites on plant traits and resistance to monarch
caterpillars (Danaus plexippus) in a field bioassay in the New York common garden. ‘e’ is the
remaining unexplained variation for measured traits. Solid and dashed black lines denote
significant positive and negative path coefficients, respectively, with their thickness weighted by

67
the strength of the coefficient. Grey arrows are similarly coded but not statistically significant
path coefficients.
Figure 10. Plant damage and insect richness on Asclepias syriaca at five naturally-occurring sites
at each location. New Brunswick and North Carolina are close to the northern and southern
range edges, respectively. Data are least squares means ± SE across surveys conducted in both
2009 and 2010. Different letters above bars represent significant (p<0.05) differences using
Tukey’s HSD.
A
BB
Figure 1
Figure 2
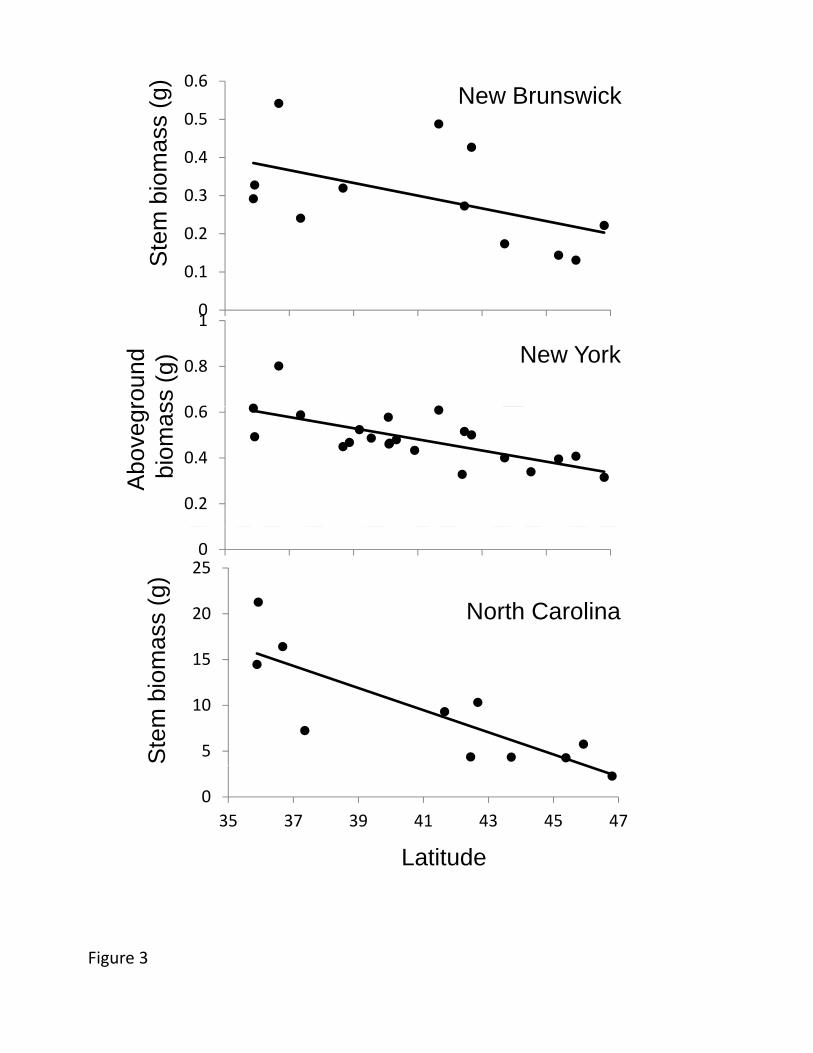
0.4
0.5
0.6New Brunswick
mas
s (g
)
0.1
0.2
0.3
Ste
m b
iom
0 6
0.8
10
35 37 39 41 43 45 47New York
roun
d ss
(g)
0.2
0.4
0.6
Abo
vegr
biom
as
0
35 37 39 41 43 45 47
20
25
North Carolina
ass
(g)
5
10
15
Ste
m b
iom
a
0
35 37 39 41 43 45 47
Latitude
Figure 3
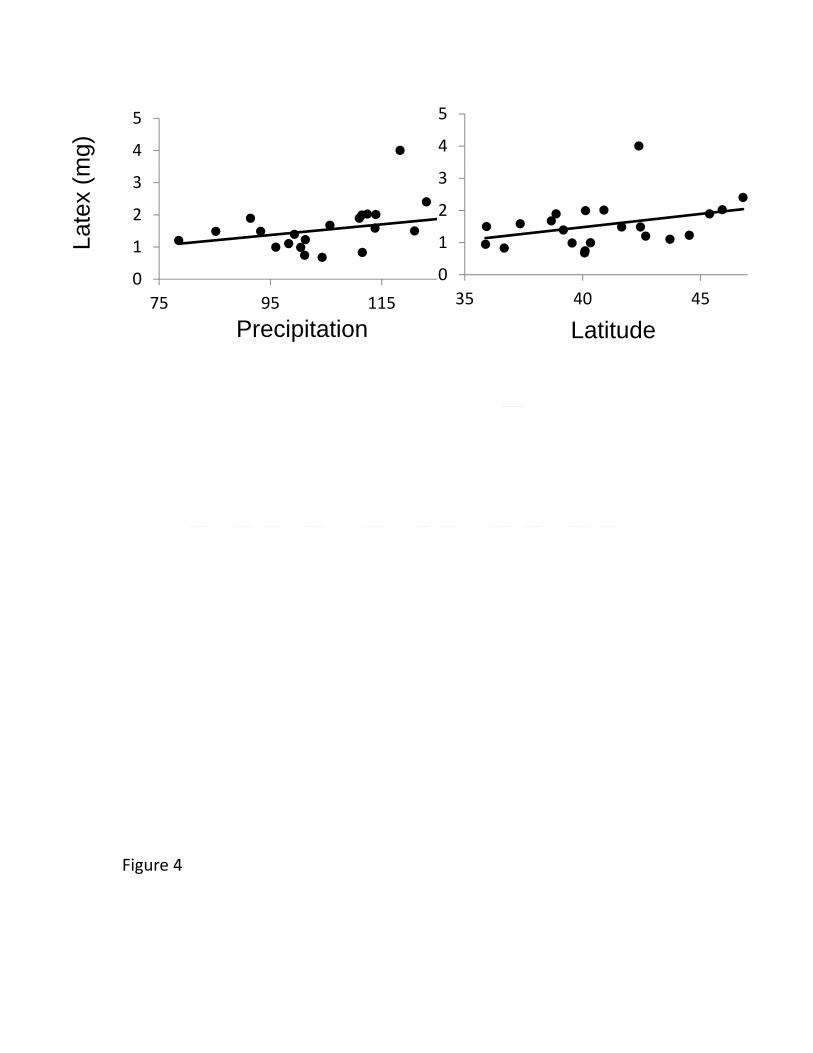
4
5
4
5
mg)
0
1
2
3
0
1
2
3
Late
x (m
75 95 115 35 40 45
LatitudePrecipitation
Figure 4
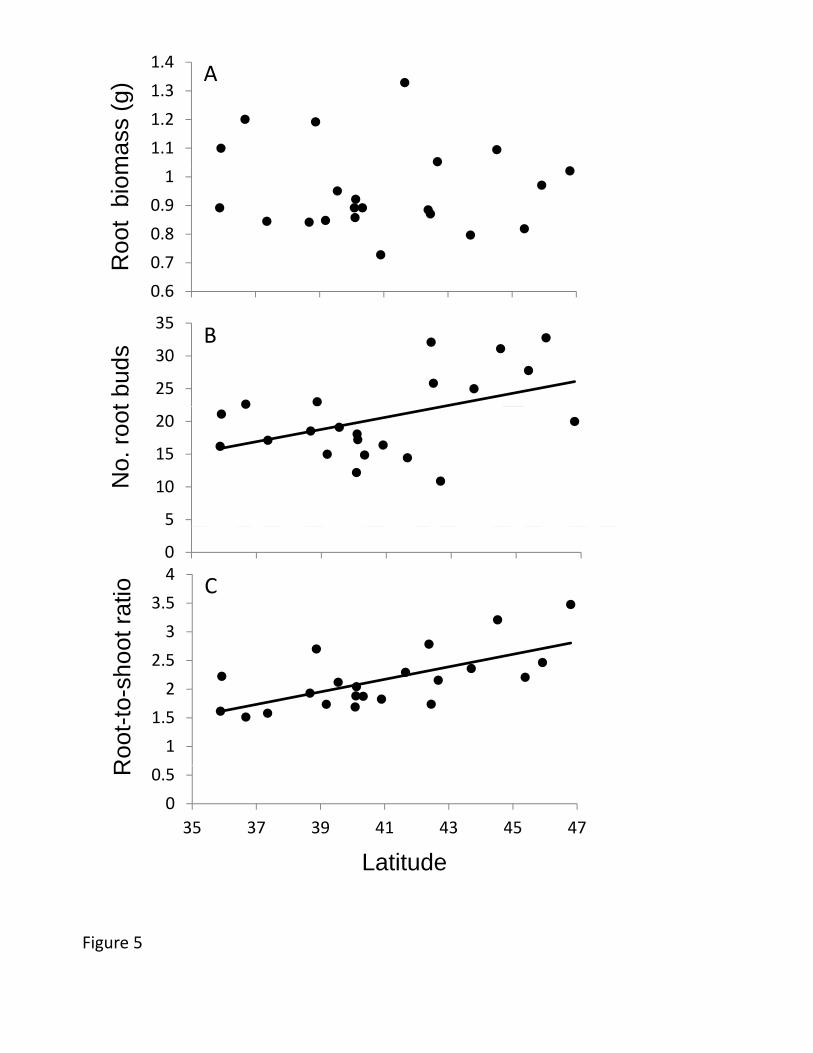
mas
s (g
)1.1
1.2
1.3
1.4A
Roo
t bi
om
0 6
0.7
0.8
0.9
1
t bud
s
25
30
35
0.6
35 37 39 41 43 45 47B
No.
roo
t
5
10
15
20
ot r
atio
0
35 37 39 41 43 45 47
3
3.5
4C
Roo
t-to
-sho
o
1
1.5
2
2.5
Latitude
R
0
0.5
35 37 39 41 43 45 47
Figure 5
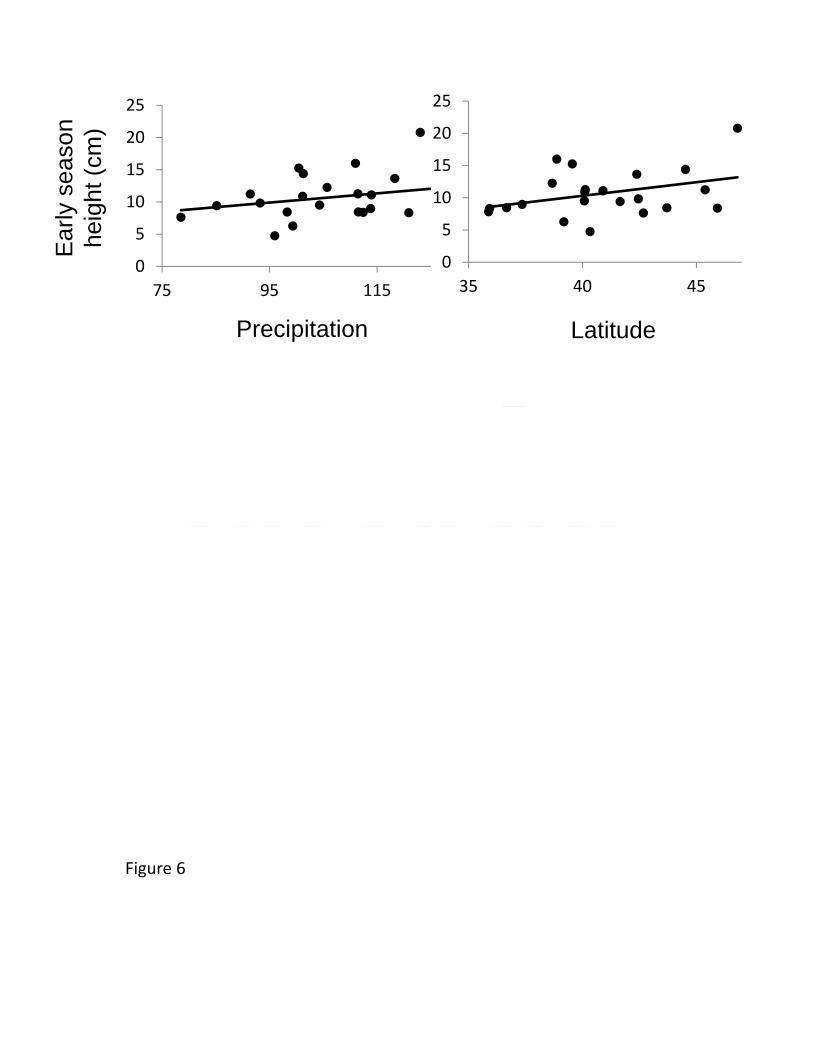
15
20
25
ason
cm
)
15
20
25
0
5
10
15
35 40 45
Ear
ly s
eahe
ight
(
0
5
10
15
75 95 115 35 40 4575 95 115
LatitudePrecipitation
Figure 6
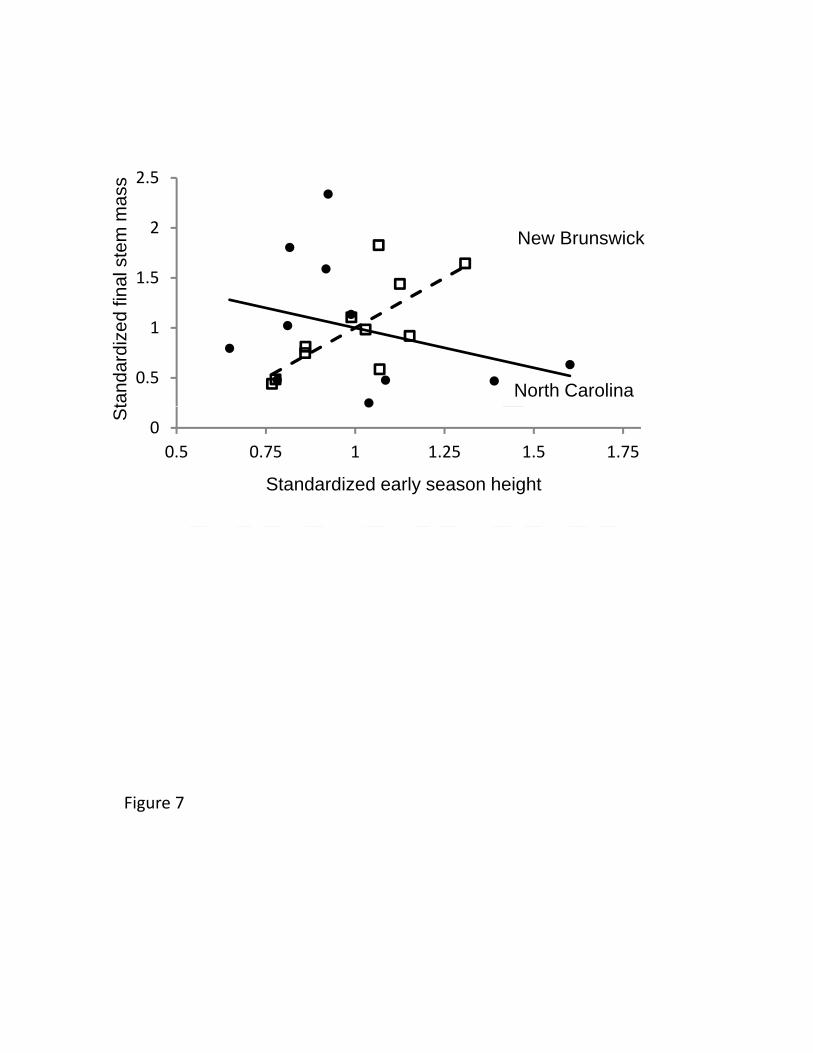
1.5
2
2.5
al s
tem
mas
s
New Brunswick
0.5
1
tand
ardi
zed
fin
North Carolina
0
0.5 0.75 1 1.25 1.5 1.75
Standardized early season height
St
Figure 7
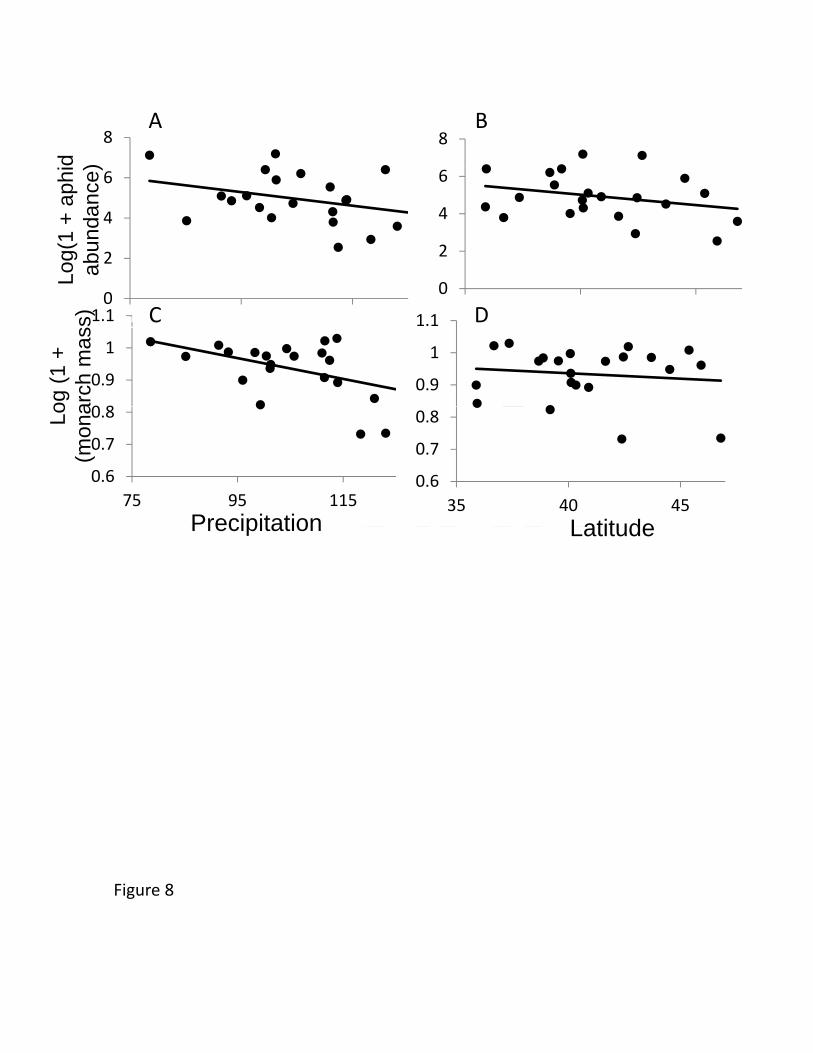
8 8
d )
A B
2
4
6
0
2
4
6
Log(
1 +
aph
iab
unda
nce )
0 8
0.9
1
1.10
75 95 115
0
35 40 45
og (
1 +
arch
mas
s) C D
0.9
1
1.1
0.6
0.7
0.8
75 95 115
Latitude
Lo(m
ona
Precipitation
0.6
0.7
0.8
35 40 45
LatitudePrecipitation
Fi 8Figure 8
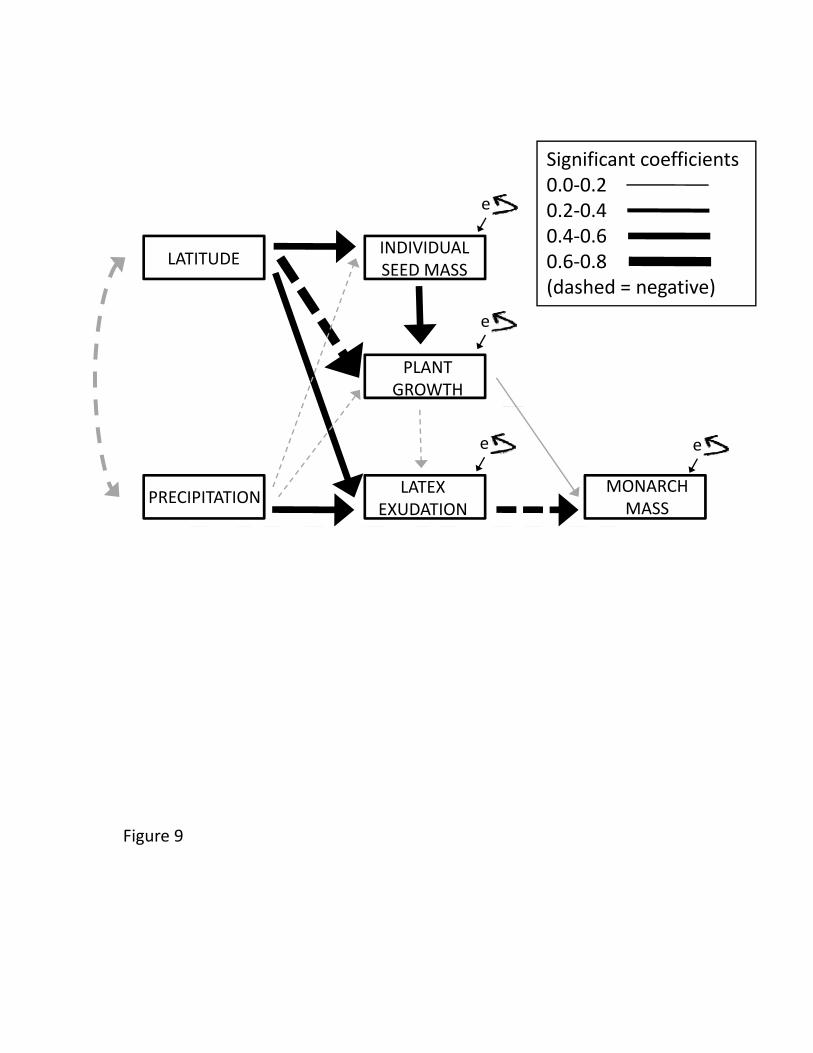
Significant coefficients
LATITUDEINDIVIDUAL SEED MASS
e
g0.0‐0.20.2‐0.40.4‐0.60.6‐0.8(dashed = negative)
PLANT GROWTH
e
(dashed = negative)
PRECIPITATIONLATEX
EXUDATIONMONARCH
MASS
ee
Figure 9
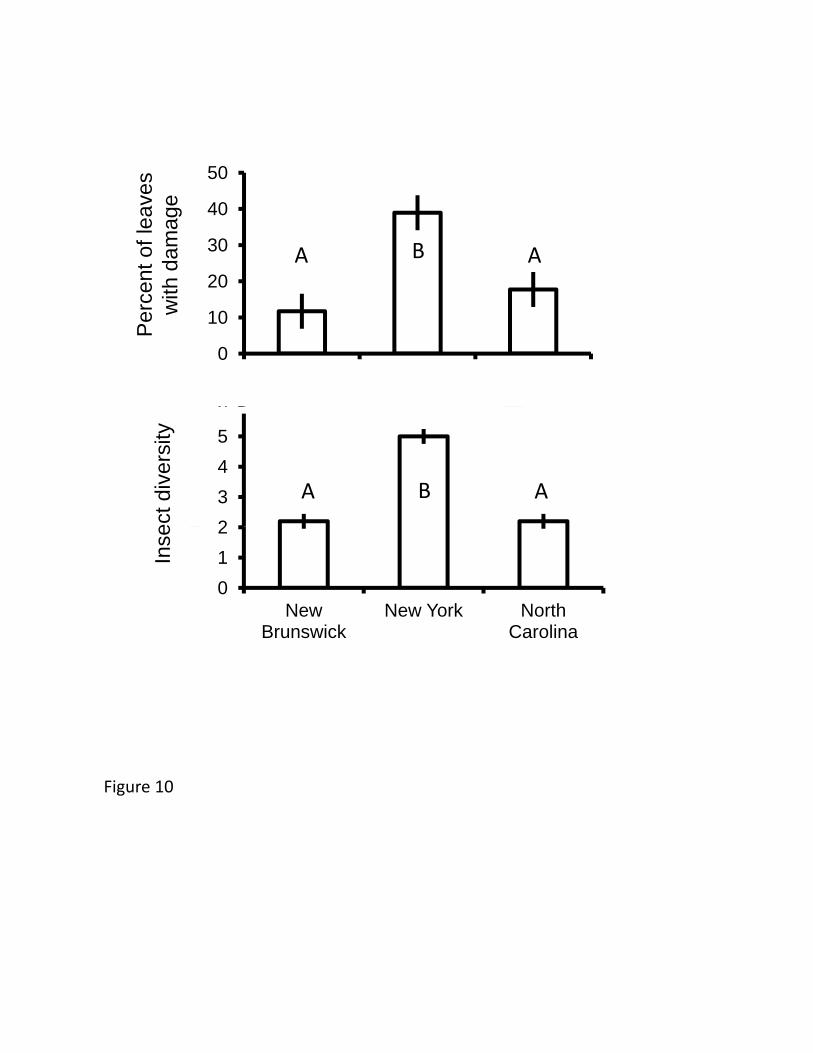
50
20
30
40
50
ent o
f le
aves
h
dam
age
A AB
6
0
10
20
N Brunswick Ithaca N Carolina
Per
ce with
2
3
4
5
6
ect
dive
rsity
A AB
0
1
2
New Brunswick
New York North Carolina
Inse
Figure 10