Embed Size (px)
Citation preview
1. ABSTRACT
Newberry Volcano of central Oregon is located in a complex, extensional tectonic setting. Fracture systems converging near the volcanic center include the Brothers (west-northwest trending), Tumalo (north-northwest), and Walker Rim (northeast) fault zones. Newberry covers greater than 1600 sq. km and is associated with over 400 basaltic cinder cones and fissure vents (Holocene-Late Pleistocene). The large number of cinder cones provides a robust data set from which to conduct spatial analyses of vent distribution patterns and quantitatively test for structural controls on magma emplacement.
Newberry cone positions (n=296) were compiled from digital geologic maps and statistically analyzed using GIS. Cone locations were further subdivided into northern (n=149) and southern (n=147) domains to test for mutually independent relations between the three fault zones. Observed cone patterns were tested for randomness and spatial anisotropy using a combination of quadrat analysis (Komogorov-Simirnov test) and comparative-distribution analysis via Monte Carlo simulations. The latter employed the “line-azimuth” and “point-density” techniques of Lutz (1986) and Zhang and Lutz (1989). Statistically significant cone-distribution patterns were subsequently compared to fault trends to assess the degree to which magma emplacement was guided by regional tectonic stress fields.
Results of the K-S tests reject the null hypothesis at the 95% confidence interval, documenting that Newberry cinder cones are not randomly distributed. The Monte Carlo-based analyses identify three significant cone alignments in the southern domain (dominant azimuth directions = 0, 10-35, 340-350), and three in the northern (80, 280-295, 310). Combined data from both domains strengthens the statistical significance of the 310 and 340-350 cone alignment directions. Fault segment analysis reveals three dominant azimuthal trends in the region: 310-320 (Brothers fault zone), 330-340 (Tumalo fault zone), and 45-55 (Walker Rim). The above results suggest that the Brothers and Tumalo fault zones had a detectable control on cinder-cone emplacement in both the northern and southern domains, whereas the Walker Rim is poorly correlated to significant cone-alignment patterns. Cinder cone alignments with azimuthal trends of 10-15, 30-35, and 85 suggest additional control by structural conditions other than those represented by mapped surface faults.
Geological Society of America Fall 2005 Meeting, Salt Lake City, UtahSession No. 190 Quaternary Geology and Geomorphology (Poster Booth 56)
Spatial Analysis of Cinder Cone Distribution at Newberry Volcano, Oregon: Implications for Structural Control on Eruptive Process
Stephen B. Taylor, Jeffrey H. Templeton, Jeffrey Budnick, Chandra Drury, Jamie Fisher, and Summer Runyan; Earth and Physical Sciences Department, Western Oregon University, Monmouth, Oregon 97361, email: [email protected]
2. INTRODUCTION
Cinder cones are point-like geologic features that provide a surface record of magmatic emplacement processes through time. Numerous workers have observed that cinder cones commonly occur in sets with notable clustered or aligned spatial patterns, rather than being isotropically distributed (e.g. Carr, 1976; Hasenka and Carmichael, 1985; Wadge and Cross, 1988; Connor and Condit, 1989; Connor, 1990). Such cone alignments are often interpreted as being the result of magma transport along pre-existing fracture zones or that they form in relationship to regional stress fields at the time of crustal ascent (Kear, 1964; Nakamura, 1977; Settle, 1979; Connor, 1987; Connor et al., 1992).
Newberry Volcano of central Oregon, is located in a complex, extensional tectonic setting at the intersection of the Basin and Range, High Lava Plains, and Cascade Volcanic Arc provinces (Figure 1). Several major fracture systems surround and converge near Newberry, including the Brothers (west-northwest trending), Tumalo (north-northwest), and Walker Rim (northeast) fault zones. With a volume of greater than 450 km3, Newberry is one of the largest volcanoes in the contiguous United States and is associated with over 400 basaltic cinder cones and fissure vents (Holocene-Late Pleistocene; Jensen 2002) (Figures 3 and 4). MacLeod and Sherrod (1988) observed that the curvilinear distribution of cinder cones and fissure vents on the flanks of Newberry trend mostly parallel to the Walker Rim and Tumalo fault zones, suggesting that these structures may form a single arc-shaped fracture zone at depth and likely serve as conduits that guide magma emplacement. While the structure-controlled, eruptive mechanism posited by MacLeod and Sherrod (1988) has significant merit, supporting statistical analysis of cone patterns and regional fault trends are lacking. To address this need, GIS and spatial analyses were used to quantitatively delineate Newberry vent-distribution patterns and test for structural controls on magma emplacement.
This paper presents the second installment of research on the geologic, morphologic, and spatial characteristics of basaltic cinder cones at Newberry Volcano. Previous companion work includes that of Taylor et al. (2003) and Giles et al. (2003). As population density is rapidly increasing in Bend and surrounding areas (annual avg. growth = 21%; U.S. Census Bureau, 2003), this ongoing investigation may have important implications for volcanic hazards assessment in the region (after Sherrod et al., 1997).
3. GEOLOGIC SETTING
Newberry Volcano is an elongated shield that extends 60 km in a north-south direction and 30 km from east to west, covering an area greater than 1600 km2. The summit is marked by a caldera that is 7 by 5 km across (Figures 2 and 3), with eruptive products ranging in age from Holocene to Late Pleistocene (MacLeod and Sherrod, 1988; Jensen, 2002).
Newberry Volcano lies at the west end of the High Lava Plains about 65 km east of the Cascade Range (Figure 1). Owing to its location, Newberry displays tectonic and compositional characteristics of the Cascade Range, High Lava Plains, and Basin and Range (MacLeod and others, 1981; MacLeod and Sherrod. 1988). The volcano is also positioned at the younger end of a sequence of rhyolite domes and caldera-forming ash-flow tuffs that decrease in age from 10 m.y. in southeastern Oregon to less than 1 m.y. near the caldera (Figure 1).
As stated above, Newberry is located in a complex, extensional tectonic setting dominated by Pliocene to Quaternary faults (Figures 1 and 2) (MacLeod and others, 1981; MacLeod and Sherrod. 1988). The Brothers fault zone is a major west-northwest trending domain of dominantly right-lateral strike slip faults that extend from southeastern Oregon to the northeast flank of Newberry, where the faults are buried by Quaternary lava flows (MacLeod and others, 1981; MacLeod and Sherrod. 1988). The north-northwest trending Tumalo fault zone extends from the east side of the Cascades to the lower northern flanks of Newberry, where older lava flows
Figure 1. Generalized map of Oregon emphasizing the regional geologic and tectonic framework of Newberry Volcano. (After Walker and MacLeod, 1991).
analysis (Connor, 1987), and cluster analysis (Connor, 1990). While these quantitative methods have been applied in a wide variety of volcanic settings in North America, none have been utilized to analyze cinder-cone distribution at Newberry Volcano.
Observed cone patterns were tested for randomness and spatial anisotropy using a combination of quadrat analysis (Komogorov-Simirnov test) and comparative-distribution analysis via Monte Carlo simulations. The latter employed the “line-azimuth” method of Lutz (1986) and the “point-density” method of Zhang and Lutz (1989). Both techniques consider cinder cone positions to represent nodal points connecting a set of lattice lines. Newberry cone positions and lattice orientations were systematically compared to simulated random point patterns. Statistical filtering was used to identify anisotropic distributions and delineate cone-alignment patterns. Statistically significant cone-distribution patterns were subsequently compared to fault trends to assess the degree to which magma emplacement was guided by regional tectonic stress fields. The analytical techniques used in this study are graphically depicted in Figure 5.
A select set of Newberry cinder cones (n = 296) were analyzed by applying the statistical techniques in a geographic information system. Data compilation and spatial analysis was conducted using a suite of GIS-related software including ArcView (ESRI), ArcGIS (ESRI), Idrisi (Clark Labs), Cartalynx (Clark Labs), and Surfer (Golden Software). Cone-vent positions were derived from a variety of data sources including a digitized version of the published Newberry geologic map (1:62,500; MacLeod and others, 1995; Giles and others, 2003), USGS 10-m digital elevation models (DEM), and 1:24000 digital orthophotoquads (DOQ). The sample population included all single and composite basaltic cinder cones mapped as "Qc" by MacLeod and others (1995). Cone locations were further subdivided into northern (n=149) and southern (n=147) domains to test for mutually independent relations between the three fault zones. The analysis did not include eruptive products mapped as part of the fissure-vent systems surrounding the caldera region.
Co
ast
R
ang
e
Wes
tern
C
asca
des
K lam athMountains
Ca
scad
ia
S
ub
du
ctio
n
Zo
ne
Hig
h
Cas
cad
es
Basin and Range
1 0987
6
5
1
4 . 5 c m / y r
OwyheeUpland
Blue Mountains
Deschutes-UmatillaPlateau
Will
amet
te V
alle
y
High LavaPlainsWRFZ
BFZ
TFZ
Extent o f N ew berry Lava F low s N ew berry C aldera
R hyolite Isochrons (M a)9
Faults: TFZ = Tum alo Fault Zone W R FZ = W alker R im Fault Zone BFZ = B rother Fault Zone
M H
M J
T S
M W
C L
0 1 0 0 k m
4 2 N
4 4 N
4 6 N
1 2 4 W 1 2 2 W 1 2 0 W 1 1 8 W
O regon
StudyArea
Basalt and basaltic andesite flows:early P le istocene to Holocene
Rhyolite to dacite dom es, flow s, pum ice rings,and vent com plexes: early P le istocene toHolocene
Pum ice fa lls, ash flow s, and a lluvia l deposits:P le istocene to H olocene
Andesite Tuff (w est flank): P le istocene
B lack Lapilli Tuff (w est flank): P le istocene
A lluvia l deposits w ith in terbedded lap illi tu ff, ashflow tuff, and pum ice fa ll deposits: P le istocene
Tepee D raw Tuff (east flank): P le istocene
Basalt and basaltic andesite of sm all sh ie lds:P le istocene
F luvia l and lacustrine sedim ents: P le istoceneand P liocene(?)
Basalt, basaltic andesite , and andesite flows, ashflow tuffs, and pum ice deposits of the CascadeRange: P le istocene
Basalt flow s and interbedded cinders and scoriadeposits: la te M iocene
Rhyolite and andesite flows, dom es, andpyroclastic rocks of P ine M ounta in: earlyM iocene
New berry Caldera com plex
C inder cones and fissure vents
Faults
0 5 km
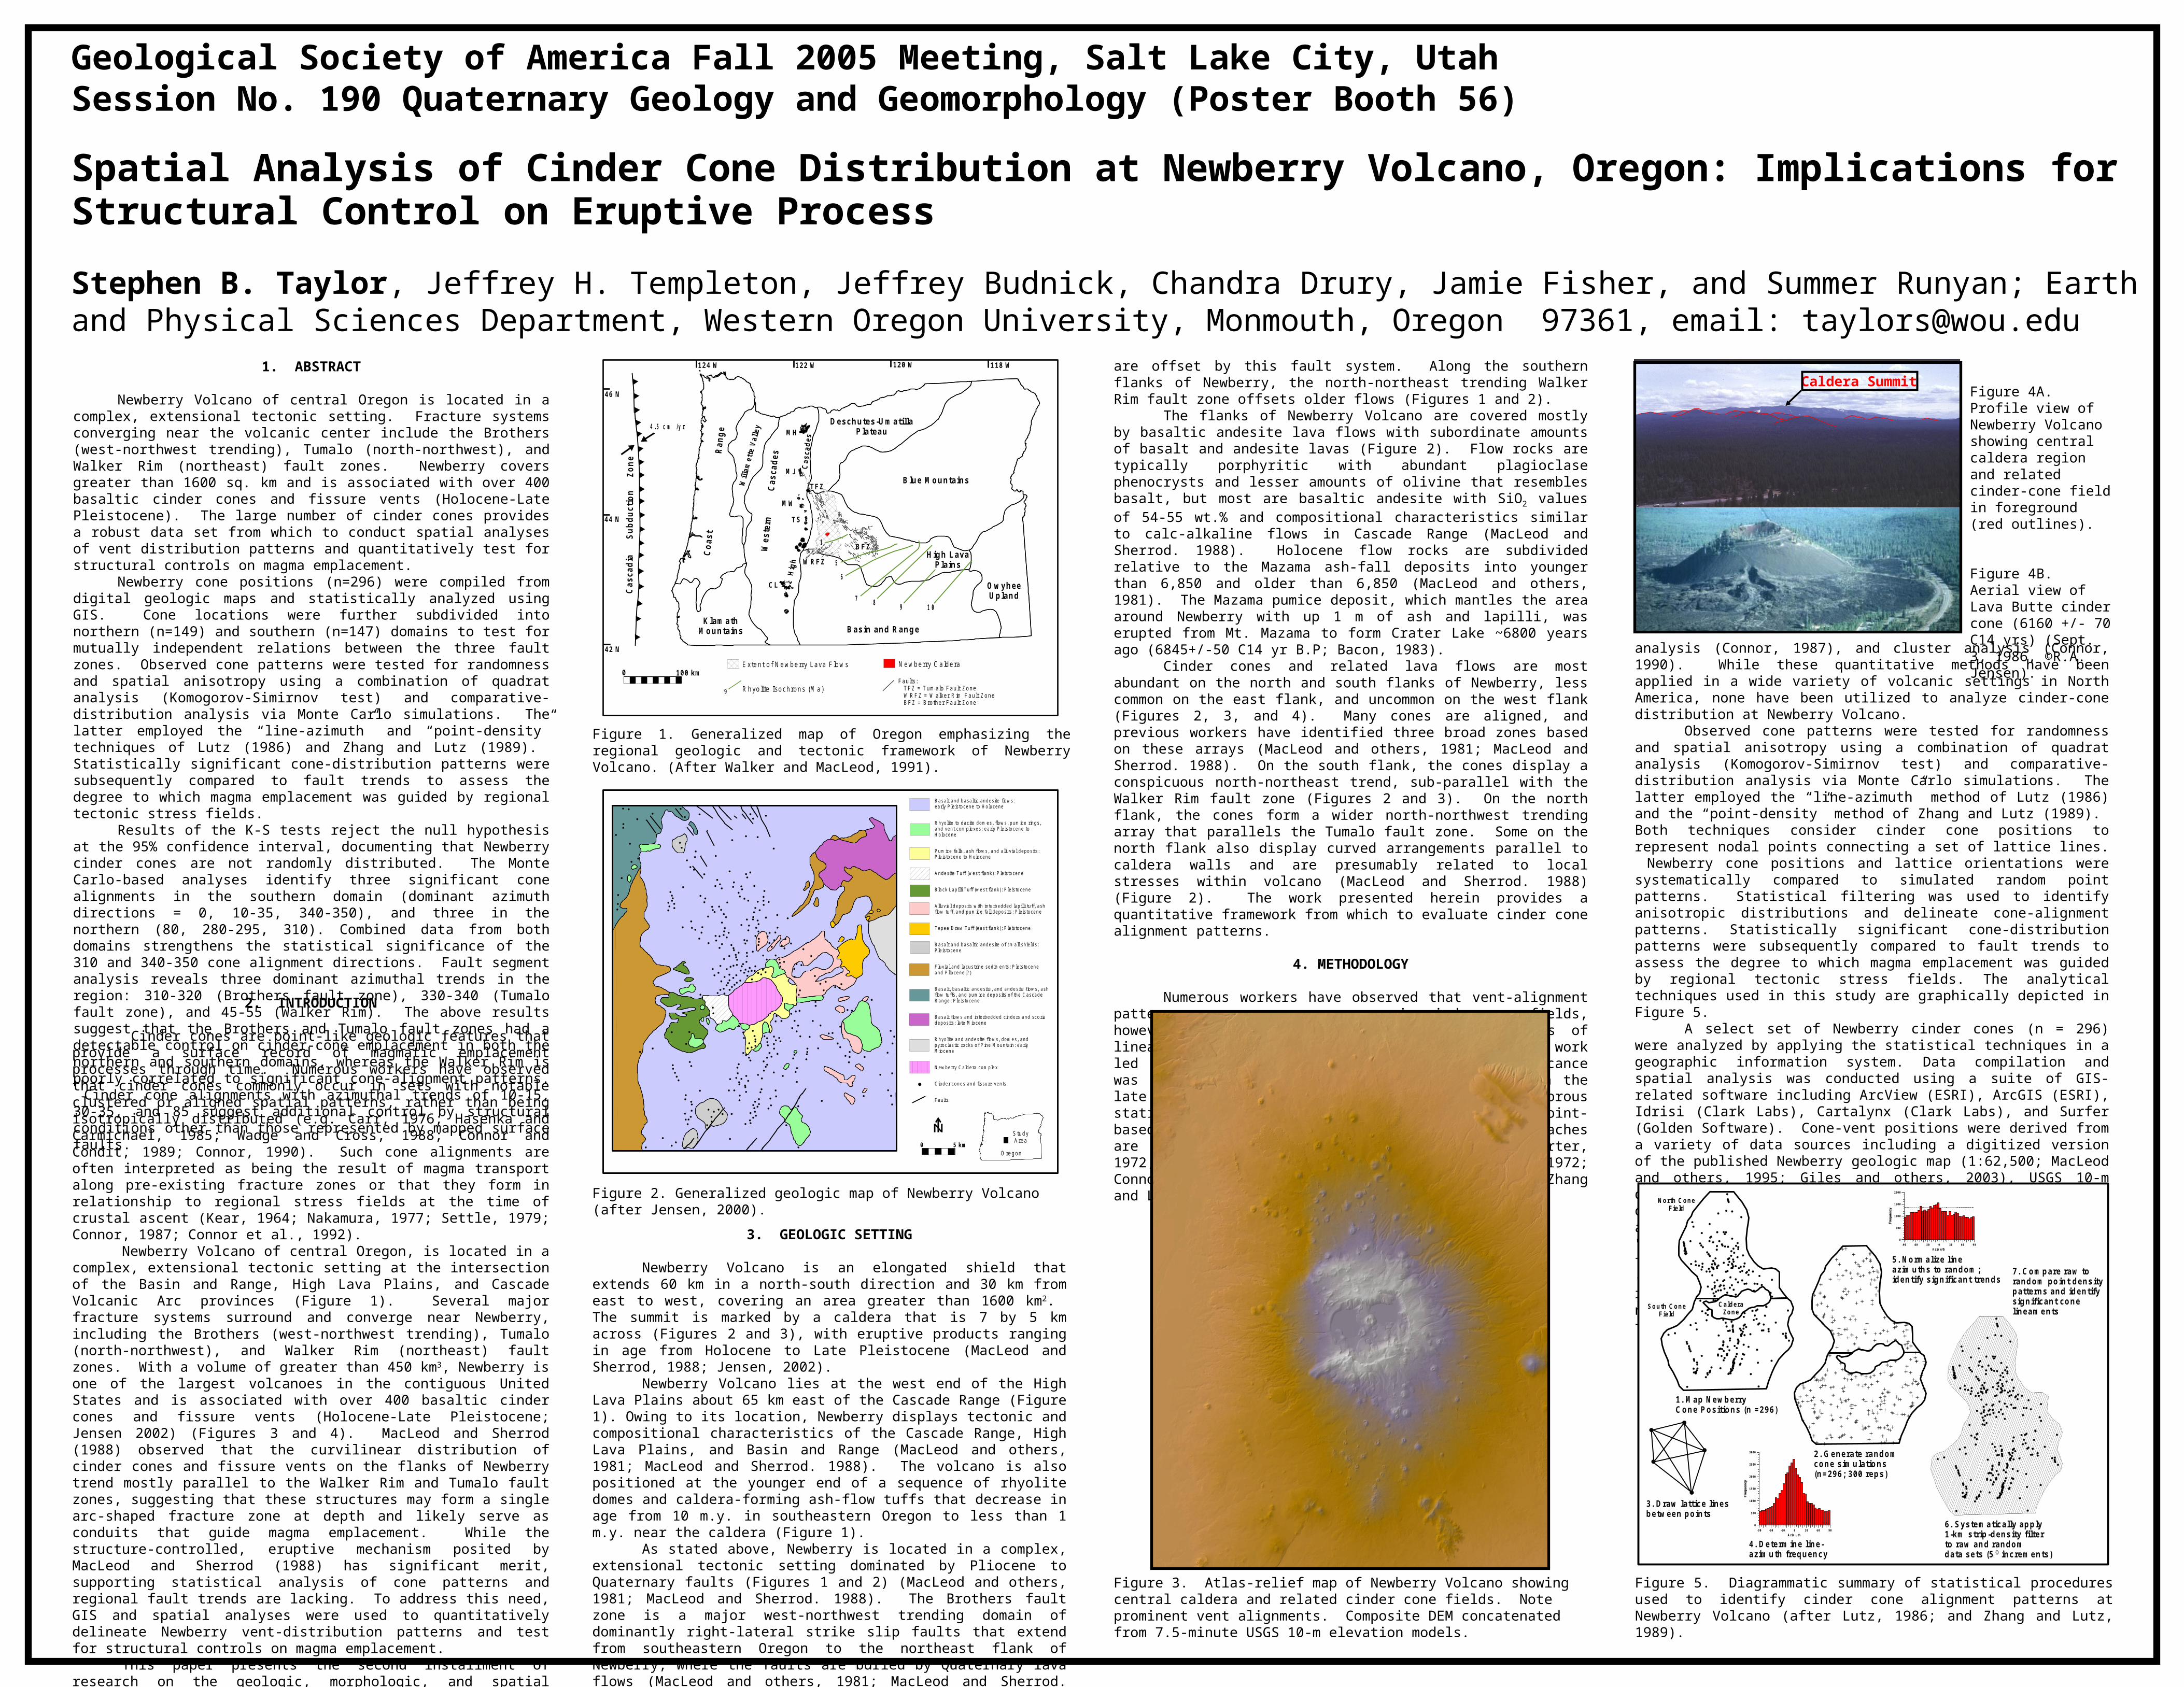
are offset by this fault system. Along the southern flanks of Newberry, the north-northeast trending Walker Rim fault zone offsets older flows (Figures 1 and 2).
The flanks of Newberry Volcano are covered mostly by basaltic andesite lava flows with subordinate amounts of basalt and andesite lavas (Figure 2). Flow rocks are typically porphyritic with abundant plagioclase phenocrysts and lesser amounts of olivine that resembles basalt, but most are basaltic andesite with SiO2 values of 54-55 wt.% and compositional characteristics similar to calc-alkaline flows in Cascade Range (MacLeod and Sherrod. 1988). Holocene flow rocks are subdivided relative to the Mazama ash-fall deposits into younger than 6,850 and older than 6,850 (MacLeod and others, 1981). The Mazama pumice deposit, which mantles the area around Newberry with up 1 m of ash and lapilli, was erupted from Mt. Mazama to form Crater Lake ~6800 years ago (6845+/-50 C14 yr B.P; Bacon, 1983).
Cinder cones and related lava flows are most abundant on the north and south flanks of Newberry, less common on the east flank, and uncommon on the west flank (Figures 2, 3, and 4). Many cones are aligned, and previous workers have identified three broad zones based on these arrays (MacLeod and others, 1981; MacLeod and Sherrod. 1988). On the south flank, the cones display a conspicuous north-northeast trend, sub-parallel with the Walker Rim fault zone (Figures 2 and 3). On the north flank, the cones form a wider north-northwest trending array that parallels the Tumalo fault zone. Some on the north flank also display curved arrangements parallel to caldera walls and are presumably related to local stresses within volcano (MacLeod and Sherrod. 1988) (Figure 2). The work presented herein provides a quantitative framework from which to evaluate cinder cone alignment patterns.
4. METHODOLOGY
Numerous workers have observed that vent-alignment patterns are a common occurrence in cinder cone fields, however early work was based on visual analysis of lineament patterns. The subjective nature of this work led to variable results and the geological significance was difficult to evaluate. Research activities in the late 1980’s focused on development of rigorous statistical procedures that could be applied to point-based analysis of cinder cone distributions. Approaches are varied and include univariate statistics (Porter, 1972; Settle, 1979) density mapping (Porter, 1972; Connor, 1987) Monte Carlo simulations (Lutz, 1986; Zhang and Lutz, 1989), fourier
Figure 2. Generalized geologic map of Newberry Volcano (after Jensen, 2000).
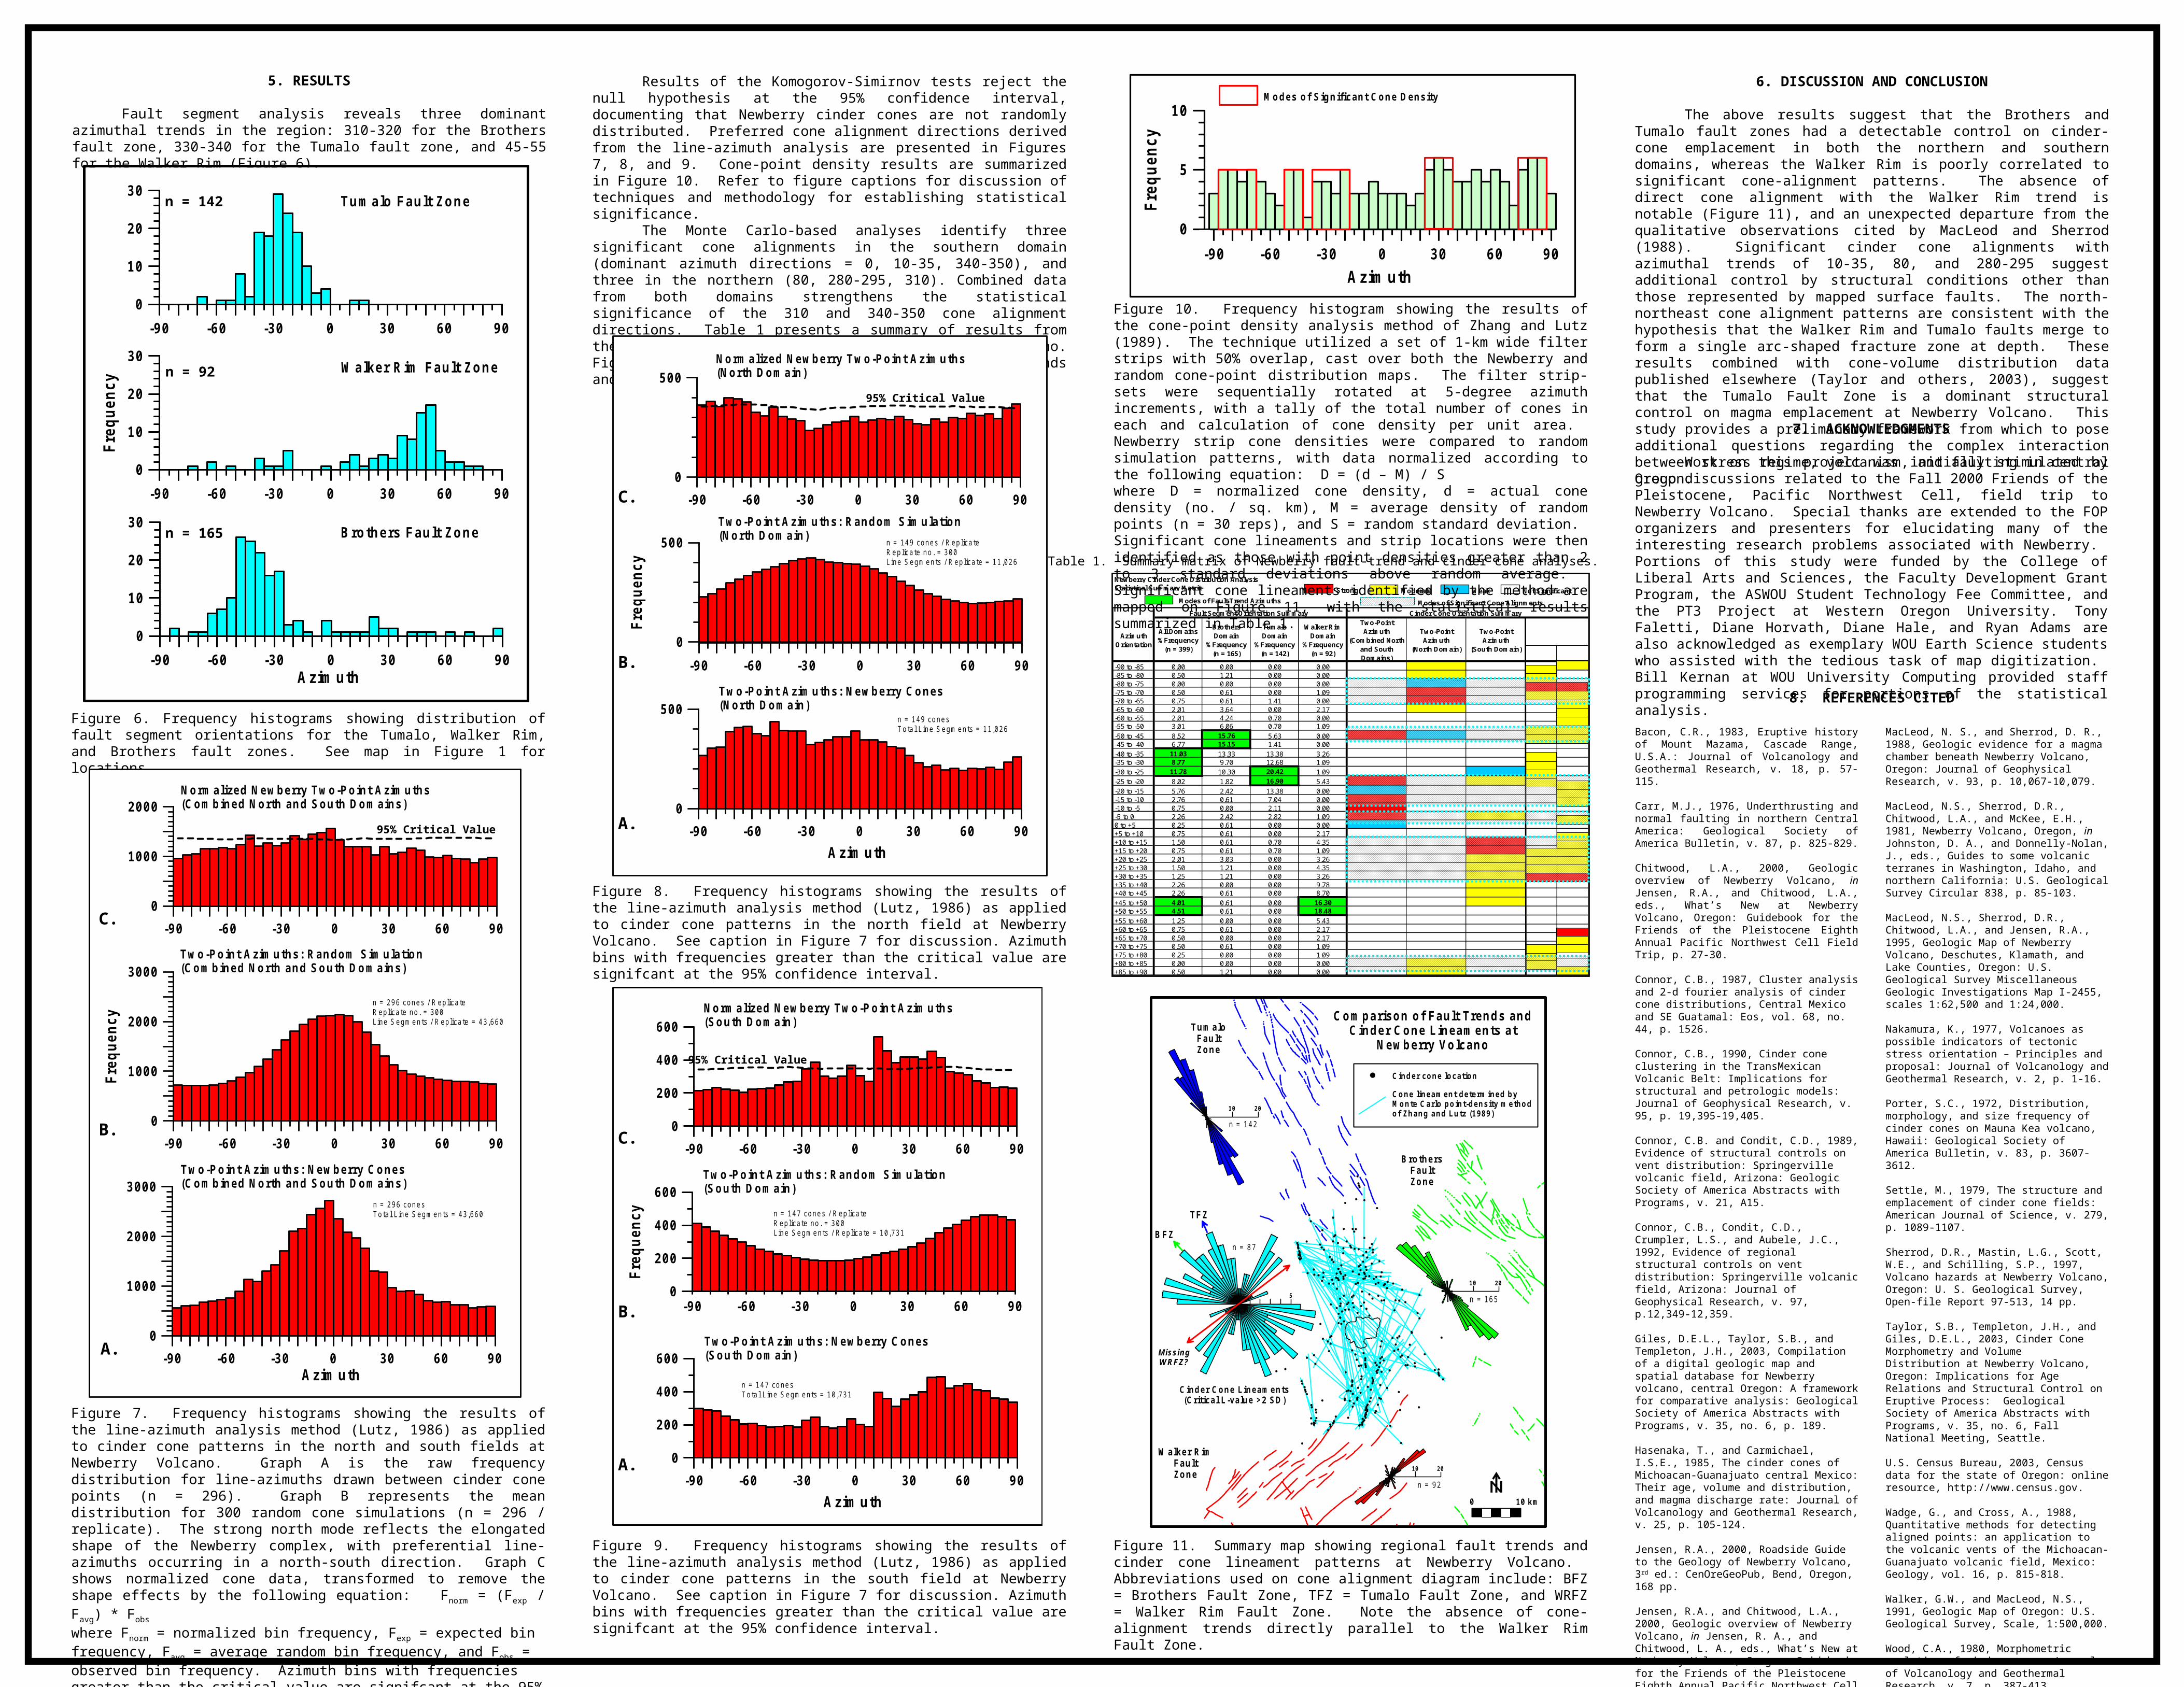
Figure 3. Atlas-relief map of Newberry Volcano showing central caldera and related cinder cone fields. Note prominent vent alignments. Composite DEM concatenated from 7.5-minute USGS 10-m elevation models.
Figure 4A. Profile view of Newberry Volcano showing central caldera region and related cinder-cone field in foreground (red outlines).
Figure 4B. Aerial view of Lava Butte cinder cone (6160 +/- 70 C14 yrs) (Sept. 3, 1986, ©R.A. Jensen).
7. Compare raw torandom point densitypatterns and identifysignificant conelineaments
2. Generate randomcone simulations (n=296; 300 reps)
North ConeField
South ConeField
1. Map NewberryCone Positions (n =296)
CalderaZone
-90 -60 -30 0 30 60 90
Azim uth
0
500
1000
1500
2000
2500
3000
4. Determine line-azimuth frequency
-90 -60 -30 0 30 60 90
Azim uth
0
500
1000
1500
2000
5. Normalize line azimuths to random; identify significant trends
3. Draw lattice linesbetween points
6. Systematically apply1-km strip-density filterto raw and randomdata sets (5 increments)o
Caldera Summit
Figure 5. Diagrammatic summary of statistical procedures used to identify cinder cone alignment patterns at Newberry Volcano (after Lutz, 1986; and Zhang and Lutz, 1989).
7. ACKNOWLEDGMENTS
Work on this project was initially stimulated by group discussions related to the Fall 2000 Friends of the Pleistocene, Pacific Northwest Cell, field trip to Newberry Volcano. Special thanks are extended to the FOP organizers and presenters for elucidating many of the interesting research problems associated with Newberry. Portions of this study were funded by the College of Liberal Arts and Sciences, the Faculty Development Grant Program, the ASWOU Student Technology Fee Committee, and the PT3 Project at Western Oregon University. Tony Faletti, Diane Horvath, Diane Hale, and Ryan Adams are also acknowledged as exemplary WOU Earth Science students who assisted with the tedious task of map digitization. Bill Kernan at WOU University Computing provided staff programming services for portions of the statistical analysis.
Bacon, C.R., 1983, Eruptive history of Mount Mazama, Cascade Range, U.S.A.: Journal of Volcanology and Geothermal Research, v. 18, p. 57-115.
Carr, M.J., 1976, Underthrusting and normal faulting in northern Central America: Geological Society of America Bulletin, v. 87, p. 825-829.
Chitwood, L.A., 2000, Geologic overview of Newberry Volcano, in Jensen, R.A., and Chitwood, L.A., eds., What’s New at Newberry Volcano, Oregon: Guidebook for the Friends of the Pleistocene Eighth Annual Pacific Northwest Cell Field Trip, p. 27-30.
Connor, C.B., 1987, Cluster analysis and 2-d fourier analysis of cinder cone distributions, Central Mexico and SE Guatamal: Eos, vol. 68, no. 44, p. 1526.
Connor, C.B., 1990, Cinder cone clustering in the TransMexican Volcanic Belt: Implications for structural and petrologic models: Journal of Geophysical Research, v. 95, p. 19,395-19,405.
Connor, C.B. and Condit, C.D., 1989, Evidence of structural controls on vent distribution: Springerville volcanic field, Arizona: Geologic Society of America Abstracts with Programs, v. 21, A15.
Connor, C.B., Condit, C.D., Crumpler, L.S., and Aubele, J.C., 1992, Evidence of regional structural controls on vent distribution: Springerville volcanic field, Arizona: Journal of Geophysical Research, v. 97, p.12,349-12,359.
Giles, D.E.L., Taylor, S.B., and Templeton, J.H., 2003, Compilation of a digital geologic map and spatial database for Newberry volcano, central Oregon: A framework for comparative analysis: Geological Society of America Abstracts with Programs, v. 35, no. 6, p. 189.
Hasenaka, T., and Carmichael, I.S.E., 1985, The cinder cones of Michoacan-Guanajuato central Mexico: Their age, volume and distribution, and magma discharge rate: Journal of Volcanology and Geothermal Research, v. 25, p. 105-124.
Jensen, R.A., 2000, Roadside Guide to the Geology of Newberry Volcano, 3rd ed.: CenOreGeoPub, Bend, Oregon, 168 pp.
Jensen, R.A., and Chitwood, L.A., 2000, Geologic overview of Newberry Volcano, in Jensen, R. A., and Chitwood, L. A., eds., What’s New at Newberry Volcano, Oregon: Guidebook for the Friends of the Pleistocene Eighth Annual Pacific Northwest Cell Field Trip, p. 27-30.
Kear, D., 1964, Volcanic alignments north and west of New Zealand’s central volcanic region: New Zealand Journal of Geology and Geophysics, v. 7, p. 24-44.
Lutz, T.M., 1986, An analysis of the orientations of large-scale crustal structures: a statistical approach based on areal distributions of pointlike features: Journal of Geophysical Research, vol. 91, no. B1, p. 421-434.
8. REFERENCES CITED
MacLeod, N. S., and Sherrod, D. R., 1988, Geologic evidence for a magma chamber beneath Newberry Volcano, Oregon: Journal of Geophysical Research, v. 93, p. 10,067-10,079.
MacLeod, N.S., Sherrod, D.R., Chitwood, L.A., and McKee, E.H., 1981, Newberry Volcano, Oregon, in Johnston, D. A., and Donnelly-Nolan, J., eds., Guides to some volcanic terranes in Washington, Idaho, and northern California: U.S. Geological Survey Circular 838, p. 85-103.
MacLeod, N.S., Sherrod, D.R., Chitwood, L.A., and Jensen, R.A., 1995, Geologic Map of Newberry Volcano, Deschutes, Klamath, and Lake Counties, Oregon: U.S. Geological Survey Miscellaneous Geologic Investigations Map I-2455, scales 1:62,500 and 1:24,000.
Nakamura, K., 1977, Volcanoes as possible indicators of tectonic stress orientation – Principles and proposal: Journal of Volcanology and Geothermal Research, v. 2, p. 1-16.
Porter, S.C., 1972, Distribution, morphology, and size frequency of cinder cones on Mauna Kea volcano, Hawaii: Geological Society of America Bulletin, v. 83, p. 3607-3612.
Settle, M., 1979, The structure and emplacement of cinder cone fields: American Journal of Science, v. 279, p. 1089-1107.
Sherrod, D.R., Mastin, L.G., Scott, W.E., and Schilling, S.P., 1997, Volcano hazards at Newberry Volcano, Oregon: U. S. Geological Survey, Open-file Report 97-513, 14 pp.
Taylor, S.B., Templeton, J.H., and Giles, D.E.L., 2003, Cinder Cone Morphometry and Volume Distribution at Newberry Volcano, Oregon: Implications for Age Relations and Structural Control on Eruptive Process: Geological Society of America Abstracts with Programs, v. 35, no. 6, Fall National Meeting, Seattle.
U.S. Census Bureau, 2003, Census data for the state of Oregon: online resource, http://www.census.gov.
Wadge, G., and Cross, A., 1988, Quantitative methods for detecting aligned points: an application to the volcanic vents of the Michoacan-Guanajuato volcanic field, Mexico: Geology, vol. 16, p. 815-818.
Walker, G.W., and MacLeod, N.S., 1991, Geologic Map of Oregon: U.S. Geological Survey, Scale, 1:500,000.
Wood, C.A., 1980, Morphometric evolution of cinder cones: Journal of Volcanology and Geothermal Research, v. 7, p. 387-413.
Zhang, D. and Lutz, T., 1989, Structural control of igneous complexes and kimberlites: a new statistical methoc: Tectonophysics, v. 159, p. 137-148.
5. RESULTS
Fault segment analysis reveals three dominant azimuthal trends in the region: 310-320 for the Brothers fault zone, 330-340 for the Tumalo fault zone, and 45-55 for the Walker Rim (Figure 6).
6. DISCUSSION AND CONCLUSION
The above results suggest that the Brothers and Tumalo fault zones had a detectable control on cinder-cone emplacement in both the northern and southern domains, whereas the Walker Rim is poorly correlated to significant cone-alignment patterns. The absence of direct cone alignment with the Walker Rim trend is notable (Figure 11), and an unexpected departure from the qualitative observations cited by MacLeod and Sherrod (1988). Significant cinder cone alignments with azimuthal trends of 10-35, 80, and 280-295 suggest additional control by structural conditions other than those represented by mapped surface faults. The north-northeast cone alignment patterns are consistent with the hypothesis that the Walker Rim and Tumalo faults merge to form a single arc-shaped fracture zone at depth. These results combined with cone-volume distribution data published elsewhere (Taylor and others, 2003), suggest that the Tumalo Fault Zone is a dominant structural control on magma emplacement at Newberry Volcano. This study provides a preliminary framework from which to pose additional questions regarding the complex interaction between stress regime, volcanism, and faulting in central Oregon.
0 10 km
TumaloFaultZone
BrothersFaultZone
10 20
n = 142
Comparison of Fault Trends andCinder Cone Lineaments at
Newberry Volcano
10 20
n = 92
10 20
n = 165
W alker RimFaultZone
Cinder cone location
Cone lineament determined byMonte Carlo point-density methodof Zhang and Lutz (1989)
TFZ
BFZ
MissingWRFZ?
Cinder Cone Lineaments(Critical L-value >2 SD)
n = 87
5
-90 -60 -30 0 30 60 90
Azim uth
0
5
10
Fre
qu
ency
Modes of Significant Cone Density
Newberry Cinder Cone Distribution AnalysisStatistical Summary Matrix
Fault Segment Orientation Summary Cinder Cone Orientation Summary
Azimuth Orientation
All Domains %Frequency
(n = 399)
Brothers Domain
%Frequency (n = 165)
Tumalo Domain
%Frequency (n = 142)
Walker Rim Domain
%Frequency (n = 92)
Two-Point Azimuth
(Combined North and South Domains)
Two-Point Azimuth
(North Domain)
Two-Point Azimuth
(South Domain)
-90 to -85 0.00 0.00 0.00 0.00-85 to -80 0.50 1.21 0.00 0.00-80 to -75 0.00 0.00 0.00 0.00-75 to -70 0.50 0.61 0.00 1.09-70 to -65 0.75 0.61 1.41 0.00-65 to -60 2.01 3.64 0.00 2.17-60 to -55 2.01 4.24 0.70 0.00-55 to -50 3.01 6.06 0.70 1.09
-50 to -45 8.52 15.76 5.63 0.00-45 to -40 6.77 15.15 1.41 0.00
-40 to -35 11.03 13.33 13.38 3.26-35 to -30 8.77 9.70 12.68 1.09-30 to -25 11.78 10.30 20.42 1.09-25 to -20 8.02 1.82 16.90 5.43
-20 to -15 5.76 2.42 13.38 0.00-15 to -10 2.76 0.61 7.04 0.00-10 to -5 0.75 0.00 2.11 0.00-5 to 0 2.26 2.42 2.82 1.090 to +5 0.25 0.61 0.00 0.00+5 to +10 0.75 0.61 0.00 2.17+10 to +15 1.50 0.61 0.70 4.35+15 to +20 0.75 0.61 0.70 1.09+20 to +25 2.01 3.03 0.00 3.26+25 to +30 1.50 1.21 0.00 4.35+30 to +35 1.25 1.21 0.00 3.26+35 to +40 2.26 0.00 0.00 9.78+40 to +45 2.26 0.61 0.00 8.70
+45 to +50 4.01 0.61 0.00 16.30+50 to +55 4.51 0.61 0.00 18.48
+55 to +60 1.25 0.00 0.00 5.43+60 to +65 0.75 0.61 0.00 2.17+65 to +70 0.50 0.00 0.00 2.17+70 to +75 0.50 0.61 0.00 1.09+75 to +80 0.25 0.00 0.00 1.09+80 to +85 0.00 0.00 0.00 0.00+85 to +90 0.50 1.21 0.00 0.00
Strong Moderate Weak Not Significant
Modes of Fault Trend Azimuths
Statistical Significance of Cinder Cone Alignments
Cone-PointDensity Analysis
(North and South)
>2 S.D. >3 S.D.
Modes of Significant Cone Alignments
Figure 7. Frequency histograms showing the results of the line-azimuth analysis method (Lutz, 1986) as applied to cinder cone patterns in the north and south fields at Newberry Volcano. Graph A is the raw frequency distribution for line-azimuths drawn between cinder cone points (n = 296). Graph B represents the mean distribution for 300 random cone simulations (n = 296 / replicate). The strong north mode reflects the elongated shape of the Newberry complex, with preferential line-azimuths occurring in a north-south direction. Graph C shows normalized cone data, transformed to remove the shape effects by the following equation: Fnorm = (Fexp / Favg) * Fobs where Fnorm = normalized bin frequency, Fexp = expected bin frequency, Favg = average random bin frequency, and Fobs = observed bin frequency. Azimuth bins with frequencies greater than the critical value are signifcant at the 95% confidence interval.
Results of the Komogorov-Simirnov tests reject the null hypothesis at the 95% confidence interval, documenting that Newberry cinder cones are not randomly distributed. Preferred cone alignment directions derived from the line-azimuth analysis are presented in Figures 7, 8, and 9. Cone-point density results are summarized in Figure 10. Refer to figure captions for discussion of techniques and methodology for establishing statistical significance.
The Monte Carlo-based analyses identify three significant cone alignments in the southern domain (dominant azimuth directions = 0, 10-35, 340-350), and three in the northern (80, 280-295, 310). Combined data from both domains strengthens the statistical significance of the 310 and 340-350 cone alignment directions. Table 1 presents a summary of results from the fault and cone trend analyses at Newberry Volcano. Figure 11 is a summary map showing regional fault trends and cinder cone lineament patterns at Newberry Volcano.
-90 -60 -30 0 30 60 90
0
10
20
30
-90 -60 -30 0 30 60 90Azim uth
0
10
20
30
-90 -60 -30 0 30 60 90
0
10
20
30
Fre
qu
ency
Brothers Fault Zone
Tumalo Fault Zone
W alker Rim Fault Zone
n = 142
n = 92
n = 165
Figure 6. Frequency histograms showing distribution of fault segment orientations for the Tumalo, Walker Rim, and Brothers fault zones. See map in Figure 1 for locations.
Figure 8. Frequency histograms showing the results of the line-azimuth analysis method (Lutz, 1986) as applied to cinder cone patterns in the north field at Newberry Volcano. See caption in Figure 7 for discussion. Azimuth bins with frequencies greater than the critical value are signifcant at the 95% confidence interval.
-90 -60 -30 0 30 60 90Azim uth
0
1000
2000
3000
-90 -60 -30 0 30 60 90
0
1000
2000
-90 -60 -30 0 30 60 90
0
1000
2000
3000
Fre
qu
ency
Two-Point Azimuths: Newberry Cones(Combined North and South Domains)
Two-Point Azimuths: Random Simulation(Combined North and South Domains)
n = 296 conesTota l L ine Segm ents = 43,660
n = 296 cones / R ep lica teR eplicate no. = 300Line Segm ents / R ep licate = 43,660
Normalized Newberry Two-Point Azimuths(Combined North and South Domains)
A.
B.
C.
95% Critical Value
-90 -60 -30 0 30 60 90
0
200
400
600
-90 -60 -30 0 30 60 90
Azim uth
0
200
400
600
-90 -60 -30 0 30 60 900
200
400
600
Fre
qu
ency
Two-Point Azimuths: Newberry Cones(South Domain)
Two-Point Azimuths: Random Simulation(South Domain)
n = 147 conesTota l L ine Segm ents = 10,731
n = 147 cones / R ep lica teR eplicate no. = 300Line Segm ents / R ep licate = 10,731
Normalized Newberry Two-Point Azimuths(South Domain)
A.
B.
C.
95% Critical Value
Two-Point Azimuths: Newberry Cones(North Domain)
Two-Point Azimuths: Random Simulation(North Domain)
n = 149 conesTota l L ine Segm ents = 11,026
n = 149 cones / R ep licateR eplicate no. = 300Line Segm ents / R ep licate = 11,026
Normalized Newberry Two-Point Azimuths(North Domain)
-90 -60 -30 0 30 60 90
Azim uth
0
500
-90 -60 -30 0 30 60 90
0
500
Fre
qu
ency
-90 -60 -30 0 30 60 90
0
500
A.
B.
C.
95% Critical Value
Figure 9. Frequency histograms showing the results of the line-azimuth analysis method (Lutz, 1986) as applied to cinder cone patterns in the south field at Newberry Volcano. See caption in Figure 7 for discussion. Azimuth bins with frequencies greater than the critical value are signifcant at the 95% confidence interval.
Figure 10. Frequency histogram showing the results of the cone-point density analysis method of Zhang and Lutz (1989). The technique utilized a set of 1-km wide filter strips with 50% overlap, cast over both the Newberry and random cone-point distribution maps. The filter strip-sets were sequentially rotated at 5-degree azimuth increments, with a tally of the total number of cones in each and calculation of cone density per unit area. Newberry strip cone densities were compared to random simulation patterns, with data normalized according to the following equation: D = (d – M) / S where D = normalized cone density, d = actual cone density (no. / sq. km), M = average density of random points (n = 30 reps), and S = random standard deviation. Significant cone lineaments and strip locations were then identified as those with point densities greater than 2 to 3 standard deviations above random average. Significant cone lineaments identified by the method are mapped on Figure 11, with the statistical results summarized in Table 1.
Figure 11. Summary map showing regional fault trends and cinder cone lineament patterns at Newberry Volcano. Abbreviations used on cone alignment diagram include: BFZ = Brothers Fault Zone, TFZ = Tumalo Fault Zone, and WRFZ = Walker Rim Fault Zone. Note the absence of cone-alignment trends directly parallel to the Walker Rim Fault Zone.
Table 1. Summary matrix of Newberry fault-trend and cinder cone analyses.