Embed Size (px)
Citation preview

11
AAE 451 Senior Aircraft Design Spring 2006AAE 451 Senior Aircraft Design Spring 2006Systems Definition ReviewSystems Definition Review
Group VIGroup VI
Team Members:Team Members:
John CollinsJohn CollinsChad DavisChad DavisChris FlesChris Fles
Danny Sze Ling LimDanny Sze Ling LimJustin RohdeJustin RohdeRyan SchulzRyan SchulzRonald WongRonald Wong
Yusaku YamashitaYusaku Yamashita

22
Market ReviewMarket Review Target is business market: Target is business market:
• Corporate Flight DepartmentsCorporate Flight Departments• Air Taxi and Air CharterAir Taxi and Air Charter• Fractional SharesFractional Shares
Profit OpportunitiesProfit Opportunities• Air taxi, fractional ownership expected to more than Air taxi, fractional ownership expected to more than
double in coming decadedouble in coming decade• Increasing incentive for use by small businessIncreasing incentive for use by small business• Strong business aviation growth expected in European Strong business aviation growth expected in European
and Asian markets over next 20 yearsand Asian markets over next 20 years

33
Design RequirementsDesign Requirements Cabin Capacity - 2 Crew + 6 PassengersCabin Capacity - 2 Crew + 6 Passengers Cruise Range - 600 nmCruise Range - 600 nm Cruise Speed - 250 ktsCruise Speed - 250 kts T.O./Landing Distance - 2,100 ftT.O./Landing Distance - 2,100 ft Acquisition Cost - $1.8 MillionAcquisition Cost - $1.8 Million D.O.C./Hour - $550D.O.C./Hour - $550
Taxi
Take-off 2100 ft. Runway
Climb
Economy Cruise
Descend for Landing
600 nm range Reserve
Economy Cruise
Execute Missed Landing Land 2100 ft. Runway
Begin Landing
Pilots (150 lbs. each)Pilots (150 lbs. each) Passengers (200 lbs. each)Passengers (200 lbs. each) 1500 lbs. Total Payload1500 lbs. Total Payload

44
Trade StudyTrade Study
400 450 500 550 600 650 700 750 800400
450
500
550
600
650
700
0.3 SFC
0.4 SFC
0.5 SFC
0.6 SFC
0.7 SFC
0.8 SFC
Range (nm)
Dol
lars
/Hou
r
Jet - Trade Study (Range and SFC)
400 450 500 550 600 650 700 750 800300
310
320
330
340
350
360
0.3 SFC
0.4 SFC
0.5 SFC
0.6 SFC
0.7 SFC
0.8 SFC
Range (nm)
Dol
lars
/Hou
r
Turboprop - Trade Study (Range and SFC)
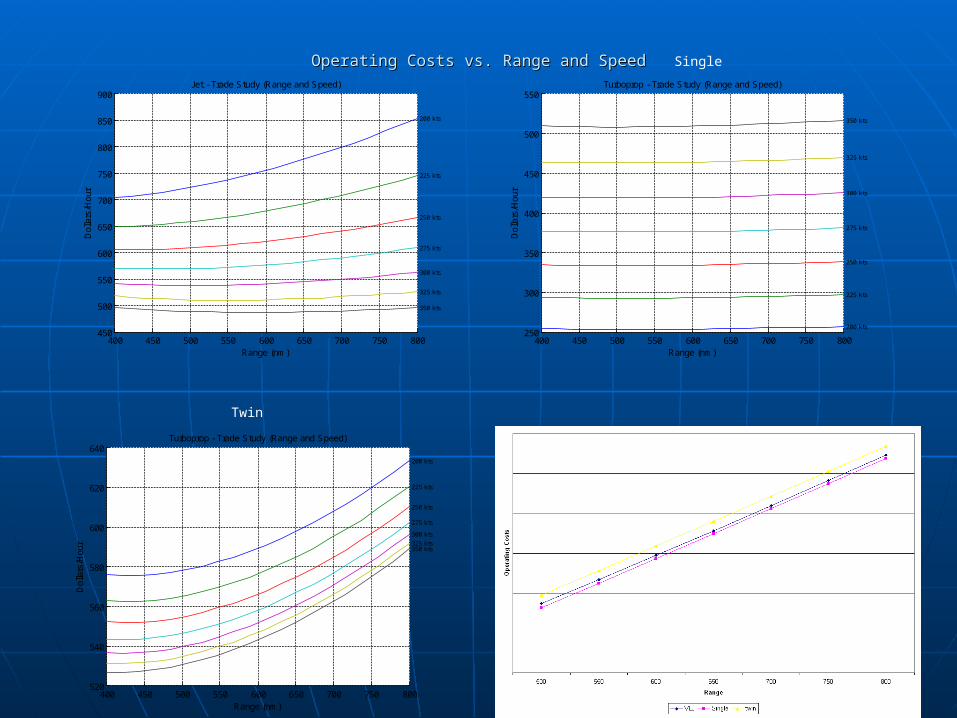
Jet and single turboprop operating costs beat twin turbopropsJet and single turboprop operating costs beat twin turboprops• D.O.C./Hour: Single - $350, Jet - $550, Twin - $700D.O.C./Hour: Single - $350, Jet - $550, Twin - $700
Operating costs vary with SFC, Range, and SpeedOperating costs vary with SFC, Range, and Speed• SFC’s above 0.7 (1/hr) make D.O.C. higher than competitionSFC’s above 0.7 (1/hr) make D.O.C. higher than competition• Optimal Speeds: Jet – 350 kts, Props – 250 ktsOptimal Speeds: Jet – 350 kts, Props – 250 kts
Acquisition costs:Acquisition costs:• Jet - $1.844 millionJet - $1.844 million• Single - $1.668 millionSingle - $1.668 million

55
Pugh’s MethodPugh’s MethodAIM:
• Brainstorm ideas
• Gather concepts and compare against criteria relating to the acquisition and operating costs
Criteria:
- Lower limit set to meet the design requirements
- Concepts can better this limit if they work at a higher efficiency
- Rate the efficiency of each system in achieving this target (+/s/-)

66
The ProcessThe Process
Examples of Criteria:
- Twins burn more fuel than singles
- Jets are quieter than turboprops
- Canards have higher development costs

77
Pugh’s Method – contd.Pugh’s Method – contd.

88
Concept #1Concept #1
• Single tractor-engine• Low wing• Mid tail• Vertical Stabilizer• Tricycle landing gear• Performance
• Cruise Speed – 250 kts
• Gross Weight – 6,790 lbs
• Acquisition Cost - $1.65 Million
• D.O.C./Hour - $330
• W/S – 32 lb/ft2
• T/W – 0.155

99
Concept #13Concept #13
• Twin pusher-engines• Low wing, w/ winglets• High tail• Vertical Stabilizer• Tricycle landing gear• Performance
• Cruise Speed – 350 kts
• Gross Weight – 9,500 lbs
• Acquisition Cost - $1.85 Million
• D.O.C./Hour - $550
• W/S – 40 lb/ft2
• T/W – 0.20

1010
Concept #15Concept #15
• Single pusher-engine• Low wing, w/ winglets• Canards-configuration• Vertical Stabilizer• Tricycle landing gear• Performance
• Cruise Speed – 250 kts
• Gross Weight – 6,800 lbs
• Acquisition Cost - $1.65 Million
• D.O.C./Hour - $330
• W/S – 35 lb/ft2
• T/W – 0.155

1111
Preliminary Fuselage LayoutPreliminary Fuselage Layout

1212
Preliminary Fuselage LayoutPreliminary Fuselage Layout

1313
Cabin ViewCabin View

1414
Competitors Competitors

1515
Powerplant OptionsPowerplant Options
TurbopropTurboprop Biodiesel (Blends), or BioJet Fuel (JP-8 replacement)Biodiesel (Blends), or BioJet Fuel (JP-8 replacement) TSFC = 0.5671 (lbm/hr)/lbfTSFC = 0.5671 (lbm/hr)/lbf
TurbofanTurbofan Biodiesel (Blends), or BioJet Fuel (JP-8 replacement)Biodiesel (Blends), or BioJet Fuel (JP-8 replacement) TSFC = 0.7023 (lbm/hr)/lbfTSFC = 0.7023 (lbm/hr)/lbf
Model – ONX (Parametric Cycle Analysis)Model – ONX (Parametric Cycle Analysis)

1616
Alternative Fuel OptionsAlternative Fuel Options

1717
Constraint DiagramsConstraint Diagrams Performance ConstraintsPerformance Constraints
• Cruise SpeedCruise Speed• Takeoff and Landing DistanceTakeoff and Landing Distance• Minimum Power CruiseMinimum Power Cruise• Maximum Cruise RangeMaximum Cruise Range
Assumptions: Assumptions: • Typical values from Raymer: CTypical values from Raymer: CD0D0, C, CL,maxL,max, e, e• Propeller efficiency Propeller efficiency ηη==0.8 0.8 • Thrust decrease is directly proportional to Thrust decrease is directly proportional to
decrease of density with altitude decrease of density with altitude
1818
Constraint DiagramsConstraint Diagrams
* Maximum Range, Minimum Power not shown - located far outside design space
0 10 20 30 40 50 60 700
0.05
0.1
0.15
0.2
0.25
0.3
0.35
0.4
0.45
0.5Constraint Analysis - Single Turboprop
W/S Wing Loading (lb/f t 2)
T/W
- T
hrus
t to
Wei
ght
Rat
io
Take-Off
Cruise SpeedCruise Altitude
Landing
0 10 20 30 40 50 60 700
0.05
0.1
0.15
0.2
0.25
0.3
0.35
0.4
0.45
0.5Constraint Analysis - Twin Turbofan
W/S Wing Loading (lb/f t 2)
T/W
- T
hrus
t to
Wei
ght
Rat
io
Take-Off
Cruise SpeedCruise Altitude
Landing

1919
Competing AircraftCompeting Aircraft
Acquisition CostAcquisition Cost• Baron G58 - $1.22 MBaron G58 - $1.22 M• Piper Mirage - $0.97 MPiper Mirage - $0.97 M• Adam A700 - $2.25 MAdam A700 - $2.25 M• Adam A500 - $1.25 MAdam A500 - $1.25 M• Eclipse 500 - $1.50 MEclipse 500 - $1.50 M• Cessna Mustang - $2.35 MCessna Mustang - $2.35 M• Pilatus PC-12 - $2.80 MPilatus PC-12 - $2.80 M
D.O.C./HourD.O.C./Hour• Baron G58 - $288Baron G58 - $288• Piper Mirage - $250Piper Mirage - $250• Adam A700 - $725Adam A700 - $725• Adam A500 - $450Adam A500 - $450• Eclipse 500 - $300*Eclipse 500 - $300*• Cessna Mustang - $450Cessna Mustang - $450• Pilatus PC-12 - $400Pilatus PC-12 - $400
*Estimate from Eclipse Aviation

2020
QuestionsQuestions

2121

2222
Reminder SlideReminder Slide singles cost less than twins for given sfc; jets are comparable to singles cost less than twins for given sfc; jets are comparable to
tprops for given sfc. tprops for given sfc. For sfc increase from 0.5 onwards, singles (+$20/hr); then jets (+For sfc increase from 0.5 onwards, singles (+$20/hr); then jets (+
$50/hr); then twins (+$100/hr)$50/hr); then twins (+$100/hr)
for the same range: singles burn less fuel than twins for same for the same range: singles burn less fuel than twins for same speed (240kts) speed (240kts)
jets are slightly better than twin tprops, same as single tprops, jets are slightly better than twin tprops, same as single tprops, canards give less dragcanards give less drag
jets have smaller cabin sizes according to tom: Avbuyer jets have smaller cabin sizes according to tom: Avbuyer 4.8x4.8 (eclipse = 4.2x4.3); turboprops: adam a500 4.8x4.8 (eclipse = 4.2x4.3); turboprops: adam a500 (4.5x4.3)(4.5x4.3)

2323
Iteration 2Iteration 2

2424
GTOW vs. Range and SpeedGTOW vs. Range and Speed
400 450 500 550 600 650 700 750 8008500
9000
9500
10000
10500
11000
11500
12000
12500
13000
13500
200 kts
225 kts
250 kts
275 kts
300 kts
325 kts
350 kts
Range (nm)
Gro
ss W
eigh
t (lb
s)Jet - Trade Study (Range and Speed)
400 450 500 550 600 650 700 750 8005200
5700
6200
6700
5200
5700
6200
6700
5200
5700
200 kts
225 kts
250 kts
275 kts
300 kts
325 kts
350 kts
Range (nm)
Gro
ss W
eigh
t (lb
s)
Turboprop - Trade Study (Range and Speed)
400 450 500 550 600 650 700 750 8008000
8500
9000
9500
10000
10500
11000
11500
200 kts
225 kts
250 kts
275 kts
300 kts
325 kts
350 kts
Range (nm)
Gro
ss W
eigh
t (lb
s)
Turboprop - Trade Study (Range and Speed)
Single
Twin

2525
GTOW vs. Range and L/DGTOW vs. Range and L/D
400 450 500 550 600 650 700 750 8008000
8500
9000
9500
10000
10500
11000
11500
12000
12500 10.0 L/D
max
12.5 L/Dmax
15.0 L/Dmax
17.5 L/Dmax
Range (nm)
Gro
ss W
eigh
t (lb
s)
Jet - Trade Study (Range and L/Dmax
)
400 450 500 550 600 650 700 750 8005000
5500
6000
6500
7000
7500
8000
8500
9000 10.0 L/Dmax
12.5 L/Dmax
15.0 L/Dmax
17.5 L/Dmax
Range (nm)
Gro
ss W
eigh
t (lb
s)
Turboprop - Trade Study (Range and L/Dmax
)
400 450 500 550 600 650 700 750 8008000
8500
9000
9500
10000
10500
11000
11500
12000
10.0 L/Dmax
12.5 L/Dmax
15.0 L/Dmax
17.5 L/Dmax
Range (nm)
Gro
ss W
eigh
t (lb
s)
Turboprop - Trade Study (Range and L/Dmax
)
Single
Twin

2626
GTOW vs. Range and SFCGTOW vs. Range and SFC
400 450 500 550 600 650 700 750 8008000
8500
9000
9500
10000
10500
11000
11500
12000
12500
0.3 SFC
0.4 SFC
0.5 SFC
0.6 SFC
0.7 SFC
0.8 SFC
Range (nm)
Gro
ss W
eigh
t (lb
s)Jet - Trade Study (Range and SFC)
400 450 500 550 600 650 700 750 8004500
5000
5500
6000
6500
7000
7500
8000
8500
9000
0.3 SFC
0.4 SFC
0.5 SFC
0.6 SFC
0.7 SFC
0.8 SFC
Range (nm)
Gro
ss W
eigh
t (lb
s)
Turboprop - Trade Study (Range and SFC)
400 450 500 550 600 650 700 750 8007000
7500
8000
8500
9000
9500
10000
10500
11000
0.3 SFC
0.4 SFC
0.5 SFC
0.6 SFC
0.7 SFC
0.8 SFC
Range (nm)
Gro
ss W
eigh
t (lb
s)
Turboprop - Trade Study (Range and SFC)
Single
Twin
2727
Operating Costs vs. Range and SpeedOperating Costs vs. Range and Speed
400 450 500 550 600 650 700 750 800450
500
550
600
650
700
750
800
850
900
200 kts
225 kts
250 kts
275 kts
300 kts
325 kts
350 kts
Range (nm)
Dol
lars
/Hou
rJet - Trade Study (Range and Speed)
400 450 500 550 600 650 700 750 800250
300
350
400
450
500
550
200 kts
225 kts
250 kts
275 kts
300 kts
325 kts
350 kts
Range (nm)
Dol
lars
/Hou
r
Turboprop - Trade Study (Range and Speed)
400 450 500 550 600 650 700 750 800520
540
560
580
600
620
640 200 kts
225 kts
250 kts
275 kts
300 kts
325 kts 350 kts
Range (nm)
Dol
lars
/Hou
r
Turboprop - Trade Study (Range and Speed)
Single
Twin

2828
Operating Costs vs. Range and SFCOperating Costs vs. Range and SFC
400 450 500 550 600 650 700 750 800400
450
500
550
600
650
700
0.3 SFC
0.4 SFC
0.5 SFC
0.6 SFC
0.7 SFC
0.8 SFC
Range (nm)
Dol
lars
/Hou
rJet - Trade Study (Range and SFC)
400 450 500 550 600 650 700 750 800300
310
320
330
340
350
360
0.3 SFC
0.4 SFC
0.5 SFC
0.6 SFC
0.7 SFC
0.8 SFC
Range (nm)
Dol
lars
/Hou
r
Turboprop - Trade Study (Range and SFC)
400 450 500 550 600 650 700 750 800400
500
600
700
800
900
1000
0.3 SFC
0.4 SFC
0.5 SFC
0.6 SFC
0.7 SFC
0.8 SFC
Range (nm)
Dol
lars
/Hou
r
Turboprop - Trade Study (Range and SFC)
Single
Twin


![SemiconductorDevicePhysics_4pt3 [Sze]](https://img.pdfslide.us/doc/110x75/553d7f8c550346792d8b4699/semiconductordevicephysics4pt3-sze.jpg)