Embed Size (px)
Citation preview
1
AAAA
ABAB
ACAC
ADAD
AEAE
AFAF
AGAG
AHAH
001001 002002 003003 004004 005005 006006 007007 008008 009009
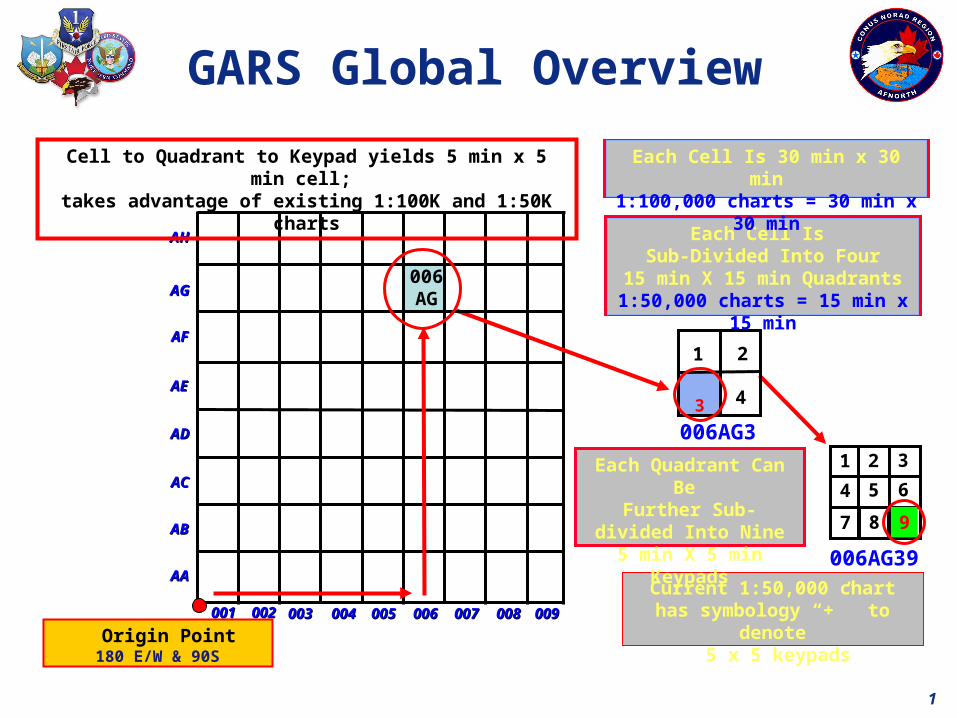
006AG39
006AG31 2 3
4 5 6
7 8 9
3
1 2
4
Origin Point180 E/W & 90S
006AG
Cell to Quadrant to Keypad yields 5 min x 5 min cell; takes advantage of existing 1:100K and 1:50K charts
Current 1:50,000 chart has symbology “+” to denote
5 x 5 keypads
Each Quadrant Can Be Further Sub-divided
Into Nine 5 min X 5 minKeypads
Each Cell Is Sub-Divided Into Four
15 min X 15 min Quadrants1:50,000 charts = 15 min x 15 min
GARS Global Overview
Each Cell Is 30 min x 30 min1:100,000 charts = 30 min x 30 min
3
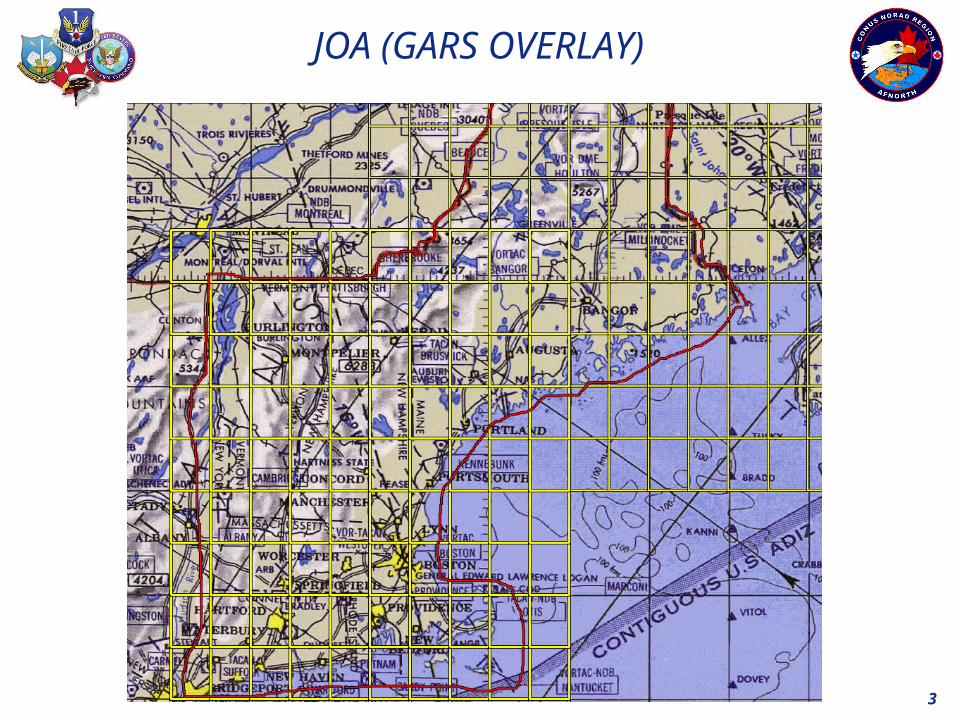
JOA (GARS OVERLAY)

4
GARS for CT, RI, MA

5
N 1 N 2 N 3 N 4 N 5 N 6 N 7 N 8
E 1
E 2
E 3
S 8S 7S 6S 5S 4S 3S 2S 1
W 1
W 2
W 3

6