Embed Size (px)
Citation preview

1
A Traffic Characterization of Popular On-lineGames
Wu-chang Feng Francis Chang Wu-chi Feng Jonathan Walpole
Department of Computer SciencePortland State University
Abstract— This paper describes the results of the first compre-hensive analysis of a range of popular on-line, multi-player, gameservers. The results show that the traffic behavior of these serversis highly predictable and can be attributed to the fact that currentgame designs target the saturation of the narrowest, last-mile link.Specifically, in order to maximize the interactivity of the game itselfand to provide relatively uniform experiences between players play-ing over different network speeds, on-line games typically fix theirusage requirements in such a way as to saturate the network linkof their lowest speed players. While the traffic observed is highlypredictable, the traces also indicate that these on-line games pro-vide significant challenges to current network infrastructure. As aresult of synchronous game logic requiring an extreme amount ofinteractivity, a close look at the trace reveals the presence of large,highly periodic, bursts of small packets. With such stringent de-mands on interactivity, routers must be designed with enough ca-pacity to quickly route such bursts without delay.
I. I NTRODUCTION
Due to the confluence of advances in graphics hard-ware, network bandwidth on the backbone and to thehome, client and server hardware, and innovative softwaregame design, on-line interactive games across all medi-ums has seen explosive growth. Forrester Research esti-mates that in 2001, there were 18 million on-line gamers.Recent measurement studies have shown that this is con-sistent with the observed growth in gaming traffic as In-ternet games now account for a growing fraction of theaggregate load [1].
With the launches of Microsoft’s Xbox on-line gamenetwork and Sony’s Playstation 2 on-line game network,along with the development of emerging massively multi-player on-line games that allow for thousands of simulta-neous players, it is clear that gaming traffic will soon growto scales far beyond what is being observed today. Whilenot indicative of all on-line games, the class of gamesknown as “first-person shooters” has clearly dominated
This material is based upon work supported by the National ScienceFoundation under Grant EIA-0130344 and the generous donations ofIntel Corporation. Any opinions, findings, and conclusions or recom-mendations expressed in this material are those of the author(s) and donot necessarily reflect the views of the National Science Foundation orIntel.
much of the observed gaming traffic [1]. With a largelist of popular games such as Doom, Quake, Descent,Duke Nukem 3D, Half-Life, Counter-Strike, Unreal Tour-nament, Tribes 2, Battlefield 1942, and Day of Defeat,these games are representative of what on-line games ofthe future are moving towards: large-scale, highly inter-active, virtual worlds [2–4].
With the recent global explosion of on-line multi-player gaming, it is becoming more important to under-stand its network behavior and usage in order to provi-sion and design future network infrastructure. By na-ture, traffic generated in support of this type of applica-tion will be much different than web or TCP-based traf-fic which has received most of the attention in the net-work research community [5–14]. In particular, on-linegaming requires low-latency point-to-point communica-tion as well as directed broadcast channels to facilitate itsreal-time game logic. In addition, such traffic tends toemploy small, highly periodic UDP packets. Packets aresmall since the application requires extremely low laten-cies which makes message aggregation and message re-transmissions impractical. Packets are highly periodic asa result of the game’s dynamic requirement of frequent,predictable state updates amongst clients and servers. Fi-nally, packets are sent via UDP since clients need to sendpackets at an interval that is much shorter than the timeit would take to retransmit lost packets. In addition, thelatency induced via socket buffers [15] and delayed ac-knowledgements is often too large to support meaningfulinteractivity.
In this paper, we examine a class of applications thatis quickly becoming a major component in the networktraffic mix. Specifically, we extend our characterizationof Counter-Strike traffic [16] by comparing it against sev-eral other on-line games. In addition, we also characterizethe game players themselves in terms of their session-timeand geographic distributions. Section II describes the on-line games we have examined. Section III describes theresults of our traffic study. Section V analyzes the impli-cations that gaming traffic will have on network infras-tructure of the future and Section VI concludes.

2
II. BACKGROUND
In order to understand the characteristics of Internetgaming, we first examined the behavior of an extremelypopular Counter-Strike server [4]. Counter-Strike is amodification to the popular Half-Life [3] game and hasbecome one of the most popular and most network-intensive games played over the Internet as of this writing.Counter-Strike is a part of a large class of multi-player,on-line, first-person shooters that has dominated networkgaming traffic over the last several years [1, 17]. As ofMay 2002, there were more than 20,000 Counter-Strikeservers active [4]. The dominance of Half-Life/Counter-Strike goes back as far as 2000 [1], where measurementsindicate that the application was generating a large per-centage of all observed UDP traffic behind DNS and Re-alAudio traffic.
Counter-Strike is architected as a client-server applica-tion with multiple clients communicating and coordinat-ing with a central server that keeps track of the globalstate of the game. In the game, two teams continuouslyplay back-to-back rounds of several minutes in duration.Each team attempts to complete their objectives and foilthose of the other team during the round. The round endswhen one team manages to complete their mission, whenone team eliminates the other team entirely, or when timeruns out. When players are eliminated from a round, theybecome spectators until the next round. During this time,the player can shadow another player that has not beeneliminated. The game itself is played on a variety of mapswhich rotate based on how the server is configured. Typ-ically, maps are rotated every 30 minutes, allowing forover 10 rounds to be played per map. Depending on thehardware and configuration, a Counter-Strike server cansupport up to 32 simultaneous players.
Traffic generated by the game can be attributed to anumber of sources. The most dominant source is thereal-time action and coordinate information sent back andforth between clients and server. This information is pe-riodically sent from all of the clients to the server. Theserver then takes this information and performs a peri-odic broadcast to each client, effectively distributing theglobal state of the game. In addition to game physics da-tum, the game engine allows for broadcast text-messagingand broadcast voice communication amongst players allthrough the centralized server. The game server also sup-ports the upload and download of customized logos thatcan be seen by everyone on a per-client basis. Each clientis able to customize a texture map that may be placed onthe surfaces of the current map. These images are up-loaded and downloaded when users join the game andwhen a new map starts so that each client can properlydisplay the custom decals of the other users. Finally, the
game server supports downloads of entire maps, whichmay consist of sounds, texture libraries and a compiledBinary Space Partitioning tree [18]. In order to preventthe server from becoming overwhelmed by concurrentdownloads, these downloads are rate-limited at the server.
Note that while Half-Life variants currently dominategaming traffic, on-line gaming is notorious for its unpre-dictability. Games rise and fall in popularity over a matterof months with new games quickly replacing older ones.Although getting a truly representative sample is difficult,on-line, multi-player, first-person shooters are dominatedby games using either a Quake-based engine or an Un-real Tournament engine. To get a representative under-standing of the genre, we also examine several additionalgames including two Quake-based games (Day of Defeatand Medal of Honor: Allied Assault) as well as an Unreal-based game (Unreal Tournament 2004).
III. C OUNTER-STRIKE
A. Trace summary
To properly evaluate the traffic generated by this repre-sentative application, we hosted the Counter-Strike (ver-sion 1.3) server of one of the most popular on-line gamingcommunities in the Northwest region: mshmro.com [19].Because of the large Olygamer following, our exceptionalInternet connectivity (OC-3 to Internet2, dual T3s to non-Internet2 sites), the speed of the server used (Dell Dimen-sion 4300, Pentium 4, 1.8GHz, 512MB), and the superi-ority of the game configuration (which includes modulesthat eliminate cheating and deter team killing), the serverquickly became heavily utilized with connections arriv-ing from all parts of the world irrespective of the time ofday. The server itself was configured with a maximumcapacity of 22 players. After a brief warm-up period, werecorded the traffic to and from the server over the courseof a week (April 11-18, 2002). The trace collected con-sisted of a half billion packets. Note that while our tracecollection was limited by the size of the disk used, trafficto and from the server exhibits similar behavior week-to-week. In addition, while we are able to effectively an-alyze this single server, the results in this study do notdirectly apply to overall aggregate load behavior of theentire collection of Counter-Strike servers. In particular,it is expected that active user populations will not, in gen-eral, exhibit the predictability of the server studied in thispaper and that the global usage pattern itself may exhibita high degree of self-similarity [1, 20, 21].
Table I summarizes the key characteristics of the trace.The trace covers over a week of continuous operation ofthe game server. Over 300 maps were played during thistime frame and more than 16,000 user sessions were es-

3
Start Time Apr 11 08:55 2002Stop Time Apr 18 14:56 2002Total Time of Trace 7 d, 6 h, 1 m
(626,477 sec)Maps Played 339Established Connections 16,030Unique Clients Establishing 5,886Attempted Connections 24,004Unique Clients Attempting 8,207
TABLE I
COUNTER-STRIKE NETWORK TRACE INFORMATION
Total Packets 500,000,000Total Packets In 273,846,081Total Packets Out 226,153,919Mean Packet Size 80.33 bytesMean Packet Size In 39.72 bytesMean Packet Size Out 129.51 bytesMean Bandwidth 883kbsMean Bandwidth In 341kbsMean Bandwidth Out 542kbs
TABLE II
COUNTER-STRIKE TRACE NETWORK STATISTICS
tablished. Due to the popularity of the server, each useraveraged almost three sessions for the week and morethan 8,000 connections were refused due to the lack ofopen slots on the server. Table II summarizes the net-work load generated by the server. Over the 500 millionpacket trace, more than 60GB of data were sent includ-ing both network headers and application data. The tablealso shows that even though the application received morepackets than it sent, its outgoing bandwidth exceeded itsincoming bandwidth. As shown in the table, this is be-cause the mean size of outgoing application data packets,excluding transport and network headers, was more thanthree times the size of incoming application data packets.
To understand the dynamics of the trace, Figure 1and Figure 2 plot the per-minute average bandwidth andpacket load observed at the server. As the figures show,while there is a lot of short-term variation in the trace, thetrace exhibits fairly predictable behavior over the long-term. Aggregate bandwidth consumed by the server hov-ers around 800-900 kilobits per second (kbs) while theserver sees a packet rate of around 700-800 packets persecond (pps). In addition, as Figure 3 shows, the numberof active players also shows a lot of short-term variationwith fairly predictable long-term behavior. The number
0�
2000 4000 6000 8000 10000�
Time (min)
0
100
200
300
400
500
600
700
800
900
1000
1100
1200
1300
Ban
dwid
th (
kilo
bits
/sec
)
4/11�
4/12�
4/13�
4/14�
4/15�
4/16�
4/17�
4/18�
Fig. 1. Per-minute bandwidth during trace
0�
2000 4000 6000 8000 10000�
Time (min)
0
200
400
600
800
1000
1200
Pac
ket l
oad
(pac
kets
/sec
)
�
4/11�
4/12�
4/13�
4/14�
4/15�
4/16�
4/17�
4/18�
Fig. 2. Per-minute packet load during trace
0�
200000 400000 600000Time (sec)
0.0
5.0
10.0
15.0
20.0
25.0
30.0
Pla
yers
�
4/11�
4/12�
4/13�
4/14�
4/15�
4/16�
4/17�
4/18�
Fig. 3. Per-minute number of players for entire trace

4
0 10 20 30 40 50Frequency (in Hz)
0
2e+05
4e+05
6e+05
8e+05
1e+06
1.2e+06P
ower
(Tim
e−In
tegr
al S
quar
ed A
mpl
itude
)
0 10 20 30 40 50 60Frequency (in cycles per hour)
0
20000
40000
60000
80000
100000
120000
140000
Pow
er (T
ime−
Inte
gral
Squ
ared
Am
plitu
de)
(a)10ms samples (4/11) (b)1s samples (entire trace)
Fig. 4. Power spectrum density plots of the packet rate of trace
of players sometimes exceeds the maximum number ofslots of 22 as multiple clients can come and go during aninterval. The trace itself also encompasses several briefnetwork outages which did not have a significant impacton the traffic characterization since the popularity of theserver allowed it to recover quickly.
B. Periodicity and predictability
While it appears that the server’s network load is rela-tively stable, a frequency domain analysis of the packetrate during trace shows that this is not the case acrossall time scales. Figure 4 plots the power spectral den-sity (PSD) of the packet rate derived from taking the dis-crete Fourier transform of the trace at two resolutions.Figure 4(a) shows the PSD at a10ms resolution overthe first day of the trace while Figure 4(b) shows thePSD at a1s resolution over the entire trace1. As Fig-ure 4(a) shows, a large high-frequency component is ob-served at a frequency of around20Hz. Across the en-tire trace, Figure 4(b) shows periodic variations occurringtwice an hour with steadily decreasing variations at higherfrequencies.
To fully understand the behavior at varying time-scales,Figure 5 and Figure 6 plot the total packet load, the in-coming packet load, and the outgoing packet load ob-served at the server for the first 20010ms intervals ofthe trace. As expected, the figure exhibits an extremelybursty, highly periodic pattern. When broken down be-tween incoming and outgoing packet load, it is clear thatthe periodicity comes from the game server determinis-tically flooding its clients with state updates about every50ms (20Hz). This synchronous behavior is due to the
1Memory resource limitations prevented a10ms resolution analysisover the entire trace
0�
50 100�
150� 200�
Interval number
0
500
1000
1500
2000
2500
Pac
ket l
oad
(pac
kets
/sec
)
�
Fig. 5. Total packet load for them = 10ms interval size
game server logic itself. Since clients connect via diversenetwork paths, the incoming packet load is not highly syn-chronized. Given this behavior, Figure 7 shows the plotof the first 20050ms intervals of the trace. As expected,aggregating over this interval smooths out the packet loadconsiderably.
While the high frequency variability is smoothed over50ms intervals, lower frequency variability is caused bytwo factors: map changes and round time limits. With theformer, network disruptions are caused by the 30 minutemap time of the server. As the server loads a new mapevery half-hour, the network traffic dips significantly fora short period of time. Because most of the clients willhave the maps stored locally, this down time is due com-pletely to the server doing local tasks to perform the mapchange over. The second component occurs due to roundchanges. For each map, several rounds are played witheach round capped at 3 minutes. At the start of each

5
0�
50 100�
150� 200�
Interval number
0
500
1000
1500
2000
2500
Pac
ket l
oad
(pac
kets
/sec
)
�
0�
50 100�
150� 200�
Interval number
0
500
1000
1500
2000
2500
Pac
ket l
oad
(pac
kets
/sec
)
�
(a) Incoming packet load (b) Outgoing packet load
Fig. 6. Incoming and outgoing packet load for them = 10ms interval size
0�
50 100�
150� 200�
Interval number
0
500
1000
1500
Pac
ket l
oad
(pac
kets
/sec
)
�
Fig. 7. Total packet load plot form = 50ms
round, clients remain in a quiescent state for a short pe-riod of time, transmitting and receiving a smaller numberof packets. Figure 8 shows this behavior with a plot of thefirst 18,0001sec intervals. Noticeable dips appear every1,800 (30min) intervals with smaller variations occurringat a higher frequency. Because map changing and roundtime limits are a configuration-specific feature, this be-havior is not a generic characteristic and can be affectedby game administrators changing maps directly, playersvoting to change maps or extending the current map, or adifferent map time limit setting. For this trace and serverconfiguration, increasing the interval size beyond the de-fault map time of30min removes the variability. Figure 9plots the first 20030min intervals of the trace. As the fig-ure shows, the variability has been eliminated.
The predictability of the aggregate leads us to exam-ine how predictable the resource consumption of each in-
0�
3600 7200 10800� 14400� 18000�
Interval number
0
500
1000
1500
Pac
ket l
oad
(pac
kets
/sec
)
�
Fig. 8. Total packet load plot form = 1sec
0�
50 100�
150� 200�
Interval number
0
500
1000
1500
Pac
ket l
oad
(pac
kets
/sec
)
�
Fig. 9. Total packet load plot form = 30min

6
0�
50000�
100000 150000Bandwidth (bits/sec)
0
20
40
60
80
100
Num
ber
of p
laye
rs
�
Fig. 10. Client bandwidth histogram
dividual flow is in the trace. Perhaps the most interest-ing observation is that when the mean bandwidth of theserver is divided by the total number of players allowedby the game server itself (22), the bandwidth consumedper player is on average40kbs. This is no coincidence asthe game is meant to be played uniformly across a widerange of network speeds, down to and including the ubiq-uitous56kbs modem, which at the time of the study ac-counted for more than80% of the way users connectedto the Internet. As typical performance of56kbs modemsrange from40 − 50kbs [22], it is clear that this partic-ular game was designed tosaturate the narrowest last-mile link. Going back to the trace itself, we measured themean bandwidth consumed by each flow at the server inorder to get a picture of the bandwidth distribution acrossclients. Assuming minimal packet loss and a negligibledifference in link-layer header overhead between the last-mile link and the server’s link, the bandwidth measured atthe server will be quite close to what is sent across the lasthop. Figure 10 shows a histogram of bandwidths acrossall sessions in the trace that lasted longer than 30 sec-onds. The figure shows that the overwhelming majorityof flows are pegged at modem rates or below even thoughconnections arrived via diverse network mediums. Thefigure also shows that some flows do, in fact, exceed the56kbs barrier. This is due to the fact that the client canbe specially configured to crank up the update rate to andfrom the server in order to improve the interactivity ofgameplay even further. As shown by the histogram, onlya handful of elite players connecting via high speed linkshave taken advantage of the setting.
C. Tiny packets
While the good news in the trace is that for a fixedset of players, the traffic generated is highly stable and
0�
100�
200�
300�
400�
500�
Packet size (bytes)
0.00
0.01
0.02
0.03
0.04
0.05
0.06
0.07
0.08
0.09
0.10
Pro
babi
lity
�
InboundOutbound
Fig. 11. Packet size PDF
predictable, the bad news is that the traffic itself is madeup of large, periodic bursts of very small packets. Fig-ure 11 plots the probability density function (PDF) ofpacket sizes across the 500 million packet trace. Thegraph is truncated at 500 bytes as only a negligible num-ber of packets exceeded this. As the figure shows, almostall of the packets are under 200 bytes. The figure alsoshows that almost all of the incoming packets are smallerthan 60 bytes while a large fraction of outgoing packetshave sizes spread between 0 and 300 bytes. Note thatpacket sizes include only the application data itself andnot the UDP, IP, or Ethernet headers. In addition, whileincoming packets have an extremely narrow distributioncentered around the mean size of 40 bytes, outgoing pack-ets have a much wider distribution around a significantlylarger mean. This is not surprising as the game serveritself is logically playing the role of a broadcaster: tak-ing state information from each client, aggregating theresults, and broadcasting it out to all other clients [23].Such application-level broadcasts generate larger packetsand cause the outgoing bandwidth to exceed the incom-ing bandwidth even though the rate of incoming packetsexceeds that of outgoing packets. This is significantly dif-ferent than aggregate traffic seen within Internet exchangepoints in which the mean packet size observed was above400 bytes [1].
D. Client characterization
D.1 Session-time distribution
Given that network load for a client is relatively con-stant when connected, it is interesting to find out what thesession times for players is in order to more accuratelyconstruct a source model for game traffic. Using the traceabove, we extracted the total session time of each player

7
0 30 60 90 120 150 180 210 240Minutes
0
0.1
0.2
0.3
0.4
0.5
0.6
0.7
0.8
0.9
1
Pro
babi
lity
Fig. 12. Session time CDF for mshmro trace
0 15 30 45 60 75 90 105 120Minutes
0
0.05
0.1
0.15
Pro
babi
lity
PDF of mshmro player session timesWeibull β=0.5, η=20, γ=0
Fig. 13. Fitted Weibull distribution on session time PDF of mshmrotrace
session contained in the trace. Figure 12 plots the sessiontime cumulative density function (CDF) of the trace inunit increments of a minute. The figure shows, quite sur-prisingly, that a significant number of players play onlyfor a short time before disconnecting and that the num-ber of players that play for longer periods of time dropssharply as time increases. Note that in contrast to heavy-tailed distributions reported for most source models forInternet traffic, the session ON times for game players isdecidedly not heavy-tailed. As the figure shows, the prob-ability of having a particular session time drops sharplywith more than 99% of all sessions lasting less than 2hours.
In order to develop accurate source models for gametraffic, it is useful to match a distribution to the probabil-ity density function of the session times. As the sessiontimes model “player” lifetimes, the PDF can be closelymatched to a Weibull distribution, one of the most com-
0 20 40 60 80 100Minutes
0
0.05
0.1
0.15
0.2
Pla
yer f
ailu
re ra
te
Fig. 14. Player failure rates for individual session times
mon distributions used to model lifetime distributions inreliability engineering. It is not surprising that this distri-bution fits, since quitting the game can be viewed as anattention “failure” on the part of the player. The general-ized Weibull distribution has three parametersβ, η, andγand is shown below.
f(T ) = βη (T−γ
η )β−1e−( T−γη )β
In this form, β is a shape parameter or slope of thedistribution, η is a scale parameter, andγ is a locationparameter. As the location of the distribution is at theorigin, γ is set to zero, giving us the two-parameter formfor the Weibull PDF.
f(T ) = βη (T
η )β−1e−( Tη )β
Using a probability plotting method, we estimated theshape (β) and scale (η) parameters of the session timePDF. As Figure 13 shows, a Weibull distribution withβ =0.5, η = 20, andγ = 0 closely fits the PDF of measuredsession times for the trace.
Note that this result is in contrast to previous stud-ies that have fitted an exponential distribution to session-times of multi-player games [20]. Unlike the Weibull dis-tribution which has independent scale and shape param-eters, the shape of the exponential distribution is com-pletely determined byλ, the failure rate. Due to thememory-less property of the exponential distribution, thisrate is assumed to be constant. Figure 14 shows the fail-ure rate for individual session durations over the trace. Asthe figure shows, the failure rate is not constant for shortersession times, thus making it difficult to accurately fit it toan exponential distribution. Inexplicably, the failure rateis higherfor flows of shorter duration. While it is difficultto pinpoint the exact reason for this, it could be attributed
8
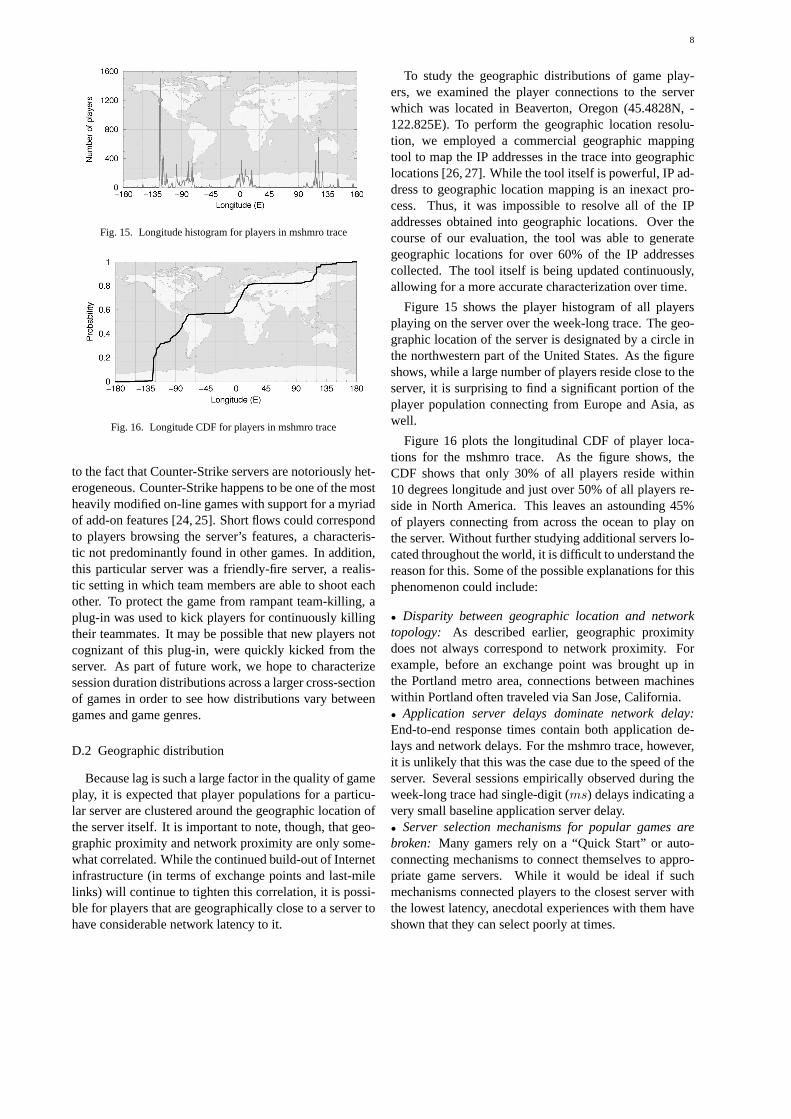
Fig. 15. Longitude histogram for players in mshmro trace
Fig. 16. Longitude CDF for players in mshmro trace
to the fact that Counter-Strike servers are notoriously het-erogeneous. Counter-Strike happens to be one of the mostheavily modified on-line games with support for a myriadof add-on features [24, 25]. Short flows could correspondto players browsing the server’s features, a characteris-tic not predominantly found in other games. In addition,this particular server was a friendly-fire server, a realis-tic setting in which team members are able to shoot eachother. To protect the game from rampant team-killing, aplug-in was used to kick players for continuously killingtheir teammates. It may be possible that new players notcognizant of this plug-in, were quickly kicked from theserver. As part of future work, we hope to characterizesession duration distributions across a larger cross-sectionof games in order to see how distributions vary betweengames and game genres.
D.2 Geographic distribution
Because lag is such a large factor in the quality of gameplay, it is expected that player populations for a particu-lar server are clustered around the geographic location ofthe server itself. It is important to note, though, that geo-graphic proximity and network proximity are only some-what correlated. While the continued build-out of Internetinfrastructure (in terms of exchange points and last-milelinks) will continue to tighten this correlation, it is possi-ble for players that are geographically close to a server tohave considerable network latency to it.
To study the geographic distributions of game play-ers, we examined the player connections to the serverwhich was located in Beaverton, Oregon (45.4828N, -122.825E). To perform the geographic location resolu-tion, we employed a commercial geographic mappingtool to map the IP addresses in the trace into geographiclocations [26, 27]. While the tool itself is powerful, IP ad-dress to geographic location mapping is an inexact pro-cess. Thus, it was impossible to resolve all of the IPaddresses obtained into geographic locations. Over thecourse of our evaluation, the tool was able to generategeographic locations for over 60% of the IP addressescollected. The tool itself is being updated continuously,allowing for a more accurate characterization over time.
Figure 15 shows the player histogram of all playersplaying on the server over the week-long trace. The geo-graphic location of the server is designated by a circle inthe northwestern part of the United States. As the figureshows, while a large number of players reside close to theserver, it is surprising to find a significant portion of theplayer population connecting from Europe and Asia, aswell.
Figure 16 plots the longitudinal CDF of player loca-tions for the mshmro trace. As the figure shows, theCDF shows that only 30% of all players reside within10 degrees longitude and just over 50% of all players re-side in North America. This leaves an astounding 45%of players connecting from across the ocean to play onthe server. Without further studying additional servers lo-cated throughout the world, it is difficult to understand thereason for this. Some of the possible explanations for thisphenomenon could include:
• Disparity between geographic location and networktopology: As described earlier, geographic proximitydoes not always correspond to network proximity. Forexample, before an exchange point was brought up inthe Portland metro area, connections between machineswithin Portland often traveled via San Jose, California.• Application server delays dominate network delay:End-to-end response times contain both application de-lays and network delays. For the mshmro trace, however,it is unlikely that this was the case due to the speed of theserver. Several sessions empirically observed during theweek-long trace had single-digit (ms) delays indicating avery small baseline application server delay.• Server selection mechanisms for popular games arebroken: Many gamers rely on a “Quick Start” or auto-connecting mechanisms to connect themselves to appro-priate game servers. While it would be ideal if suchmechanisms connected players to the closest server withthe lowest latency, anecdotal experiences with them haveshown that they can select poorly at times.

9
(a) midnight to 4am (b) 4am to 8am
(c) 8am to noon (d) noon to 4pm
(e) 4pm to 8pm (f) 8pm to midnight
Fig. 17. mshmro player locations over time
• The number of players on a server determines desir-ability over delay: Many on-line games are simply notfun when only a limited number of players are playing.For example, large maps can be boring with a small num-ber of players since it takes a significant amount of timebefore players find each other to shoot. Because of this,players often connect to servers that have a reasonablenumber of players on them. This can make it difficult foran idle server to obtain new players, even if it has beenconfigured properly and is in a prime network location• A shortage of servers overseas:While the data in theprevious section indicates a significant number of serverslocated in Europe, it is possible that during peak times thatthere simply aren’t enough servers to support the numberof players. In addition, the converse may be true withU.S. players connecting to European servers during peakhours of the day. Such a phenomenon could be verifiedwith traces from European servers.
Although, by no means definitive, Figure 17 providesa partial indication that the determining factor in the geo-
graphic distribution of players is, in fact, the time of day.The figure plots player connections during 6 different 4-hour blocks of the day during the week-long trace. Thetimes are given in the server’s local time (Pacific Stan-dard Time). As the figure shows, the locations of playersis driven by the time of day, with most of the connec-tions originating from Europe and Asia occurring duringearly morning and afternoon hours of the day. This is aninteresting phenomenon as it means that for grid-based,computing on-demand, gaming services such as Butter-fly.net, that a global positioning and repositioning of re-sources over time is required to match the usage patternsof players. For example, it would be desirable to shiftgame servers and computing capacity to European datacenters during early morning hours (PST) to match wherethe demand is coming from.
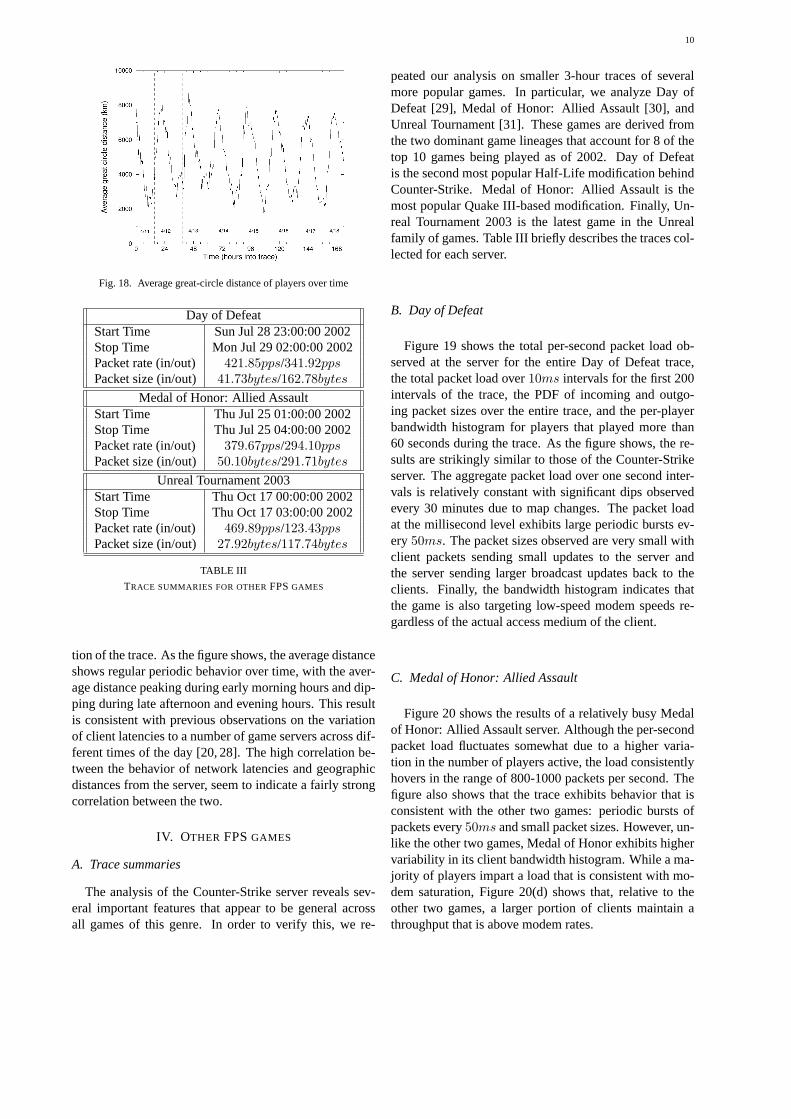
Figure 18 quantifies the time of day phenomenon byplotting the great-circle distance (defined as the shortestdistance along a sphere between two points on the sphere)between the mshmro server and its players over the dura-
10
Fig. 18. Average great-circle distance of players over time
Day of DefeatStart Time Sun Jul 28 23:00:00 2002Stop Time Mon Jul 29 02:00:00 2002Packet rate (in/out) 421.85pps/341.92ppsPacket size (in/out) 41.73bytes/162.78bytes
Medal of Honor: Allied AssaultStart Time Thu Jul 25 01:00:00 2002Stop Time Thu Jul 25 04:00:00 2002Packet rate (in/out) 379.67pps/294.10ppsPacket size (in/out) 50.10bytes/291.71bytes
Unreal Tournament 2003Start Time Thu Oct 17 00:00:00 2002Stop Time Thu Oct 17 03:00:00 2002Packet rate (in/out) 469.89pps/123.43ppsPacket size (in/out) 27.92bytes/117.74bytes
TABLE III
TRACE SUMMARIES FOR OTHERFPSGAMES
tion of the trace. As the figure shows, the average distanceshows regular periodic behavior over time, with the aver-age distance peaking during early morning hours and dip-ping during late afternoon and evening hours. This resultis consistent with previous observations on the variationof client latencies to a number of game servers across dif-ferent times of the day [20, 28]. The high correlation be-tween the behavior of network latencies and geographicdistances from the server, seem to indicate a fairly strongcorrelation between the two.
IV. OTHER FPSGAMES
A. Trace summaries
The analysis of the Counter-Strike server reveals sev-eral important features that appear to be general acrossall games of this genre. In order to verify this, we re-
peated our analysis on smaller 3-hour traces of severalmore popular games. In particular, we analyze Day ofDefeat [29], Medal of Honor: Allied Assault [30], andUnreal Tournament [31]. These games are derived fromthe two dominant game lineages that account for 8 of thetop 10 games being played as of 2002. Day of Defeatis the second most popular Half-Life modification behindCounter-Strike. Medal of Honor: Allied Assault is themost popular Quake III-based modification. Finally, Un-real Tournament 2003 is the latest game in the Unrealfamily of games. Table III briefly describes the traces col-lected for each server.
B. Day of Defeat
Figure 19 shows the total per-second packet load ob-served at the server for the entire Day of Defeat trace,the total packet load over10ms intervals for the first 200intervals of the trace, the PDF of incoming and outgo-ing packet sizes over the entire trace, and the per-playerbandwidth histogram for players that played more than60 seconds during the trace. As the figure shows, the re-sults are strikingly similar to those of the Counter-Strikeserver. The aggregate packet load over one second inter-vals is relatively constant with significant dips observedevery 30 minutes due to map changes. The packet loadat the millisecond level exhibits large periodic bursts ev-ery50ms. The packet sizes observed are very small withclient packets sending small updates to the server andthe server sending larger broadcast updates back to theclients. Finally, the bandwidth histogram indicates thatthe game is also targeting low-speed modem speeds re-gardless of the actual access medium of the client.
C. Medal of Honor: Allied Assault
Figure 20 shows the results of a relatively busy Medalof Honor: Allied Assault server. Although the per-secondpacket load fluctuates somewhat due to a higher varia-tion in the number of players active, the load consistentlyhovers in the range of 800-1000 packets per second. Thefigure also shows that the trace exhibits behavior that isconsistent with the other two games: periodic bursts ofpackets every50ms and small packet sizes. However, un-like the other two games, Medal of Honor exhibits highervariability in its client bandwidth histogram. While a ma-jority of players impart a load that is consistent with mo-dem saturation, Figure 20(d) shows that, relative to theother two games, a larger portion of clients maintain athroughput that is above modem rates.

11
0.0 2000.0�
4000.0�
6000.0�
8000.0�
10000.0�
Time (sec)
0.0
200.0
400.0
600.0
800.0
1000.0
Pac
ket l
oad
(pac
kets
/sec
)
�
0�
50 100�
150� 200�
Interval number
0
500
1000
1500
2000
2500
Pac
ket l
oad
(pac
kets
/sec
)
�
(a) Per-second packet load over trace (b) Total packet load plot form = 10ms
0 100 200 300 400 500Packet size (bytes)
0.00
0.01
0.02
0.03
0.04
0.05
0.06
0.07
0.08
0.09
0.10
Pro
babi
lity
InboundOutbound
0 20000 40000 60000 80000Bandwidth (bits/sec)
0
2
4
6
8
10
Num
ber o
f pla
yers
(c) Packet size PDF (d) Client bandwidth histogram
Fig. 19. Day of Defeat
D. Unreal Tournament 2003
Figure 21 shows the results of the Unreal Tournament2003 trace. As the figure shows, the per-second packetload is again relatively constant. In contrast to the previ-ous games, however, the total packet load exhibits packetbursts every100ms, half the rate of the other games. Inaddition, the size of the client and server packets is some-what smaller. Most surprisingly, however, is the clientbandwidth histogram shown in Figure 21(d). As the figureshows, Unreal Tournament 2003 targets the saturation ofanarrower last-mile link versus the other games. Clients,on average, maintain throughputs that match 28.8kbs and33.6kbs modems.
V. I MPLICATIONS ON ROUTING INFRASTRUCTURE
A. The Bad News
Perhaps the most significant aspect of the trace is theobservation that on-line game traffic consists of large, pe-riodic bursts of short packets. As shown in all of ourtraces, this characteristic is fundamental in all sufficiently
loaded, highly interactive, on-line games due to the natureof the application and the underlying game logic. Shortpackets are required for low latency while highly periodictraffic allows the game to provide uniform interactivityamongst all of its clients.
Unfortunately for games, network devices are not nec-essarily designed for this type of traffic. With the explo-sion of the web and peer-to-peer networks, the majorityof traffic being carried in today’s networks involve bulkdata transfers using TCP. While TCP acknowledgementsare typically small, data segments can be close to an orderof magnitude larger than game traffic. With the additionof delayed acknowledgments and piggy-backed acknowl-edgments, the average packet sizes of most bi-directionalTCP connections will exceed those for games.
For designers of networking devices, the implicationsare clear. Devices should
• Have sufficient forwarding capacity to handle smallpacket sizes: Router designers and vendors make packetsize assumptions when building their gear, often expect-ing average sizes in between 1,000 and 2,000 bits (125-

12
0.0 2000.0 4000.0 6000.0 8000.0 10000.0Time (sec)
0.0
200.0
400.0
600.0
800.0
1000.0
Pac
ket l
oad
(pac
kets
/sec
)
0 50 100 150 200Interval number
0
500
1000
1500
2000
2500
3000
Pac
ket l
oad
(pac
kets
/sec
)
(a) Per-second packet load over trace (b) Total packet load plot form = 10ms
0 100 200 300 400 500 600Packet size (bytes)
0.00
0.01
0.02
0.03
0.04
0.05
0.06
Pro
babi
lity
InboundOutbound
0 20000 40000 60000 80000Bandwidth (bits/sec)
0
2
4
6
8
10
Num
ber o
f pla
yers
(c) Packet size PDF (d) Client bandwidth histogram
Fig. 20. Medal of Honor
250 bytes) [32]. Thus, a significant shift in packetsize from the deployment of on-line games will makethe route lookup function the bottleneck versus the linkspeed [33]. Routing devices that are designed for han-dling larger packets will also see significant packet-lossor, even worse, consistent packet delay and delay jitterwhen handling game traffic.• Employ ECN: Even though such flows are constant bit-rate flows, they are extremely fragile in the face of packetloss. Small packet loss rates quickly degrade user expe-rience to an unacceptable level, causing the user to ter-minate the connection. Unfortunately, TCP regularly op-erates with a small loss rate in steady state. Thus, with-out ECN, relatively small levels of congestion will dis-able game applications. Note that loss and delay sen-sitivity is only a characteristic of first-person shooters.As shown in subsequent related work [34], other gen-res such as massively multi-player on-line role-playinggames (MMORPG) can tolerate a significant amount ofboth before becoming too difficult to play.• Have small buffers: While route designers may betempted to add buffers to temporarily absorb the packet
bursts, adding buffers or combining packets does not nec-essarily help performance since delayed packets can beworse than dropped packets. Delayed packets degradeuser experience [35] as well as consume additional pro-cessing resources at the server as it tries to keep its globalstate consistent. In this particular case, buffering the50ms packet spikes will consume more than a quarter ofthe maximum tolerable latency for this type of interactivegame.• Employ active queue management: While havingsmall buffers that employ ECN is needed, network de-vices must also employ active queue management al-gorithms that can effectively operate over short queues.Such algorithms must be properly configured and imple-mented [36–40].
In conjunction with re-designing network devices, suchworkloads also require that ISPs pay attention to morethan just bandwidth utilization when determining the needfor network upgrades. Game vendors are increasingly de-ploying large server farms in a single location in order tocontrol the experience of their on-line players. Emerg-ing games such as America’s Army, Unreal Tournament

13
0.0 2000.0 4000.0 6000.0 8000.0 10000.0Time (sec)
0.0
200.0
400.0
600.0
800.0
1000.0
Pac
ket l
oad
(pac
kets
/sec
)
0 50 100 150 200Interval number
0
500
1000
1500
2000
2500
3000
Pac
ket l
oad
(pac
kets
/sec
)
(a) Per-second packet load over trace (b) Total packet load plot form = 10ms
0 100 200 300 400 500Packet size (bytes)
0.00
0.04
0.08
0.12
0.16
Pro
babi
lity
InboundOutbound
0 20000 40000 60000 80000Bandwidth (bits/sec)
0
5
10
15
20
25
Num
ber o
f pla
yers
(c) Packet size PDF (d) Client bandwidth histogram
Fig. 21. Unreal Tournament 2003
2003, Battlefield 1942, and the Xbox-live network haveconcentrated deployments of game servers that can over-whelm forwarding capacity. Similar to the way ISPs cur-rently double capacity whenever peak usage nears 20%,ISPs must also consider “packet processing” utilizationwhen determining network upgrades. Mid-range routersor firewalls within several hops of large hosted on-linegame servers must be carefully provisioned to minimizeboth the loss and delay induced by routing extremelysmall packets.
B. The Good News
The good news about the trace is that the predictabilityin resource requirements makes the modeling, simulation,and provisioning on-line gaming traffic a relatively simpletask as the traffic does not exhibit fractal behavior whenthe number of active players is relatively fixed. As a resultof this predictability, the traffic from an aggregation of allon-line Counter-Strike players is effectively linear to thenumber of active players. While this is the case, the ac-tual number of players on-line over time may, in fact, ex-hibit a high degree of variability and self-similarity. Self-
similarity in aggregate game traffic in this case will bedirectly dependent on the self-similarity of user popula-tions [20, 21]. Since the trace itself can be used to moreaccurately develop source models for simulation [41], wehope to make the trace and associated game log file pub-licly available [16].
The other silver lining in this trace is that while thesmall packets of on-line games have the potential to wreakhavoc on routing infrastructure, the periodicity and pre-dictability of packet sizes allows for meaningful perfor-mance optimizations within network devices. For exam-ple, preferential route caching strategies based on packetsize or packet frequency may provide significant improve-ments in packet throughput. We hope to explore theseissues further on a network processor testbed [42].
VI. CONCLUSION
With the explosion in on-line, multi-player networkgames, it is becoming imperative to characterize this com-ponent of Internet traffic that will remain a sizable portionof overall usage. To this end, we have and analyzed thenetwork traffic of several popular on-line games and have

14
shown that the workload they impart consists of large,highly periodic bursts of small packets with predictablelong-term rates. This can be attributed to the synchronousnature of current game designs, the need to uniformly de-liver a high degree of interactivity, and the phenomenonof narrowest last-mile link saturation. In addition to theaggregate traffic behavior, we have also shown that gameplayers themselves have interesting session-time and ge-ographic location distributions. Session-times of playersare not heavy-tailed and have a mean that is under 30 min-utes while the geographic locations of players exhibit dis-tinct time-of-day variations.
REFERENCES
[1] S. McCreary and k. claffy, “Trends in Wide Area IP Traffic Pat-terns: A View from Ames Internet Exchange,” inProceedings of13th ITC Specialist Seminar on Measurement and Modeling of IPTraffic, September 2000, pp. 1–11.
[2] id Software, “id Software,” http://www.idsoftware.com/ .
[3] Half-Life, “The Official Half-Life Web Site,” http://half-life.sierra.com/ .
[4] Counter-Strike, “Counter-Strike: A Counter-Terrorism Half-LifeModification,” http://www.counter-strike.net/ .
[5] P. Barford and M. Crovella, “Generating Representative WebWorkloads for Network and Server Performance Evaluation,” inProceedings of ACM SIGMETRICS, July 1998, pp. 151–160.
[6] R. Caceres et. al., “Measurement and Analysis of IP Network Us-age and Behavior,”IEEE Communication Magazine, May 2000.
[7] M. Crovella and A. Bestavros, “Self-similarity in World Wide WebTraffic: Evidence and Possible Causes,” inProceedings of ACMSIGMETRICS, May 1996.
[8] A. Feldmann, A. Gilbert, and W. Wilinger, “Data Networks asCascades: Investigating the Multifractal Nature of Internet WANTraffic,” in Proceedings of ACM SIGCOMM, September 1998.
[9] W. Leland, M. Taqqu, W. Willinger, and D. Wilson, “Onthe Self-Similar Nature of Ethernet Traffic (Extended Version),”IEEE/ACM Transactions on Networking, vol. 2, no. 1, February1994.
[10] B. Mah, “An Empirical Model of HTTP Network Traffic,” inProceedings of IEEE INFOCOM, April 1997.
[11] V. Paxson and S. Floyd, “Wide-Area Traffic: The Failure of Pois-son Modeling,” inProceedings of ACM SIGCOMM, August 1994,pp. 257–268.
[12] V. Paxson, “Empirically-derived Analytic Models of Wide-AreaTCP Connections,” IEEE/ACM Transactions on Networking,1994.
[13] V. Paxson, “End-to-End Internet Packet Dynamics,” inProceed-ings of ACM SIGCOMM, September 1997.
[14] A. Veres and M. Boda, “The Chaotic Nature of TCP CongestionControl,” in Proceedings of IEEE INFOCOM, April 2000.
[15] A. Goel, C. Krasic, K. Li, and J. Walpole, “Supporting Low La-tency TCP-Based Media Streams,” inProceedings of IWQoS, May2002.
[16] W. Feng, F. Chang, W. Feng, and J. Walpole, “Provisioning On-line Games: A Traffic Analysis of a Busy Counter-Strike Server,”in Proc. of the Internet Measurement Workshop, November 2002.
[17] GameSpy Industries, “GameSpy: Gaming’s Home Page,”http://www.gamespy.com/ , 2002.
[18] H. Fuchs, Z. M. Kedem, and B. F. Naylor, “On Visible Sur-face Generation by a Priori Tree Structures,”Computer Graph-ics(SIGGRAPH ’80 Proceedings), vol. 14, pp. 124–133, July1980.
[19] mshmro.com, ,”http://www.mshmro.com/ .
[20] T. Henderson and S. Bhatti, “Modelling User Behavior in Net-worked Games,” inACM Multimedia, 2001, pp. 212–220.
[21] T. Henderson, “Latency and User Behaviour on a MultiplayerGame Server,” inNetworked Group Communication, 2001, pp.1–13.
[22] J. Kristoff, “Understanding 56Kbps Modems,” http://homepage.interaccess.com/˜jkristof/56kmodem.html , 1997.
[23] M. Claypool, D. LaPoint, and J. Winslow, “Network Analysis ofCounter-Strike and Starcraft,” inIEEE IPCCC, April 2003.
[24] Half-Life Admin Mod Developers, “Half-Life Admin ModHome,” http://www.adminmod.org/ .
[25] AMX Mod Developers, “AMX Mod Server Plugin,”http://amxmod.net/ .
[26] Geobytes, Inc., “Geobytes Home Page,”http://www.geobytes.com/ , 2003.
[27] W. Feng and W. Feng, “On the Geographic Distribution of On-lineGame Servers and Players,” inNetGames 2003, May 2003.
[28] G. Armitage, “Sensitivity of Quake3 Players To Network La-tency,” in Internet Measurement Workshop (Poster Session),November 2001.
[29] Day of Defeat Developers, “Day of Defeat: Half-Life Modifica-tion,” http://www.dayofdefeatmod.com/ , 2001.
[30] Electronic Arts, “EA Games: Medal of Honor Allied Assault,”http://www.eagames.com/ , 2001.
[31] Epic Games, “Unreal Tournament 2003,”http://www.unrealtournament2003.com/ .
[32] C. Partridge et. al, “A 50-Gb/s IP Router,”IEEE/ACM Transac-tions on Networking, vol. 6, no. 3, pp. 237–245, June 1998.
[33] Super Computer Gaming, “Super Computer Gaming: JupiterCluster,” http://www.supercomputergaming.com/ ,2002.
[34] N. Sheldon, E. Girard, S. Borg, and M. Claypool, “The Effect ofLatency on User Performance in Warcraft III,” inNetGames 2003,May 2003.
[35] I. S. MacKenzie and S. Ware, “Lag as a Determinant of HumanPerformance in Interactive Systems,”INTERCHI, pp. 488–493,1993.
[36] S. Floyd and V. Jacobson, “Random Early Detection Gateways forCongestion Avoidance,”ACM/IEEE Transactions on Networking,vol. 1, no. 4, pp. 397–413, August 1993.
[37] S. Kunniyur and R. Srikant, “Analysis and Design of an AdaptiveVirtual Queue (AVQ) Algorithm for Active Queue Management,”in Proceedings of ACM SIGCOMM, August 2001.
[38] W. Feng, D. Kandlur, D. Saha, and K. Shin, “A Self-ConfiguringRED Gateway,” inProceedings of IEEE INFOCOM, March 1999.
[39] W. Feng, D. Kandlur, D. Saha, and K. Shin, “The Blue QueueManagement Algorithms,”IEEE/ACM Transactions on Network-ing, vol. 10, no. 4, August 2002.
[40] C. Hollot, V. Misra, D. Towsley, and W. Gong, “On DesigningImproved Controllers for AQM Routers Supporting TCP Flows,”in INFOCOM, 2001, pp. 1726–1734.
[41] M. Borella, “Source Models of Network Game Traffic,”ComputerCommunications, vol. 23, no. 4, pp. 403–410, February 2000.
[42] E. Johnson and A. Kunze, “IXP1200 Programming,” 2002.