Embed Size (px)
Citation preview
1
A Time-Lapse Seismic Modeling Study forCO2 Sequestration at the Dickman Oilfield
Ness County, Kansas
Jintan Li
April 28th, 2010

2
Outline
• Background/Introduction
• Methods
• Preliminary Results
• Future Work
3
Background
• Area: Dickman Field, Kansas• Interest: CO2 Sequestration Target
• Deep Saline Aquifer - primary• Shallower depleted oil reservoir - secondary
• Reservoir Characterization: • seismic processing, inversion, volumetric attributes,
log analysis, petrophysics, reservoir simulation, and 4D (my part of work)
• Funded by DOE (2009-2012)
4
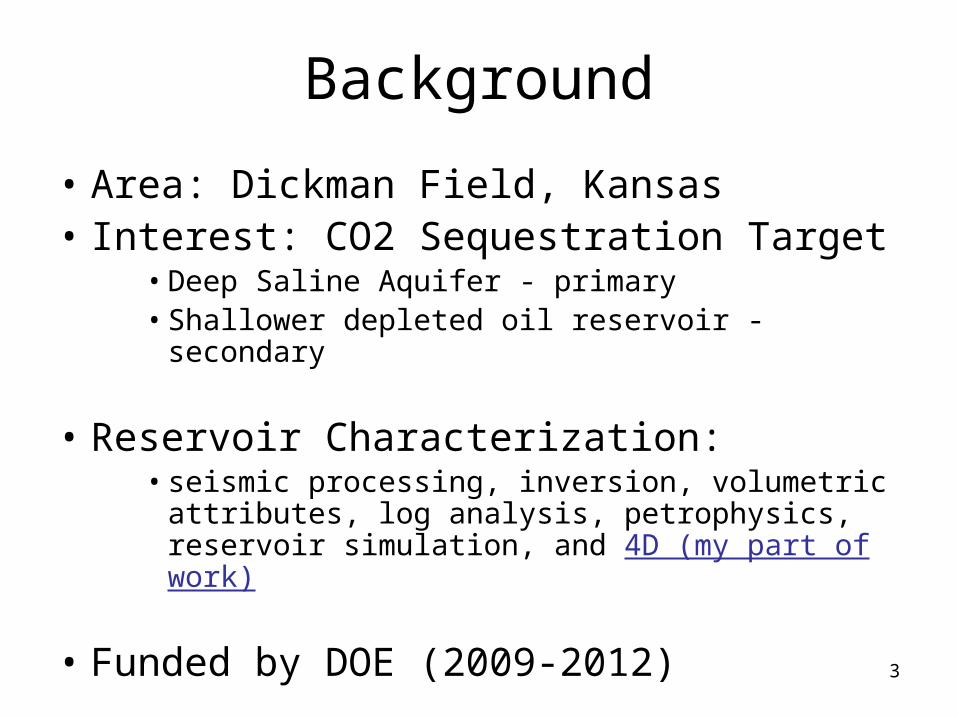
Dickman FieldLocation: Ness County Kansas State
5
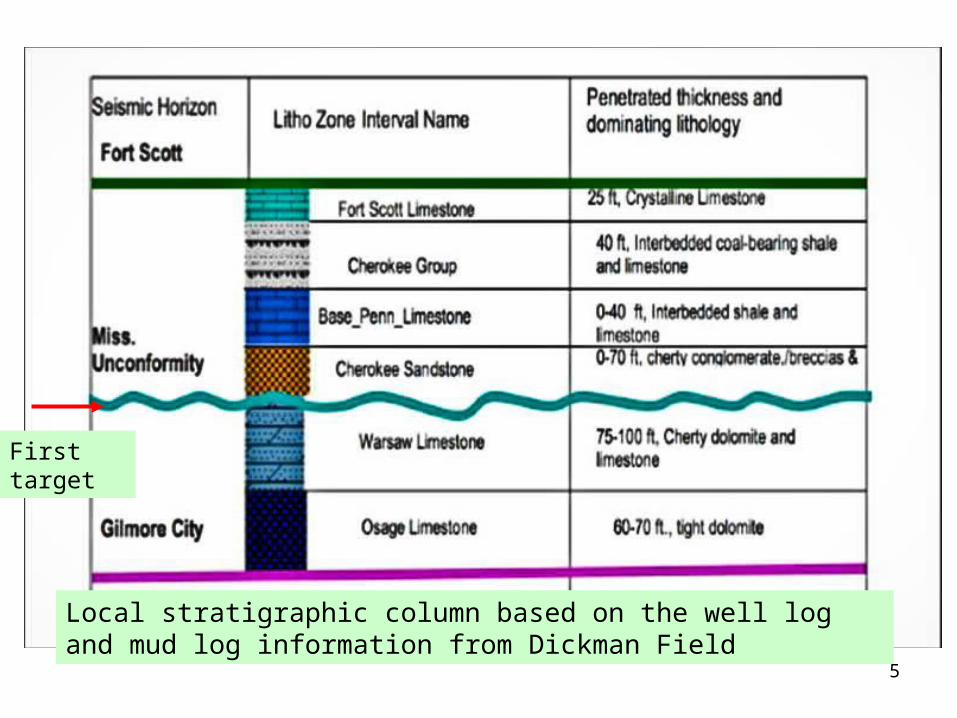
Local stratigraphic column based on the well log and mud log information from Dickman Field
First target
6
Goal of 4D Seismic
To monitor the reservoir at various time:
• Fluid-flow paths
• CO2 movement and containment
• Post-injection stability
• Reservoir properties, etc.
7
Framework
• Reservoir Flow Simulation• Computer Modeling Group (CMG)
• Gassmann Fluid Substitution
• Seismic Simulation Candidates• Convolution model• Full Wave Forward Modeling
8
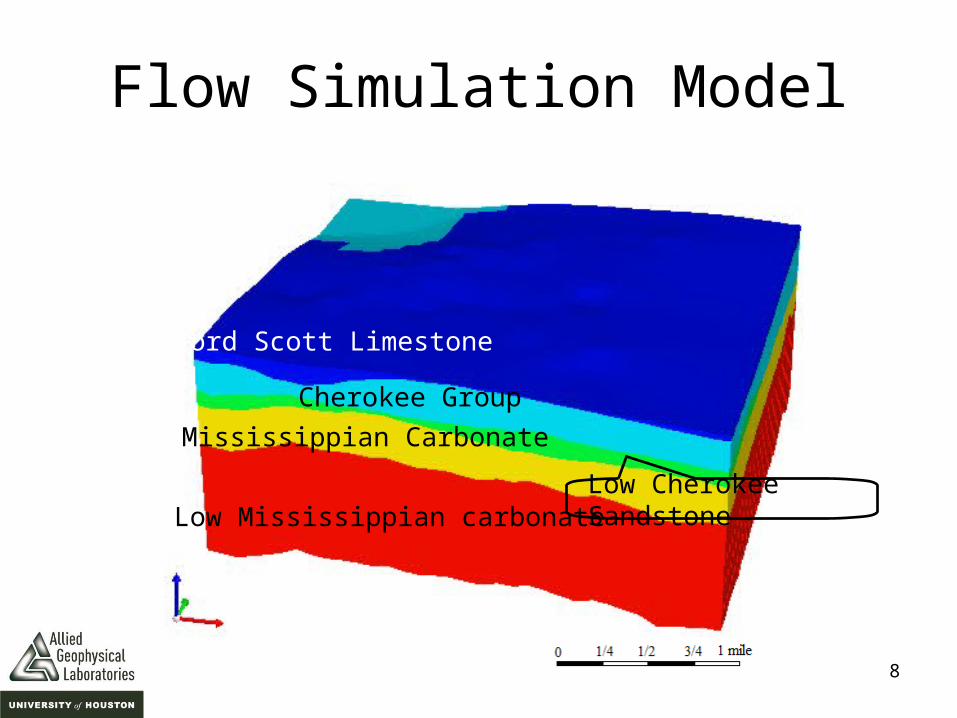
Ford Scott Limestone
Cherokee Group
Low Cherokee Sandstone
Mississippian Carbonate
Low Mississippian carbonate
Flow Simulation Model
9
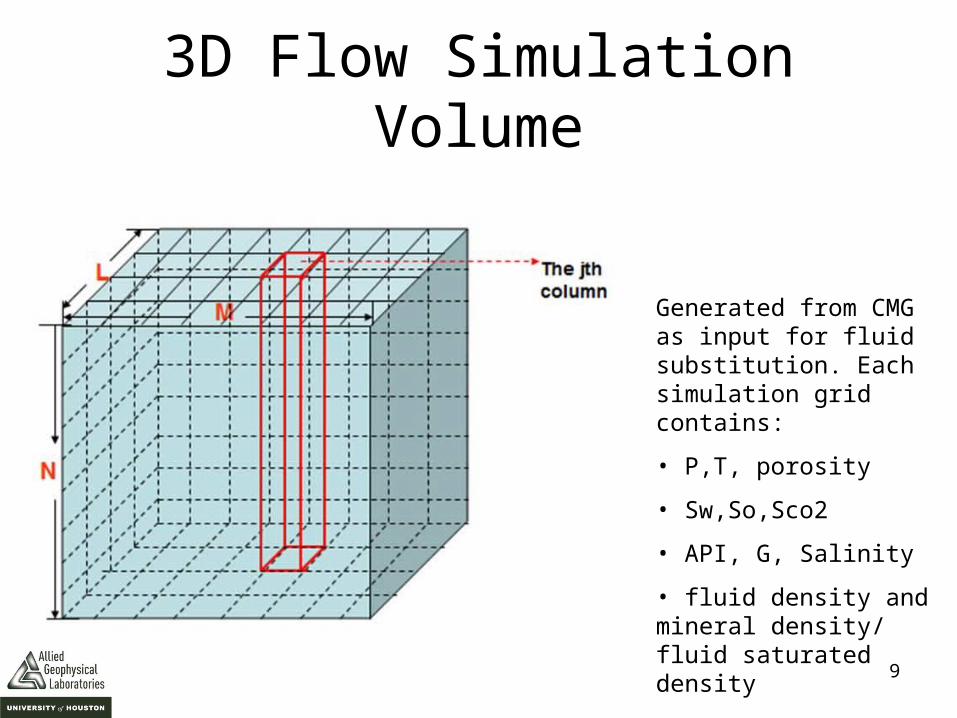
3D Flow Simulation Volume
Generated from CMG as input for fluid substitution. Each simulation grid contains:
• P,T, porosity
• Sw,So,Sco2
• API, G, Salinity
• fluid density and mineral density/ fluid saturated density
10
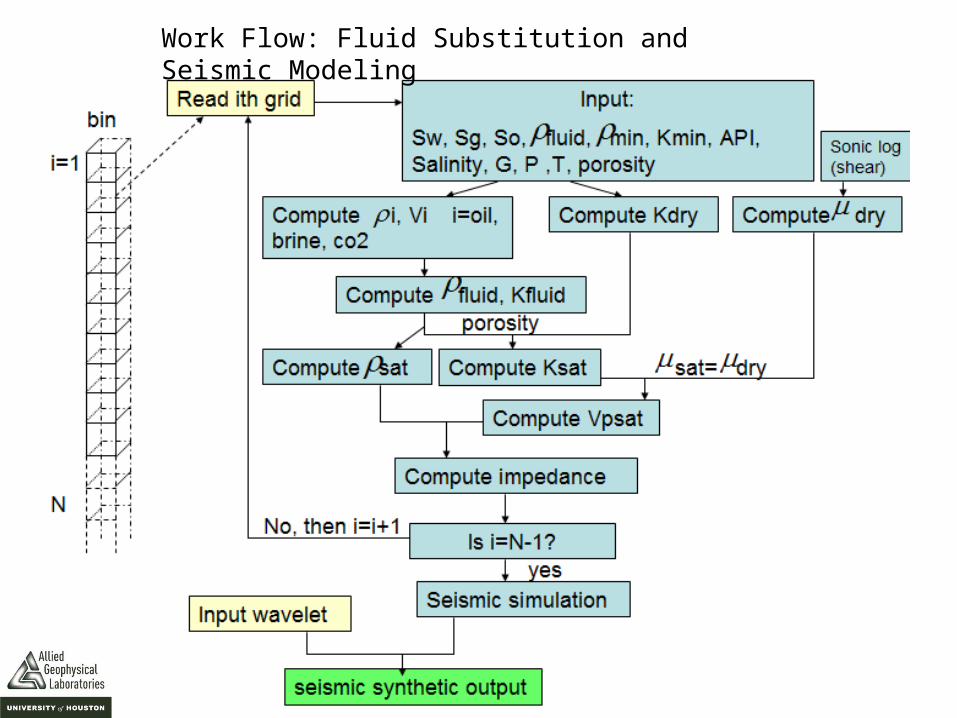
Work Flow: Fluid Substitution and Seismic Modeling
11
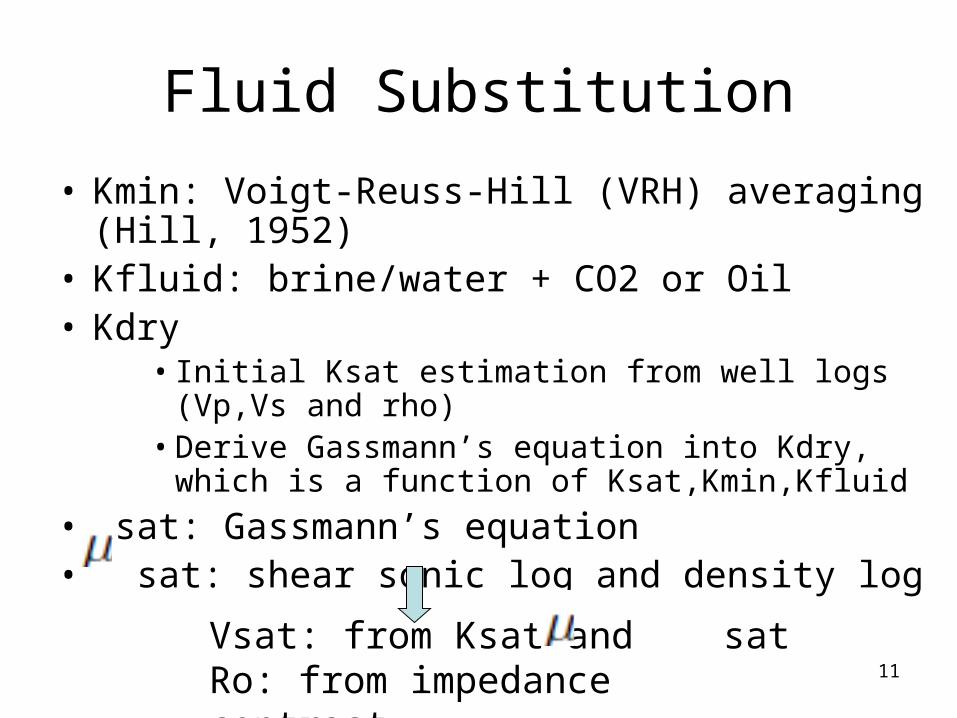
Fluid Substitution
• Kmin: Voigt-Reuss-Hill (VRH) averaging (Hill, 1952)
• Kfluid: brine/water + CO2 or Oil• Kdry
• Initial Ksat estimation from well logs (Vp,Vs and rho)• Derive Gassmann’s equation into Kdry, which is a
function of Ksat,Kmin,Kfluid
• Ksat: Gassmann’s equation• sat: shear sonic log and density log
Vsat: from Ksat and sat Ro: from impedance contrast
12
Preliminary Results
• Reflection coefficients variations versus changes of fluid properties
– Reflection Coefficient between Mississippian and Base of Pennsylvanian
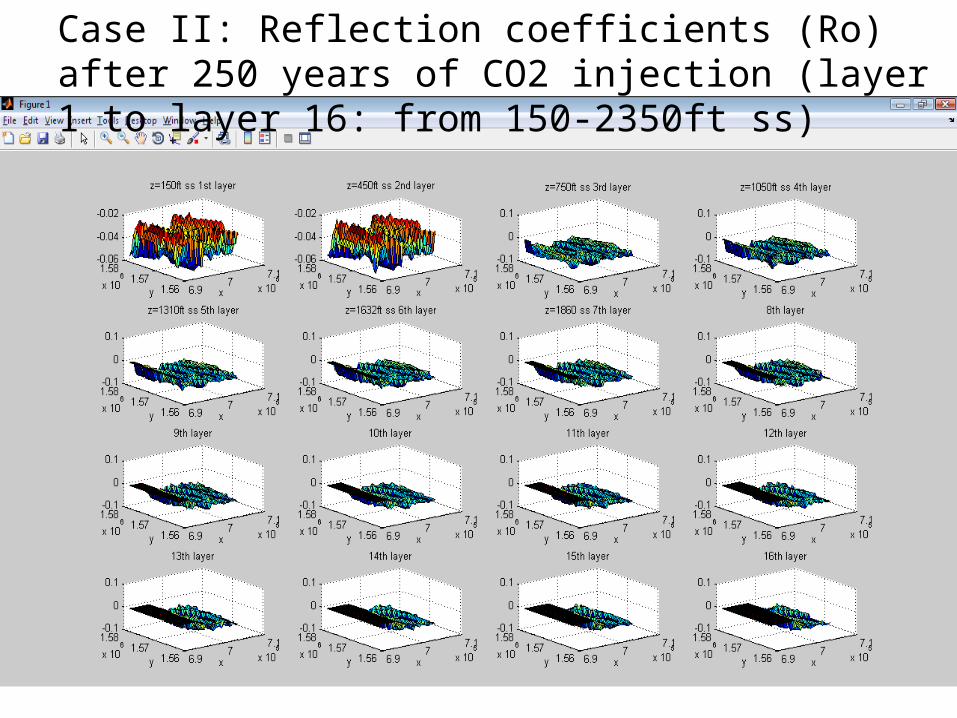
– Reflection Coefficients of flow simulated model after 250 years of CO2 injection
13
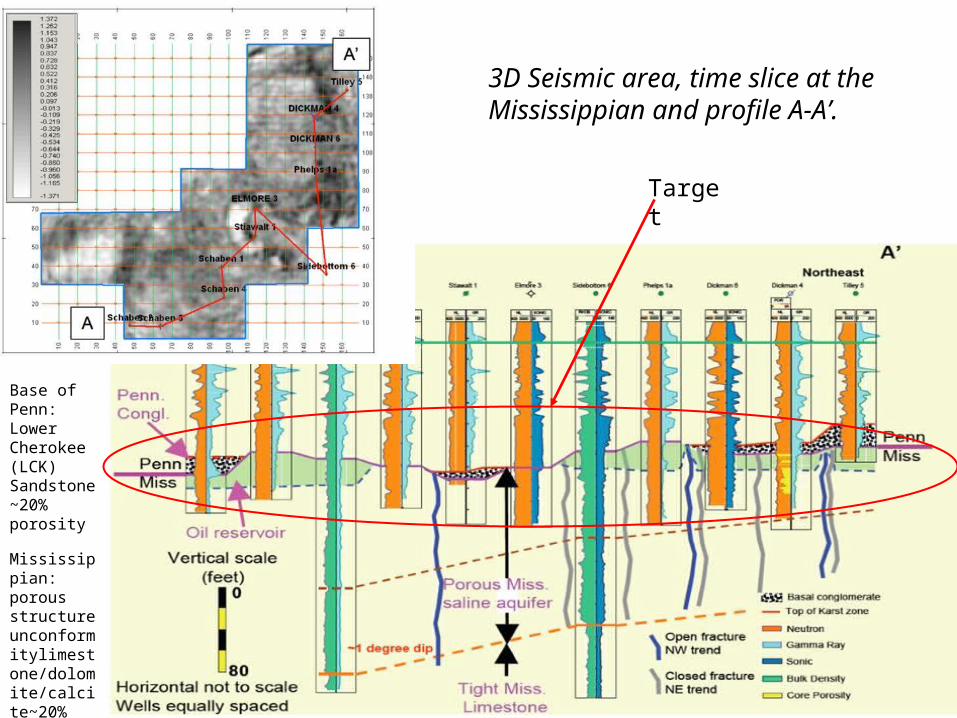
3D Seismic area, time slice at the Mississippian and profile A-A’.
Target
Base of Penn: Lower Cherokee (LCK) Sandstone~20% porosity
Mississippian: porous structure unconformitylimestone/dolomite/calcite~20% porosity
14
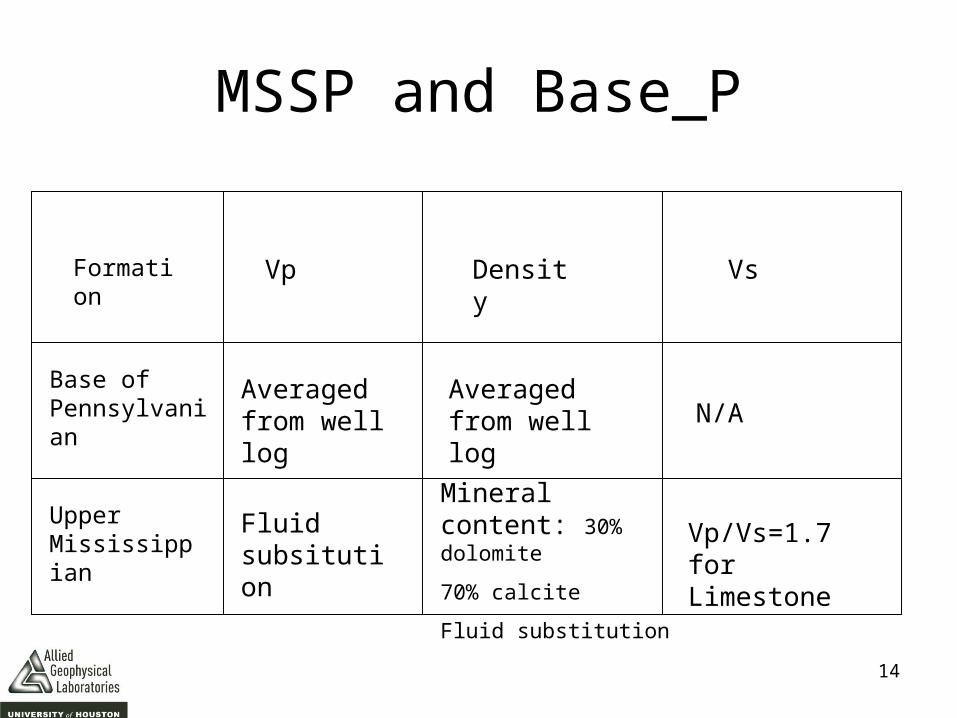
MSSP and Base_P
Formation
Base of Pennsylvanian
Vp Density Vs
Vp/Vs=1.7 for Limestone
Averaged from well log
Averaged from well log N/A
Upper Mississippian
Fluid subsitution
Mineral content: 30% dolomite
70% calcite
Fluid substitution
15
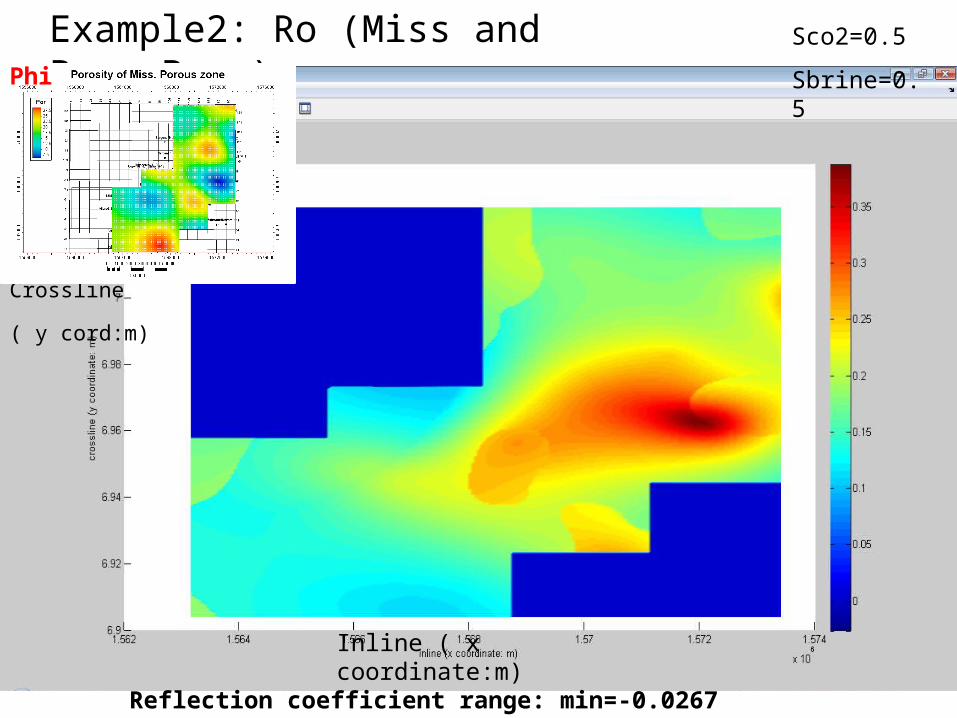
Crossline
( y cord:m)
Inline ( x coordinate:m)
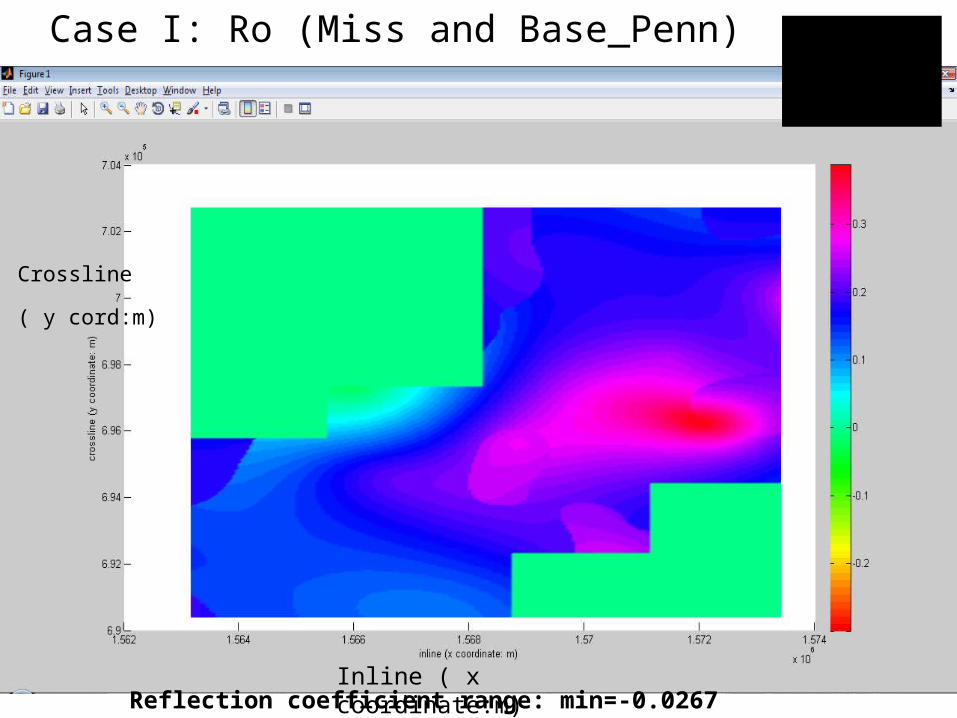
Sco2=0.5
Sbrine=0.5
Reflection coefficient range: min=-0.0267 max=0.3872
Example2: Ro (Miss and Base_Penn)Phi
16
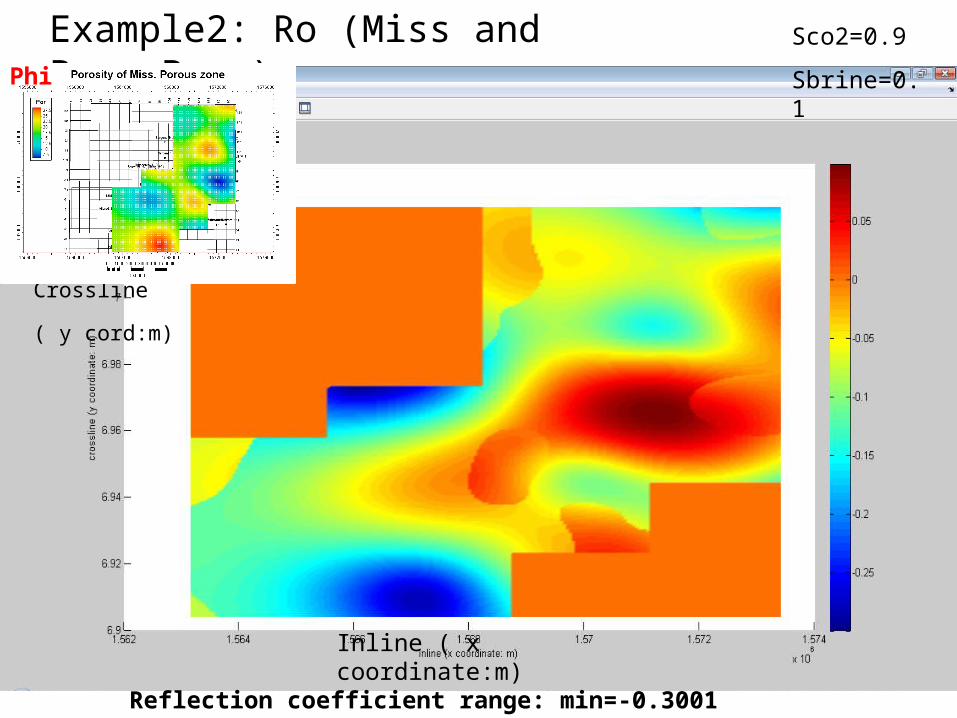
Crossline
( y cord:m)
Inline ( x coordinate:m)
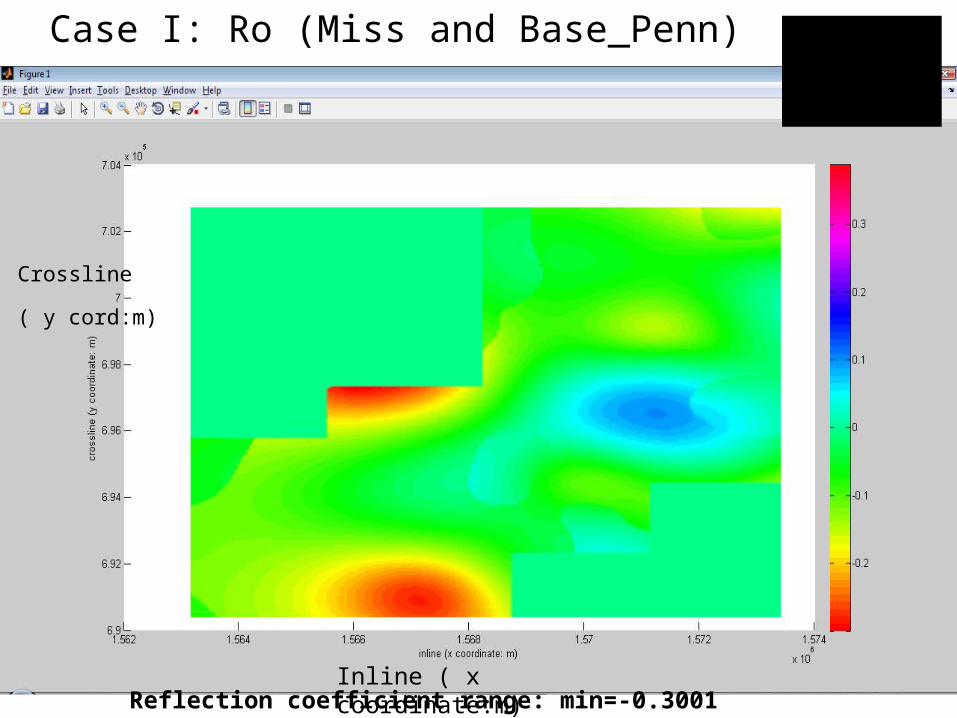
Sco2=0.9
Sbrine=0.1
Reflection coefficient range: min=-0.3001 max=0.0983
Example2: Ro (Miss and Base_Penn)Phi
17
Case II: Reflection coefficients (Ro) after 250 years of CO2 injection (layer 1 to layer 16: from 150-2350ft ss)
18
Future Work
• Seismic simulation with the convolution model as a start
• Incorporate full wave modeling into the seismic simulation
19
Acknowledgement
• Dr. Christopher Liner (PI)
• June Zeng (Geology)
• Po Geng (Flow simulation)
• Heather King (Geophysics)
• CO2 Sequestration Team

20
END
21
• Mississippian: porous structure unconformity• limestone/dolomite/calcite• ~20% porosity
• Base of Penn: • Lower Cherokee (LCK) Sandstone• ~20% porosity
Major Formations ( depleted oil Reservoir)
22Inline ( x coordinate:m)
Sco2=0.5
Sbrine=0.5
Reflection coefficient range: min=-0.0267 max=0.3872
Case I: Ro (Miss and Base_Penn)
Crossline
( y cord:m)
23
Sco2=0.9
Sbrine=0.1
Reflection coefficient range: min=-0.3001 max=0.0983
Case I: Ro (Miss and Base_Penn)
Inline ( x coordinate:m)
Crossline
( y cord:m)
24
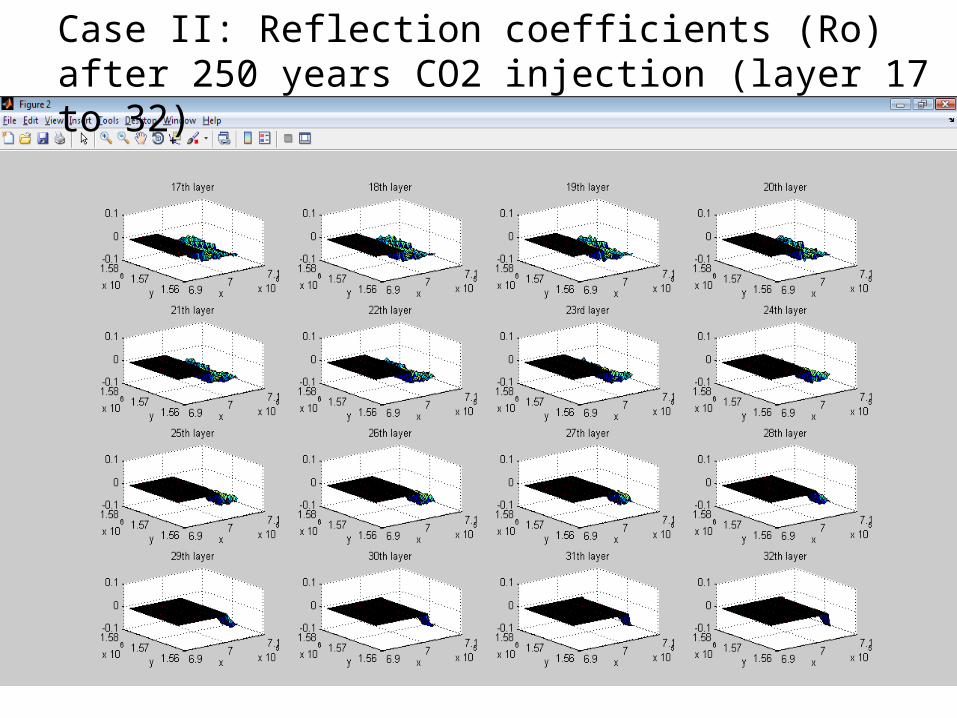
Case II: Reflection coefficients (Ro) after 250 years CO2 injection (layer 17 to 32)
25
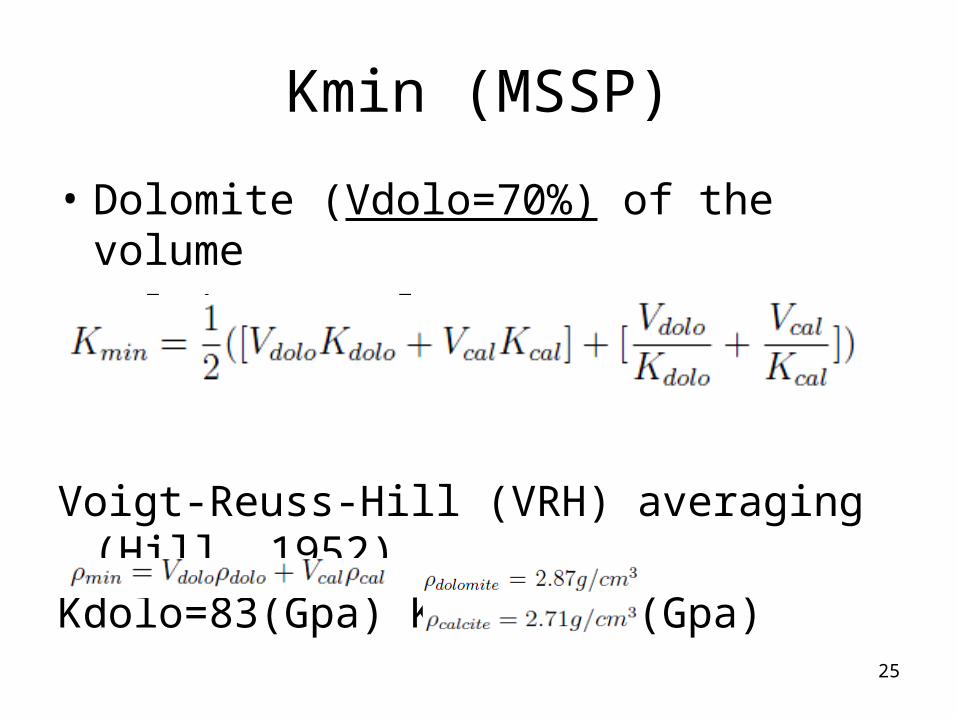
Kmin (MSSP)
• Dolomite (Vdolo=70%) of the volume
• Calcite (Vcal=30%)
Voigt-Reuss-Hill (VRH) averaging (Hill, 1952)
Kdolo=83(Gpa) Kcal=76.8(Gpa)
26
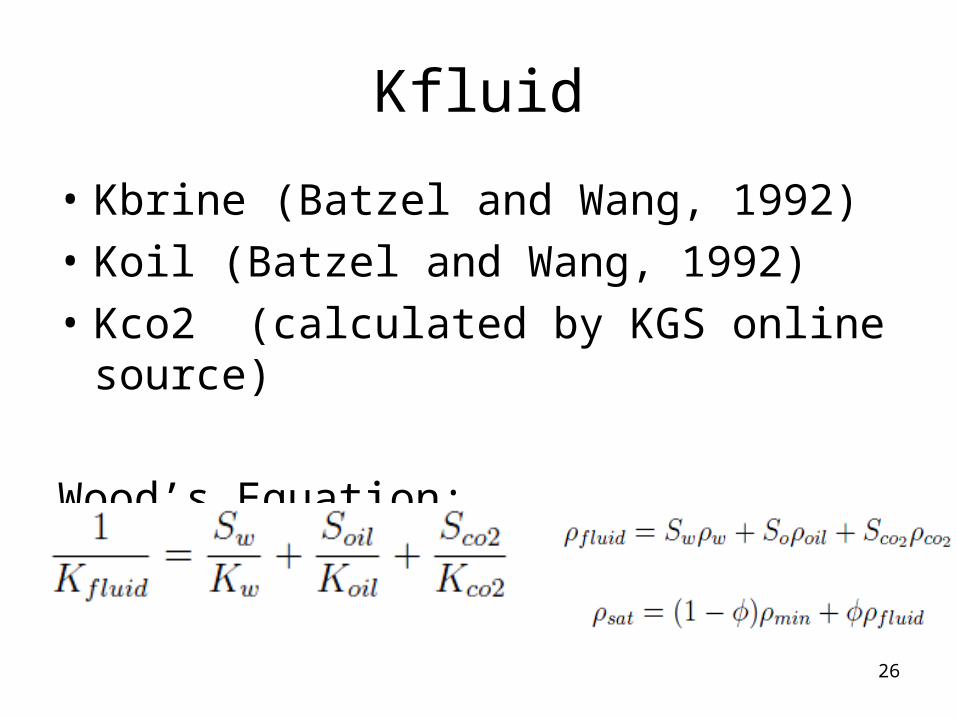
Kfluid
• Kbrine (Batzel and Wang, 1992)
• Koil (Batzel and Wang, 1992)
• Kco2 (calculated by KGS online source)
Wood’s Equation:
27
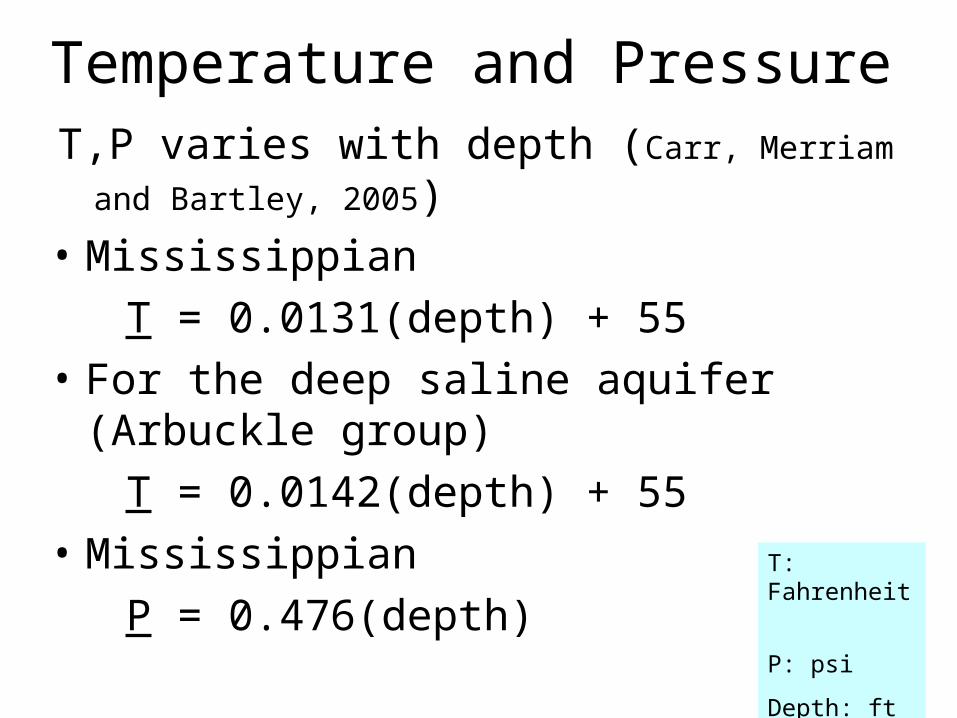
Temperature and Pressure T,P varies with depth (Carr, Merriam and Bartley,
2005)
• Mississippian
T = 0.0131(depth) + 55
• For the deep saline aquifer (Arbuckle group)
T = 0.0142(depth) + 55
• Mississippian
P = 0.476(depth)T: Fahrenheit
P: psi
Depth: ft
28
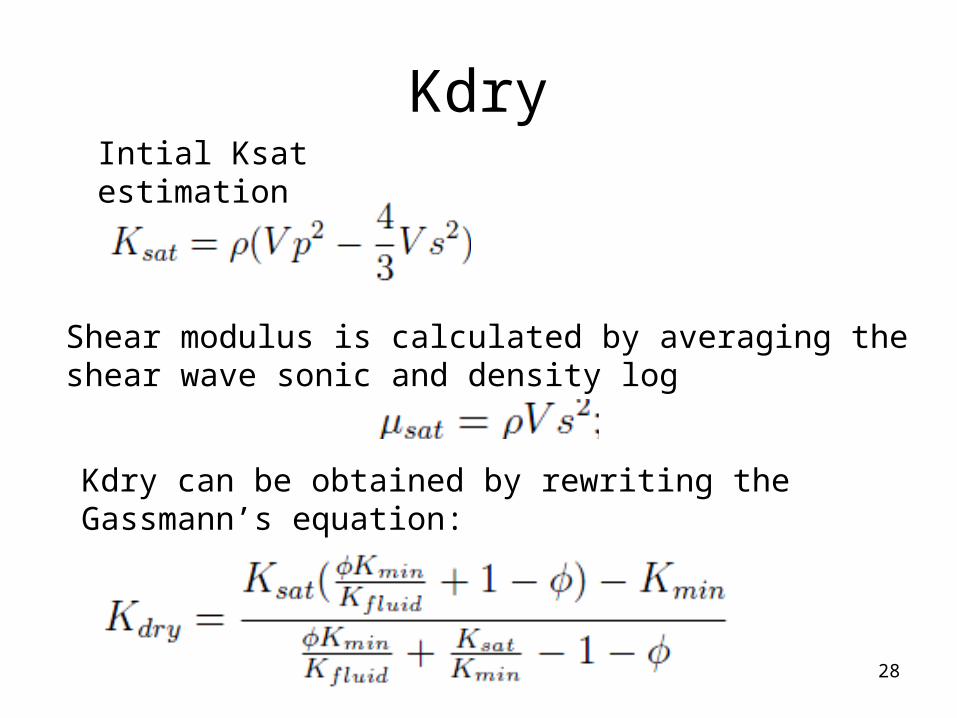
Kdry
Shear modulus is calculated by averaging the shear wave sonic and density log
Kdry can be obtained by rewriting the Gassmann’s equation:
Intial Ksat estimation
29
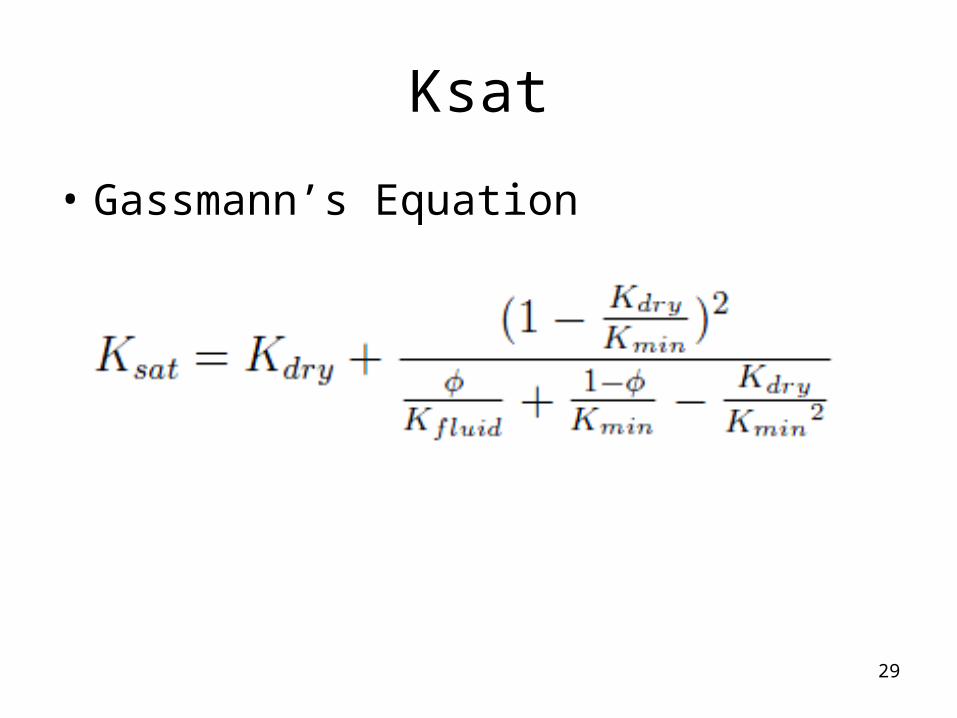
Ksat
• Gassmann’s Equation
30
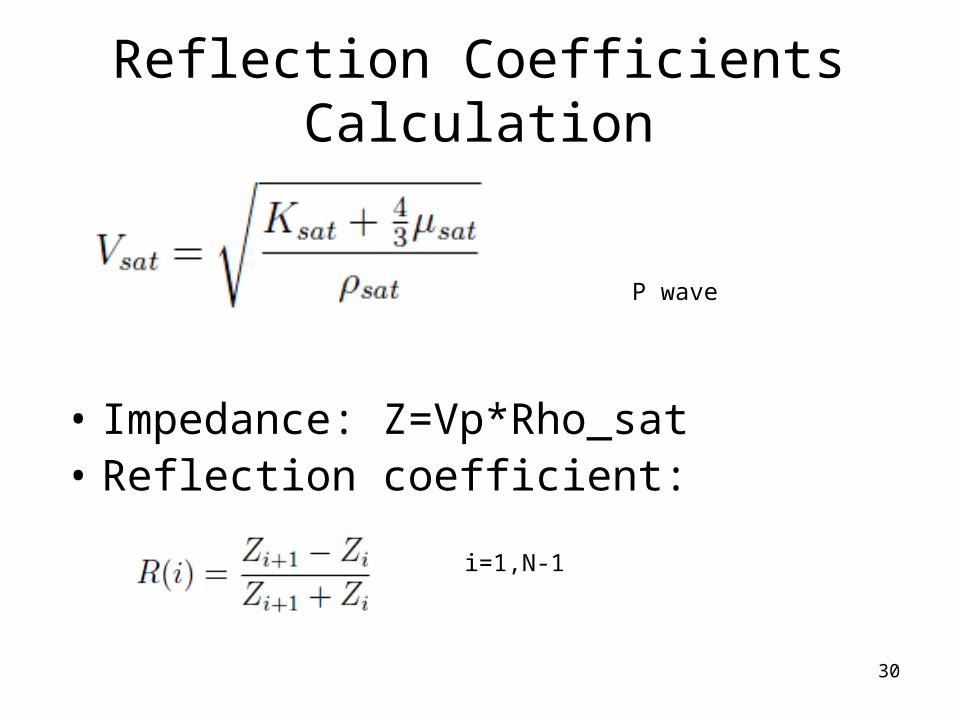
Reflection Coefficients Calculation
• Impedance: Z=Vp*Rho_sat• Reflection coefficient:
i=1,N-1
P wave
31
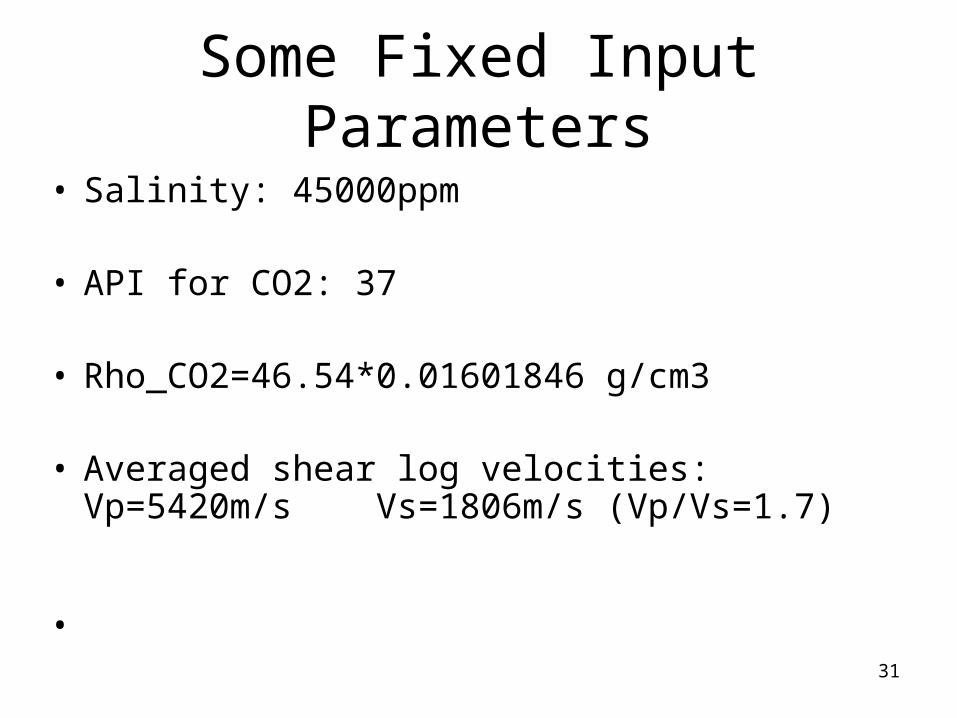
Some Fixed Input Parameters
• Salinity: 45000ppm
• API for CO2: 37
• Rho_CO2=46.54*0.01601846 g/cm3
• Averaged shear log velocities: Vp=5420m/s Vs=1806m/s (Vp/Vs=1.7)
•
32
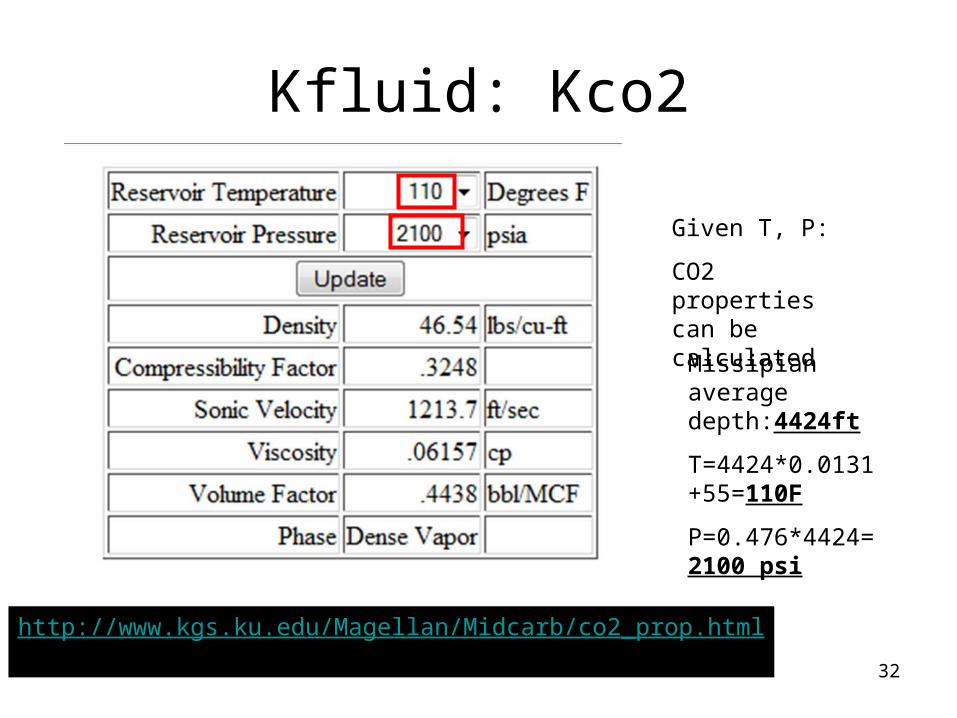
Kfluid: Kco2
http://www.kgs.ku.edu/Magellan/Midcarb/co2_prop.htmlBy Kansas geological survey
Given T, P:
CO2 properties can be calculated
Missipian average depth:4424ft
T=4424*0.0131+55=110F
P=0.476*4424= 2100 psi
33
4D Seismic Phases
• Phase I: understand the effect of reservoir fluid properties on the seismic response
• Phase II: apply the fluid changes to the depleted oil reservoir
• Phase III: apply the fluid substitution throughout the whole zone of interest
34
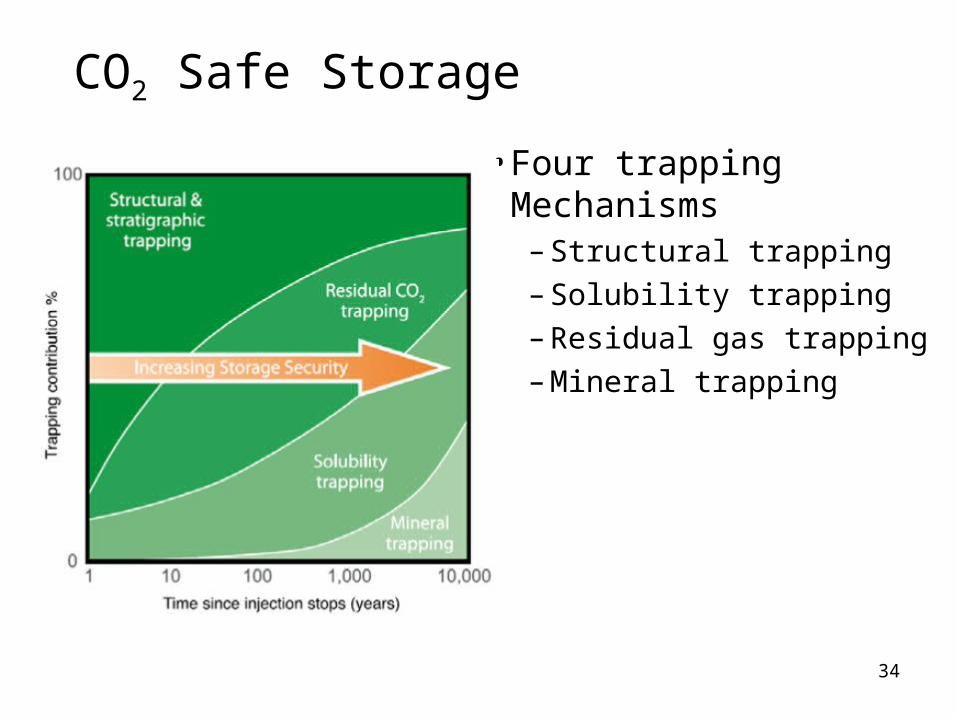
CO2 Safe Storage
• Four trapping Mechanisms
– Structural trapping
– Solubility trapping
– Residual gas trapping
– Mineral trapping