Embed Size (px)
Citation preview

7/27/2019 1 5kW HT PEFCstack With Composite MEA for CHP Application
http://slidepdf.com/reader/full/1-5kw-ht-pefcstack-with-composite-mea-for-chp-application 1/9
1.5 kWe HT-PEFC stack with composite MEA for
CHP application
G. Giacoppo*, O. Barbera, A. Carbone, I. Gatto, A. Sacca, R. Pedicini,E. Passalacqua
CNR-ITAE, via S. Lucia Sopra Contesse 5, 98126 Messina, Italy
a r t i c l e i n f o
Article history:
Received 31 October 2012
Received in revised form
25 February 2013
Accepted 2 April 2013
Available online 11 May 2013
Keywords:
Stack design and manufacturing
High temperature PEFC
Composite Nafion-YSZ MEAs
PEMFC stack
Flow field
a b s t r a c t
In this work, the performance of a High Temperature (HT) Polymer Electrolyte Fuel Cell
(PEFC) stack for co-generation application was investigated. A 3 kW power unit composed
of two 1.5 kW modules was designed, manufactured and tested. The module was
composed of 40 composite graphite cell with an active area of 150 cm2. Composite Mem-
brane Electrode Assemblies (MEAs) based on Nafion/Zirconia membranes were used to
explore the behavior of the stack at high temperature (120 C). Tests were performed in
both pure Hydrogen and H2 /CO2 /CO mixture at different humidification grad e, simulating
the exit gas from a methane fuel processor. The fuel cells stack has generated a maximum
power of 2400 W at 105 A with pure hydrogen and fully hydrated gases and 1700 W at 90 A
by operating at low humidity grade (95/49 RH% for H2 /Air). In case the stack was fed with
reformate simulated stream fully saturated, a maximum power of 2290 W at 105 A was
reached: only a power loss of 5% was recorded by using reformate stream instead of pure
hydrogen. The humidification grade of Nafion membrane was indicated as the main factor
affecting the proton conductivity of Nafion while the addition of the inert compound like
YSZ, did not affectthe electrochemical properties of the membrane but, rather has
enhanced mechanical resistance at high temperature.
Copyright ª 2013, Hydrogen Energy Publications, LLC. Published by Elsevier Ltd. All rights
reserved.
1. Introduction
The development of High temperature (HT) Polymer Electro-
lyte FuelCell (PEFC) could be an opportunity in Combined Heatand Power (CHP) systems to enhance the efficiency of a
decentralized power generation and heat supplying for
buildings. The main advantages with respect to other CHP
systems, consists in the high efficiency of the Fuel Cells (FCs)
under partial load condition, the modularity, the ability to
ensure substantial autonomy of the user and, last but not
least, the possible reduction of environmental pollution. In
the last decade, CHP system based on PEFC have been
intensively studied. Most of these are based on Nafion mem-
branes which generally operates at temperature below 100 C
(Low Temperature FC). Although many Low Temperature Fuel
Cell, based on the use of Nafion membranes, have been indi-cated to be reliably and highly efficient, in the view of a micro-
cogeneration distributed production, for domestic use [1], the
interest to develop high temperature PEFC has become more
relevant, due to undoubted advantages related to the use of
such technology. Indeed, the increasing of the operative
temperature of PEFC (>100 C) can also leads an improvement
of the kinetics of reaction occurring at cathode side, a better
tolerance of catalyst toward CO poisoning, an easier water
* Corresponding author. Tel.: þ39 (0) 90624294.E-mail address: [email protected] (G. Giacoppo).
Available online at www.sciencedirect.com
j o u r n a l h o m e p a g e : w w w . e l s e v i e r . c o m / l o c a t e / h e
i n t e r n a t i o n a l j o u r n a l o f h y d r o g e n e n e r g y 3 8 ( 2 0 1 3 ) 1 1 6 1 9 e1 1 6 2 7
0360-3199/$ e see front matter Copyright ª 2013, Hydrogen Energy Publications, LLC. Published by Elsevier Ltd. All rights reserved.
http://dx.doi.org/10.1016/j.ijhydene.2013.04.044

7/27/2019 1 5kW HT PEFCstack With Composite MEA for CHP Application
http://slidepdf.com/reader/full/1-5kw-ht-pefcstack-with-composite-mea-for-chp-application 2/9
management due to the lowering of liquid water inside the
cell and finally, a more efficient use of the waste heat. How-
ever, the implications of increasing the operative temperature
are numerous and mainly related to the electrolytic polymer
behavior. At high temperature and low humidity operation,
conventional Perfluorosulfonic Acid (PFSA) membrane dras-
tically dehydrates with negative consequences in terms of
conductivity. For example, the protonic conductivity of Nafion117 at 100% RH increases from 0.1 to 0.2 S cmÀ1 when the
temperature is raised from 30 to 85 C [2]. Different ap-
proaches have been proposed [3] to develop polymeric mem-
branes capable of maintaining high proton conductivity in
anhydrous environments. These can be classified in three
groups [4]: (1) modified PFSA membranes, which incorporate
hydroscopic oxides and solid inorganic proton conductors; (2)
sulfonated polyaromatic polymers and composite mem-
branes, such as polyether-ether-ketone (PEEK), sulfonated
polyether-ether-ketone SPEEK, sulfonated polysulfone SPSf,
and polybenzimidazole PBI; (3) acidebase polymer mem-
branes, such as phosphoric acid-doped PBI. PFSA membranes
may be easily modified by incorporating inorganic com-pounds, such as SiO2 [2,5] and TiO2 [6,7] into the hydrophilic
domains in order to form nano-composite materials to
improve their mechanical strength, the thermal stability and
the water retention capacity at elevated temperatures.
Another approach to stabilize the high temperature mem-
branes relies on the sulfonation of thermally resistant poly-
mers such as SPEEK [8], polyimides (PI) [9], and polysulfones
(PSF) [10]. A further approach to achieve high proton conduc-
tivity in membranes at high temperature, is to replace water
with proton transport assisting solvent possessing higher
boiling point, e.g., phosphoric acid orimidazoles. Poly(2,5-
benizimidazole) (ABPBI) membranes prepared by simulta-
neous doping and casting from a solution of poly(2,5- benz-imidazole)/phosphoric acid/methanesulfonic acid (MSA)
containing up to 3.0 H3PO4 molecules per ABPBI repeating unit,
has given a maximum conductivity of 1.5 Â 10À2 S cmÀ1 at
temperatures as high as 180 C under dry conditions [11].
Although several papers [12e16] are focused to the develop-
ment of high temperature stack, mainly regards to the use of
PBI membranes, only few works relate to the use of modified
PSFA membranes operating at 120 C.
In this paper a PEFC power unit, with a modular architec-
ture (two stacks of 1.5 kW each), is designed manufactured
and tested. All design steps are described considering the
stack sizing, the definition of active area and plate layout, the
design of both flow field and cooling path, the choice of gas-kets and the electrochemical components. Electrochemical
tests using a Nafion-YSZ membrane are reported by operating
both with H2 and simulated CH4 reformate stream.
2. Experimental
2.1. Membrane preparation
According to the preparation procedure elsewhere reported
[11,17], Nafion dry residue was obtained from a 5%wt/wt Ion
PowerÒ alcoholic Nafion solution, then it was dissolved in
dimethylacetamide (DMAc), to obtain a 20%wt/wt Nafion
solution, maintaining a constant temperature of 50 C in a
thermostatic bath.Successively, a 10% wt/wt of commercial
Yttria stabilized (8% molar ratio) Zirconia powder (ZSZ-Aldrich
Submicron 99.9% Purity) was added and uniformly dispersed
using an ultrasonic bath. Through a slow re-concentration at
80 C, under a magnetic stirring, a solution with suitable vis-
cosity was obtained and stratified on a glass sheet with the
Doctor Blade method. By this process, the slurrywas placed ona glass plane beyond a knife (doctor blade)whose distance
from substrate is controlled by a micrometric screw. Whena
constant relative movement was established between the
doctor blade and the substrate, the slurry was spread on the
substrate forming a thin film having a calibrated thickness.
The obtained film was dried for 3 h on a hot plate at 80 C until
the solvent was completely evaporated. At this point, the film
was detached from the glass using distilled water, then it was
dried between two sheets of blotting paper. Once well dried,
the membrane was thermally treated at 155 C to improve the
mechanical proprieties. The size of membrane was of
20 Â 25 cm with a nominal thickness of 50 mm. Finally, after a
chemical treatment in a 7 M HNO3 and in a 1 M H2SO4 solu-tions, the membrane was cropped to fit the bipolar plate
shape.
2.2. Electrodes and MEA preparation
Electrodes were prepared using the spray technique else-
where described [18]. A catalytic ink was obtained mixing a
50%wt/wtPt/C (Johnson Mattey) as an electro-catalyst with a
33%wt/wt Nafion alcoholic solution (Aldrich, 5%wt/wt), a 20%
wt/wt of ammonium carbonate (Carlo Erba) as a pore-former
and a 8%wt/wt of the same YSZ powder used for the mem-
branes casting. Then it was sprayed on a polytetrafluoro-
ethylene (PTFE) support and dried up to 125 C to obtain thecatalytic layer. The Catalyst Coated Membranes (CCMs) were
then assembled by transferring the so obtained catalytic layer
from the PTFE support to the previously cast composite
membranes, through a decal technique. The final Pt loading
was of0.5 mgcmÀ2 both for anode and cathode respectively. A
25 mm thick adhesive polyester sheet was used as a pre-gasket.
Finally, Gas Diffusion Layers (GDLs) with a micro porous layer
sprayed onto, were hot-pressed onto the CCM in order to
obtain the complete NZr-MEA. Then the MEA was shaped by a
CO2 laser device (Gravograph LS 100) to fit the bipolar plate
profile.
2.3. Fuel cell stack preliminary design
The 3.0 kW HT fuel cell power unit was designed as a scale up
of a 500 W fuel cell stack [19]. Stack design started from
electrochemical data obtained using a 25 cm2 single cell,
tested at 1.5bara, 120 C and RH with a stoichiometric ratio of
3/4 for H2 /Air. A current density of 500 mA cmÀ2 was selected
as design point which corresponds to 0.570 V. Considering the
above cited electrochemical data, a loss factor of 0.95 was
considered to take in to account the ohmic losses due to the
“stacking” effect. Following this criterion, a value of single cell
voltage of 0.543 V was determined. As consequence, starting
from the design parameter of the power unit (3.0 kW of design
power, 43.4 V of nominal voltage), the total current, the single
i n t e r n a t i o n a l j o u r n a l o f h y d r o g e n e n e r g y 3 8 ( 2 0 1 3 ) 1 1 6 1 9 e1 1 6 2 711620

7/27/2019 1 5kW HT PEFCstack With Composite MEA for CHP Application
http://slidepdf.com/reader/full/1-5kw-ht-pefcstack-with-composite-mea-for-chp-application 3/9
cell active area and the number of stack cells were algebrai-
cally calculated (Table 1).
The preliminary design phase was supported by a specif-
ically developed worksheet.
2.4. Stack architecture
2.4.1. Stack architecture definition
Generally, each system that is composed by n-base unit, can
be considered as a ‘modular system’. Here,two base unit of
1.5 kW (two stacks) were connected to achieve the requested
nominal power of 3.0 kW, while three base unit of 50 cm2
(three active area) were considered to obtain the calculatedactive area of 150 cm2. Conventional structure of a FC stack is
equivalent to a connection in series of several voltage sources,
each one with its own internal impedance, then the output
power of the stack is limited by the state of the weakest cell
[20]. The state of a cell can be determined from the voltage
across its terminals, which is affected by parameters such as
fuel, airpressure, and membrane water content.Furthermore,
if a stack is affected by malfunctioning or defective cells, the
whole system has to be taken out of service. In order to
mitigate such problems, the modular architecture was adop-
ted. Moreover concerning the application on the base of the
fuel cell stack was conceived, the modular device here pro-
posed can be more flexible with respect to thermal or elec-trical load requirements. As regard the internal distribution of
fluids, the gas and coolant distribution systems are formed by
two different subsystems, the first distributes the gases and
the water to each single cell (inlet and outlet gas and water
manifolds) while the second distributes the gases on the
active surface area (gases flow field) and the coolant on the
backside of the active area (coolant flow field). For a more
homogenous distribution of fluids, a Z-shape manifold was
used for the reactants and coolant distribution. The di-
mensions of its chosen rectangular crossesection was calcu-
lated by mean a semi-empirical method. This one takes into
account that manifold pressure drop has to be 2.5 times lower
than the flow field one (D pMan < D pFF /2.5) [21]. Counter currentflow arrangement for fuel and oxidant was used to maintain
as constants as possible the reactants concentration ratio
across the membrane. With this arrangement a more uniform
current density distribution together with a better perfor-
mance are assured [22].
2.4.2. Clamping system
The clamping system for fastening MEA, gaskets and bipolar
plates, has a primary importance in a fuel cell stack to ensure
the correct pressure distribution over the active area surface
and, consequently, a lower ohmic resistance in the current
transmission. All the cells were stacked together with steel tie
rods (10 Â M8) through two anodized aluminum clamping
plates. Tieerods were designed to guarantee a minimum
clamping pressure of about 20 kg/cm2 on the electrode sur-
face, with a torque of 4.2 Nm. This value of clamping pressure
was adoptedto limit the compression stress of graphite at 20%
of material compressive strength (100 kg/cm2).
2.4.3. Sealing system
Sealing system was realized by using conductive and non-conductive gaskets to assure internal fluid separation and
absence of external gas leakage. The non-conductive gaskets
were assembled between the MEA and the graphite plate (on
the flow field side) while the conductive gaskets were sand-
wiched betweentwo graphite plates on the cooling side. At the
interface between end plates of graphite and current collec-
tors the same conductive frame was interposed. Two insu-
lation plates were assembled between the current collectors
and the aluminum plates; these components ensure the
thermal and electrical insulation of the clamping plates.
2.4.4. Flow field design
The design of flow fieldhas a fundamental impact on the stackperformance since it affects i) the distribution of the reactants
on active surface area; ii) the mechanisms of liquid water
removal from the MEA; iii) the pressure drop of the stack. To
accomplish all these design issues, as first step a serpentine
flow path was chosen for reactants distribution. The geomet-
rical parameters of this flow path were calculated using an
own developed worksheet. This is able to determine the ribs
width, the channels width, the channels height, the number
of the parallel serpentines and the number of the serpentine
turn-backs. The serpentine flow filed parameters were calcu-
lated by considering two set of physical and geometrical
constraints. Indeed, the shape and the size of active area have
to be respected in accordance with the pressure drop and theratio between the electrical contact area and the total active
area [23]. The pressure drop considered as target for the
calculation was 100 mbar because, as pointed out in [24], this
value was found to be a good compromise between parasitic
losses and electrochemical performances. By respecting all
the constraints, two kinds of serpentines were found; this
result was possible by considering a different orientation of
the active area, as schematically reported in Fig. 1.
Table 2 reports the geometrical parameters for the two
possible solutions.
Table 1 e 3.0 kW fuel cell stack preedesign parameters.
Number of cells e 80
Single cell active area cm2 150
Power W 3250
Stack voltage V 43.4
Total current A 75
Fig. 1 e Possible serpentine flow field arrangements
depending on the active area orientation.
i n t e r n a t i o n a l j o u r n a l o f h y d r o g e n e n e r g y 3 8 ( 2 0 1 3 ) 1 1 6 1 9 e1 1 6 2 7 11621

7/27/2019 1 5kW HT PEFCstack With Composite MEA for CHP Application
http://slidepdf.com/reader/full/1-5kw-ht-pefcstack-with-composite-mea-for-chp-application 4/9
Considering that, the uniformity of reactants distribution
over the entire electrode surface is an essential requirement
for the flow field, the choice between the two solutions was
addressed by mean of computational fluid dynamics study.
Two different flow field configurations, were implemented as
computational domain as showed in Fig. 2 and solved using
Star CD eversion 4.12 with an expert module in PEFC (ESe
PEMFC version 2.4). The modeling and simulation calculations
were performed by a 4 core 3 GHz Opteron 64bit compute
node. It takes approximately 30 s to complete an iteration step
for the 3.5 million element grid used. The total time for
reaching a converging solution was about 15 h.
In general, the simulated PEFC consisted of two flow field
patterns (cathode at the top and anode at the bottom) sepa-
rated by GDLs and MEA. The properties and parameters used
in the simulation are reported in Table 3.
Operating conditions considered for this study were:dew
point of 120 C/120 C and stoichiometric of 2.0/2.0 for H2 and
air respectively, pressure of 3 bara, cell temperature of 120 C,
average current density (Iavg ) of 1 A cmÀ2. The electrochemical
model adopted and equations detail can be found in the
software manual [25].
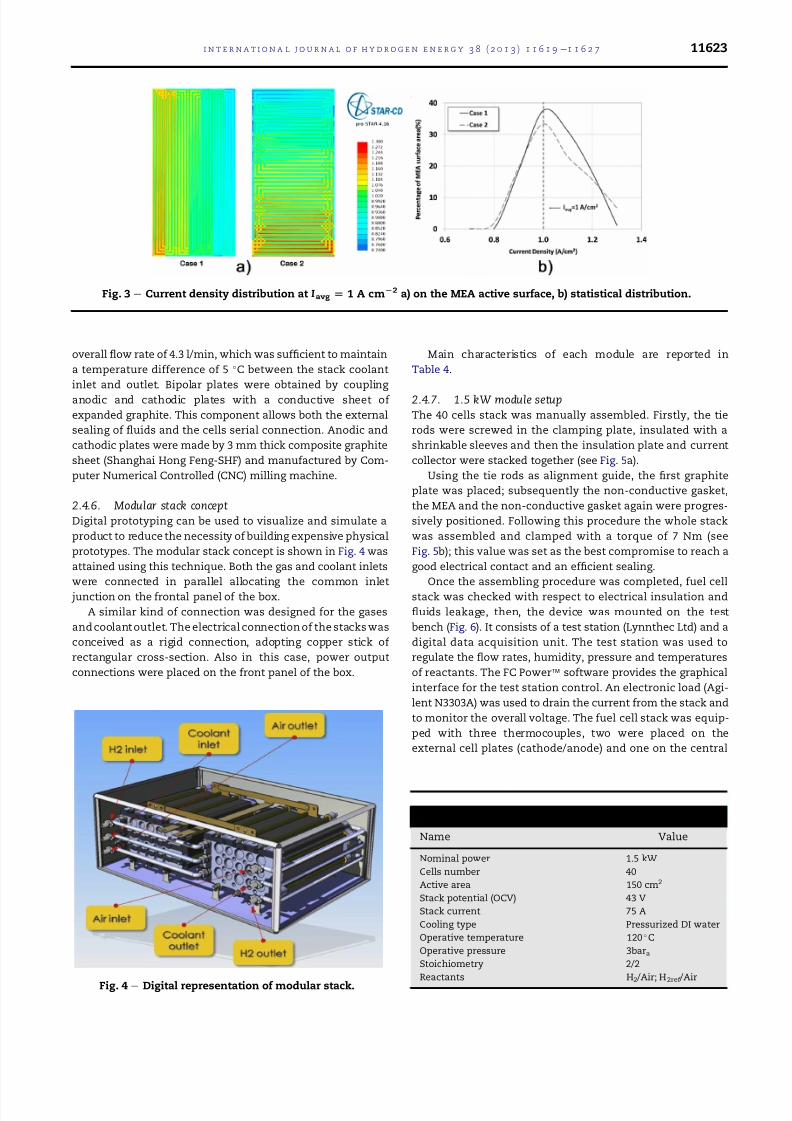
Fig. 3a shows the calculated current density distributions
referred to the MEA surface. For the two examined flow paths,
the current density distribution decreases from inlet toward
outlet due to the consumption of the reactants. For the case 1
the maximum and minimum current density were 1.24 and
0.76 A cmÀ2 respectively with a voltage of 0.424 V; for the case
2 the maximum and minimum current density were 1.29 and
0.74 A cmÀ2 respectively, with a voltage of 0.418 V. For both
cases, the obtained current density range and voltage were
similar, thus this information was not sufficient to establish
which flow field solution (case 1 or case 2) had the most uni-
formity in current density distribution.
Therefore, a statistical representation was used to
discriminate the best flow field. Fig. 3b presents the area dis-
tribution of current density values drawn from Fig. 3a. For the
distribution that has the best uniformity, the profile of area
distribution should show as narrow as possible with per-
centage of MEA surface area close to 100%. Indeed, Fig. 3b
shows that case 1 displays the most uniform distribution
because the percentage of MEA surface with a local current
density of 1 A cmÀ2 is about 38% instead of 33% for the case 2.
2.4.5. Bipolar plate layout
The bipolar plate layout was defined by adopting the following
criteria:
Active area was shared in three sub-flow fields.
An offset of 10 mm was set to house the gasket for the flow
field sealing.
Area of each manifold was calculated on the basis of
manifold pressure drop.
A second offset of 10 mm was set to seal the reactants and
cooling manifolds from the outside.
A serpentine cooling path was placed on the plates to
distribute the liquid coolant behind the active area. The
coolant flow field was designed to have a maximum pressure
drop of 10 mbar at 107 ml minÀ1 per cell, corresponding to an
Table 2 e Serpentine flow fields geometrical parameters.
Name Case 1 Case 2 Description
Lcos (mm) 0.90 1.00 Rib width
Lcan (mm) 0.90 1.3 Channel width
Ndiv 4 4 Number of parallel
serpentine
Hcan 0.90 0.60 Channel heightAmea (cm2) 50.0 50.0 Active area size
(rectangular shape)
Lmea (mm) 50 50 Active area length
Shape factor (b) 0.5 2 MEA width (b)/height
(h) ratio
Dp (mbar) 102.30 100.38 Calculated pressure
drop
Fig. 2e
Computational domains of the two analyzed solutions.
Table 3 e Simulation properties and parameters.
Name Value
Current collector
Thermal conductivity (W mÀ1 KÀ1) 40
GDL
Thickness after compressed (mm) 250
Permeability (m2
) 1.e-12Porosity after compressed (%) 70
Thermal conductivity (W mÀ1 KÀ1) 0.25
Membrane Electrode Assembly
Thickness (including catalyst layer) (mm) 50
Thermal conductivity (W mÀ1 KÀ1) 0.15
Dry membrane density (g cmÀ3) 2.0
Equivalent weight of dry membrane (g molÀ1) 1100
Cathode exchange current density (A cmÀ2) 0.02
Cathode transfer coefficient 0.6
Anode exchange current density (A cmÀ2) 0.2
Anode transfer coefficient 1.2
i n t e r n a t i o n a l j o u r n a l o f h y d r o g e n e n e r g y 3 8 ( 2 0 1 3 ) 1 1 6 1 9 e1 1 6 2 711622
7/27/2019 1 5kW HT PEFCstack With Composite MEA for CHP Application
http://slidepdf.com/reader/full/1-5kw-ht-pefcstack-with-composite-mea-for-chp-application 5/9
overall flow rate of 4.3 l/min, which was sufficient to maintain
a temperature difference of 5 C between the stack coolant
inlet and outlet. Bipolar plates were obtained by coupling
anodic and cathodic plates with a conductive sheet of
expanded graphite. This component allows both the external
sealing of fluids and the cells serial connection. Anodic and
cathodic plates were made by 3 mm thick composite graphite
sheet (Shanghai Hong Feng-SHF) and manufactured by Com-
puter Numerical Controlled (CNC) milling machine.
2.4.6. Modular stack concept
Digital prototyping can be used to visualize and simulate a
product to reduce the necessity of building expensive physical
prototypes. The modular stack concept is shown in Fig. 4 was
attained using this technique. Both the gas and coolant inlets
were connected in parallel allocating the common inlet
junction on the frontal panel of the box.
A similar kind of connection was designed for the gases
and coolant outlet. The electrical connection of the stacks was
conceived as a rigid connection, adopting copper stick of
rectangular cross-section. Also in this case, power output
connections were placed on the front panel of the box.
Main characteristics of each module are reported in
Table 4.
2.4.7. 1.5 kW module setup
The 40 cells stack was manually assembled. Firstly, the tie
rods were screwed in the clamping plate, insulated with a
shrinkable sleeves and then the insulation plate and current
collector were stacked together (see Fig. 5a).
Using the tie rods as alignment guide, the first graphite
plate was placed; subsequently the non-conductive gasket,
the MEA and the non-conductive gasket again were progres-
sively positioned. Following this procedure the whole stack
was assembled and clamped with a torque of 7 Nm (see
Fig. 5b); this value was set as the best compromise to reach a
good electrical contact and an efficient sealing.
Once the assembling procedure was completed, fuel cell
stack was checked with respect to electrical insulation and
fluids leakage, then, the device was mounted on the test
bench (Fig. 6). It consists of a test station (Lynnthec Ltd) and a
digital data acquisition unit. The test station was used to
regulate the flow rates, humidity, pressure and temperatures
of reactants. The FC Powerä software provides the graphical
interface for the test station control. An electronic load (Agi-
lent N3303A) was used to drain the current from the stack and
to monitor the overall voltage. The fuel cell stack was equip-
ped with three thermocouples, two were placed on the
external cell plates (cathode/anode) and one on the central
Fig. 4e
Digital representation of modular stack.
Table 4 e 1.5 kW stack electrical data.
Name Value
Nominal power 1.5 kW
Cells number 40
Active area 150 cm2
Stack potential (OCV) 43 V
Stack current 75 A
Cooling type Pressurized DI water
Operative temperature 120 C
Operative pressure 3baraStoichiometry 2/2
Reactants H2 /Air; H2ref /Air
Fig. 3 e Current density distribution at Iavg [ 1 A cmL2 a) on the MEA active surface, b) statistical distribution.
i n t e r n a t i o n a l j o u r n a l o f h y d r o g e n e n e r g y 3 8 ( 2 0 1 3 ) 1 1 6 1 9 e1 1 6 2 7 11623

7/27/2019 1 5kW HT PEFCstack With Composite MEA for CHP Application
http://slidepdf.com/reader/full/1-5kw-ht-pefcstack-with-composite-mea-for-chp-application 6/9
cell plate. Voltage probes were inserted in the cell external
side for measuring each cell potential. Reactant and coolant
stainless steel pipes were provided with thermocouples to
monitor inlet and outlet temperatures. A data acquisition unit
(National Instruments “Compact DAQ”) was connected to a
computer to collect all the acquired data (stack overall voltage
and current, single cell voltage and stack temperatures).
3. Results and discussion
The electrochemical characterization results of the developed
HT stack are mainly IeV curves, carried out at different
operative conditions. Indeed IeV curves offer an immediate
overview of the device performance, in terms of: a) maximum
power, b) activation losses, c)ohmic losses and d) concentra-
tion losses. Particularly, the effect of relative humidity, (100/
100, 95/49 RH% for fuel and air respectively) and the fuel
composition on fuel cell stack performance,was investigated.
Temperature and pressure were held constant during tests at
120 Cand3bara with fixed stoichiometric factor of 2/2 for fuel
and air respectively. Fuels used for the tests were: pure
hydrogen (99.9999%) and a CH4 reformate simulating mixture
(H2ref ) H2 /CO270%e30% containing about 100 ppm of CO.
3.1. Tests with pure hydrogen
Preliminary tests, with pure hydrogen differently saturated H2
stream, were performed to obtain a reference result. The po-
larization curves with pure hydrogen at high and low hu-
midity are shown in Fig. 7. The results show that the
performances of the HT fuel cell stack is strongly influenced
by the relative humidity of the reactants (H2 and air). With full
hydrated gases, a maximumpower (Pmax) ofabout2400 W was
reached at 105 A. Considering the nominal current density
value used to design the fuel cell stack (0.5 A cmÀ2 corre-
sponding to a total current of 75 A), a nominal power (Pnom) of
2100 W was obtained at 28 V. By decreasing of the humidifi-
cation level from 100/100 of RH% to 95/49 of RH% for H 2 /air
respectively, a decreasing of the maximum power to
1696 Wwas observed, in correspondence of 90 A instead of
Fig. 5e
Stack assembling procedure: a) intermediate step; b)final setup.
Fig. 6 e The assembled fuel cell stack mounted on the test
bench.
Fig. 7 e Effect of relative humidity on IeV curve for FC stack
fed with pure hydrogen.
i n t e r n a t i o n a l j o u r n a l o f h y d r o g e n e n e r g y 3 8 ( 2 0 1 3 ) 1 1 6 1 9 e1 1 6 2 711624

7/27/2019 1 5kW HT PEFCstack With Composite MEA for CHP Application
http://slidepdf.com/reader/full/1-5kw-ht-pefcstack-with-composite-mea-for-chp-application 7/9
105 A. At the nominal current of 75 A, a power of 1650 W was
recorded. Therefore, the Pmax and Pnom decreased by 29.2 and
21.4% respectively. Furthermore, as can be observed from
Fig. 7, the ohmic losses in the linear region of IeV curve in-
creases. This effect causes a decreasing of difference between
Pmax and Pnom values.
To better highlight how the overall stack performance is
affected by the humidification, a theoretical concise indicator(power decay) was defined to compare results obtained at high
and low humidity by feeding the stack with pure hydrogen.
It is defined as:
Pdh ¼ÂPHuðIÞ À PLuðIÞ=PHuðIÞ
ÃÂ 100
where:
PHu(I) represents the power recorded as function of current
with fully hydrated gases and PLu(I) represents the power
recorded with low RH. As shown in Fig. 8, the power decay
increases as the current increases. Such behavior can be
explained considering that, the decreasing of water content in
the inlet stream provokesa loss of proton conductivity due to
the dehydration of membrane. Moreover, by lowering the
water content in the inlet gas stream, the total mass flow rate
diminishes and consequently the total pressure drop. As
already reported [26], there is a strong dependence between
the pressure drop along the flow path andthe convective mass
flow towards the electrode. Thus, the reduction of the total
pressure drop causes the reduction of reactant flux through
the gas diffusion layer.
3.2. Tests with reformate simulating stream
The employment of a fuel cell stack in CHP system often
impose that the stack be fed by hydrogen rich streams,
generally coming from a reformer. To investigate the behavior
of stack using a reformate fuel, as previously stated, a gas
mixture (H2ref ) H2 /CO270%e30% containing about 100 ppm of
CO, to simulate a gas stream coming from a reformer was
used.
Fig. 9 shows the IeV curves obtained in the following
operative conditions: 120 C,3bara, H2ref /air stoichiometry 2.0/
2.0, at two RH% 100/100, 95/49 for H2ref and air respectively.
Also in this case, the performance of the HT fuel cell stack
was strongly influenced by the relative humidity of the inlet
stream. As stated before, the effect of membrane dehydrationled to the lowering of voltage and power for a given current,
especially in the ohmic and diffusion controlled regions. In
this case, a maximum power of about 2300 W was achieved at
105 A, and a nominal power of 1980 W was obtained at 75 A
(nominal current). In the case of low humidification, the Pmax
decreases by 31.8% (1560 W), overlaps Pnom and the limiting
current dramatically decreases. In Fig. 10, a comparison be-
tween the power decay, calculated in the case of pure
hydrogen and reformate mixture feeding, is shown. It can be
noticed that, power decay linearly increases in the range
0e75 A for both pure hydrogen and reformate stream. At
current higher than 75 A, the loss of power became signifi-
cantly higher in case of reformate stream.The power decay was also calculated both at high and low
humidification levels as follows:
Pdf ¼ÂÀ
PH2ðIÞ À PH2ref ðIÞÁ
PH2ðIÞÃ
 100
where:
PH2(I) represents the power recorded as function of current
by feeding the stack with pure hydrogen and PH2ref (I) repre-
sents the power recorded with H2ref stream. By this equation,
the evaluation of the influence of fuel composition on power
Fig. 8 e Effect of humidity on power decay (humidified pure
hydrogen feeding).
Fig. 9 e Effect of relative humidity on IeV curve for FC stack
fed with reformate stream.
Fig. 10 e Comparison of Power decay as a function of the
fuel type.
i n t e r n a t i o n a l j o u r n a l o f h y d r o g e n e n e r g y 3 8 ( 2 0 1 3 ) 1 1 6 1 9 e1 1 6 2 7 11625

7/27/2019 1 5kW HT PEFCstack With Composite MEA for CHP Application
http://slidepdf.com/reader/full/1-5kw-ht-pefcstack-with-composite-mea-for-chp-application 8/9
loss was possible, at same humidification level. As shown in
Fig. 11, when the stack works with low humidification level
streams, the Pdf slightly rises from 0 to 5% about, in the rangeof 0e75 A and rapidly increases (up to 50%) at higher currents.
On the contrary, as the current changes, if the inlet reactant
contain high level of humidity, the trend of power decay re-
mains quite constant and always below 10%.
These results clearly show that the membrane is able to
operate with reformate stream without significant power loss
in case of high humidity. On the contrary, the power losses
became more evident when the stack was fed with low hu-
midification stream. This implies that the humidification level
has a higher impact on the FC power performance rather than
the type of fuel, due to the fact that the conductivity of Nafion
based membrane is strongly affected by its hydration level.
4. Conclusions
In this paper a 3 kW power unit composed by two 1.5 kW
modules was designed and testedwiththe aim to evaluate the
feasibility of an integrated HT-PEFC system for co-generation
application.
By computational fluid dynamic study the best flow field
geometry, ensuring the higher current density, was selected.
The 1.5 kW stack has generated a power close to 2400 W at
105 A by operating at 3 bara and 120 C with fully hydrated
pure hydrogen. The power lowered to 1696 kW at 90 A by using a low humidified H2 stream. In case reformate stream was fed
instead of pure hydrogen, only a slight difference in terms of
power generation was observed (2300 against 2400 kW) at high
humidification level. It confirms that the as produced reformate
stream contains sufficient water to maintain a high grade of
membrane hydration which is essential to ensure high proton
conductivity. The addition of YSZ inert material to the Nafion
membrane allowed enhancing its mechanical resistance
without affecting the electrochemical properties of mem-
brane, even operating at high temperature (120 C).
In conclusion, in this study the feasibility of a fuel cell stack
working at high temperature (120 C) and based on a modified
Nafion membrane, for CHP purposes, is demonstrated.
Acknowledgments
The presented research work was financially supported by the
2006e2009 Program Agreement between the Italian Economic
Development Minister (MSE) and National Research Council
(CNR) in the framework of Italian Research Found for the
Electric System (Research line-Development of Materials andComponents, Design, Demonstration and Optimization of FC
Systems for Co-Generative Applications).
r e f e r e n c e s
[1] Briguglio N, Ferraro M, Brunaccini G, Antonucci V. Evaluationof a low temperature fuel cell system for residential CHP.International Journal of Hydrogen Energy 2011;36:8023e9.
[2] Ma C, Zhang L, Mukerjee S, Ofer D, Nair B. An investigation of proton conduction in select PEM’s and reaction layerinterfaces-designed for elevated temperature operation.
Journal of Membrane Science 2003;219:123e36.[3] Alberti G, Casciola M, Palombari R. Inorgano-organic proton
conducting membranes for fuel cells and sensors at mediumtemperatures. Journal of Membrane Science 2000;172:233e9.
[4] Li Q, He R, Jensen J, Bjerrum N. Approaches and recentdevelopment of polymer electrolyte membranes for fuel cellsoperating above 100C. Chemistry of Materials2003;15:4896e915.
[5] Senthil Velan V, Velayutham G, Hebalkar N,Dhathathreyan K. Effect of SiO2 additives on the PEM fuel cellelectrode performance. International Journal of HydrogenEnergy 2011;36:14815e22.
[6] Shao Z, Xu H, Li M, Hsing I. Hybrid Nafioneinorganic oxidesmembrane doped with heteropolyacids for high temperatureoperation of proton exchange membrane fuel cell. Solid State
Ionics 2006;177:779e85.[7] Sacca A, Carbone A, Passalacqua E, D’Epifanio A, Licoccia S,
Traversa E, et al. NafioneTiO2 hybrid membranes formedium temperature polymer electrolyte fuel cells (PEFCs).
Journal of Power Sources 2005;152:16e21.[8] Carbone A, Pedicini R, Portale G, Longo A, D’Ilario L,
Passalacqua E. Sulphonated poly(ether ether ketone)membranes for fuel cell application: thermal and structuralcharacterization. Journal of Power Sources 2006;163:18e26.
[9] Guo X, Fang J, Watari T, Tanaka K, Kita H, Okamoto K. Novelsulfonated polyimides as polyelectrolytes for fuel cellapplication 2 synthesis and proton conductivity of polyimides from 9,9-bis(4-aminophenyl)fluorene-2,7-disulfonic acid. Macromolecules 2002;35:6707e13.
[10] Pedicini R, Carbone A, Sacca A, Gatto I, Di Marco G,
Passalacqua E. Sulphonated polysulphone membranes formedium temperature in polymer electrolyte fuel cells (PEFC).Polymer Testing 2008;27:248e59.
[11] Asensio J. Proton-conducting membranes based on poly(2,5-benzimidazole) (ABPBI) and phosphoric acid prepared by directacid casting. Journal of Membrane Science 2004;241:89e93.
[12] Siegel C, Bandlamudi G, Heinzel A. Systematiccharacterization of a PBI/H3PO4 solegelmembranedmodeling and simulation. Journal of PowerSources 2011;196:2735e49.
[13] Javier Pinar F, Canizares P, Rodrigo M, Ubeda D, Lobato J.Scale-up of a high temperature polymer electrolytemembrane fuel cell based on polybenzimidazole. Journal of Power Sources 2011;196:4306e13.
[14] Lee H, Kim B, Lee D, Park S, Kim Y, Lee J, et al. Demonstration
of a 20 W class high-temperature polymer electrolyte fuel
Fig. 11 e Comparison of power decay as function of the
humidity.
i n t e r n a t i o n a l j o u r n a l o f h y d r o g e n e n e r g y 3 8 ( 2 0 1 3 ) 1 1 6 1 9 e1 1 6 2 711626

7/27/2019 1 5kW HT PEFCstack With Composite MEA for CHP Application
http://slidepdf.com/reader/full/1-5kw-ht-pefcstack-with-composite-mea-for-chp-application 9/9
cell stack with novel fabrication of a membrane electrodeassembly. International Journal of Hydrogen Energy2011;36:5521e6.
[15] Li Q, Hel R, Jensenl J, Bjerruml N. PBI-based polymermembranes for high temperature fuel cellsepreparation,characterization and fuel cell demonstration. Fuel Cells2004;4:147e59.
[16] Radu R, Zuliani N, Taccani R. Design and experimental
characterization of a high-temperature proton exchangemembrane fuel cell stack. Journal of Fuel Cell Science andTechnology 2011;8:0510071e5.
[17] Sacca A, Gatto I, Carbone A, Pedicini R, Passalacqua E.ZrO2eNafion composite membranes for polymer electrolytefuel cells (PEFCs) at intermediate temperature. Journal of Power Sources 2006;163:47e51.
[18] Lufrano F, Passalacqua E, Squadrito G, Patti A, Giorgi L.Improvement in the diffusion characteristics of low Pt-loaded electrodes for PEFCs. Journal of AppliedElectrochemistry 1999;29:445e8.
[19] Giacoppo G, Carbone A, Gatto I, Sacca A, Pedicini R,Barbera O, et al. Stack operation using compositemembrane-electrodes assemblies at 120C. Journal of FuelCell Science and Technology 2012;9:0310051e8.
[20] PalmaL,EnjetiP.Amodularfuelcell,modularDCeDCconverterconcept for high performance and enhanced reliability. IEEETransactions on Power Electronics 2009;24:1437e43.
[21] Barbir F. PEM fuel cells theory and practice. 1st ed. AcademicPress; 2005.
[22] Alaefour I, Karimi G, Jiao K, Li X. Measurement of currentdistribution in a proton exchange membrane fuel cell withvarious flow arrangementsea parametric study. Applied
Energy 2012;93:80e9.[23] Squadrito G, Barbera O, Giacoppo G, Urbani F, Passalacqua E.
Polymer electrolyte fuel cell stack research anddevelopment. International Journal of Hydrogen Energy2008;33:1941e6.
[24] Squadrito G, Giacoppo G, Barbera O, Urbani F,Passalacqua E, Borello L, et al. Design and development of a7kW polymer electrolyte membrane fuel cell stack for UPSapplication. International Journal of Hydrogen Energy2010;35:9983e9.
[25] ES pemfc version 2.40 user guide. CD-Adapco; 2010.[26] Squadrito G, Barbera O, Giacoppo G, Urbani F, Passalacqua E.
Computer aided fuel cell design and scale-up, comparisonbetween model and experimental results. Journal of AppliedElectrochemistry 2006;37:87e93.
i n t e r n a t i o n a l j o u r n a l o f h y d r o g e n e n e r g y 3 8 ( 2 0 1 3 ) 1 1 6 1 9 e1 1 6 2 7 11627