Embed Size (px)
DESCRIPTION
Â
Citation preview
Not ActualStudent Data
Goal PlanningAcademic Dashboard Operational DashboardCampus Information
Staff List Teacher List Students by Grade My Student ListsStudents byDemographic
Campus Information
Mountains High School
Mountains High School
Jeff D. Mckay
Angela ShadeVanessa B. Warner
Sharon I. Halcomb
Total number of students
Late Enrollment
MinimumRecommendedDistinguished
PrincipalAssistant PrincipalAssistant Principal
Holly Q. OconnerAssistant PrincipalAssistant PrincipalAssistant Principal
9th Grade10th Grade11th Grade12th Grade
2011 AccountabilityRating
Carlye C. Arredondo
Female
Hispanic/Latino
Asian
White Two or More
Student DemographicsGender
Ethnicity
Bilingual ProgramCareer and Technical EducationEnglish as a Second Language
Students by Program
Other Student Information
Free or Reduced Price LunchEligible
Administration
Accountability
Gifted/Talented
Title I ParticipantSpecial Education
Economically DisadvantagedHomelessImmigrant
Over Age Migrant Limited English Proficiency
At Risk
51.1%Male 48.9%
54.9%
American Indian - Alaskan NativeRace
0.4%
1.0%15.5%
24.6%
1.8%
Black - African American
260 1st StLittle Rock, AR 72204(555) 555-0000 main line(555) 555-0001 fax
High School Graduation Plan
Campus Population714209188147170
21.1%
10.2%
89.5%0.3%
0.8%
72.5%
1.5%
79.6%
1.8%
18.1%
4.8%
81.0%79.6%
4.9%0.3%
2.0%
0.8%43.6%
@2012 Michael & Susan Dell Foundation. All rights reserved.[LIMITED PRODUCTION RELEASE] Anonymized student data.
Gifted & Talented ESL, LEP or Bilingual Late Enrollment
Below Goal Met Goal No Change GettingBetter
GettingWorse
Partial Transcript Test Accommodation Special Education or 504 Designation G S L E P A
Little Rock ISD Mountains High School
EXPORT ALL PRINT SUPPORT LOG OUT
Search
@2012 Michael & Susan Dell Foundation. All rights reserved.[LIMITED PRODUCTION RELEASE] Anonymized student data.
Gifted & Talented ESL, LEP or Bilingual Late Enrollment
Below Goal Met Goal No Change GettingBetter
GettingWorse
Partial Transcript Test Accommodation Special Education or 504 Designation G S L E P A
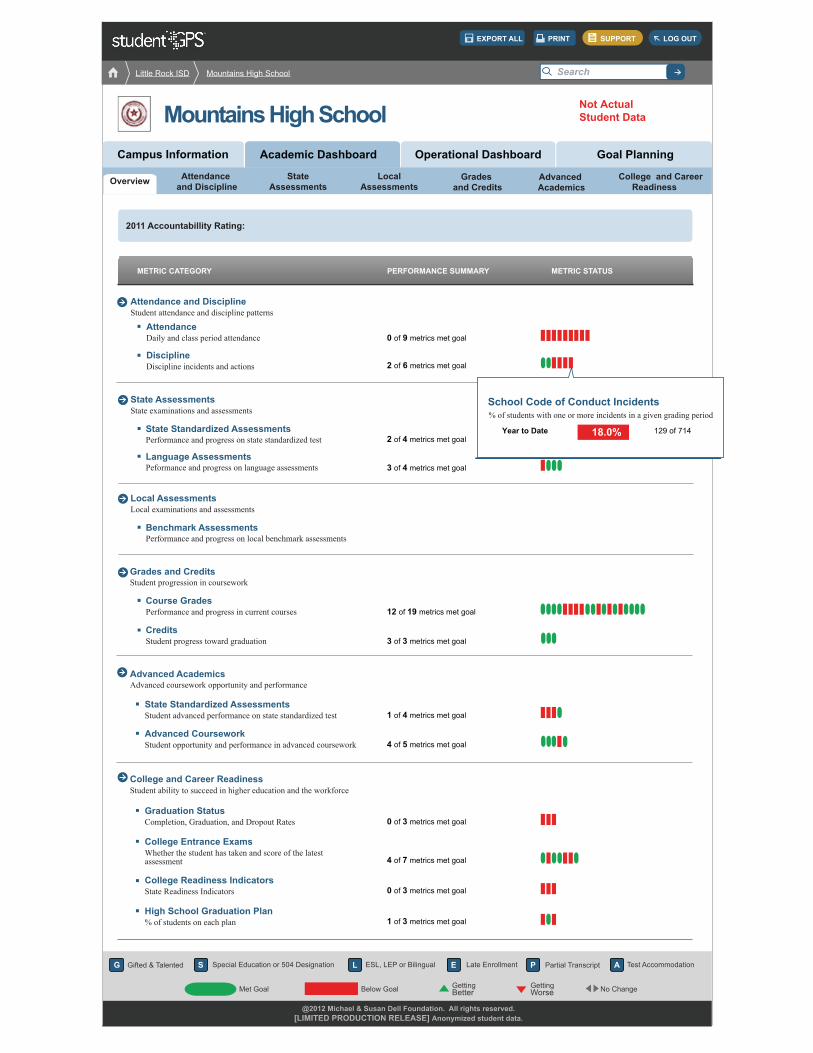
METRIC CATEGORY PERFORMANCE SUMMARY METRIC STATUS
Student ability to succeed in higher education and the workforceCollege and Career Readiness
Advanced coursework opportunity and performanceAdvanced Academics
Student progress toward graduationCredits
Performance and progress in current coursesCourse Grades
Student progression in courseworkGrades and Credits
Performance and progress on state standardized testState Standardized Assessments
Peformance and progress on language assessmentsLanguage Assessments
State examinations and assessmentsState Assessments
Discipline incidents and actionsDiscipline
Daily and class period attendance 0 of 9 metrics met goal
2 of 4 metrics met goal
3 of 4 metrics met goal
Performance and progress on local benchmark assessmentsBenchmark Assessments
Local examinations and assessmentsLocal Assessments
12 of 19 metrics met goal
3 of 3 metrics met goal
1 of 4 metrics met goal
4 of 5 metrics met goal
0 of 3 metrics met goal
4 of 7 metrics met goal
0 of 3 metrics met goal
1 of 3 metrics met goal
2 of 6 metrics met goal
Student attendance and discipline patterns
Attendance
Attendance and Discipline
% of students with one or more incidents in a given grading periodSchool Code of Conduct Incidents
18.0%Year to Date 129 of 714
Student advanced performance on state standardized testState Standardized Assessments
Student opportunity and performance in advanced courseworkAdvanced Coursework
Whether the student has taken and score of the latestassessment
College Entrance Exams
Completion, Graduation, and Dropout RatesGraduation Status
State Readiness IndicatorsCollege Readiness Indicators
% of students on each planHigh School Graduation Plan
Goal PlanningAcademic Dashboard Operational DashboardCampus Information
Attendance and Discipline
StateAssessments
LocalAssessmentsOverview Advanced
AcademicsCollege and Career
Readiness Grades
and Credits
2011 Accountabillity Rating:
Not ActualStudent DataMountains High School
Little Rock ISD Mountains High School
EXPORT ALL PRINT SUPPORT LOG OUT
Search
Goal PlanningAcademic Dashboard Operational DashboardCampus Information
Attendance and Discipline
StateAssessments
LocalAssessmentsOverview Advanced
AcademicsCollege and Career
Readiness Grades
and Credits
Not ActualStudent DataMountains High School
Little Rock ISD Mountains High School
EXPORT ALL PRINT SUPPORT LOG OUT
Search
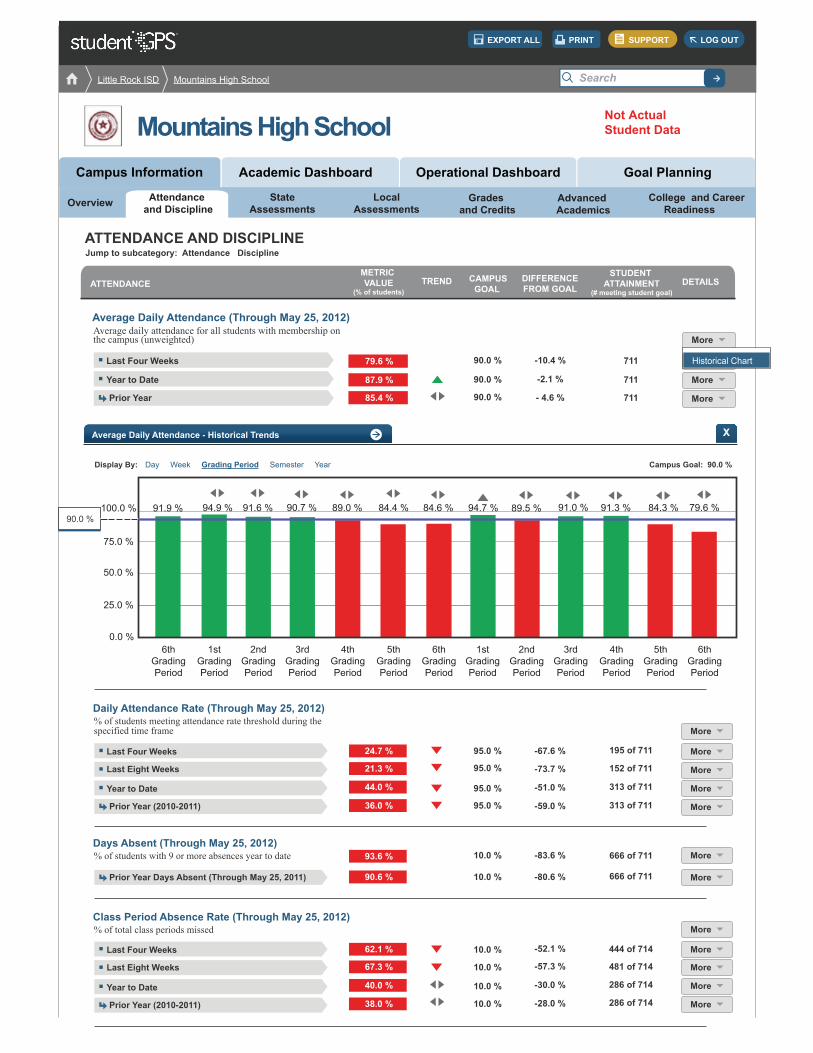
ATTENDANCE AND DISCIPLINE
90.0 %
711
711
711
195 of 711
152 of 711
313 of 711
313 of 711
666 of 711
666 of 711
444 of 714
481 of 714
286 of 714
286 of 714
-10.4 %
-2.1 %
- 4.6 %
90.0 %
90.0 %
Average Daily Attendance (Through May 25, 2012) Average daily attendance for all students with membership onthe campus (unweighted)
Last Four Weeks
Year to Date
Prior Year
More
More
More
More
Historical Chart
Average Daily Attendance - Historical Trends X
Display By: Campus Goal: 90.0 % Day Week Grading Period Semester Year
6thGradingPeriod
1stGradingPeriod
2ndGradingPeriod
3rdGradingPeriod
4thGradingPeriod
5thGradingPeriod
1stGradingPeriod
2ndGradingPeriod
3rdGradingPeriod
4thGradingPeriod
5thGradingPeriod
6thGradingPeriod
6thGradingPeriod
91.9 %100.0 %
75.0 %
50.0 %
25.0 %
0.0 %
94.7 % 79.6 %91.3 % 84.3 %91.0 %89.5 %84.6 %84.4 %89.0 %90.7 %91.6 %94.9 %90.0 %
95.0 % -67.6 %
-73.7 %
-83.6 %
-80.6 %
-51.0 %
-59.0 %
-28.0 %
-30.0 %
-57.3 %
-52.1 %
95.0 %
95.0 %
95.0 %
10.0 %
10.0 %
10.0 %
10.0 %
10.0 %
10.0 %
Daily Attendance Rate (Through May 25, 2012) % of students meeting attendance rate threshold during thespecified time frame
Days Absent (Through May 25, 2012) % of students with 9 or more absences year to date
Last Four Weeks
Last Eight Weeks
Year to Date
Prior Year (2010-2011)
Class Period Absence Rate (Through May 25, 2012) % of total class periods missed
Last Four Weeks
Last Eight Weeks
Year to Date
Prior Year (2010-2011)
Prior Year Days Absent (Through May 25, 2011)
More
More
More
More
More
More
More
More
More
More
More
More
24.7 %
21.3 %
44.0 %
93.6 %
90.6 %
36.0 %
62.1 %
67.3 %
40.0 %
38.0 %
ATTENDANCE TREND CAMPUSGOAL
METRIC VALUE
(% of students)
STUDENT ATTAINMENT
(# meeting student goal)
DIFFERENCEFROM GOAL
DETAILS
Jump to subcategory: Attendance Discipline
79.6 %
87.9 %
85.4 %
@2012 Michael & Susan Dell Foundation. All rights reserved.[LIMITED PRODUCTION RELEASE] Anonymized student data.
Gifted & Talented ESL, LEP or Bilingual Late Enrollment
Below Goal Met Goal No Change GettingBetter
GettingWorse
Partial Transcript Test Accommodation Special Education or 504 Designation G S L E P A
56 of 714
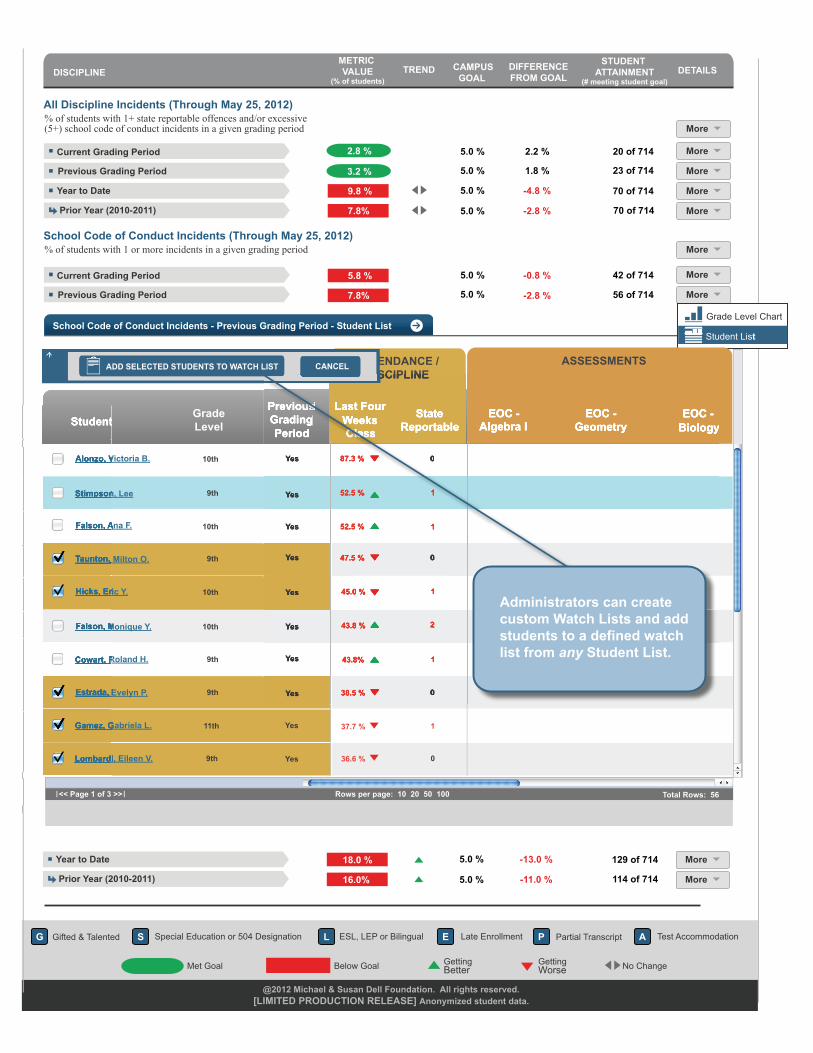
All Discipline Incidents (Through May 25, 2012) % of students with 1+ state reportable offences and/or excessive(5+) school code of conduct incidents in a given grading period
Current Grading Period
Year to Date
Prior Year (2010-2011)
Previous Grading Period
-4.8 %
-2.8 %
-0.8 %
-2.8 %
More
More
More
More
More
DISCIPLINE TREND CAMPUSGOAL
METRIC VALUE
(% of students)
STUDENT ATTAINMENT
(# meeting student goal)
DIFFERENCEFROM GOAL
DETAILS
5.0 % 20 of 714
23 of 714
70 of 714
70 of 714
5.0 %
2.2 %
1.8 %
School Code of Conduct Incidents (Through May 25, 2012) % of students with 1 or more incidents in a given grading period
Current Grading Period
Previous Grading Period
More
More
More
5.0 % 42 of 714
5.0 %
5.0 %
5.0 %
2.8 %
3.2 %
9.8 %
7.8%
5.8 %
7.8%
School Code of Conduct Incidents - Previous Grading Period - Student List Grade Level Chart
Student List
Student GradeLevel
PreviousGradingPeriod
ATTENDANCE /DISCIPLINE
EOC -Biology
ASSESSMENTS
Last FourWeeksClass
StateReportable
EOC -Algebra I
EOC -Geometry
47.5 %
52.5 %
52.5 %
87.3 % 0
1
1
0
1
2
1
0
1
0
45.0 %
43.8 %
43.8%
38.5 %
37.7 %
36.6 %
10th Yes
Yes
Yes
Yes
Yes
Yes
Yes
Yes
Yes
Yes
9th
10th
9th
10th
10th
9th
9th
11th
9thLombardi, Eileen V.
Stimpson, Lee
Falson, Monique Y.
Alonzo, Victoria B.
Estrada, Evelyn P.
Taunton, Milton O.
Falson, Ana F.
Hicks, Eric Y.
Cowart, Roland H.
Gamez, Gabriela L.
Student
Alonzo, Victoria B.
Stimpson, Lee
Student
Alonzo, Victoria B.
Stimpson, LeeStimpson, Lee
Student
Alonzo, Victoria B.
Stimpson, Lee
Student
Alonzo, Victoria B.
Stimpson, Lee
Falson, Ana F.Falson, Ana F.Falson, Ana F.Falson, Ana F.Falson, Ana F.Falson, Ana F.Falson, Ana F.Falson, Ana F.Falson, Ana F.
Falson, Monique Y.
Taunton, Milton O.
Hicks, Eric Y.
Falson, Monique Y.Falson, Monique Y.Falson, Monique Y.
Taunton, Milton O.
Hicks, Eric Y.Hicks, Eric Y.Hicks, Eric Y.
Taunton, Milton O.Taunton, Milton O.
Falson, Monique Y.
Hicks, Eric Y.
Taunton, Milton O.
Hicks, Eric Y.
Taunton, Milton O.
Falson, Monique Y.Falson, Monique Y.Falson, Monique Y.Falson, Monique Y.
Hicks, Eric Y.Hicks, Eric Y.Hicks, Eric Y.
Taunton, Milton O.Taunton, Milton O.Taunton, Milton O.
Cowart, Roland H.Cowart, Roland H.Cowart, Roland H.Cowart, Roland H.Cowart, Roland H.Cowart, Roland H.Cowart, Roland H.Cowart, Roland H.Cowart, Roland H.
Estrada, Evelyn P.Estrada, Evelyn P.Estrada, Evelyn P.Estrada, Evelyn P.Estrada, Evelyn P.Estrada, Evelyn P.Estrada, Evelyn P.Estrada, Evelyn P.
Lombardi, Eileen V.
Gamez, Gabriela L.
Lombardi, Eileen V.
Gamez, Gabriela L.
Lombardi, Eileen V.
Gamez, Gabriela L.
Lombardi, Eileen V.
Gamez, Gabriela L.
<< Page 1 of 3 >> Total Rows: 56Rows per page: 10 20 50 100
Year to Date
Prior Year (2010-2011)
-13.0 %
-11.0 %
More
More
129 of 714
114 of 714
5.0 %
5.0 %
0
0
18.0 %
16.0%
CANCELADD SELECTED STUDENTS TO WATCH LIST
PreviousGradingPeriod
DISCIPLINE
EOC -Biology
Last FourWeeksClass
StateReportable
EOC -Algebra I
EOC -Geometry
47.5 %
52.5 %
52.5 %
87.3 % 0
1
1
0
1
2
1
0
45.0 %
43.8 %
43.8%
38.5 %
Yes
Yes
Yes
Yes
Yes
Yes
Yes
Yes
Administrators can createcustom Watch Lists and addstudents to a defined watchlist from any Student List.
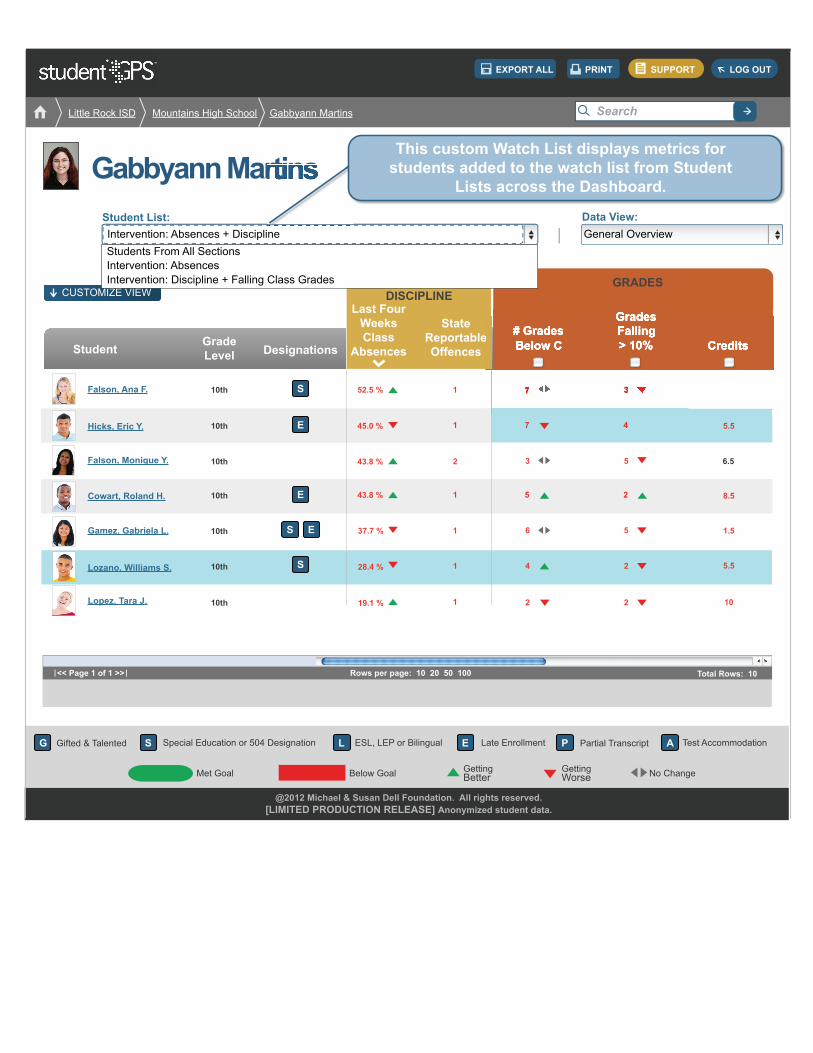
Student List: Data View:
Not ActualStudent DataGabbyann Martins
Little Rock ISD Mountains High School Gabbyann Martins
EXPORT ALL PRINT SUPPORT LOG OUT
Search
Intervention: Absences + Discipline
Back to list 1 of 78
@2012 Michael & Susan Dell Foundation. All rights reserved.[LIMITED PRODUCTION RELEASE] Anonymized student data.
Gifted & Talented ESL, LEP or Bilingual Late Enrollment
Below Goal Met Goal No Change GettingBetter
GettingWorse
Partial Transcript Test Accommodation Special Education or 504 Designation G S
E
S
S E
S
E
L E P A
Gabbyann Martins Not ActualStudent Data Back to list 1 of 78
43.8 %
43.8 %
45.0 %
52.5 % 1
1
2
1
1
6.5
1
1
5
5
2 5.5
1.5
8.5
5.5
37.7 %
28.4 %
19.1 %
10th
10th
10th
10th
10th
10th
10th
General Overview
<< Page 1 of 1 >> Total Rows: 10Rows per page: 10 20 50 100
4
2
3
3
6
4
2 102
7
5
7
Student GradeLevel Designations
Last FourWeeksClass
Absences
StateReportableOffences
This custom Watch List displays metrics forstudents added to the watch list from Student
Lists across the Dashboard.
ATTENDANCE /DISCIPLINE
GRADES
# GradesBelow C
GradesFalling> 10% Credits Credits
GradesGrades
3
GradesFalling> 10%ReportableReportable
7
# GradesBelow C
Hicks, Eric Y.
Lozano, Williams S.
Lopez, Tara J.
Falson, Ana F.
Cowart, Roland H.
Falson, Monique Y.
Gamez, Gabriela L.
CUSTOMIZE VIEW
Students From All Sections Intervention: Absences Intervention: Discipline + Falling Class Grades
@2012 Michael & Susan Dell Foundation. All rights reserved.[LIMITED PRODUCTION RELEASE] Anonymized student data.
Gifted & Talented ESL, LEP or Bilingual Late Enrollment
Below Goal Met Goal No Change GettingBetter
GettingWorse
Partial Transcript Test Accommodation Special Education or 504 Designation G S L E P A
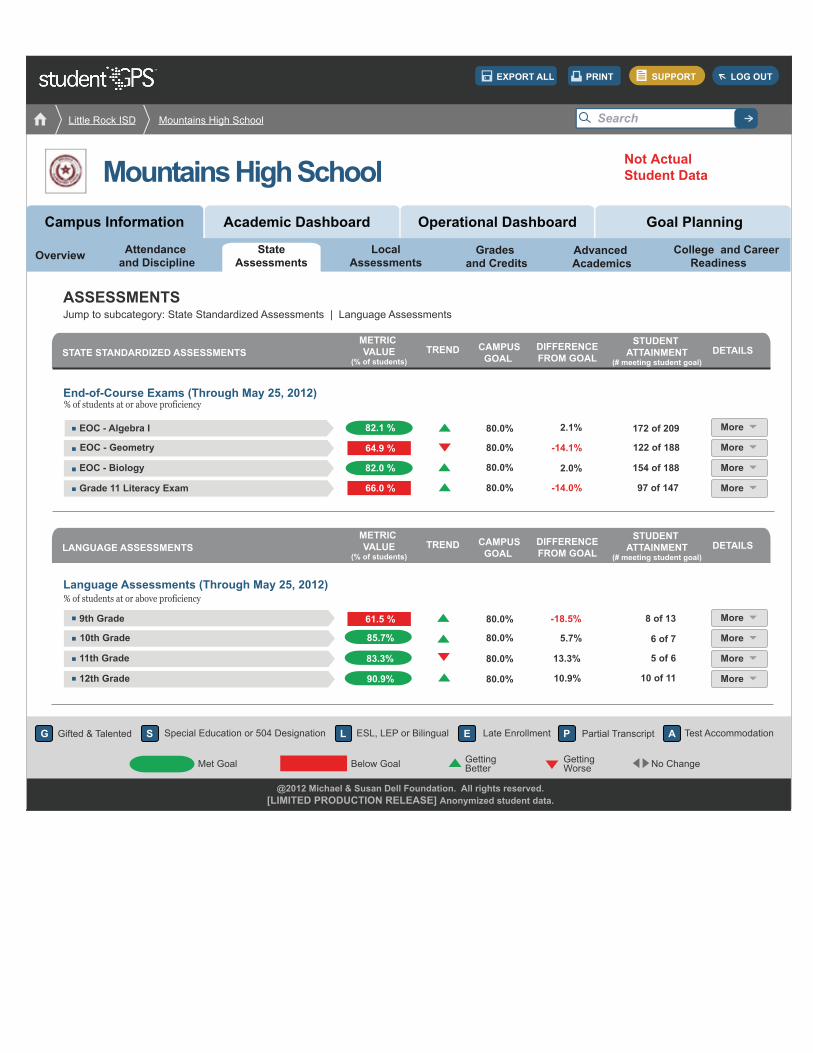
2.1%
-14.1%
2.0%
-14.0% 80.0%
80.0%
80.0%
80.0%
80.0%
80.0%
80.0%
80.0%
172 of 209
EOC - Biology
Grade 11 Literacy Exam
EOC - Geometry
EOC - Algebra I
122 of 188
97 of 147
154 of 188
End-of-Course Exams (Through May 25, 2012)% of students at or above proficiency
11th Grade
12th Grade
10th Grade
9th Grade 8 of 13
6 of 7
10 of 11
5 of 6
Language Assessments (Through May 25, 2012)% of students at or above proficiency
ASSESSMENTSJump to subcategory: State Standardized Assessments | Language Assessments
STATE STANDARDIZED ASSESSMENTS TREND CAMPUSGOAL
METRIC VALUE
(% of students)
STUDENT ATTAINMENT
(# meeting student goal)
DIFFERENCEFROM GOAL
DETAILS
LANGUAGE ASSESSMENTS TREND CAMPUSGOAL
METRIC VALUE
(% of students)
STUDENT ATTAINMENT
(# meeting student goal)
DIFFERENCEFROM GOAL
DETAILS
64.9 %
66.0 %
61.5 %
82.1 %
82.0 %
83.3%
85.7%
90.9%
More
More
More
More
More
More
More
More
-18.5%
5.7%
13.3%
10.9%
Goal PlanningAcademic Dashboard Operational DashboardCampus Information
Attendance and Discipline
StateAssessments
LocalAssessmentsOverview Advanced
AcademicsCollege and Career
Readiness Grades
and Credits
Not ActualStudent DataMountains High School
Little Rock ISD Mountains High School
EXPORT ALL PRINT SUPPORT LOG OUT
Search
@2012 Michael & Susan Dell Foundation. All rights reserved.[LIMITED PRODUCTION RELEASE] Anonymized student data.
Gifted & Talented ESL, LEP or Bilingual Late Enrollment
Below Goal Met Goal No Change GettingBetter
GettingWorse
Partial Transcript Test Accommodation Special Education or 504 Designation G S L E P A
Goal PlanningAcademic Dashboard Operational DashboardCampus Information
Attendance and Discipline
StateAssessments
LocalAssessmentsOverview Advanced
AcademicsCollege and Career
Readiness Grades
and Credits
Not ActualStudent DataPlains Middle School
Little Rock ISD Plains Middle School
EXPORT ALL PRINT SUPPORT LOG OUT
Search
2.1%
-14.1%
2.0%
80.0%
80.0%
80.0%
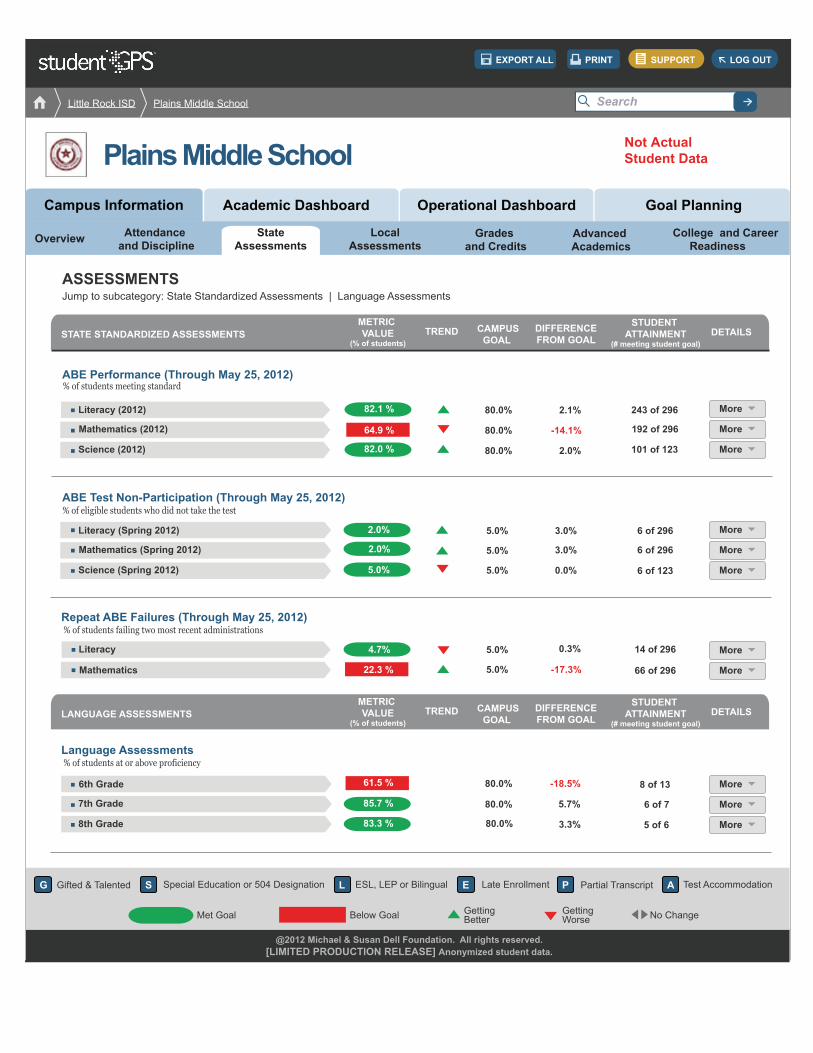
243 of 296
Science (2012)
Mathematics (2012)
Literacy (2012)
192 of 296
101 of 123
6 of 296
6 of 296
6 of 123
ABE Performance (Through May 25, 2012)% of students meeting standard
Science (Spring 2012)
Mathematics (Spring 2012)
Literacy (Spring 2012)
ABE Test Non-Participation (Through May 25, 2012)% of eligible students who did not take the test
Repeat ABE Failures (Through May 25, 2012)% of students failing two most recent administrations
Language Assessments% of students at or above proficiency
Mathematics
Literacy 14 of 296
66 of 296
-18.5%
80.0%
7th Grade
8th Grade
6th Grade
5 of 6
6 of 7
8 of 13
80.0%
80.0%
3.3%
5.7%
ASSESSMENTSJump to subcategory: State Standardized Assessments | Language Assessments
-17.3%
0.3%5.0%
5.0%
5.0%
5.0% 3.0%
3.0%
0.0%5.0%
STATE STANDARDIZED ASSESSMENTS TREND CAMPUSGOAL
METRIC VALUE
(% of students)
STUDENT ATTAINMENT
(# meeting student goal)
DIFFERENCEFROM GOAL
DETAILS
LANGUAGE ASSESSMENTS TREND CAMPUSGOAL
METRIC VALUE
(% of students)
STUDENT ATTAINMENT
(# meeting student goal)
DIFFERENCEFROM GOAL
DETAILS
64.9 %
82.1 %
82.0 %
2.0%
5.0%
2.0%
4.7%
22.3 %
61.5 %
85.7 %
83.3 %
More
More
More
More
More
More
More
More
More
More
More
@2012 Michael & Susan Dell Foundation. All rights reserved.[LIMITED PRODUCTION RELEASE] Anonymized student data.
Gifted & Talented ESL, LEP or Bilingual Late Enrollment
Below Goal Met Goal No Change GettingBetter
GettingWorse
Partial Transcript Test Accommodation Special Education or 504 Designation G S L E P A
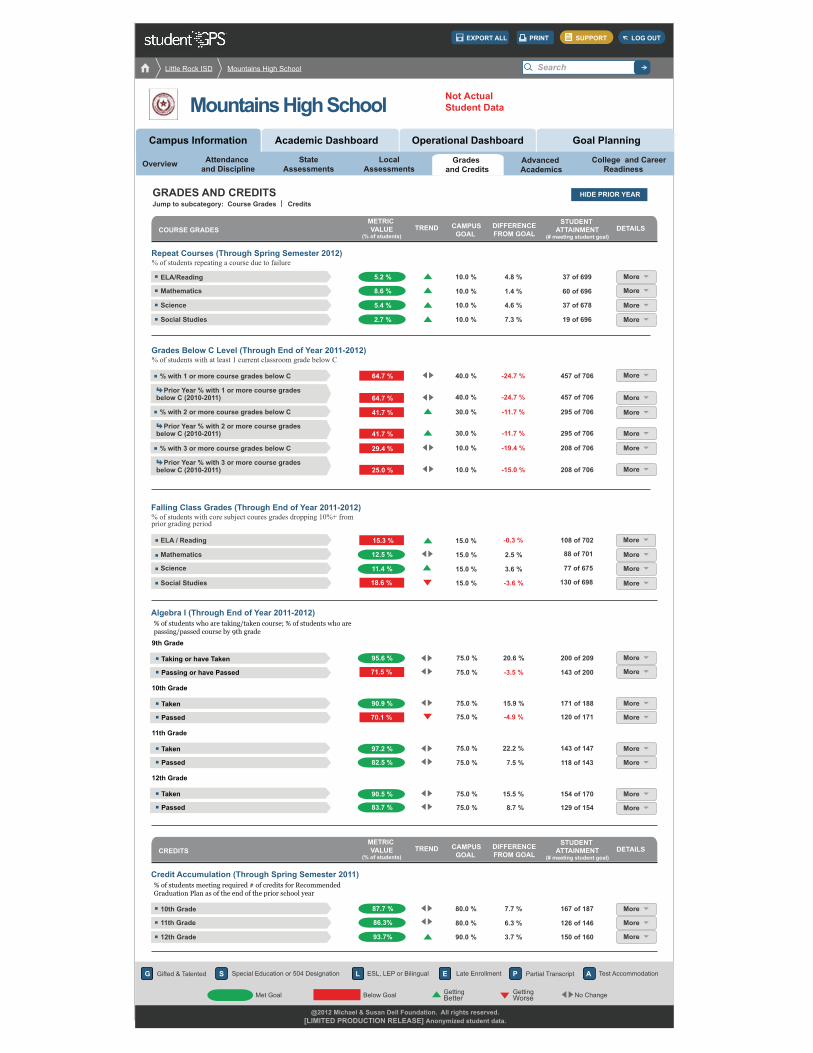
GRADES AND CREDITS
Repeat Courses (Through Spring Semester 2012)% of students repeating a course due to failure
Grades Below C Level (Through End of Year 2011-2012)% of students with at least 1 current classroom grade below C
ELA / Reading
Jump to subcategory: Course Grades Credits
Falling Class Grades (Through End of Year 2011-2012)% of students with core subject coures grades dropping 10%+ fromprior grading period
5.2 %
8.6 %
5.4 %
2.7 %
Prior Year % with 2 or more course gradesbelow C (2010-2011)
Prior Year % with 1 or more course gradesbelow C (2010-2011)
Prior Year % with 3 or more course gradesbelow C (2010-2011)
64.7 %
64.7 %
41.7 %
41.7 %
29.4 %
25.0 %
15.3 % More
COURSE GRADES TREND CAMPUSGOAL
METRIC VALUE
(% of students)
STUDENT ATTAINMENT
(# meeting student goal)
DIFFERENCEFROM GOAL
DETAILS
ELA/Reading
Mathematics
Science
Social Studies
10.0 %
10.0 %
10.0 %
10.0 %
40.0 %
40.0 %
30.0 %
30.0 %
10.0 %
10.0 %
15.0 %
457 of 706
457 of 706
295 of 706
295 of 706
208 of 706
208 of 706
108 of 702
-24.7 %
-24.7 %
-11.7 %
-11.7 %
-19.4 %
-15.0 %
-0.3 %
4.8 %
1.4 %
4.6 %
7.3 %
37 of 699
60 of 696
37 of 678
19 of 696
More
More
More
More
More
More
More
More
More
More
% with 1 or more course grades below C
% with 2 or more course grades below C
% with 3 or more course grades below C
87.7 %
86.3%
93.7%
12.5 %
11.4 %
18.6 %
95.6 %
71.5 %
90.9 %
97.2 %
82.5 %
90.5 %
83.7 %
70.1 %
CREDITS TREND CAMPUSGOAL
METRIC VALUE
(% of students)
STUDENT ATTAINMENT
(# meeting student goal)
DIFFERENCEFROM GOAL
DETAILS
10th Grade
11th Grade
12th Grade
80.0 %
80.0 %
90.0 %
7.7 %
6.3 %
3.7 %
167 of 187
126 of 146
150 of 160
More
More
More
More
More
More
More
More
More
More
More
More
More
More
15.0 %
15.0 %
15.0 %
2.5 %
3.6 %
-3.6 %
88 of 701
77 of 675
130 of 698
Algebra I (Through End of Year 2011-2012)% of students who are taking/taken course; % of students who arepassing/passed course by 9th grade
Credit Accumulation (Through Spring Semester 2011)% of students meeting required # of credits for RecommendedGraduation Plan as of the end of the prior school year
Taking or have Taken
9th Grade
Passing or have Passed
Taken
10th Grade
Passed
Taken
11th Grade
Passed
Taken
12th Grade
Passed
75.0 %
75.0 %
75.0 %
75.0 %
75.0 %
75.0 %
75.0 %
75.0 %
200 of 209
143 of 200
171 of 188
120 of 171
143 of 147
118 of 143
154 of 170
129 of 154
20.6 %
-3.5 %
15.9 %
-4.9 %
22.2 %
7.5 %
15.5 %
8.7 %
Mathematics
Science
Social Studies
Goal PlanningAcademic Dashboard Operational DashboardCampus Information
Attendance and Discipline
StateAssessments
LocalAssessmentsOverview Advanced
AcademicsCollege and Career
Readiness Grades
and Credits
Not ActualStudent DataMountains High School
Little Rock ISD Mountains High School
EXPORT ALL PRINT SUPPORT LOG OUT
Search
HIDE PRIOR YEAR
@2012 Michael & Susan Dell Foundation. All rights reserved.[LIMITED PRODUCTION RELEASE] Anonymized student data.
Gifted & Talented ESL, LEP or Bilingual Late Enrollment
Below Goal Met Goal No Change GettingBetter
GettingWorse
Partial Transcript Test Accommodation Special Education or 504 Designation G S L E P A
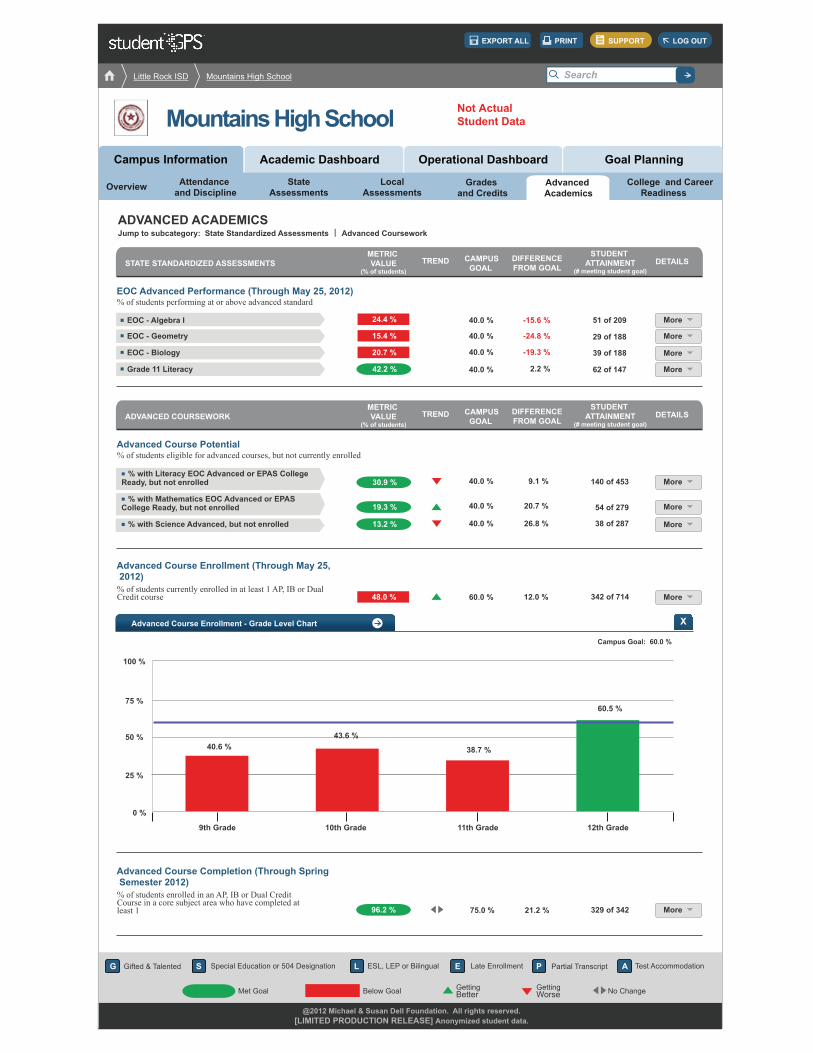
ADVANCED ACADEMICS
EOC Advanced Performance (Through May 25, 2012)% of students performing at or above advanced standard
Advanced Course Potential % of students eligible for advanced courses, but not currently enrolled
Advanced Course Enrollment (Through May 25, 2012)% of students currently enrolled in at least 1 AP, IB or Dual Credit course
Advanced Course Completion (Through Spring Semester 2012)% of students enrolled in an AP, IB or Dual Credit Course in a core subject area who have completed at least 1
Jump to subcategory: State Standardized Assessments Advanced Coursework
20.7 %
24.4 %
15.4 %
% with Literacy EOC Advanced or EPAS College Ready, but not enrolled
% with Mathematics EOC Advanced or EPAS College Ready, but not enrolled
% with Science Advanced, but not enrolled 13.2 %
19.3 %
30.9 %
42.2 %
96.2 %
48.0 %
STATE STANDARDIZED ASSESSMENTS TREND CAMPUSGOAL
STUDENT ATTAINMENT
(# meeting student goal)
DIFFERENCEFROM GOAL
DETAILS
ADVANCED COURSEWORK TREND CAMPUSGOAL
STUDENT ATTAINMENT
(# meeting student goal)
DIFFERENCEFROM GOAL
DETAILS
40.0 %
40.0 %
40.0 %
40.0 %
40.0 %
40.0 %
40.0 %
9.1 %
20.7 %
26.8 %
60.0 %
2.2 %
12.0 %
-15.6 %
-24.8 %
-19.3 %
51 of 209
29 of 188
39 of 188
62 of 147
140 of 453
54 of 279
38 of 287
329 of 342
342 of 714
More
More
More
More
More
More
More
More
More
EOC - Algebra I
EOC - Geometry
EOC - Biology
Grade 11 Literacy
Advanced Course Enrollment - Grade Level Chart X
9th Grade 10th Grade 11th Grade 12th Grade
100 %
75 %
50 %
25 %
0 %
40.6 %43.6 %
38.7 %
60.5 %
Campus Goal: 60.0 %
75.0 % 21.2 %
Goal PlanningAcademic Dashboard Operational DashboardCampus Information
Attendance and Discipline
StateAssessments
LocalAssessmentsOverview Advanced
AcademicsCollege and Career
Readiness Grades
and Credits
Not ActualStudent Data
EXPORT ALL PRINT SUPPORT LOG OUT
Search
METRIC VALUE
(% of students)
METRIC VALUE
(% of students)
Mountains High School
Little Rock ISD Mountains High School
@2012 Michael & Susan Dell Foundation. All rights reserved.[LIMITED PRODUCTION RELEASE] Anonymized student data.
Gifted & Talented ESL, LEP or Bilingual Late Enrollment
Below Goal Met Goal No Change GettingBetter
GettingWorse
Partial Transcript Test Accommodation Special Education or 504 Designation G S L E P A
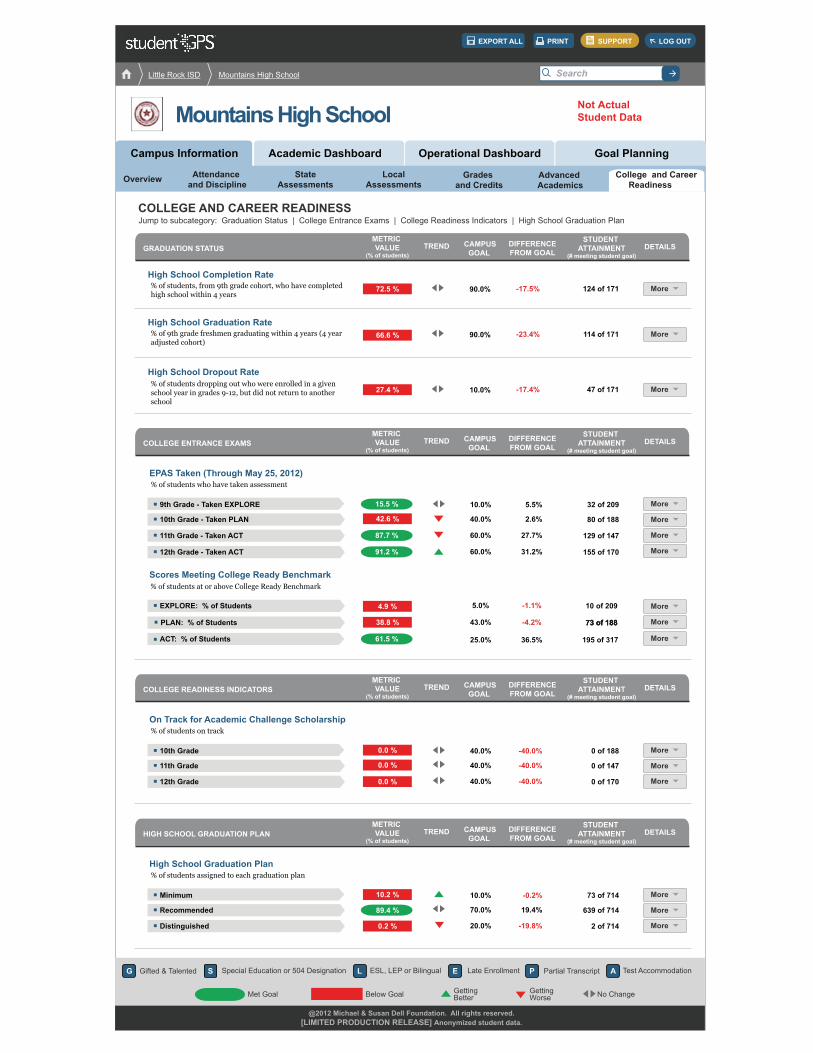
High School Graduation Rate% of 9th grade freshmen graduating within 4 years (4 yearadjusted cohort)
114 of 17190.0% -23.4%
High School Dropout Rate% of students dropping out who were enrolled in a given school year in grades 9-12, but did not return to another school
GRADUATION STATUS STATUS DETAILSVALUE TREND CAMPUSGOAL
% of students who have taken assessment
9th Grade - Taken EXPLORE
EPAS Taken (Through May 25, 2012)
10th Grade - Taken PLAN
32 of 209
80 of 188
10.0% 5.5%
2.6%40.0%
11th Grade - Taken ACT 129 of 14727.7%60.0%
Scores Meeting College Ready Benchmark
ACT: % of Students 195 of 31725.0% 36.5%
12th Grade - Taken ACT 155 of 17031.2%60.0%
% of students at or above College Ready Benchmark
PLAN: % of Students 73 of 18873 of 18873 of 188-4.2%43.0%
EXPLORE: % of Students 10 of 209-1.1%5.0%
COLLEGE ENTRANCE EXAMS TREND CAMPUSGOAL
METRIC VALUE
(% of students)
STUDENT ATTAINMENT
(# meeting student goal)
DIFFERENCEFROM GOAL
DETAILS
GRADUATION STATUS TREND CAMPUSGOAL
METRIC VALUE
(% of students)
STUDENT ATTAINMENT
(# meeting student goal)
DIFFERENCEFROM GOAL
DETAILS
72.5 %
66.6 %
27.4 %
42.6 %
38.8 %
4.9 %
15.5 %
87.7 %
91.2 %
61.5 %
More
47 of 17110.0% -17.4% More
High School Completion Rate% of students, from 9th grade cohort, who have completedhigh school within 4 years
124 of 17190.0% -17.5% More
More
More
More
% of students on track
10th Grade
On Track for Academic Challenge Scholarship
11th Grade
0 of 188
0 of 147
40.0% -40.0%
-40.0%40.0%
12th Grade 0 of 170-40.0%40.0%
COLLEGE READINESS INDICATORS TREND CAMPUSGOAL
METRIC VALUE
(% of students)
STUDENT ATTAINMENT
(# meeting student goal)
DIFFERENCEFROM GOAL
DETAILS
0.0 %
0.0 %
0.0 %
More
More
More
% of students assigned to each graduation plan
Minimum
High School Graduation Plan
Recommended
73 of 714
639 of 714
10.0% -0.2%
19.4%70.0%
Distinguished 2 of 714-19.8%20.0%
HIGH SCHOOL GRADUATION PLAN TREND CAMPUSGOAL
METRIC VALUE
(% of students)
STUDENT ATTAINMENT
(# meeting student goal)
DIFFERENCEFROM GOAL
DETAILS
89.4 %
10.2 %
0.2 %
More
More
More
More
More
More
More
Jump to subcategory: Graduation Status | College Entrance Exams | College Readiness Indicators | High School Graduation Plan COLLEGE AND CAREER READINESS
Goal PlanningAcademic Dashboard Operational DashboardCampus Information
Attendance and Discipline
StateAssessments
LocalAssessmentsOverview Advanced
AcademicsCollege and Career
Readiness Grades
and Credits
Not ActualStudent DataMountains High School
Little Rock ISD Mountains High School
EXPORT ALL PRINT SUPPORT LOG OUT
Search
@2012 Michael & Susan Dell Foundation. All rights reserved.[LIMITED PRODUCTION RELEASE] Anonymized student data.
Gifted & Talented ESL, LEP or Bilingual Late Enrollment
Below Goal Met Goal No Change GettingBetter
GettingWorse
Partial Transcript Test Accommodation Special Education or 504 Designation G S L E P A
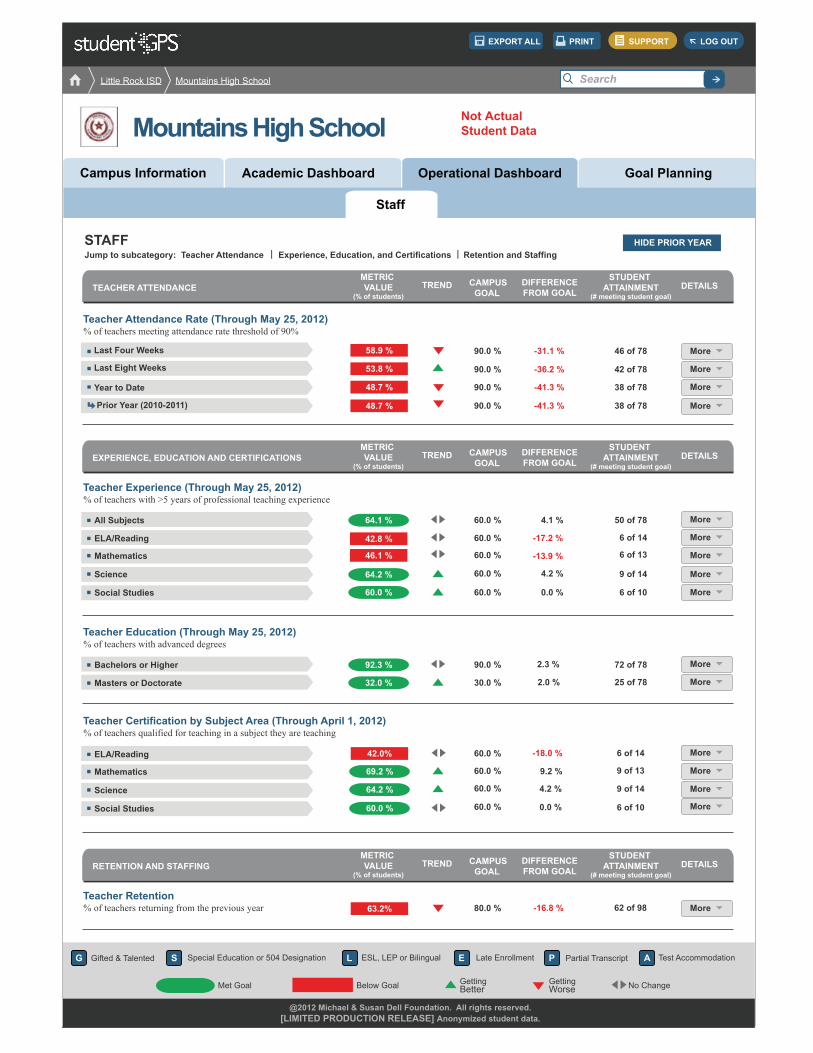
STAFF
Teacher Attendance Rate (Through May 25, 2012)% of teachers meeting attendance rate threshold of 90%
Teacher Experience (Through May 25, 2012)% of teachers with >5 years of professional teaching experience
Jump to subcategory: Teacher Attendance Experience, Education, and Certifications Retention and Staffing
48.7 %
48.7 %
58.9 %
53.8 %
42.0%
63.2%
69.2 %
64.2 %
60.0 %
METRIC VALUE
(% of students)
METRIC VALUE
(% of students)
Teacher Retention% of teachers returning from the previous year
METRIC VALUE
(% of students)
ELA/Reading
All Subjects
Mathematics
Science
Social Studies
42.8 %
46.1 %
64.1 %
64.2 %
60.0 %
Teacher Education (Through May 25, 2012)% of teachers with advanced degrees
Teacher Certification by Subject Area (Through April 1, 2012)% of teachers qualified for teaching in a subject they are teaching
Masters or Doctorate
Bachelors or Higher 92.3 %
32.0 %
ELA/Reading
Mathematics
Science
Social Studies
TEACHER ATTENDANCE TREND CAMPUSGOAL
STUDENT ATTAINMENT
(# meeting student goal)
DIFFERENCEFROM GOAL
DETAILS
EXPERIENCE, EDUCATION AND CERTIFICATIONS TREND CAMPUSGOAL
STUDENT ATTAINMENT
(# meeting student goal)
DIFFERENCEFROM GOAL
DETAILS
RETENTION AND STAFFING TREND CAMPUSGOAL
STUDENT ATTAINMENT
(# meeting student goal)
DIFFERENCEFROM GOAL
DETAILS
90.0 %
60.0 %
60.0 %
60.0 %
60.0 %
60.0 %
4.1 %
4.2 %
0.0 %
90.0 %
90.0 %
90.0 %
60.0 %
60.0 %
60.0 %
60.0 %
4.2 %
0.0 %
9.2 %
80.0 %
-41.3 %
-18.0 %
-16.8 %
-31.1 %
-36.2 %
-41.3 %
46 of 78
42 of 78
38 of 78
38 of 78
50 of 78
6 of 14
6 of 13
6 of 10
9 of 14
6 of 14
9 of 13
9 of 14
6 of 10
62 of 98
More
More
More
More
More
More
More
More
More
More
More
More
More
More
Last Four Weeks
Last Eight Weeks
Year to Date
Prior Year (2010-2011)
-17.2 %
90.0 %
30.0 % 2.0 %
72 of 78
25 of 78 More
More2.3 %
-13.9 %
Goal PlanningAcademic Dashboard Operational DashboardCampus Information
Not ActualStudent DataMountains High School
Little Rock ISD Mountains High School
EXPORT ALL PRINT SUPPORT LOG OUT
Search
HIDE PRIOR YEAR
Staff
@2012 Michael & Susan Dell Foundation. All rights reserved.[LIMITED PRODUCTION RELEASE] Anonymized student data.
Gifted & Talented ESL, LEP or Bilingual Late Enrollment
Below Goal Met Goal No Change GettingBetter
GettingWorse
Partial Transcript Test Accommodation Special Education or 504 Designation G S L E P A
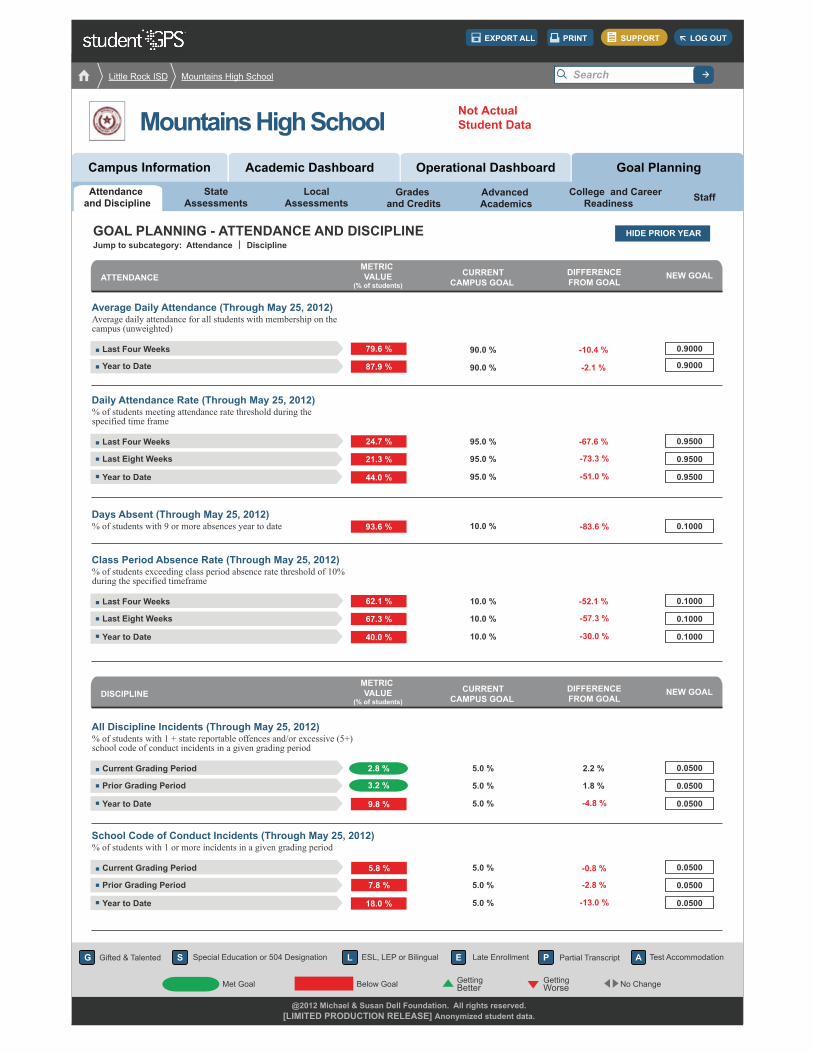
GOAL PLANNING - ATTENDANCE AND DISCIPLINE
Average Daily Attendance (Through May 25, 2012)Average daily attendance for all students with membership on the campus (unweighted)
Days Absent (Through May 25, 2012)% of students with 9 or more absences year to date
School Code of Conduct Incidents (Through May 25, 2012)% of students with 1 or more incidents in a given grading period
Jump to subcategory: Attendance Discipline
21.3 %
44.0 %
93.6 %
79.6 %
Daily Attendance Rate (Through May 25, 2012)% of students meeting attendance rate threshold during thespecified time frame
24.7 %
67.3 %
40.0 %
Class Period Absence Rate (Through May 25, 2012)% of students exceeding class period absence rate threshold of 10%during the specified timeframe
62.1 %
9.8 %
All Discipline Incidents (Through May 25, 2012)% of students with 1 + state reportable offences and/or excessive (5+)school code of conduct incidents in a given grading period
87.9 %
METRIC VALUE
(% of students)
METRIC VALUE
(% of students)
2.8 %
3.2 %
18.0 %
7.8 %
5.8 %
ATTENDANCE CURRENTCAMPUS GOAL
DIFFERENCEFROM GOAL
NEW GOAL
DISCIPLINE CURRENTCAMPUS GOAL
DIFFERENCEFROM GOAL
NEW GOAL
90.0 %
90.0 %
-51.0 %
-83.6 %
-10.4 %
-2.1 %
-73.3 %
Last Four Weeks
Year to Date
Last Eight Weeks
Year to Date
0.9000
0.9000
95.0 %
95.0 %
95.0 %
10.0 %
-67.6 %Last Four Weeks 0.9500
0.9500
0.9500
-30.0 %
-57.3 %Last Eight Weeks
Year to Date
10.0 %
10.0 %
10.0 %
-52.1 %Last Four Weeks 0.1000
0.1000
0.1000
-4.8 %
Prior Grading Period
Year to Date
5.0 %
5.0 %
2.2 %
1.8 %
5.0 %
Current Grading Period 0.0500
0.0500
0.0500
-13.0 %
-2.8 %
-0.8 %
Prior Grading Period
Year to Date
5.0 %
5.0 %
5.0 %
Current Grading Period 0.0500
0.0500
0.0500
0.1000
Not ActualStudent DataMountains High School
Little Rock ISD Mountains High School
EXPORT ALL PRINT SUPPORT LOG OUT
Search
HIDE PRIOR YEAR
Goal PlanningAcademic Dashboard Operational DashboardCampus Information
Attendance and Discipline
StateAssessments
LocalAssessments
Advanced Academics StaffCollege and Career
Readiness Grades
and Credits


![AR-M162 DIGITAL COPIER AR-M207 AR-M165 MODEL AR ...diagramas.diagramasde.com/otros/SM-ARM162.pdfAR-M207 M165 M162 GENERAL 1-1 [1] GENERAL 1. Cautions on using A. Warning •The fusing](https://img.pdfslide.us/doc/110x75/60ce0bb06b30e2634553928c/ar-m162-digital-copier-ar-m207-ar-m165-model-ar-ar-m207-m165-m162-general-1-1.jpg)


![AR-DU3 AR-DU4 MODEL AR-TE3 - Diagramas dediagramasde.com/diagramas/otros/AR-DU3_DU4_TE3-SM.pdf · AR-DU3/DU4/TE3 PRODUCT OUTLINE, CONFIGURATION 1-1 [1] PRODUCT OUTLINE This unit is](https://img.pdfslide.us/doc/110x75/5b835ae17f8b9a866e8cdf9b/ar-du3-ar-du4-model-ar-te3-diagramas-ar-du3du4te3-product-outline-configuration.jpg)