Embed Size (px)
Citation preview
1
3Q05 BRSA Bank Only Financial Results
27 October 2005
2
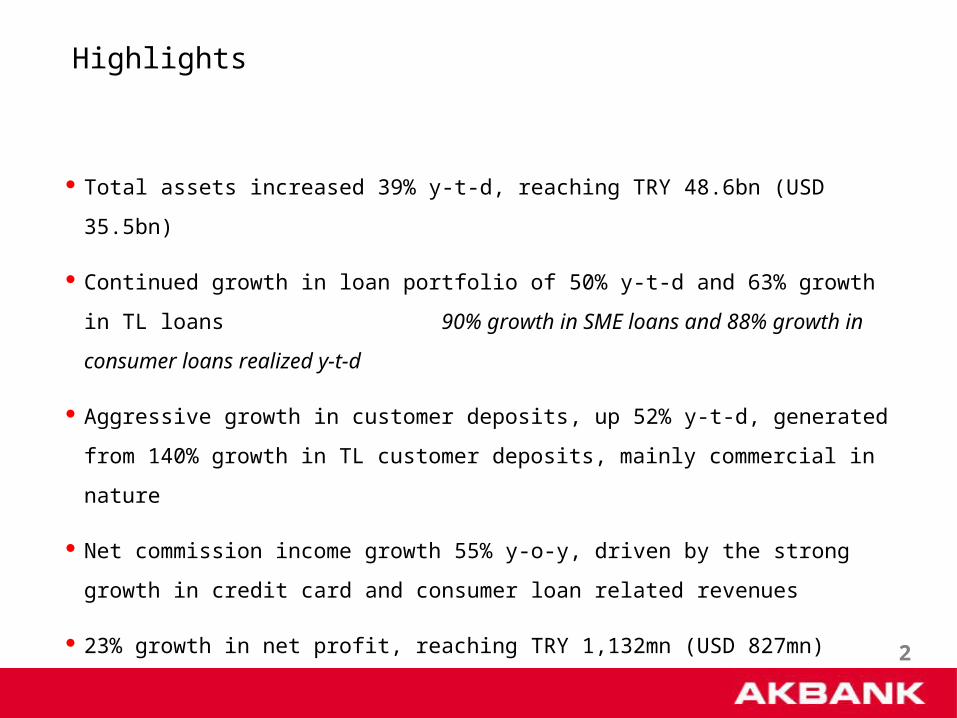
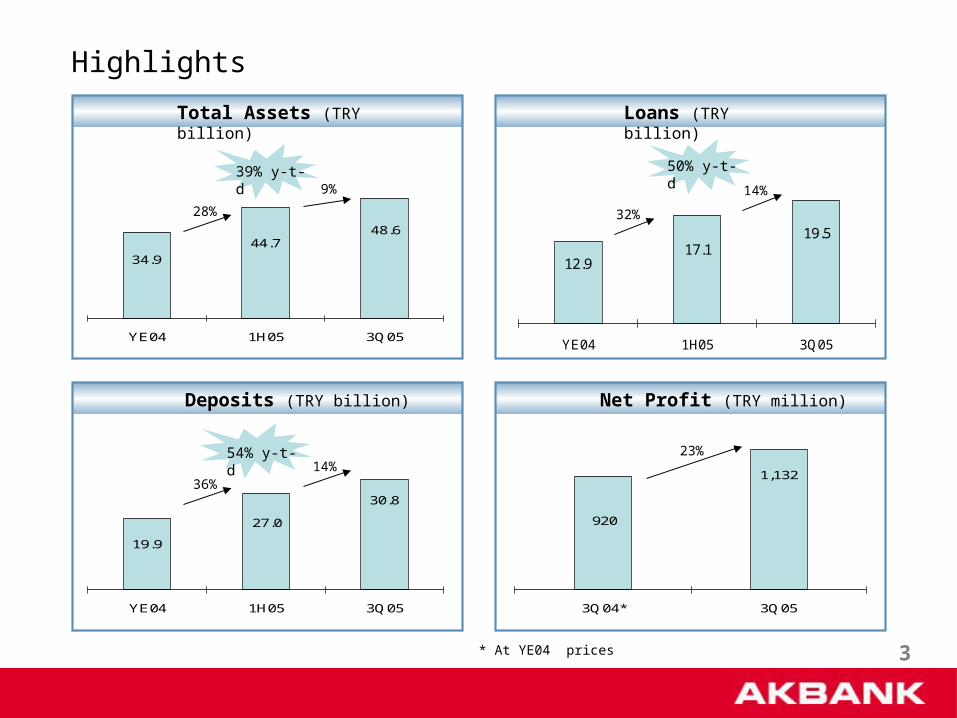
Highlights
Total assets increased 39% y-t-d, reaching TRY 48.6bn (USD 35.5bn)
Continued growth in loan portfolio of 50% y-t-d and 63% growth in TL loans
90% growth in SME loans and 88% growth in consumer loans realized y-t-d
Aggressive growth in customer deposits, up 52% y-t-d, generated from 140% growth in
TL customer deposits, mainly commercial in nature
Net commission income growth 55% y-o-y, driven by the strong growth in credit card
and consumer loan related revenues
23% growth in net profit, reaching TRY 1,132mn (USD 827mn)
3
Highlights
48.644.7
34.9
0.0
10.0
20.0
30.0
40.0
50.0
60.0
YE04 1H05 3Q05
Total Assets (TRY billion)
19.517.1
12.9
0.0
5.0
10.0
15.0
20.0
25.0
30.0
35.0
YE04 1H05 3Q05
Loans (TRY billion)
30.8
27.0
19.9
0.0
5.0
10.0
15.0
20.0
25.0
30.0
35.0
40.0
45.0
YE04 1H05 3Q05
Deposits (TRY billion)
1,132
920
0100200300400500600700800900
1000110012001300
3Q04* 3Q05
Net Profit (TRY million)
23%
* At YE04 prices
9% 14%
14%
39% y-t-d 50% y-t-d
54% y-t-d
28% 32%
36%
4
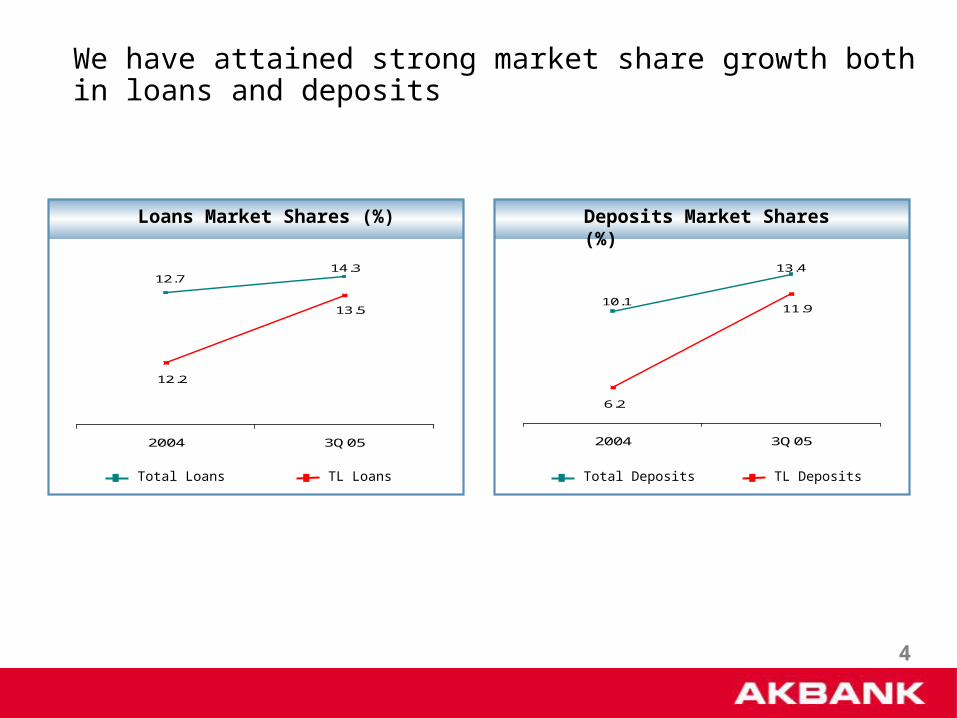
We have attained strong market share growth both in loans and deposits
11.9
6.2
13.4
10.1
0.0
2.0
4.0
6.0
8.0
10.0
12.0
14.0
2004 3Q05
4.0
9.0
Deposits Market Shares (%)
TL DepositsTotal Deposits
13.5
12.2
14.312.7
0.0
2.0
4.0
6.0
8.0
10.0
12.0
14.0
2004 3Q05
11.0
Loans Market Shares (%)
TL LoansTotal Loans
5
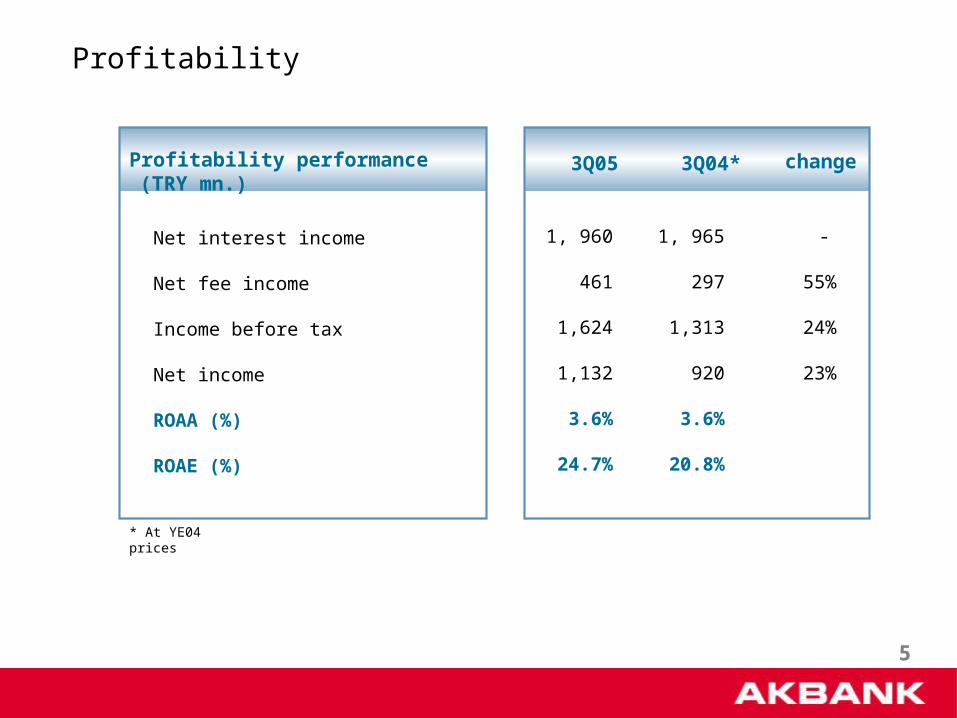
Net interest income
Net fee income
Income before tax
Net income
ROAA (%)
ROAE (%)
3Q05 3Q04*
Profitability
1, 960
461
1,624
1,132
3.6%
24.7%
1, 965
297
1,313
920
3.6%
20.8%
-
55%
24%
23%
changeProfitability performance (TRY mn.)
* At YE04 prices
6
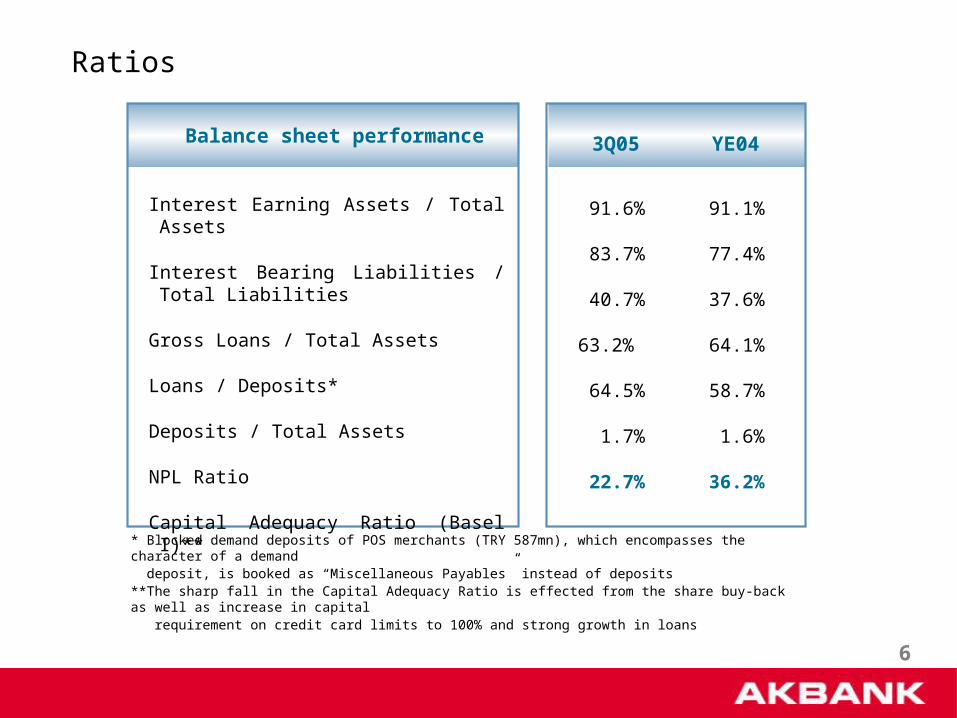
Interest Earning Assets / Total Assets
Interest Bearing Liabilities / Total Liabilities
Gross Loans / Total Assets
Loans / Deposits*
Deposits / Total Assets
NPL Ratio
Capital Adequacy Ratio (Basel I)**
3Q05 YE04
91.6%
83.7%
40.7%
63.2%
64.5%
1.7%
22.7%
91.1%
77.4%
37.6%
64.1%
58.7%
1.6%
36.2%
Ratios
Balance sheet performance
* Blocked demand deposits of POS merchants (TRY 587mn), which encompasses the character of a demand deposit, is booked as “Miscellaneous Payables” instead of deposits**The sharp fall in the Capital Adequacy Ratio is effected from the share buy-back as well as increase in capital requirement on credit card limits to 100% and strong growth in loans
7
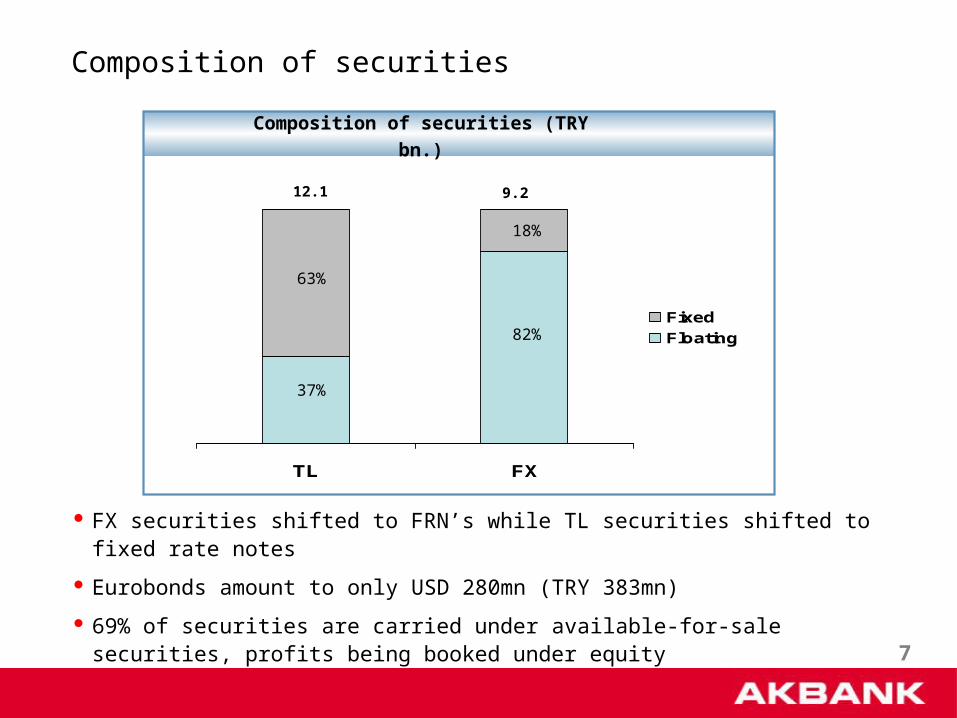
Composition of securities
TL FX
Fixed
Floating
37%
63%
18%
82%
FX securities shifted to FRN’s while TL securities shifted to fixed rate notes
Eurobonds amount to only USD 280mn (TRY 383mn)
69% of securities are carried under available-for-sale securities, profits being booked under equity
Composition of securities (TRY bn.)
12.1 9.2
8
TRY6.7bn.
TRY3.6bn.
0
1,000
2,000
3,000
4,000
5,000
6,000
7,000
YE04 3Q05
TRY 7.8bn.
TRY12.7bn.
USD3.8bn.
USD4.9bn.
01,0002,0003,0004,0005,0006,0007,0008,0009,000
10,00011,00012,00013,00014,00015,00016,00017,000
YE04 3Q05
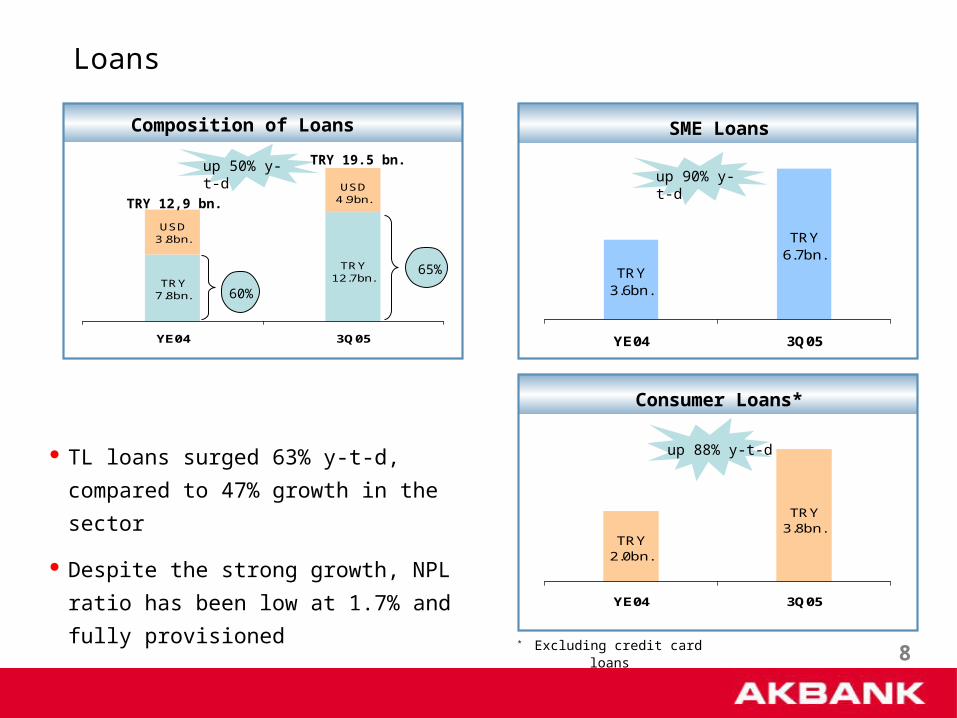
Loans
60%
TRY 12,9 bn.
up 50% y-t-d
TL loans surged 63% y-t-d, compared to
47% growth in the sector
Despite the strong growth, NPL ratio has
been low at 1.7% and fully provisioned
Composition of Loans
TRY 19.5 bn.
65%
up 90% y-t-d
SME Loans
TRY3.8bn.
TRY 2.0bn.
0
1,000
2,000
3,000
4,000
YE04 3Q05
up 88% y-t-d
Consumer Loans*
* Excluding credit card loans

9
23% 30%
16%
27%
39%
26%
20% 12%
31% 30%31%
8%
28%35%31%
7%
25% 24%26%
50%
11% 8%9%29%
2002 2003 2004 1Q05 1H05 3Q05
Consumer SME Corporate Project Finance
Breakdown of Loans
Consumer and SME lending is now ~65% of total loans
Growth (y-t-d)
53%
90%
37%
3%
10
Segment based developments
11
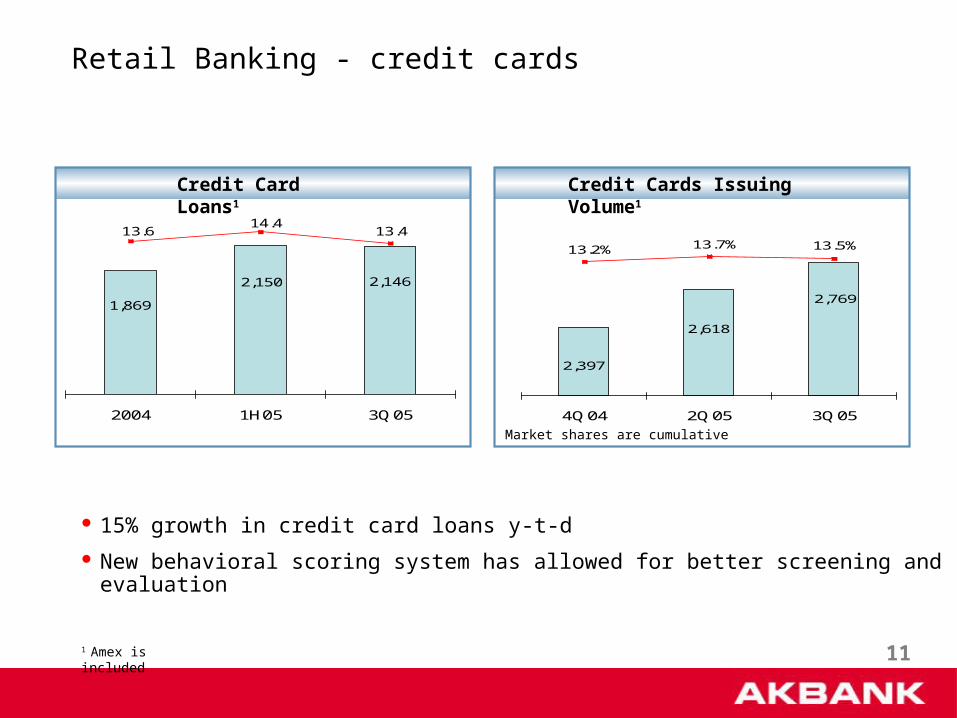
2,146
1,869
2,150
13.414.4
13.6
500
800
1,100
1,400
1,700
2,000
2,300
2004 1H05 3Q05
0
5
10
15
2,769
2,397
2,618
13.7%13.2% 13.5%
2,000
3,000
4Q04 2Q05 3Q05
0.0%
5.0%
10.0%
15.0%
Credit Card Loans1 Credit Cards Issuing Volume1
Retail Banking - credit cards
15% growth in credit card loans y-t-d
New behavioral scoring system has allowed for better screening and evaluation
1 Amex is included
Market shares are cumulative
12
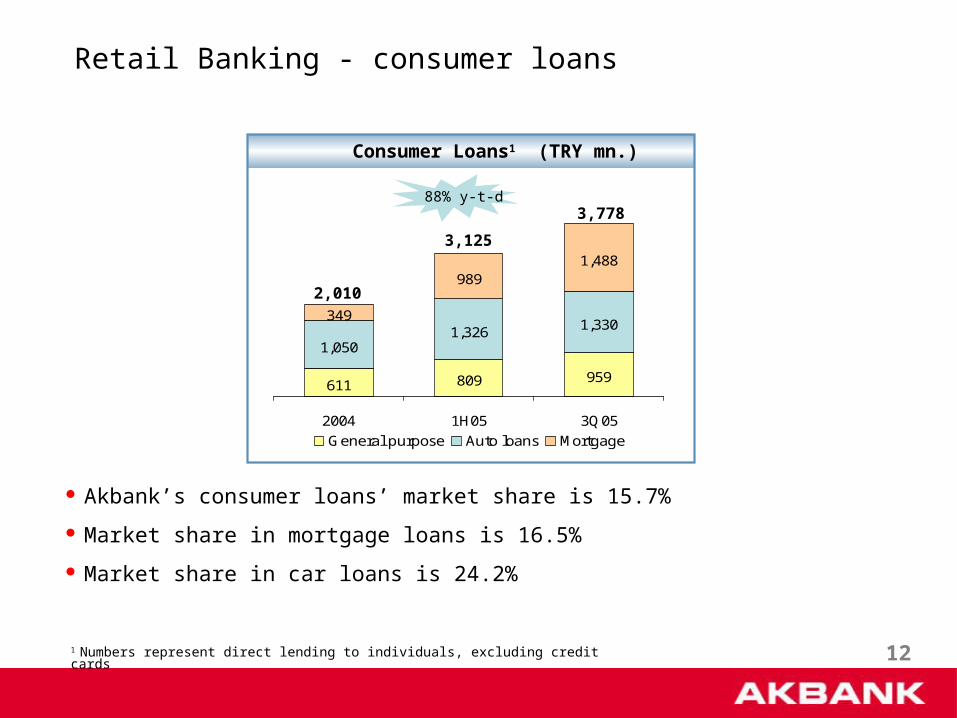
Retail Banking - consumer loans
1 Numbers represent direct lending to individuals, excluding credit cards
Akbank’s consumer loans’ market share is 15.7%
Market share in mortgage loans is 16.5%
Market share in car loans is 24.2%
Consumer Loans1 (TRY mn.)
611 809 959
1,0501,326 1,330
349
9891,488
2004 1H05 3Q05
General purpose Auto loans Mortgage
88% y-t-d
2,010
3,125
3,778
13
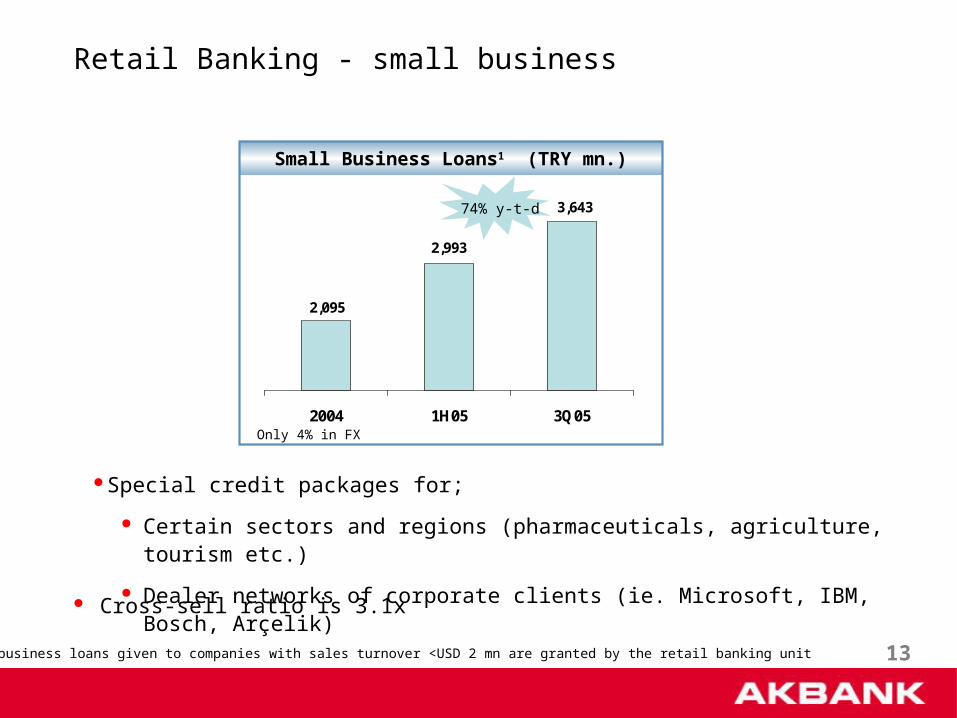
Retail Banking - small business
Small Business Loans1 (TRY mn.)
Only 4% in FX
3,643
2,993
2,095
2004 1H05 3Q05
74% y-t-d
1 Small business loans given to companies with sales turnover <USD 2 mn are granted by the retail banking unit
Special credit packages for;
Certain sectors and regions (pharmaceuticals, agriculture, tourism etc.)
Dealer networks of corporate clients (ie. Microsoft, IBM, Bosch, Arçelik)
Cross-sell ratio is 3.1x

14
Commercial Banking
43 commercial banking centers
Cross sell ratio is 3.9x
Commercial loans are also considered as a hook product, which paves the way for further marketing opportunities like cash management services and foreign trade products
1 Medium size companies with sales turnover btw. USD 2–30 mn are serviced through our commercial banking unit
Commercial Loans1
750
401
701
1,371
1,028
1,724
0100200300400500600700800900
1,0001,1001,2001,3001,4001,5001,6001,7001,800
(USD mn.)(TRY mn.)
157% y-t-d
130% y-t-d
TL cash loans FX cash loans
2004 1H05 3Q05 2004 1H05 3Q05
15
Corporate Banking
Lending to new privatizations will provide strong growth in corporate loans
Loans to blue-chip companies like Ford, Unilever, Carrefour reached USD 3.4
billion registering a 37% increase y-t-d
Project finance loans stand at USD 1.1 billion
Special and structured financial solutions for corporate needs like cash
management products regulating the collection and payment cycle of
companies
Excellent cross-sell opportunities (3.8x)
16
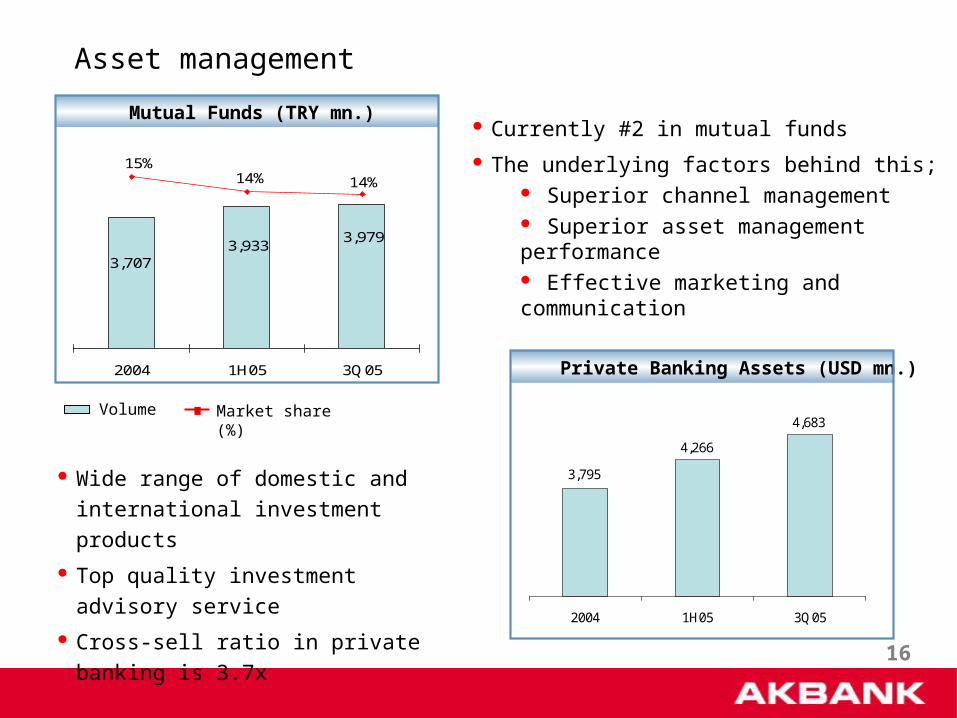
3,9793,933
3,707
14%14%15%
1,000
2,000
3,000
4,000
5,000
2004 1H05 3Q05
7%
9%
11%
13%
15%
Mutual Funds (TRY mn.)
Asset management
Currently #2 in mutual funds
The underlying factors behind this; Superior channel management Superior asset management performance Effective marketing and communication
Private Banking Assets (USD mn.)
Wide range of domestic and
international investment products
Top quality investment advisory service
Cross-sell ratio in private banking is 3.7x
Volume Market share (%)4,683
4,266
3,795
2004 1H05 3Q05
17
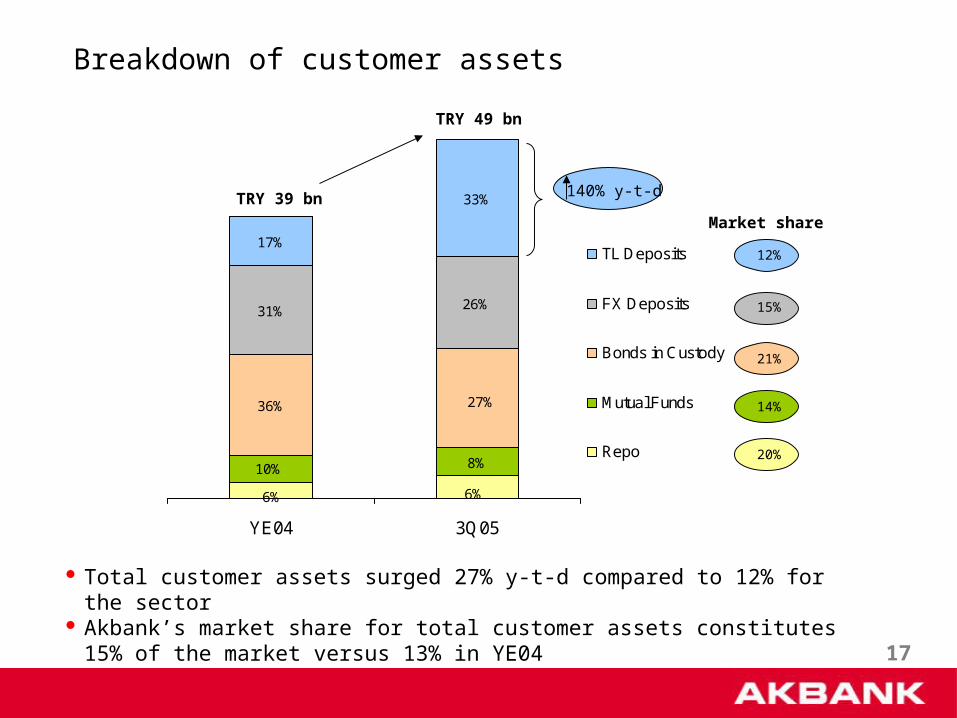
6% 6%
10% 8%
27%36%
26%31%
33%
17%
YE04 3Q05
TL Deposits
FX Deposits
Bonds in Custody
Mutual Funds
Repo
140% y-t-d
Breakdown of customer assets
TRY 39 bn
TRY 49 bn
Total customer assets surged 27% y-t-d compared to 12% for the sector Akbank’s market share for total customer assets constitutes 15% of the market
versus 13% in YE04
Market share
12%
15%
21%
14%
20%
18
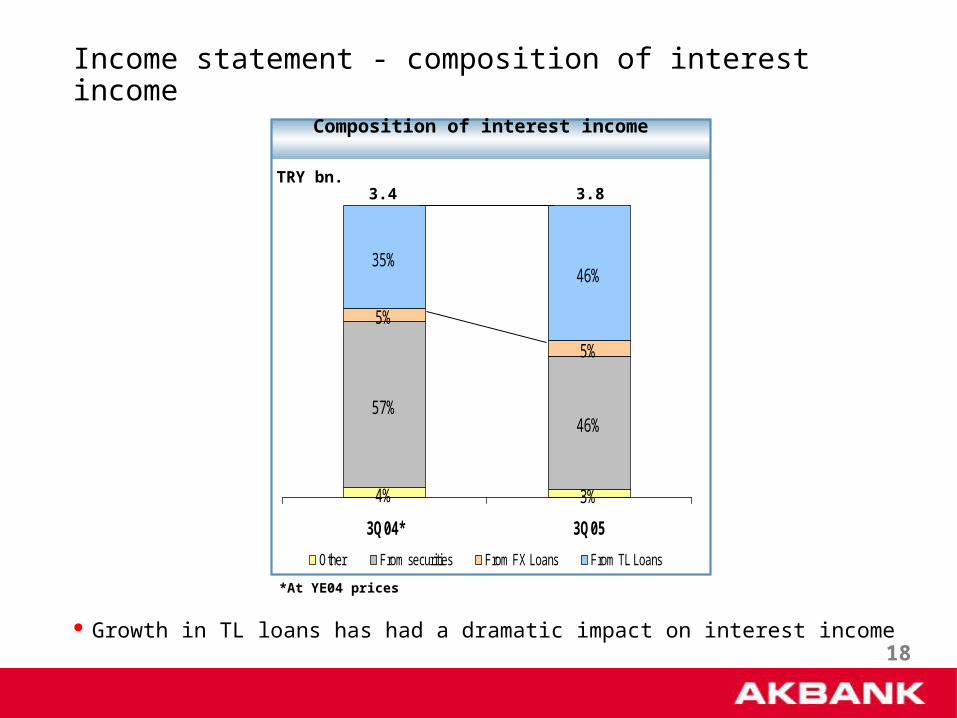
3%4%
46%57%
5%
5%
46%35%
3Q04* 3Q05
Other From securities From FX Loans From TL Loans
Composition of interest income
Income statement - composition of interest income
Growth in TL loans has had a dramatic impact on interest income
3.83.4TRY bn.
*At YE04 prices
19
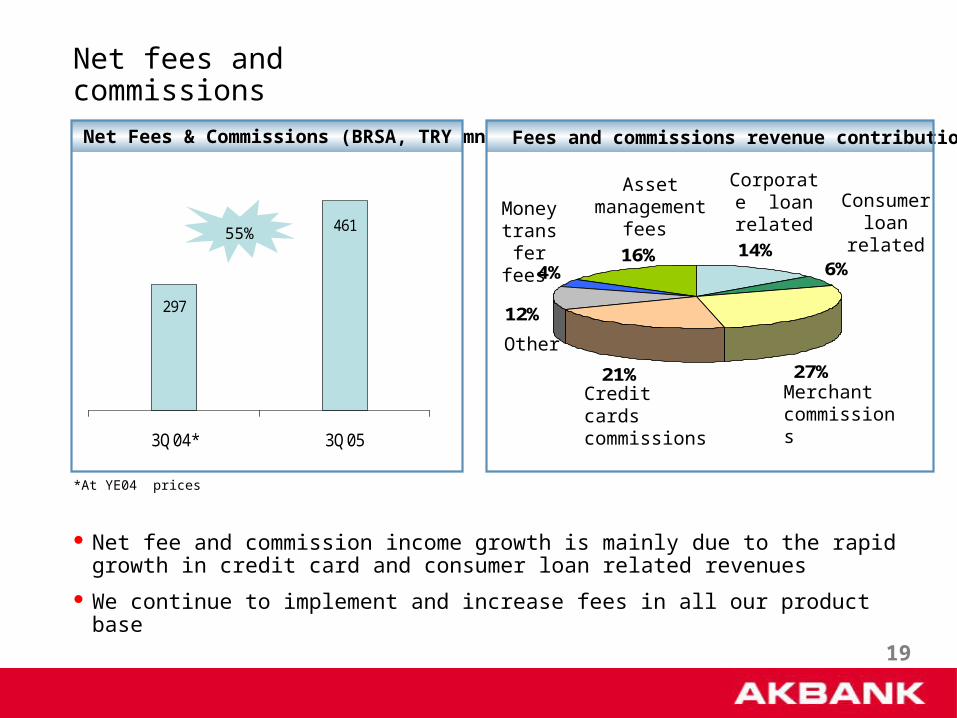
297
461
3Q04* 3Q05
Net Fees & Commissions (BRSA, TRY mn.)
Net fees and commissions
Net fee and commission income growth is mainly due to the rapid growth in credit card and consumer loan related revenues
We continue to implement and increase fees in all our product base
*At YE04 prices
55%
Fees and commissions revenue contribution
Credit cards commissions
Asset management
fees Money transfer
fees
Other
Consumer loan
related
Corporate loan
related
Merchant commissions
21%
16%4%
27%
6%
12%
14%
20
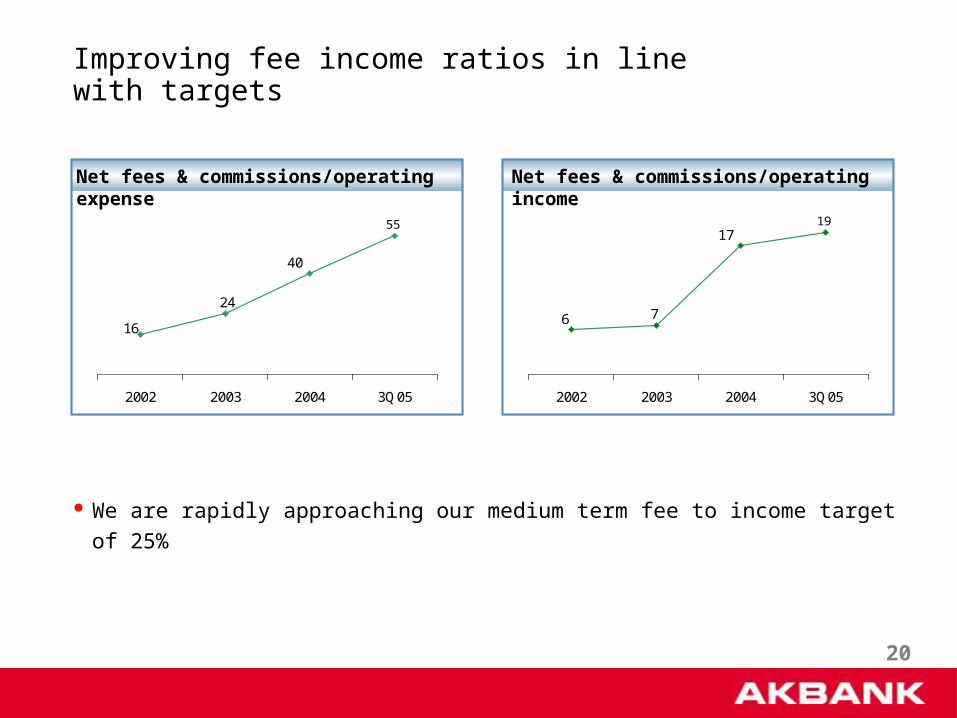
55
16
24
40
0
10
20
30
40
50
60
70
2002 2003 2004 3Q05
Net fees & commissions/operating expense
19
6 7
17
0
5
10
15
20
25
2002 2003 2004 3Q05
Net fees & commissions/operating income
Improving fee income ratios in line with targets
We are rapidly approaching our medium term fee to income target of 25%
21
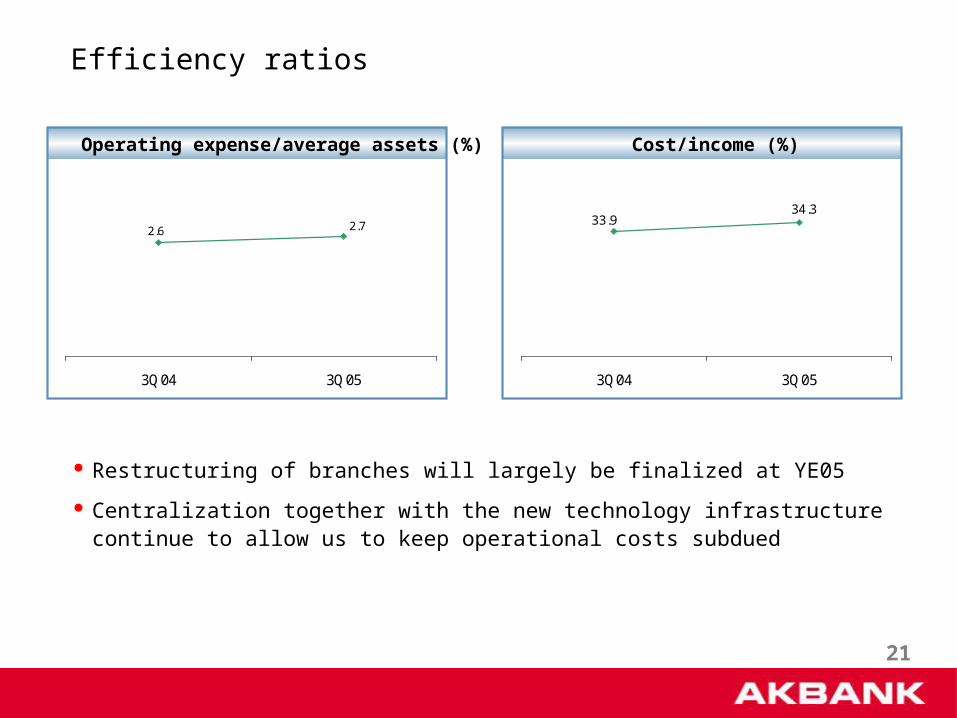
2.6 2.7
3Q04 3Q05
Efficiency ratios
Restructuring of branches will largely be finalized at YE05
Centralization together with the new technology infrastructure continue to allow us to keep operational costs subdued
Operating expense/average assets (%)
33.934.3
3Q04 3Q05
Cost/income (%)
22
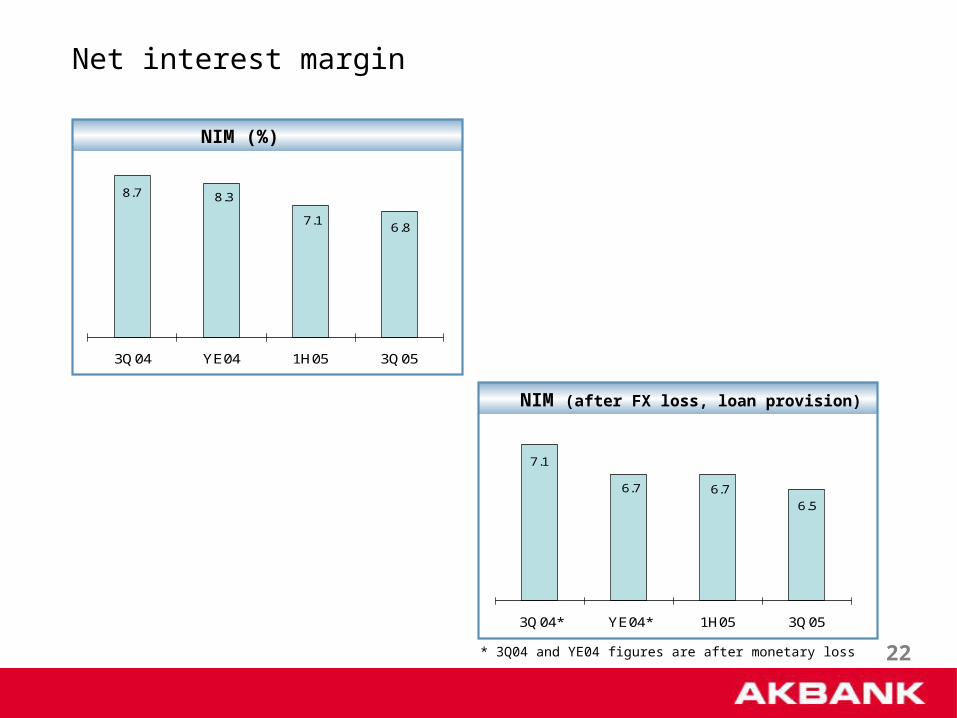
Net interest margin
8.7 8.3
7.16.8
0.0
2.0
4.0
6.0
8.0
10.0
3Q04 YE04 1H05 3Q05
NIM (%)
7.1
6.7 6.7
6.5
5.0
5.5
6.0
6.5
7.0
7.5
3Q04* YE04* 1H05 3Q05
NIM (after FX loss, loan provision)
* 3Q04 and YE04 figures are after monetary loss
23
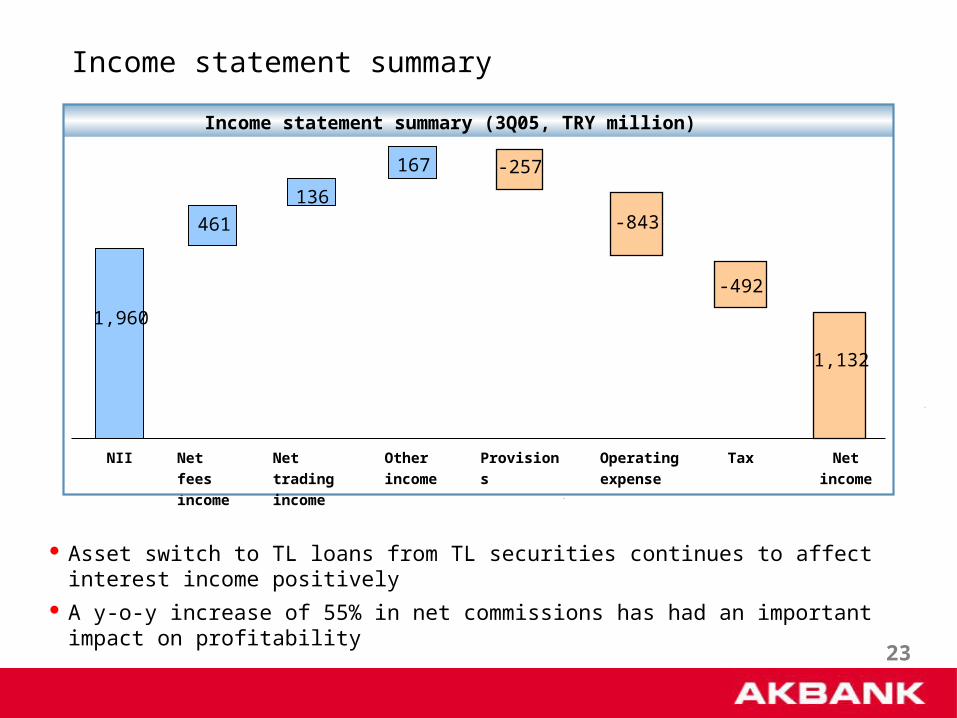
Asset switch to TL loans from TL securities continues to affect interest income positively A y-o-y increase of 55% in net commissions has had an important impact on profitability
1,132
Net fees
income
Tax Net
income
1,960
461
136
167 -257
-492
NII Net trading
income
Other
income
Operating
expense
-843
Provisions
Income statement summary
Income statement summary (3Q05, TRY million)
24
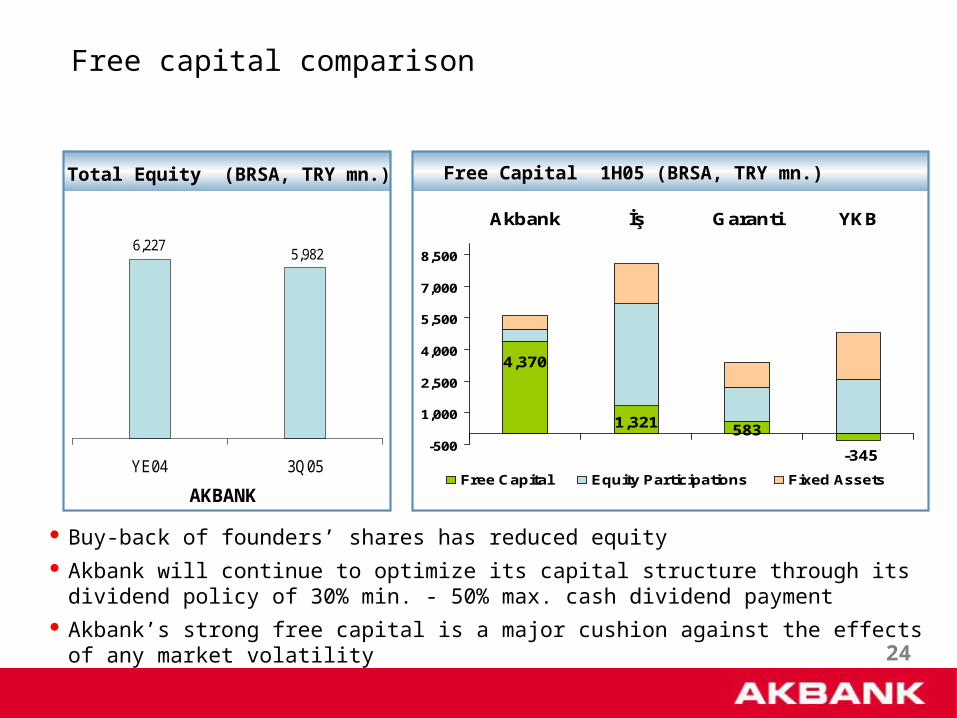
Total Equity (BRSA, TRY mn.)
AKBANK
Buy-back of founders’ shares has reduced equity Akbank will continue to optimize its capital structure through its dividend policy of 30% min. -
50% max. cash dividend payment Akbank’s strong free capital is a major cushion against the effects of any market volatility
Free capital comparison
Free Capital 1H05 (BRSA, TRY mn.)
6,2275,982
YE04 3Q05
5831,321
4,370
-345-500
1,000
2,500
4,000
5,500
7,000
8,500
Akbank İş Garanti YKB
Free Capital Equity Participations Fixed Assets

25
TOTAL ASSETS
Cash and Due from Banks
Securities
Loans
TOTAL LIABILITIES
Deposits
Funds Borrowed
TOTAL EQUITY
BRSA(TRY mn.) 2004 2004
Shares (%)
Balance sheet highlights
34,913
1,995
15,238
12,939
28,686
19,918
4,845
6,227
6
44
37
57
14
18
3Q05
48,636
2,488
21,334
19,464
42,654
30,760
6,876
5,982
5
44
40
63
14
12
3Q05
Change Y-t-d (%)
39
25
40
50
49
54
42
-4
26
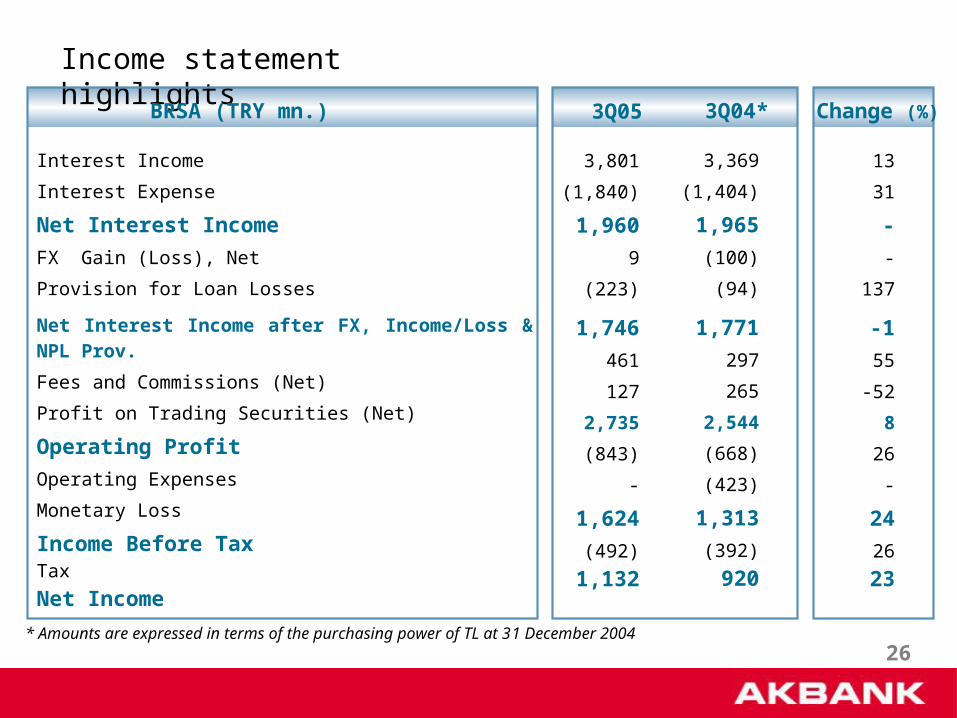
Income statement highlights
Interest Income
Interest Expense
Net Interest Income
FX Gain (Loss), Net
Provision for Loan Losses
Net Interest Income after FX, Income/Loss & NPL Prov.
Fees and Commissions (Net)
Profit on Trading Securities (Net)
Operating Profit
Operating Expenses
Monetary Loss
Income Before TaxTax
Net Income
BRSA (TRY mn.) 3Q04*
3,369
(1,404)
1,965
(100)
(94)
1,771
297
265
2,544
(668)
(423)
1,313
(392)
920
3Q05
3,801
(1,840)
1,960
9
(223)
1,746
461
127
2,735
(843)
-
1,624
(492)
1,132
* Amounts are expressed in terms of the purchasing power of TL at 31 December 2004
Change (%)
13
31
-
-
137
-1
55
-52
8
26
-
24
26
23
27
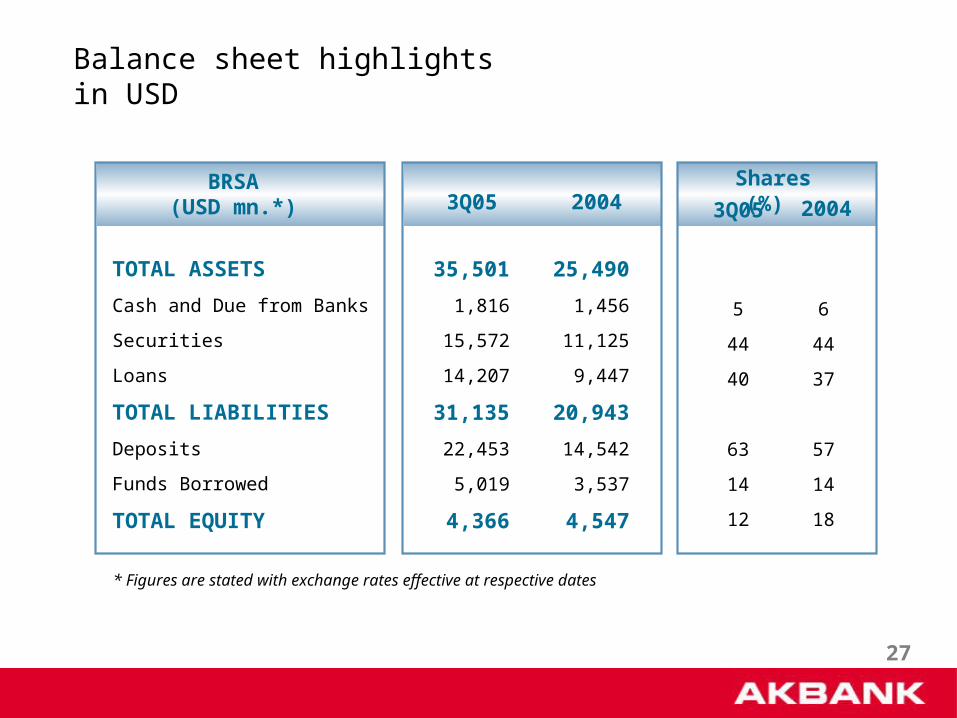
TOTAL ASSETS
Cash and Due from Banks
Securities
Loans
TOTAL LIABILITIES
Deposits
Funds Borrowed
TOTAL EQUITY
BRSA(USD mn.*) 2004 2004
Shares (%)
25,490
1,456
11,125
9,447
20,943
14,542
3,537
4,547
* Figures are stated with exchange rates effective at respective dates
Balance sheet highlights in USD
6
44
37
57
14
18
35,501
1,816
15,572
14,207
31,135
22,453
5,019
4,366
5
44
40
63
14
12
3Q05 3Q05
28
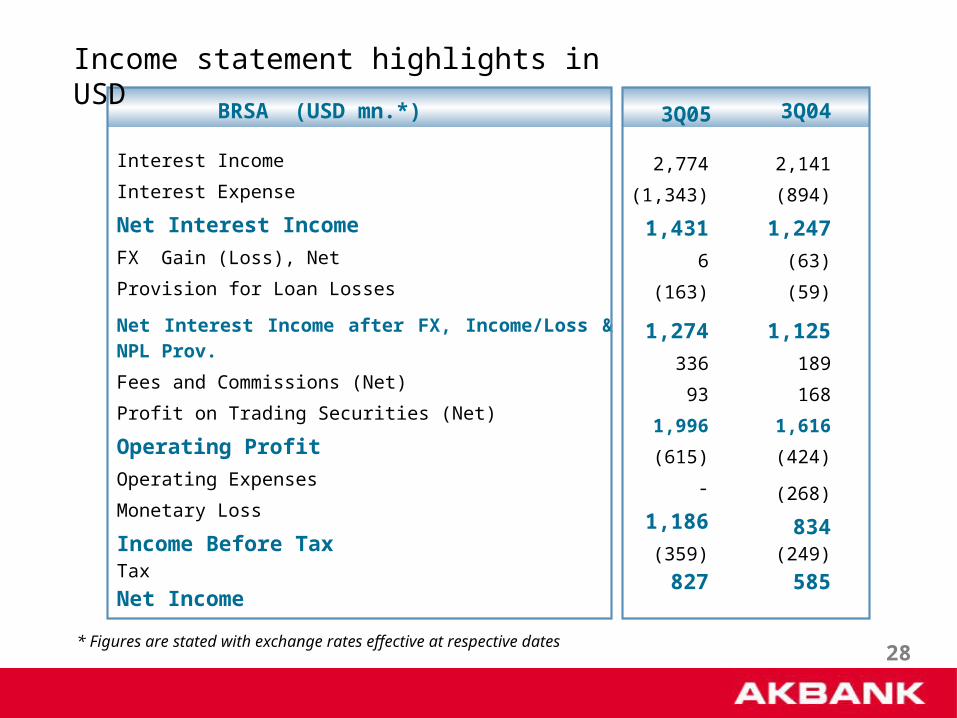
Interest Income
Interest Expense
Net Interest Income
FX Gain (Loss), Net
Provision for Loan Losses
Net Interest Income after FX, Income/Loss & NPL Prov.
Fees and Commissions (Net)
Profit on Trading Securities (Net)
Operating Profit
Operating Expenses
Monetary Loss
Income Before Tax Tax
Net Income
BRSA (USD mn.*)
Income statement highlights in USD
* Figures are stated with exchange rates effective at respective dates
3Q043Q05
2,774
(1,343)
1,431
6
(163)
1,274
336
93
1,996
(615)
-
1,186
(359)
827
2,141
(894)
1,247
(63)
(59)
1,125
189
168
1,616
(424)
(268)
834(249)
585
29
The information and opinions contained in this document have been compiled or arrived at by Akbank from sources believed to be reliable and in good faith, but no representation or warranty, expressed or implied, is made as to their accuracy, completeness or correctness. All opinions and estimates contained in this document constitute the Company’s judgement as of the date of this document and are subject to change without notice. The information contained in this document is published for the assistance of recipients, but is not to be relied upon as authoritative or taken in substitution for the exercise of judgement by any recipient. The Company does not accept any liability whatsoever for any direct or consequential loss arising from any use of this document or its contents. This document is strictly confidential and may not be reproduced, distributed or published for any purpose.
Disclaimer Statement