Embed Size (px)
Citation preview


2019 Annual Report Printed on April 23, 2020 Company Spokesperson Name: Jesse Huang Title: Vice President, Strategy and Investor Relations Tel: (03)577-0055 E-MAIL: [email protected] Deputy Spokesperson Name: Silvia Su Title:Vice President, Finance & Accounting Management Center Tel: (03)577-0055 E-MAIL: [email protected] Headquarter and Fabs Hsinchu Headquarter (Hsinchu fab.) Address: No. 1, R&D Rd. 1, Hsinchu Science Park, Hsinchu City, Taiwan, R.O.C. Tel: (03)577-0055 Fax: (03)566-8989 Tainan fab. Address: No. 5, Nanke 7th Rd., Southern Taiwan Science Park, Tainan City, Taiwan, R.O.C. Tel: (06)505-2388 Fax: (06)505-2345 Tainan fab. 2 Address: No. 3, Nanke 7th Rd., Southern Taiwan Science Park, Tainan City, Taiwan, R.O.C. Tel: (06)505-2388 Fax: (06)505-2345 Zhubei fab. Address: No. 37, Xintai Rd., Zhubei City, Hsinchu County, Taiwan, R.O.C. Tel: (03)656-2078 Fax: (03)553-2715 Zhubei fab. 2 Address: No. 112, Zhonghe St., Zhubei City, Hsinchu County, Taiwan, R.O.C. Tel: (03)598-5959 Fax: (03)553-2530
Hukou fab. Address: No. 4, Rende Rd., Feng Shan Vil., Hukou Township, Hsinchu County, Taiwan, R.O.C. Tel: (03)598-5959 Fax: (03)598-3012 U.S. subsidiary Address: 2890 North First Street, San Jose, CA 95134, U.S.A. Tel: 002-1-408-922-2777 Fax: 002-1-408-922-7275 Shanghai subsidiary Address: Room 309-C, 6 Building, 990 Shenchang Road, Minhang District, Shanghai Tel: 002-86-21-3328-5177 Stock Transfer Agent Company: KGI Securities Co., Ltd., Transfer Agency Department Address: 5F., No. 2, Sec. 1, Chongqing S. Rd., Zhongzheng Dist., Taipei City, Taiwan, R.O.C. Website: http://www.kgieworld.com.tw Tel: (02)2389-2999 The Certified Public Accountants for the Latest Annual Financial Statements Company: PricewaterhouseCoopers,Taiwan Auditors: Chun-Yuan Hsiao, Chih-Cheng Hsieh Address: 27F., No. 333, Sec. 1, Keelung Rd., Xinyi Dist., Taipei City, Taiwan, R.O.C. Website: https://www.pwc.tw Tel: (02)2729-6666 Foreign Securities Trade & Exchange ADS exchange: NASDAQ Stock Market Disclosed information can be found at: https://www.nasdaq.com ADS code: IMOS Corporate Website https://www.chipmos.com

Table of Contents I. Letter to Shareholders ............................................................................................................. 1
II. Company Profile
I. Date of Incorporation ......................................................................................................... 3
II. Company History ............................................................................................................... 3
III. Corporate Governance Report
I. Organization System .......................................................................................................... 6
II. Information of Directors, Supervisors, President, Vice Presidents, Assistant
Presidents, Officers of Departments and Branches ............................................................ 8
III. Remuneration to Directors (Including Independent Directors) , Supervisors,
President and Vice Presidents .......................................................................................... 18
IV. Implementation of Corporate Governance ....................................................................... 23
V. Information Regarding Audit Fee .................................................................................... 57
VI. Replacement of CPA ........................................................................................................ 57
VII. Company's Chairman, President, or Any Manager in Charge of Finance or
Accounting Matters has Held a Position at the Accounting Firm of Its CPA or
at an Affiliated Enterprise of Such Accounting Firm in the Most Recent Year ............... 57
VIII. Changes in Shareholding of Directors, Supervisors, Managers and Major
Shareholders in the Most Recent Year and Up to the Date of Publication of the
Annual Report .................................................................................................................. 58
IX. Information on Top 10 Shareholders of the Company Who are Spouses or
Relatives Within Two Degrees of Kinship to Each Other ................................................ 60
X. The Combined Shareholding and Ratio of the Company, Directors,
Supervisors, Managers and Enterprises which Directly or Indirectly Controlled
by the Company in Each Investee ................................................................................... .61
IV. Capital Overview
I. Capital and Shares ............................................................................................................ 62
II. Bonds .............................................................................................................................. .68
III. Preferred Shares ............................................................................................................... 68
IV. Global Depository Receipts ............................................................................................. 69
V. Employee Stock Options and Restricted Employee Shares ............................................. 69
VI. Status of New Shares Issuance in Connection with Mergers and Acquisitions ............... 69
VII. Financing Plans and Implementations ............................................................................. 69

V. Operational Highlights
I. Business Contents ............................................................................................................ 70
II. Market, Production, and Sales Overview ........................................................................ 82
III. Employees Status ............................................................................................................. 94
IV. Environmental Expenditure Information ......................................................................... 94
V. Labor Relations ................................................................................................................ 94
VI. Material Contracts ............................................................................................................ 96
VI. Financial Information
I. Condensed Balance Sheets and Statements of Comprehensive Income .......................... 99
II. Financial Analysis for the Most Recent 5 Years ............................................................ 104
III. Audit Committee’s Report of the Most Recent Year ..................................................... 107
IV. Financial Report of the Most Recent Year ..................................................................... 108
V. Parent Company Only Financial Report of the Most Recent Year ................................ 179
VI. Explanations Regarding Impacts on Company's Financial Status in the Event
that the Company or its Affiliates Have Financial Difficulties ...................................... 256
VII. Review of Financial Status, Financial Performance and Risk Management
I. Analysis of Financial Status ........................................................................................... 257
II. Analysis of Financial Performance ................................................................................ 258
III. Analysis of Cash Flow ................................................................................................... 259
IV. Major Capital Expenditure Items ................................................................................... 259
V. Investment Policy in the Last Year, Main Causes for Profits or Losses,
ImprovementPlans and Investment Plans for the Coming Year .................................... 259
VI. Analysis of Risk Management as in the Most Recent Year and Up to the Date
of Publication Date of the Annual Report ...................................................................... 260
VII. Special Disclosure .......................................................................................................... 268
VIII. Other Special Disclosure
I. Summary of Affiliated Companies ................................................................................ 269
II. Status of Company's Private Placement in the Most Recent Year and Up to the
Date of Publication of the Annual Report ...................................................................... 270
III. Holding or Disposal of Shares of the Company by Subsidiaries in the Most
Recent Year and Up to the Date of Publication of the Annual Report ........................... 270
IV. Other Necessary Supplement ......................................................................................... 270
IX. Any Event that Have Significant Impacts on Shareholders’ Rights or Security
Prices as Stated in Item 2 of Paragraph 3 of Article 36 of Securities and
Exchange Law in the Most Recent Year and Up to the Date of Publication of
the Annual Report ................................................................................................................ 271

I. Letter to Shareholders Dear Shareholders,
2019 was a challengeable and opportunities year for ChipMOS. Although there are more business and operating challenge caused by the political and economic uncertainties from US/China tariffs and trade disputes. However, ChipMOS was benefitted from the high penetration rate of large-size flat panel display driver ICs in 4KTV and the strong demand for TDDI products driven by ever-increasing penetration ratio of new smartphone in 2019, and memory products were de-inventorying since the second half of 2019. Revenue of 2019 was the record high of last 5 years, and the gross margin rate was also grew compared to 2018. By cautiously stable operating strategy, in line with industry trend and customer requirements, ChipMOS will keep moving forward expanding the core technologies and product developments to maintain growth momentum and improve profitability. The followings are the major operating results of 2019:
Operating Result
Consolidated revenue for the fiscal year ended December 31, 2019 was NT$20.34 billion, which reflects 10.1% growth from 2018. The consolidated gross margin for the year increased to 19.3%. Regarding to the products, with the increasing of high ASP products, TDDI, the revenue of flat panel display driver IC (DDIC) related products, including gold bump represented 49.4% of 2019 total revenue. Regarding to the memory product, driven by automotive and other new applications & business, Flash product revenue represented 19.7% of 2019 total revenue.
Financial Performance
ChipMOS' financial situation has been improved over years through the adjustment of the product mix, customer base and business segment served. The net profit to the equity holders and the net earnings per common share were NT$2.58 billion and NT$3.55. Net profit to the equity holders grew 134.3% from the 2018 level of NT$1.1 billion and EPS increased NT$2.18 from NT$1.37 of 2018. Both included a disposal gain, NT$980 million, of sale the partial shares of JMC in April 2019.
Till the end of 2019, the aggregated amount of ChipMOS’ consolidated assets was NT$34.31 billion and the cash and cash equivalents was NT$4.70 billion. The consolidated liabilities was NT$14.65 billion with the consolidated liabilities to assets ratio of 42.7%. The equity attributable to equity holders of the Company was NT$19.65 billion with the Return on Equity (ROE) was 13.7% for 2019.
Technological Developments
Single integrated device, and the thinning & small foot print requirements are driving the packaging technology development with the raising of emerging applications such as AI and 5G, and the popularity of mobile devices. We completed the following technologies development results in 2019:
(1). Bumping & Flip chip technologies: 3P/3M Cu pillar bumping for memory and mixed-signal high pin count products, and flip chip assembly technologies.
1

(2). Wafer level packaging: Sputter technology for high depth/width ratio and W/S: 5um/5um and RDL line thickness 3-21um. And multi-PI (Polymer) layers for 3P2M RDL technologies.
(3). Multi-chip stack and wire technologies: 3P2M RDL 8 dice stacked packaging technologies. (4). COF module: reel to reel COF SMT technologies for COF module requirement.
Honors and Awards
ChipMOS is committed to improving the quality of corporate governance and perform corporate social responsibility. In the meantime, we integrated our core business and sustainability vision of ChipMOS to support the UN's sustainable development goals (SDGs) by specific solid actions. ChipMOS received recognition for achievements in sustainability, environmental protection and corporate social responsibility (CSR) from CommonWealth Magazine, TCSA and EPA of Executive Yuan Taiwan in 2019. ChipMOS awarded from 「Top 50 Taiwan Corporate Sustainability Awards」
of 2019 Taiwan Corporate Sustainability Awards (TCSA), the Honorary Environmental Protection Enterprise Award & Gold grade Award of the 1st National Enterprise Environmental Protection Award and 2019 CommonWealth’s CSR Corporate Citizens Award.
Outlook
Keep moving forward to deliver high technology, outstanding quality with reliable packaging and testing solutions are the unwavering principles of ChipMOS since its inception. By catching up the industry trend, grasping the opportunity of product growth and continuously consolidating the company's product line, ChipMOS could continue to keep moving forward and growing in the intensified market competition under the influence of down cycle and other external issues. In face of more and more severe industrial environments and challenges, ChipMOS will continuously focus on the core technology development and innovation, to cooperate with customers for reducing operating costs. According to our global business strategies, we remain alongside our strategic customers for supporting their product development roadmap to make progress and grow with them. To maximize value for our shareholders is our endeavor goal.
Looking ahead to 2020 and beyond, although the outlook of Macroeconomics at this stage is uncertain. As a result, ChipMOS will continue to focus on the niche market about automotive electronics and industrial electronics, as well as high-growth markets about smart mobile devices which are driven by the automation in industrial and intellectualized home environments. By offering leading edge and reliable semi-conductor back end turnkey solutions that integrated wafer bumping and assembly, to meet the industry demand and customers’ requirements. Moreover, ChipMOS will actively grasp the growth opportunities of new products such as TDDI and OLED for new specifications of new smart phone demand. ChipMOS is also driving higher efficiency and profit through increased AI and automation to further reduce the operating cost to be able to drive growth in revenue and profitability. We thank you for your continuous support. Chairman: Shih-Jye Cheng President: Shih-Jye Cheng Accounting Officer: Silvia Su
2
II. Company ProfileI. Date of Incorporation: July 28, 1997
II. Company History
Time Milestones
July 1997 Incorporated with paid-in capital of NT$5,000,000,000 and with the name
"ChipMOS TECHNOLOGIES INC."
September 1997 Acquired ISO 9002 certification. (Hsinchu fab.)
October 1997 Became public company.
November 1997 Acquired ISO 14001 certification. (Hsinchu fab.)
August 1998 Completed construction of Tainan fab.
October 1998 Acquired QS 9000 certification. (Hsinchu fab.)
November 1998 Tainan fab. was approved to start the operation and began the commercial
launch of memory IC TSOP/QFP package.
December 1998 Acquired ISO 9002 certification. (Tainan fab.)
June 1999 Established Japanese subsidiary.
July 1999 Acquired Kaohsiung fab. of Microchip Technology Inc. which provided
EEPROM, OTPROM memory IC and logic IC testing services.
July 1999 Became the first professional assembly house in the world to develop
Cross-flow Modeling Technique and began mixed-signal product testing
and Ball Grid Array (BGA) package.
October 1999 Acquired QS 9000 certification (Tainan fab. and Kaohsiung fab. ) and
established U.S. subsidiary of the Company.
April 2000 Started TCP assembly for LCD driver IC semiconductor.
July 2000 Acquired ISO 14001 certification. (Tainan fab.)
October 2000 Acquired CNLA Accreditation(the quality laboratory of the Tainan fab).
November 2000 Started 12" wafer assembly and testing.
January 2001 For the plan of ChipMOS TECHNOLOGIES (Bermuda) LTD. (hereinafter be
referred to as "ChipMOS Bermuda") to list in the United States of America,
the Company's major shareholder, Mosel Vitelic Inc. and other
shareholders, sold 70.25% of the Company's common share to ChipMOS
Bermuda, and at the same time purchased ChipMOS Bermuda's shares by
using the full proceeds obtained from the sale. As of the end of 2001,
ChipMOS Bermuda held 69.7% of the Company's total outstanding shares.
September 2002 Invested into CHANTEK ELECTRONIC CO., LTD. which was mainly
engaged in business of IC assembly.
3

Time Milestones
December 2002 Invested into ThaiLin Semiconductor Corp.
January 2003 Launched successfully high-tech level Chip On Film assembly and testing
technology.
February 2003 Invested into Advanced Micro Chip Technology Co., Ltd. which was
mainly engaged in business of gold bumping production.
August 2003 Completed the preparation of commercial launch of DDR II SDRAM
assembly and testing solution.
December 2003 Acquired ISO 9001:2000 and ISO/TS 16949:2002 certification. (Hsinchu
and Tainan fab.)
December 2003 Started commercial launch of Chip On Glass (COG) for LCD driver IC.
January 2004 Founded ChipMOS Logic TECHNOLOGIES INC. as the joint venture with
ThaiLin Semiconductor Corp. to engage in logic/mixed-signal IC testing
business.
November 2005 The Company merged with CHANTEK ELECTRONIC CO., LTD., with
the Comapny being the surviving company and the capital increased to
NT$8,934,422,910.
January 2006 Acquired ISO/TS 16949:2002 certification (Zhubei fab.)
April 2006 The Company, Oracle and Institute for Information Industry form R&D
alliance to develop a real time information system.
September 2006 Received 14th "Excellent Enterprise Innovation Award" from the MOEA.
February 2007 Cancelled 5,611,797 treasury shares which the Company bought back from the
dissenting shareholders regarding the merger with CHANTEK ELECTRONIC
CO., LTD. and the capital became NT$8,878,304,940 after the cancellation.
May 2007 Completed construction of the second assembly fab. in Tainan.
August 2007 Awarded for 2006 International Trade.
September 2007 The Company and ChipMOS Bermuda consummated share exchange
transaction and the Company became a wholly owned subsidiary of
ChipMOS Bermuda.
October 2009 The Company's Japanese subsidiary was dissolved.
April 2013 Registered at the Emerging Stock Market.
April 2014
June 2015
Listed for trading on the Taiwan Stock Exchange.
Merged with ThaiLin Semiconductor Corp. with the Company being the surviving
company and increased the capital in an amount of NT$359,322,850. Company's
capital became NT$9,005,516,430 after the merger.
4

Time Milestones
October 2016 The Company merged with its parent company, ChipMOS Bermuda, with
the Company being the surviving company. The total outstanding shares
of the Company after the merger were 887,121,261 shares. And issued ADS
of ChipMOS Taiwan trading on NASDAQ Stock Market (Ticker: IMOS)
November 2016 Awarded Bronze grade Award of the 25th Enterprise Environmental
Protection Award.
March 2017 Completed the joint venture with Tsinghua Unigroup in ChipMOS
TECHNOLOGIES (Shanghai) LTD. (renamed Unimos Microelectronics
(Shanghai) Co., Ltd. in July 2018). The Company sold 54.98% of
ChipMOS TECHNOLOGIES (Shanghai) LTD. shares to strategic investors
lead by Tsinghua Unigroup.
November 2017 Awarded Silver grade Award of the 26th Enterprise Environmental
Protection Award.
March 2018 Completed whole investment tranche of Shanghai facility in Q1
August 2018 Honored Top100 and Top 50 larger enterprise of the 2018 CommonWealth’s
CSR Corporate Citizens Award.
November 2018 Awarded Top 50 Taiwan Corporate Sustainability Awards of 2018 Taiwan
Corporate Sustainability Awards.
December 2018 Awarded Gold grade Award of the 27th Enterprise Environmental
Protection Award.
September 2019 Honored Top 50 larger enterprise of the 2019 CommonWealth’s CSR
Corporate Citizens Award.
November 2019 Awarded the Honorary Environmental Protection Enterprise Award & Gold
grade Award of the 1st National Enterprise Environmental Protection
Award.
Awarded Top 50 Taiwan Corporate Sustainability Awards of 2019 Taiwan
Corporate Sustainability Awards (TCSA).
March 2020 Established Shanghai subsidiary.
5

III. Corporate Governance Report I. Organization System
(I) Organization Structure
(II)
(III)
(IV)
Chairman
Audit Office
Compensation Committee
Audit Committee
Board of Directors
President
Shareholders’ Meeting
Management Committee
Finance & Accounting Management Center
Legal Office
Human Resource Management Center
Purchase Division
Automation Integration
Division
Q.R.A. Center
New Product Development
Management Center
Assembly Production Group
I.T.M. Center
Facility Eng. DIvision
Business Management Center
System Engineering Management Division
Operation Manufacturing Center
Testing Production Group
Testing Production Group
Memory Production Group
WB Production Group
LCDD Production Group
CSR Committee
Strategy and Investor Relations
ESH Office
6

(II) Business of Major Departments
President The Company's overall operational targets and performance management.
Audit Office Internal audit and operation process management.
Compensation Committee Enact and periodically review the performance evaluation and policies, systems, standards and structure of compensation.
Audit Committee Supervise the Company's accounting and financial reports, and audit the Company's accounting statements.
Management Committee Draft and plan operation strategies of the Company.
CSR Committee Implement and promote Corporate Social Responsibility (CSR) and sustainable management of the Company.
Strategy and Investor Relations Plan and implementation regarding matters relating to the strategy and investor relations.
Legal Office Handle with issues related to corporate legal affairs.
Purchase Division Plan and implement the procurement of raw materials, equipment and general matters.
ESH Office Responsible for planning and implementing policies related to labors' safety and health and environmental protection.
Finance & Accounting Management Center Financial and accounting services: including capital management, tax management, asset management and other accounting operations.
Human Resource Management Center Human resource management and organizational development.
Business Management Center Responsible for market trend analysis, plans and implementation of matters related to business development and customer service.
Automation Integration Division Promote Intelligent Manufacturing to enhance quality and productivity.
Q.R.A. Center Responsible for the enactment related to the quality development schedule, and plans and implementation related to relevant quality activities.
Facility Eng. Division Maintain and implement power, water, chemical gas and other relevant matters of facilities.
I.T.M. Center Responsible for the structure of information system, management and development of automated system.
New Product Development Management Center Responsible for the management of new production development.
System Engineering Management Division Provide rationalization and optimization plans regarding resources in facilities to high-level managements as policy decision reference.
Operation Manufacturing Center Responsible for production plans and implementation of WB Production Group, Memory Production Group, Testing Production Group, Assembling Production Group, LCDD Production Group and Testing PMC Division.
7

II. I
nfor
mat
ion
of D
irec
tors
, Sup
ervi
sors
, Pre
side
nt, V
ice
Pre
side
nts,
Ass
ista
nt P
resi
dent
s, O
ffic
ers
of D
epar
tmen
ts a
nd B
ranc
hes
(I)
Info
rmat
ion
Reg
ardi
ng D
irec
tors
and
Sup
ervi
sors
1.D
irec
tors
and
sup
ervi
sors
Mar
ch 3
1, 2
020(
Uni
t: sh
ares
; %)
Tit
le
Nat
iona
lity
N
ame
Sex
Dat
e el
ecte
d Te
rmD
ate
firs
t el
ecte
d
Sha
reho
ldin
g w
hen
elec
ted
Sha
reho
ldin
g at
pr
esen
t
Sha
reho
ldin
g at
pre
sent
by
spo
use
and
min
or c
hild
ren
Sha
reho
ldin
g in
the
nam
e of
oth
ers
Maj
or e
duca
tion
/wor
k ex
peri
ence
C
urre
nt p
osit
ions
at t
he C
ompa
ny
or o
ther
com
pani
es
Oth
er o
ffic
ers,
dir
ecto
rs
or s
uper
viso
rs w
ho is
the
spou
se o
r a
rela
tive
w
ithi
n se
cond
de
gree
of
kins
hip
Rem
ark
Sha
res
Sha
reho
ldin
g R
atio
S
hare
s S
hare
hold
ing
Rat
io
Sha
res
Sha
reho
ldin
g R
atio
S
hare
s S
hare
hold
ing
Rat
io
Tit
leN
ame
Rel
atio
n
Cha
irm
an
R.O
.C.
(Tai
wan
) S
hih-
Jye
Che
ng
M20
19.
06.1
0 3
year
s 19
97.
07.1
7 12
,150
,161
1.64
%6,
150,
161
0.85
%-
-6,
244,
777
0.86
%
MB
A, S
agin
aw V
alle
y S
tate
U
nive
rsit
y D
irec
tor
of M
osel
Vit
elic
Inc
.D
irec
tor
of U
ltim
a E
lect
roni
cs C
orp.
C
hair
man
of A
dvan
ced
Mic
ro
Chi
p Te
chno
logy
Co.
, Ltd
. C
hair
man
of
Chi
pMO
S
TE
CH
NO
LO
GIE
S
(Sha
ngha
i) L
TD
. C
hair
man
of
CH
AN
TE
K
EL
EC
TR
ON
ICS
CO
., LT
D.
Cha
irm
an o
f C
hipM
OS
Log
ic
TE
CH
NO
LO
GIE
S I
NC
. D
irec
tor
of S
ynta
x-B
rill
ian
Cor
p.
Cha
irm
an o
f T
haiL
in
Sem
icon
duct
or C
orp.
Pre
side
nt o
f C
hipM
OS
T
EC
HN
OL
OG
IES
IN
C.
Dir
ecto
r of
Chi
pMO
S
U.S
.A.,
Inc.
V
ice
Cha
irm
an o
f U
nim
os
Mic
roel
ectr
onic
s (S
hang
hai)
C
o., L
td.
Rep
rese
ntat
ive
& D
irec
tor
of H
ao H
sian
g In
vest
men
t C
o., L
td.
Rep
rese
ntat
ive
& D
irec
tor
of C
hin
Hsi
ang
Inve
stm
ent
Co.
, Ltd
. R
epre
sent
ativ
e &
Dir
ecto
r of
Hao
Yen
Inv
estm
ent C
o.,
Ltd
..
--
-N
ote
2
Dir
ecto
r
R.O
.C.
(Tai
wan
)
Sil
icon
war
e P
reci
sion
In
dust
ries
Co.
, L
td.
N/A
2019
.06
.10
3 ye
ars
1997
.07
.17
148,
910,
390
20.1
2%14
8,91
0,39
020
.48%
N/A
N/A
N
/A
N/A
N
/AN
/AN
/AN
/A
N/A
-
R.O
.C.
(Tai
wan
)
Tere
sa W
ang
(rep
rese
ntat
ive)
F
20
19.
06.1
0 3
year
s 20
19.
06.1
0 -
-
-
-
-
-
-
-
Bac
helo
r, A
ccou
ntin
g an
d S
tati
stic
s, M
ing
Chu
ang
Col
lege
C
hief
Fin
anci
al O
ffic
er o
f C
amel
Pre
cisi
on C
o., L
td.
Dir
ecto
r of
Uni
mic
ron
Tech
nolo
gy C
orp.
Dir
ecto
r / S
enio
r S
peci
al
Ass
ista
nt o
f S
ilic
onw
are
Pre
cisi
on I
ndus
trie
s C
o.,
Ltd
. D
irec
tor
of R
adio
Flu
x C
o.,
Ltd
.
--
--
Dir
ecto
r R
.O.C
.(T
aiw
an)
Sil
icon
war
e P
reci
sion
In
dust
ries
Co.
, L
td.
N/A
2019
.06
.10
3 ye
ars
1997
.07
.17
148,
910,
390
20.1
2%14
8,91
0,39
020
.48%
N/A
N/A
N
/A
N/A
N
/AN
/AN
/AN
/A
N/A
-
8

Tit
le
Nat
iona
lity
N
ame
Sex
Dat
e el
ecte
d Te
rmD
ate
firs
t el
ecte
d
Sha
reho
ldin
g w
hen
elec
ted
Sha
reho
ldin
g at
pr
esen
t
Sha
reho
ldin
g at
pre
sent
by
spo
use
and
min
or c
hild
ren
Sha
reho
ldin
g in
the
nam
e of
oth
ers
Maj
or e
duca
tion
/wor
k ex
peri
ence
C
urre
nt p
osit
ions
at t
he C
ompa
ny
or o
ther
com
pani
es
Oth
er o
ffic
ers,
dir
ecto
rs
or s
uper
viso
rs w
ho is
the
spou
se o
r a
rela
tive
w
ithi
n se
cond
de
gree
of
kins
hip
Rem
ark
Sha
res
Sha
reho
ldin
g R
atio
S
hare
s S
hare
hold
ing
Rat
io
Sha
res
Sha
reho
ldin
g R
atio
S
hare
s S
hare
hold
ing
Rat
io
Tit
leN
ame
Rel
atio
n
R.O
.C.
(Tai
wan
)
Bri
ght Y
eh
(rep
rese
ntat
ive)
M
2019
.06
.10
3 ye
ars
2019
.06
.10
-
-
-
-
--
-
-
Mas
ter,
Indu
stri
al
Eng
inee
ring
, Nat
iona
l Tsi
ng
Hua
Uni
vers
ity
Ent
erpr
ise
Ope
rati
on
Pla
nnin
g D
ivis
ion
Dir
ecto
r of
U
nite
d M
icro
elec
tron
ics
Cor
p.
Vic
e P
resi
dent
of
Sil
icon
war
e P
reci
sion
In
dust
ries
Co.
, Ltd
. D
irec
tor
of S
ilic
onw
are
Tech
nolo
gy (
SuZ
hou)
Ltd
.-
--
-
Dir
ecto
r R
.O.C
. (T
aiw
an)
Laf
air
Cho
M20
19.
06.1
0 3
year
s 20
03.
10.0
1 10
1,99
00.
01%
101,
990
0.01
%-
-
-
-
Mas
ter,
Indu
stri
al
Man
agem
ent,
Nat
iona
l Che
ng
Kun
g U
nive
rsit
y M
anag
er o
f M
osel
Vit
elic
In
c.
Cha
irm
an &
Pre
side
nt o
f T
haiL
in S
emic
ondu
ctor
Cor
p.V
ice
Pre
side
nt o
f th
e m
emor
y pr
oduc
tion
gro
up f
rom
C
hipM
OS
TE
CH
NO
LO
GIE
S
INC
.
Sen
ior
Exe
cuti
ve V
ice
Pre
side
nt &
Chi
ef O
pera
ting
O
ffic
er o
f C
hipM
OS
T
EC
HN
OL
OG
IES
IN
C.
Cha
irm
an o
f C
hipM
OS
T
EC
HN
OL
OG
IES
(B
VI)
LT
D.
Cha
irm
an o
f C
hipM
OS
U
.S.A
., In
c.
--
--
9

Tit
le
Nat
iona
lity
N
ame
Sex
Dat
e el
ecte
d Te
rmD
ate
firs
t el
ecte
d
Sha
reho
ldin
g w
hen
elec
ted
Sha
reho
ldin
g at
pr
esen
t
Sha
reho
ldin
g at
pre
sent
by
spo
use
and
min
or c
hild
ren
Sha
reho
ldin
g in
the
nam
e of
oth
ers
Maj
or e
duca
tion
/wor
k ex
peri
ence
C
urre
nt p
osit
ions
at t
he C
ompa
ny
or o
ther
com
pani
es
Oth
er o
ffic
ers,
dir
ecto
rs
or s
uper
viso
rs w
ho is
the
spou
se o
r a
rela
tive
w
ithi
n se
cond
de
gree
of
kins
hip
Rem
ark
Sha
res
Sha
reho
ldin
g R
atio
S
hare
s S
hare
hold
ing
Rat
io
Sha
res
Sha
reho
ldin
g R
atio
S
hare
s S
hare
hold
ing
Rat
io
Tit
leN
ame
Rel
atio
n
Inde
pend
ent
Dir
ecto
r R
.O.C
. (T
aiw
an)
Chi
n-S
hyh
Ou
M20
19.
06.1
0 3
year
s 20
07.
06.2
8 -
--
-
-
-
-
-
Ph.
D.,
Bus
ines
s A
dmin
istr
atio
n (A
ccou
ntin
g),
Uni
vers
ity
of M
inne
sota
, U
SA
A
ccou
ntin
g P
rofe
ssor
&
Cha
irm
an o
f th
e D
epar
tmen
t of
Acc
ount
ing
at N
atio
nal
Chu
ng C
heng
Uni
vers
ity
Dir
ecto
r of
Chi
pMO
S
TE
CH
NO
LO
GIE
S
(Ber
mud
a) L
TD
.
Cha
ir P
rofe
ssor
of
D
epar
tmen
t of A
ccou
ntin
g an
d In
form
atio
n S
yste
ms
at
Asi
a U
nive
rsit
y
Hon
orar
y P
rofe
ssor
of
Dep
artm
ent o
f Acc
ount
ing
and
Info
rmat
ion
Tech
nolo
gyat
Nat
iona
l Chu
ng C
heng
U
nive
rsit
y In
depe
nden
t Dir
ecto
r /
Com
pens
atio
n C
omm
itte
e m
embe
r of
Chi
Hua
Fit
ness
C
o.In
depe
nden
t Dir
ecto
r /
Aud
it C
omm
itte
e m
embe
r /
Com
pens
atio
n C
omm
itte
e m
embe
r of
Tsa
ng Y
ow
Indu
stri
al C
o., L
td.
Inde
pend
ent D
irec
tor
/
Aud
it C
omm
itte
e m
embe
r /
Com
pens
atio
n C
omm
itte
e m
embe
r of
Yon
g C
hang
In
tern
atio
nal C
o., L
td.
(Cay
man
)
--
-
-
Inde
pend
ent
Dir
ecto
r R
.O.C
. (T
aiw
an)
Yuh
-Fon
g Ta
ng
M20
19.
06.1
0 3
year
s 20
13.
06.1
7 -
-
-
-
-
-
-
-
Ph.
D.,
Ele
ctri
cal E
ngin
eeri
ng,
Uni
vers
ity
of I
llin
ois,
US
A
Vic
e C
hair
man
of
Pac
k-L
ink
Man
agem
ent C
orp.
S
uper
viso
r of
Tru
eLig
ht
Cor
p.
Inde
pend
ent D
irec
tor
of
Zhe
ngyu
an T
echn
olog
y C
o.,
Ltd
. C
hair
man
of
Com
pens
atio
n C
omm
itte
e of
Car
niva
l In
dust
rial
Cor
p.
Cha
irm
an &
CE
O o
f M
yson
C
entu
ry, I
nc.
Cha
irm
an o
f Z
AV
IO I
nc.
Com
pens
atio
n C
omm
itte
e m
embe
r of
OP
NE
T
Tech
nolo
gies
Co.
, Ltd
. C
onsu
ltan
t of
Inte
llig
ent
Sil
icon
Sol
utio
n C
orp.
--
-
-
10

Tit
le
Nat
iona
lity
N
ame
Sex
Dat
e el
ecte
d Te
rmD
ate
firs
t el
ecte
d
Sha
reho
ldin
g w
hen
elec
ted
Sha
reho
ldin
g at
pr
esen
t
Sha
reho
ldin
g at
pre
sent
by
spo
use
and
min
or c
hild
ren
Sha
reho
ldin
g in
the
nam
e of
oth
ers
Maj
or e
duca
tion
/wor
k ex
peri
ence
C
urre
nt p
osit
ions
at t
he C
ompa
ny
or o
ther
com
pani
es
Oth
er o
ffic
ers,
dir
ecto
rs
or s
uper
viso
rs w
ho is
the
spou
se o
r a
rela
tive
w
ithi
n se
cond
de
gree
of
kins
hip
Rem
ark
Sha
res
Sha
reho
ldin
g R
atio
S
hare
s S
hare
hold
ing
Rat
io
Sha
res
Sha
reho
ldin
g R
atio
S
hare
s S
hare
hold
ing
Rat
io
Tit
leN
ame
Rel
atio
n
Inde
pend
ent
Dir
ecto
r R
.O.C
. (T
aiw
an)
Tai-
Hau
r K
uoM
2019
.06
.10
3 ye
ars
2013
.06
.17
--
-
-
-
-
-
-
Ph.
D.,
Ele
ctri
cal E
ngin
eeri
ng,
Uni
vers
ity
of M
aryl
and,
US
AD
irec
tor
of Z
illt
ek
Tech
nolo
gy C
orp.
Pro
fess
or o
f D
epar
tmen
t of
Ele
ctri
cal E
ngin
eeri
ng a
t
Nat
iona
l Che
ng K
ung
Uni
vers
ity
Inde
pend
ent D
irec
tor
/ Aud
it
Com
mit
tee
mem
ber
/ C
ompe
nsat
ion
Com
mit
tee
mem
ber
of H
olte
k S
emic
ondu
ctor
Inc
.
--
-
-
Inde
pend
ent
Dir
ecto
r R
.O.C
. (T
aiw
an)
Kue
i-A
nn
Wen
F
20
19.
06.1
0 3
year
s 20
15.
06.0
3 -
--
-
-
-
-
-
Ph.
D.,
Inst
itut
e of
E
lect
rica
l E
ngin
eeri
ng, N
atio
nal C
heng
K
ung
Uni
vers
ity
Ass
ocia
te D
ean
of
Col
lege
of
Ele
ctri
cal a
nd C
ompu
ter
Eng
inee
ring
at
Nat
iona
l C
hiao
Tun
g U
nive
rsit
y A
ssoc
iate
Dea
n of
Off
ice
of
Res
earc
h an
d D
evel
opm
ent a
tN
atio
nal C
hiao
Tun
g U
nive
rsit
y
Pro
fess
or o
f D
epar
tmen
t of
Ele
ctro
nic
Eng
inee
ring
and
In
stit
ute
of E
lect
roni
cs a
t
Nat
iona
l Chi
ao T
ung
Uni
vers
ity
Chi
ef E
xecu
tive
Off
icer
of
Str
ateg
ic D
evel
opm
ent
Off
ice
at N
atio
nal C
hiao
T
ung
Uni
vers
ity
In
depe
nden
t Dir
ecto
r / A
udit
C
omm
itte
e m
embe
r /
Com
pens
atio
n C
omm
itte
e m
embe
r of
Xin
tec
Inc
Vic
e D
ean
of I
nter
nati
onal
C
olle
ge o
f S
emic
ondu
ctor
Te
chno
logy
at N
atio
nal
Chi
ao T
ung
Uni
vers
ity
--
-
-
Inde
pend
ent
Dir
ecto
r R
.O.C
. (T
aiw
an)
Jing
-Sha
n A
urM
2019
.06
.10
3 ye
ars
2013
.06
.17
261,
123
0.04
%26
1,12
30.
04%
--
-
-
Bac
helo
r, M
arin
e E
ngin
eeri
ng, N
atio
nal T
aiw
an
Oce
an U
nive
rsit
y P
resi
dent
of
Uni
mic
ron
Tech
nolo
gy C
orp.
S
uper
visi
or o
f U
nim
icro
n Te
chno
logy
Cor
p.
Cha
irm
an o
f AP
TO
S
(Tai
wan
) C
orp.
M
anag
ing
Dir
ecto
r of
Uni
ted
Mic
roel
ectr
onic
s C
orp.
D
irec
tor
of S
ilic
onw
are
Pre
cisi
on I
ndus
trie
s C
o., L
td.
Dir
ecto
r of
RS
EA
E
ngin
eeri
ng C
orp.
C
ompe
nsat
ion
Com
mit
tee
mem
ber
of S
ilic
onw
are
Pre
cisi
on I
ndus
trie
s C
o.,
Ltd
. -
--
-
11

Not
e 1:
The
aut
hori
ty o
f th
e C
ompa
ny’s
sup
ervi
sors
sha
ll b
e ex
erci
sed
by A
udit
Com
mit
tee
com
pose
d of
Ind
epen
dent
Dir
ecto
rs.
Not
e 2:
The
rea
sona
blen
ess,
nec
essi
ty th
ereo
f, a
nd th
e m
easu
res
adop
ted
in r
espo
nse
ther
eto
of th
e P
resi
dent
and
cha
irpe
rson
of
the
boar
d of
dir
ecto
rs o
f th
e C
ompa
ny a
re th
e sa
me
pers
on:
The
Boa
rd o
f D
irec
tors
is
the
Com
pany
's h
ighe
st g
over
nanc
e un
it a
nd t
he c
ente
r fo
r m
akin
g bu
sine
ss d
ecis
ions
. It
sup
ervi
ses
the
man
agem
ent,
exer
cise
its
pow
ers
in a
ccor
danc
e w
ith
law
s an
d re
gula
tion
s, a
nd i
s be
ing
resp
onsi
ble
to th
e co
mpa
ny a
nd it
s sh
areh
olde
rs.
The
per
son
whe
ser
ves
the
Cha
irm
an a
nd P
resi
dent
, in
ord
er t
o m
axim
ize
the
Com
pany
's v
alue
, he
mus
t fu
lly
gras
p th
e op
erat
ion
info
rmat
ion
and
stat
us,
so t
hat
the
oper
atin
g ef
fici
ency
is
incr
ease
d an
d th
e de
cisi
on-m
akin
g is
exe
cute
d m
ore
smoo
thly
. T
he C
ompa
ny h
as l
ong
been
com
mit
ted
to d
eepe
ning
cor
pora
te g
over
nanc
e an
d co
rpor
ate
soci
al r
espo
nsib
ilit
y. B
y in
crea
sing
the
num
ber
of i
ndep
ende
nt d
irec
tors
to
5 an
d se
ttin
g up
fun
ctio
nal
com
mit
tees
, in
depe
nden
t di
rect
ors
are
appo
inte
d as
mem
bers
of
the
com
mit
tee.
Wit
h it
s in
depe
nden
ce a
nd p
rofe
ssio
nali
sm,
it p
rovi
des
boar
d de
cisi
on-m
akin
g su
gges
tion
s an
d st
reng
then
s di
rect
or s
uper
visi
on a
nd d
ecis
ion
qual
ity.
Mor
e th
an h
alf
of th
e C
ompa
ny’s
dir
ecto
rs n
eith
er e
mpl
oyee
nor
off
icer
of
the
Com
pany
.
2.M
ajor
Sha
reho
lder
s of
Chi
pMO
S’s
Ins
titu
tion
al S
hare
hold
ers
Mar
ch 3
1, 2
020
Nam
e of
Ins
titut
iona
l Sha
reho
lder
s M
ajor
Sha
reho
lder
s
Nam
eS
hare
hold
ing
Rat
io(%
)
Sili
conw
are
Pre
cisi
on I
ndus
trie
s C
o., L
td.
AS
E T
echn
olog
y H
oldi
ng, C
o., L
td
100%
3.M
ajor
Sha
reho
lder
s of
Ins
titu
tion
al S
hare
hold
ers
Who
m A
re M
ajor
Sha
reho
lder
s of
Chi
pMO
S's
Ins
titu
tion
al S
hare
hold
ers
Feb
urar
y 29
, 202
0
Nam
e of
Ins
titut
iona
l Sha
reho
lder
s M
ajor
Sha
reho
lder
s
Nam
eS
hare
hold
ing
Rat
io(%
)
AS
E T
echn
olog
y H
oldi
ng, C
o., L
td
A.S
.E E
nter
pris
es L
imit
ed
15.8
0%
HS
BC
: ent
rust
ed w
ith
the
Com
pany
’s in
vest
men
t acc
ount
6.
01%
Citi
bank
Tai
wan
: cus
tody
of A
SE
Dep
osito
ry C
ertif
icat
es
5.81
%
Cat
hay
Lif
e In
sura
nce
Co.
,Ltd
. 3.
87%
Cit
iban
k Ta
iwan
: cus
tody
of
the
Sin
gapo
re g
over
nmen
t inv
estm
ent a
ccou
nt
3.44
%
Fub
on L
ife
Insu
ranc
e C
o.,L
td.
3.05
%
Tru
st a
ccou
nt o
f B
rilli
ant C
apita
l Pro
fits
Lim
ited,
with
HS
BC
Ban
k as
the
cust
odia
n tr
uste
e 2.
79%
New
Lab
or P
ensi
on F
und
1.90
%
Nan
shan
Lif
e In
sura
nce
Co.
,Ltd
. 1.
67%
The
inve
stm
ent a
ccou
nt o
f M
a S
hi I
nves
tmen
t Fun
d C
orpo
rati
on u
nder
cus
tody
of
bank
of
Taiw
an1.
66%
12

4. Information regarding the independence of directors and supervisorsMarch 31, 2020
Criteria
Name
Has at least 5 years of work experience and meet one of the following
professional qualifications
Qualification regarding the independence criteria (Note)
Number of other public
companiesconcurrentlyserving as anindependent
director
An instructor or higher in a department of commerce, law, finance, accounting, or other academic department related to the business needs of the company in a public or private junior college, college, or university
A judge, public prosecutor, attorney, certified public accountant, or other professional or technical specialist who has passed a national examination and been awarded a certificate in a profession necessary for the business of the company
Have work experience in the area of commerce, law, finance, or accounting, or otherwise necessary for the business of the company.
1 2 3 4 5 6 7 8 9 10 11 12
Shih-Jye Cheng
V V V V V V V —
Teresa Wang
V V V V V V V V V V V —
Bright Yeh V V V V V V V V V V V —
Lafair Cho V V V V V V V V —
Chin-Shyh Ou
V V V V V V V V V V V V V V V 2
Yuh-Fong Tang
V V V V V V V V V V V V V —
Tai-Haur Kuo
V V V V V V V V V V V V V V 1
Kuei-Ann Wen
V V V V V V V V V V V V V V 1
Jing-Shan Aur
V V V V V V V V V V V V V —
Note: If the director or supervisor meets any of the following criteria in the two years before being elected or during the term of office, please check "V" the corresponding boxes:
1. Not an employee of the company or any of its affiliates.2. Not a director or supervisor of the company or any of its affiliates.3. Not a natural-person shareholder who holds shares, together with those held by the person’s spouse, minor children,
or held by the person under others’ names, in an aggregate amount of one percent or more of the total number ofissued shares of the company or ranks as one of its top ten shareholders.
4. Not a spouse, relative within the second degree of kinship, or lineal relative within the third degree of kinship, of anyof the officer in the preceding 1 subparagraph, or of any of the above persons in the preceding subparagraphs 2 and 3.
5. Not a director, supervisor, or employee of a corporate/institutional shareholder that directly holds five percent ormore of the total number of issued shares of the company, ranks as of its top five shareholders, or has representativedirector(s) serving on the company’s board based on Article 27 of the Company Law.
13

6. Not a director, supervisor, or employee of a company of which the majority of board seats or voting shares is controlled by a company that also controls the same of the company.
7. Not a director, supervisor, or employee of a company of which the chairman or CEO (or equivalent) themselves or their spouse also serve as the company’s chairman or CEO (or equivalent).
8. Not a director, supervisor, officer, or shareholder holding five percent or more of the shares of a specified company or institution that has a financial or business relationship with the company.
9. Other than serving as a compensation committee member of the company, not a professional individual who, or an owner, partner, director, supervisor, or officer of a sole proprietorship, partnership, company, or institution that, provides commercial, legal, financial, accounting services or consultation to the company or to any affiliate of the company, or a spouse thereof, and the service provided is an “audit service” or a “non-audit service which total compensation within the recent two years exceeds NTD500,000”.
10. Not having a marital relationship, or a relative within the second degree of kinship to any other director of the company.
11. Not been a person of any conditions defined in Article 30 of the Company Law. 12. Not a governmental, juridical person or its representative as defined in Aticle 27 of the Company Law.
14

(II)
Pro
file
of
Pre
side
nt, V
ice
Pre
side
nts,
Ass
ista
nt V
ice
Pre
side
nts
and
Off
icer
s of
Dep
artm
ents
and
Bra
nche
s M
arch
31,
202
0 (U
nit:
shar
es; %
)
Tit
leN
atio
nali
tyN
ame
Sex
D
ate
appo
inte
d
Sha
reho
ldin
g S
hare
hold
ing
by s
pous
e an
d m
inor
chi
ldre
n S
hare
hold
ing
in th
e na
me
of o
ther
s M
ajor
edu
cati
on/w
ork
expe
rien
ce
Cur
rent
po
siti
ons
at
othe
r co
mpa
nies
Oth
er m
anag
er w
ho is
the
spou
se o
r a
rela
tive
wit
hin
seco
nd d
egre
e of
kin
ship
R
emar
ks
Sha
res
Sha
reho
ldin
g R
atio
S
hare
s S
hare
hold
ing
Rat
io
Sha
res
Sha
reho
ldin
g R
atio
T
itle
N
ame
Rel
atio
n
Pre
side
nt
R.O
.C(T
aiw
an)
Shi
h-Jy
e C
heng
M
19
98.
07.1
7 6,
150,
161
0.85
%-
-
6,
244,
777
0.86
% M
BA
, Sag
inaw
Val
ley
Sta
te U
nive
rsit
y
Dir
ecto
r, M
osel
Vit
elic
Inc
. D
irec
tor
of U
ltim
a E
lect
roni
cs C
orp.
C
hair
man
of A
dvan
ced
Mic
ro C
hip
Tech
nolo
gy C
o., L
td.
Cha
irm
an o
f C
hipM
OS
TE
CH
NO
LO
GIE
S
(Sha
ngha
i) L
TD
. C
hair
man
of
CH
AN
TE
K E
LE
CT
RO
NIC
S
CO
., LT
D.
Cha
irm
an o
f C
hipM
OS
Log
ic
TE
CH
NO
LO
GIE
S I
NC
. D
irec
tor
of S
ynta
x-B
rill
ian
Cor
p.
Cha
irm
an o
f T
haiL
in S
emic
ondu
ctor
Cor
p.
Not
e 1
--
-
Not
e 6
Sen
ior
Exe
cuti
ve
Vic
e P
resi
dent
&
Chi
ef
Ope
rati
ng
Off
icer
R.O
.C(T
aiw
an)
Laf
air
Cho
M
20
15.
06.1
7 10
1,99
00.
01%
-
--
-
Mas
ter,
Indu
stri
al M
anag
emen
t, N
atio
nal
Che
ng K
ung
Uni
vers
ity
Man
ager
of
Mos
el V
itel
ic I
nc.
Cha
irm
an &
Pre
side
nt, T
haiL
in
Sem
icon
duct
or C
orp.
V
ice
Pre
side
nt o
f th
e m
emor
y pr
oduc
tion
gr
oup
from
Chi
pMO
S T
EC
HN
OL
OG
IES
IN
C.
Not
e 2
--
--
Vic
e P
resi
dent
, M
emor
y P
rodu
ctio
n G
roup
R.O
.C(T
aiw
an)
Wu-
Hun
g H
su
M
2004
. 11
.01
233,
728
0.03
%-
-
--
Bac
helo
r, A
utom
atic
Con
trol
Eng
inee
ring
, F
eng
Chi
a U
nive
rsit
y D
eput
y M
anag
er, E
quip
men
t Div
isio
n, M
osel
V
itel
ic I
nc.
Dir
ecto
r, M
emor
y E
ngin
eeri
ng D
ivis
ion,
C
hipM
OS
TE
CH
NO
LO
GIE
S I
NC
.
Non
e-
--
-
Vic
e P
resi
dent
, S
trat
egy
and
Inve
stor
R
elat
ions
&
Spo
kesp
erso
n
R.O
.C(T
aiw
an)
Jess
e H
uang
M
20
07.
04.1
7 29
3,22
30.
04%
-
--
-
Bac
helo
r, P
hysi
cs, S
ooch
ow U
nive
rsit
y V
ice
Pre
side
nt, A
ssem
bly
Pro
duct
ion
Gro
up,
Chi
pMO
S T
EC
HN
OL
OG
IES
IN
C.
Not
e 3
--
--
Vic
e P
resi
dent
, A
ssem
bly
Pro
duct
ion
Gro
up
R.O
.C(T
aiw
an)
Jin-
Lon
g F
ang
M
2018
. 07
.01
12,1
97-
--
--
Mas
ter,
Ele
ctri
cal E
ngin
eeri
ng, N
atio
nal S
un
Yat
-sen
Uni
vers
ity
Bac
helo
r, D
epar
tmen
t of
Ele
ctri
cal
Eng
inee
ring
, Nat
iona
l Tai
wan
Oce
an
Uni
vers
ity
Pro
cess
Eng
inee
r, P
hili
ps E
lect
roni
c B
uild
ing
Ele
men
ts(T
aiw
an)
Ltd
.
Non
e-
--
-
15

Tit
le
Nat
iona
lity
Nam
e S
ex
Dat
e ap
poin
ted
Sha
reho
ldin
g S
hare
hold
ing
by s
pous
e an
d m
inor
chi
ldre
n S
hare
hold
ing
in th
e na
me
of o
ther
s M
ajor
edu
cati
on/w
ork
expe
rien
ce
Cur
rent
po
siti
ons
at
othe
r co
mpa
nies
Oth
er m
anag
er w
ho is
the
spou
se o
r a
rela
tive
wit
hin
seco
nd d
egre
e of
kin
ship
R
emar
ks
Sha
res
Sha
reho
ldin
g R
atio
S
hare
s S
hare
hold
ing
Rat
io
Sha
res
Sha
reho
ldin
g R
atio
T
itle
N
ame
Rel
atio
n
Vic
e P
resi
dent
, L
CD
D
Pro
duct
ion
Gro
up
R.O
.C(T
aiw
an)
Yua
n-F
eng
Hsu
M
20
12.
03.0
6 22
0,13
00.
03%
-
-
-
-
Mas
ter,
Ele
ctri
cal E
ngin
eeri
ng, N
atio
nal S
un
Yat
-sen
Uni
vers
ity
Ass
ista
nt, N
atio
nal C
heng
Kun
g U
nive
rsit
y S
enio
r P
roje
ct L
eade
r E
ngin
eer,
Phi
lips
E
lect
roni
c B
uild
ing
Ele
men
ts(T
aiw
an)
Ltd
.
Not
e 3
-
--
-
Vic
e P
resi
dent
, F
inan
ce
&
Acc
ount
ing
Man
agem
ent
Cen
ter
R.O
.C(T
aiw
an)
Sil
via
Su
F
2017
. 10
.01
96,0
410.
01%
-
-
-
-
Mas
ter,
Uni
vers
ity
of L
eeds
S
enio
r D
irec
tor,
Chi
pMO
S T
EC
HN
OL
OG
IES
IN
C.
Dir
ecto
r, T
hail
in S
emic
ondu
ctor
Cor
p.
Not
e 4
-
--
-
Vic
e P
resi
dent
, B
usin
ess
Man
agem
ent
Cen
ter
R.O
.C(T
aiw
an)
Min
g-C
heng
L
in
M
2014
. 06
.01
84,9
920.
01%
-
-
-
-
Bac
helo
r, In
dust
rial
Eng
inee
ring
and
E
ngin
eeri
ng M
anag
emen
t, N
atio
nal T
sing
Hua
U
nive
rsit
y M
aste
r, In
dust
rial
Eng
inee
ring
and
M
anag
emen
t, Y
uan
Ze
Uni
vers
ity
Man
ager
, Pro
duct
ion
Man
agem
ent
Dep
artm
ent,
Wal
ton
Adv
ance
d E
ngin
eeri
ng
Inc.
V
ice
Pre
side
nt, M
arke
ting
, Chi
pMO
S
TE
CH
NO
LO
GIE
S I
NC
.
Non
e-
-
-
-
Vic
e P
resi
dent
, H
uman
Res
ourc
e M
anag
emen
t C
ente
r
R.O
.C(T
aiw
an)
Yu-
Yin
g C
hen
F
2012
. 06
.15
217,
580
0.03
%-
-
-
-
Bac
helo
r, B
usin
ess
Adm
inis
trat
ion,
Soo
chow
U
nive
rsit
y M
osel
Vit
elic
Inc
. N
one
-
--
-
Vic
e P
resi
dent
, Q
.R.A
. Cen
ter
R.O
.C(T
aiw
an)
Teng
-Yue
h Ts
ai
M
2012
. 03
.06
262,
572
0.04
%-
-
-
-
Mas
ter,
Res
ourc
es E
ngin
eeri
ng, N
atio
nal
Che
ng K
ung
Uni
vers
ity
Glo
ria
Mat
eria
l Tec
hnol
ogy
Cor
p.
Phi
lips
Ele
ctro
nic
Bui
ldin
g E
lem
ents
(Ta
iwan
) L
td.
Ass
ista
nt V
ice
Pre
side
nt, Q
.R.A
. Cen
ter,
Chi
pMO
S T
EC
HN
OL
OG
IES
IN
C.
Not
e 5
-
--
-
Vic
e P
resi
dent
, Te
stin
g
Pro
duct
ion
Gro
up
R.O
.C(T
aiw
an)
Che
n-F
ang
Hua
ng
M
2013
. 07
.01
153,
483
0.02
%-
-
-
-
Mas
ter,
Tech
nolo
gy M
anag
emen
t, N
atio
nal
Tsin
g H
ua U
nive
rsit
y D
eput
y M
anag
er, W
afer
Tes
ting
Dep
artm
ent,
Mos
el V
itel
ic I
nc.
Dir
ecto
r, W
afer
Tes
ting
Eng
inee
ring
Div
isio
n,
Chi
pMO
S T
EC
HN
OL
OG
IES
IN
C.
Non
e-
-
-
-
Vic
e P
resi
dent
, I.
T.M
. Cen
ter
R.O
.C(T
aiw
an)
Cha
ng-L
ung
Li
M
2014
. 08
.18
101,
990
0.01
%-
-
-
-
Mas
ter,
Tra
nspo
rtat
ion
Man
agem
ent S
cien
ce,
Nat
iona
l Che
ng K
ung
Uni
vers
ity
Vic
e P
resi
dent
, AV
erM
edia
Tec
hnol
ogie
s, I
nc.
Vic
e P
resi
dent
, Ora
cle
Vic
e P
resi
dent
, Pic
oway
Tec
hnol
ogy
Inc.
Non
e-
-
-
-
16

Tit
leN
atio
nali
tyN
ame
Sex
D
ate
appo
inte
d
Sha
reho
ldin
g S
hare
hold
ing
by s
pous
e an
d m
inor
chi
ldre
n S
hare
hold
ing
in th
e na
me
of o
ther
s M
ajor
edu
cati
on/w
ork
expe
rien
ce
Cur
rent
po
siti
ons
at
othe
r co
mpa
nies
Oth
er m
anag
er w
ho is
the
spou
se o
r a
rela
tive
wit
hin
seco
nd d
egre
e of
kin
ship
R
emar
ks
Sha
res
Sha
reho
ldin
g R
atio
S
hare
s S
hare
hold
ing
Rat
io
Sha
res
Sha
reho
ldin
g R
atio
T
itle
N
ame
Rel
atio
n
Sen
ior
Dir
ecto
r, W
B
Pro
duct
ion
Gro
up
R.O
.C(T
aiw
an)
Cha
o-T
ung
So
M
2016
. 11
.01
--
--
--
Mas
ter,
Phy
sics
, Fu
Jen
Uni
vers
ity
Dep
uty
Dir
ecto
r, E
ngin
eeri
ng C
ente
r, S
ilic
onw
are
Pre
cisi
on I
ndus
trie
s C
o., L
td.
Dir
ecto
r, In
tern
atio
nal M
arke
ting
Off
ice,
M
erck
Tai
wan
Non
e-
--
-
Sen
ior
Dir
ecto
r, N
ew
Pro
duct
D
evel
opm
ent
Man
agem
ent
Cen
ter
R.O
.C(T
aiw
an)
JB C
hyi
M
2019
. 04
.25
11,0
49-
--
--
Bac
helo
r, M
athe
mat
is, T
amka
ng U
nive
rsit
y D
irec
tor,
AD
L E
ngin
eeri
ng I
nc.
Vic
e P
resi
dent
, Uni
on S
emic
ondu
ctor
Co.
, L
td.
Sen
ior
Man
ager
Dir
ecto
r, C
hipM
OS
T
EC
HN
OL
OG
IES
IN
C.
Non
e-
--
-
Man
ager
, A
udit
O
ffic
e R
.O.C
(Tai
wan
)L
ing
Che
ng
F
2019
. 07
.12
21,0
99-
--
--
Bac
helo
r, F
inan
ce, C
hung
Hua
Uni
ver s
ity
Dep
uty
Man
ager
, Pro
MO
S T
EC
HN
OL
OG
IES
IN
C.
Inte
rnal
Aud
it O
ffic
er, T
haiL
in S
emic
ondu
ctor
C
orp.
Non
e-
--
-
Not
e 1:
Dir
ecto
r of
Chi
pMO
S U
.S.A
., In
c.; D
eput
y C
hair
man
of
Uni
mos
Mic
roel
ectr
onic
s (S
hang
hai)
Co.
, Ltd
.; R
epre
sent
ativ
e &
Dir
ecto
r of
Hao
Hsi
ang
Inve
stm
ent C
o., L
td.;
Rep
rese
ntat
ive
& D
irec
tor
of C
hin
Hsi
ang
Inve
stm
ent C
o., L
td.;
Rep
rese
ntat
ive
& D
irec
tor
of H
ao Y
en I
nves
tmen
t Co.
, Ltd
. N
ote
2: C
hair
man
of
Chi
pMO
S T
EC
HN
OL
OG
IES
(B
VI)
LT
D.;
Cha
irm
an o
f C
hipM
OS
U.S
.A.,
Inc.
Not
e 3:
Dir
ecto
r of
JM
C E
lect
roni
cs C
o., L
td.
Not
e 4:
Dir
ecto
r of
Chi
pMO
S U
.S.A
., In
c.;
Sup
ervi
sor
of U
nim
os M
icro
elec
tron
ics
(Sha
ngha
i) C
o., L
td.;
Dir
ecto
r of
Chi
pMO
S T
EC
HN
OL
OG
IES
(B
VI)
LT
D.;
Sup
ervi
sor
of
Chi
pMO
S S
EM
ICO
ND
UC
TO
RS
(Sh
angh
ai)
LTD
.; R
epre
sent
ativ
e &
Dir
ecto
r of
Tsa
i Fu
Inve
stm
ent C
o., L
td.
Not
e 5:
Cha
irm
an &
Pre
side
nt o
f C
hipM
OS
SE
MIC
ON
DU
CT
OR
S (S
hang
hai)
LT
D.;
Rep
rese
ntat
ive
& D
irec
tor
of Y
ung
Hsi
ang
Inve
stm
ent C
o., L
td.
Not
e 6:
The
rea
sona
blen
ess,
nec
essi
ty t
here
of,
and
the
mea
sure
s ad
opte
d in
res
pons
e th
eret
o of
the
Pre
side
nt a
nd C
hair
man
of
the
boar
d of
dir
ecto
rs o
f th
e C
ompa
ny a
re t
he
sam
e pe
rson
: T
he B
oard
of
Dir
ecto
rs i
s th
e C
ompa
ny's
hig
hest
gov
erna
nce
unit
and
the
cent
er f
or m
akin
g bu
sine
ss d
ecis
ions
. It
sup
ervi
ses
the
man
agem
ent,
exer
cise
its
pow
ers
in
acco
rdan
ce w
ith
law
s an
d re
gula
tion
s, a
nd is
bei
ng r
espo
nsib
le to
the
com
pany
and
its
shar
ehol
ders
. T
he p
erso
n w
he s
erve
s th
e C
hair
man
and
Pre
side
nt,
in o
rder
to
max
imiz
e th
e C
ompa
ny's
val
ue,
he m
ust
fully
gra
sp t
he o
pera
tion
info
rmat
ion
and
stat
us,
so t
hat
the
oper
atin
g ef
fici
ency
is in
crea
sed
and
the
deci
sion
-mak
ing
is e
xecu
ted
mor
e sm
ooth
ly.
The
Com
pany
has
lon
g be
en c
omm
itted
to
deep
enin
g co
rpor
ate
gove
rnan
ce a
nd c
orpo
rate
soc
ial
resp
onsi
bilit
y. B
y in
crea
sing
the
num
ber
of i
ndep
ende
nt d
irec
tors
to
5 an
d se
tting
up
func
tiona
l co
mm
itte
es, i
ndep
ende
nt d
irec
tors
are
app
oint
ed a
s m
embe
rs o
f th
e co
mm
itte
e. W
ith i
ts i
ndep
ende
nce
and
prof
essi
onal
ism
, it
prov
ides
boa
rd
deci
sion
-mak
ing
sugg
estio
ns a
nd s
tren
gthe
ns d
irec
tor
supe
rvis
ion
and
deci
sion
qua
lity.
Mor
e th
an h
alf
of t
he C
ompa
ny’s
dir
ecto
rs n
eith
er e
mpl
oyee
nor
off
icer
of
the
Com
pany
.
17

III.
Rem
uner
atio
n to
Dir
ecto
rs (
Incl
udin
g In
depe
nden
t Dir
ecto
rs),
Sup
ervi
sors
, Pre
side
nt, a
nd V
ice
Pre
side
nts
(I)
Rem
uner
atio
n to
Dir
ecto
rs, S
uper
viso
rs, P
resi
dent
, and
Vic
e P
resi
dent
s in
the
Mos
t Rec
ent Y
ear
1.R
emun
erat
ion
to d
irec
tors
(in
clud
ing
inde
pend
ent d
irec
tors
) Y
ear
2019
(U
nit:
NT
$ th
ousa
nds;
%)
Tit
leN
ame
Dir
ecto
r's R
emun
erat
ion
Rat
io o
f th
e su
m o
f (A
), (
B),
(C
), a
nd
(D)
to n
et p
rofi
t af
ter
tax
(%)
Com
pens
atio
n re
ceiv
ed a
s an
em
ploy
ee
Rat
io o
f th
e su
m
of (
A),
(B
), (
C),
(D),
(E
), (
F)
and
(G)
to n
et p
rofi
t af
ter
tax
(%)
Rem
uner
ati
on
rece
ived
fr
om
Inve
stee
s ot
her
than
su
bsid
iari
es
or p
aren
t co
mpa
ny
Bas
e co
mpe
nsat
ion
(A)
Pen
sion
(B
)
Dir
ecto
r co
mpe
nsat
ion
(C)
Bus
ines
s ex
pens
e (D
)
Sal
ary,
bon
us
and
spec
ial
allo
wan
ce (
E)
Pen
sion
(F
) E
mpl
oyee
com
pens
atio
n (G
)
Com
pany
Con
soli
date
d E
ntit
ies
Com
pany
Con
soli
date
d E
ntit
ies
Com
pany
Con
soli
date
d E
ntit
ies
Com
pany
Con
soli
date
d E
ntit
ies
Com
pany
Con
soli
date
d E
ntit
ies
Com
pany
Con
soli
date
d E
ntit
ies
Com
pany
Con
sol
idat
ed
Ent
itie
s
Com
pany
C
onso
lida
ted
Ent
itie
s C
ompa
ny
Con
soli
date
d E
ntit
ies
Cas
hS
hare
Cas
hS
hare
Cha
irm
an
Shi
h-Jy
e C
heng
——
—
—
7,
005
7,00
5 3,
551
3,55
1 0.
41%
0.41
%48
,904
48
,904
196
196
11,7
98—
11
,798
—
2.76
%2.
76%
Non
e
Dir
ecto
r Y
u-H
u L
iu
Dir
ecto
r W
en-C
hing
Lin
Dir
ecto
r
Bri
ght Y
eh
(rep
rese
ntat
ive,
S
ilic
onw
are
Pre
cisi
on
Indu
stri
es C
o.,
Ltd
.)
Dir
ecto
r
Tere
sa W
ang
(rep
rese
ntat
ive,
S
ilic
onw
are
Pre
cisi
on
Indu
stri
es C
o.,
Ltd
.)
Dir
ecto
r L
afai
r C
ho
Inde
pend
ent
Dir
ecto
r C
hin-
Shy
h O
u
——
—
—
9,
913
9,91
3 5,
797
5,79
7 0.
61%
0.61
%—
—
—
—
—
—
—
—
0.61
%0.
61%
Non
e
Inde
pend
ent
Dir
ecto
r Y
uh-F
ong
Tang
Inde
pend
ent
Dir
ecto
r Ta
i-H
aur
Kuo
Inde
pend
ent
Dir
ecto
r C
ho-L
ien
Cha
ng
Inde
pend
ent
Dir
ecto
r K
uei-
Ann
Wen
Inde
pend
ent
Dir
ecto
r Ji
ng-S
han
Aur
Not
e1 :
The
dis
clos
ed c
ompe
nsat
ion
cont
ent
is d
iffe
rent
fro
m t
he c
once
pt o
f in
com
e de
fine
d in
Inc
ome
Tax
Act
. The
refo
re, t
his
tabl
e sh
all
mer
ely
be u
sed
for
the
purp
ose
of in
form
atio
n di
sclo
sure
and
sha
ll n
ot b
e us
ed f
or
taxa
tion
. N
ote2
: Y
u-H
u L
iu, C
ho-L
ien
Cha
ng a
nd W
en-C
hing
Lin
: Te
rm e
xpir
ed o
n Ju
ne 1
0,20
19.
Bri
ght Y
eh (
repr
esen
tati
ve S
ilic
onw
are
Pre
cisi
on I
ndus
trie
s C
o., L
td.)
, T
eres
a W
ang
(rep
rese
ntat
ive
Sil
icon
war
e P
reci
sion
Ind
ustr
ies
Co.
, Ltd
.),
Laf
air
Cho
and
Jin
g-S
han
Aur
: N
ewly
ele
cted
on
June
10,
2019
. N
ote3
: E
xcep
t the
abo
ve-m
enti
oned
fig
ures
, the
dir
ecto
rs o
f th
e C
ompa
ny r
ecei
ve r
emun
erat
ion
for
prov
idin
g se
rvic
es to
all
com
pani
es in
the
fina
ncia
l rep
ort (
such
as
serv
ing
as a
con
sult
ant f
or n
on-e
mpl
oyee
s) :
Non
e.
18

Dir
ecto
rs' R
emun
erat
ion
Sca
le
Inte
rval
s of
Com
pens
atio
n P
aid
to
Dir
ecto
rs
Dir
ecto
rs' N
ame
Tota
l Rem
uner
atio
n (A
+B
+C
+D
) To
tal C
ompe
nsat
ions
(A
+B
+C
+D
+E
+F+
G)
The
Com
pany
C
onso
lida
ted
Ent
itie
s (H
) T
he C
ompa
ny
Con
soli
date
d E
ntit
ies
(I)
Les
s th
an N
T$1
,000
,000
Bri
ght Y
eh (
repr
esen
tati
ve,
Sil
icon
war
e P
reci
sion
Ind
ustr
ies
Co.
, L
td.)
,
Tere
sa W
ang
(rep
rese
ntat
ive,
S
ilic
onw
are
Pre
cisi
on I
ndus
trie
s C
o.,
Ltd
.),
Bri
ght Y
eh (
repr
esen
tati
ve,
Sil
icon
war
e P
reci
sion
Ind
ustr
ies
Co.
, L
td.)
,
Tere
sa W
ang
(rep
rese
ntat
ive,
S
ilic
onw
are
Pre
cisi
on I
ndus
trie
s C
o.,
Ltd
.),
Bri
ght Y
eh (
repr
esen
tati
ve,
Sil
icon
war
e P
reci
sion
Ind
ustr
ies
Co.
, L
td.)
,
Tere
sa W
ang
(rep
rese
ntat
ive,
S
ilic
onw
are
Pre
cisi
on I
ndus
trie
s C
o.,
Ltd
.),
Bri
ght Y
eh (
repr
esen
tati
ve,
Sil
icon
war
e P
reci
sion
Ind
ustr
ies
Co.
, L
td.)
,
Tere
sa W
ang
(rep
rese
ntat
ive,
S
ilic
onw
are
Pre
cisi
on I
ndus
trie
s C
o.,
Ltd
.),
NT
$1,0
00,0
00 (
incl
uded
) ~
N
T$2
,000
,000
(no
t inc
lude
d)
Yu-
Hu
Liu
, Wen
-Chi
ng L
in,
Laf
air
Cho
, Cho
-Lie
n C
hang
, Ji
ng-S
han
Aur
Yu-
Hu
Liu
, Wen
-Chi
ng L
in,
L
afai
r C
ho, C
ho-L
ien
Cha
ng,
Jing
-Sha
n A
ur
Yu-
Hu
Liu
, Wen
-Chi
ng L
in,
Cho
-Lie
n C
hang
, Jin
g-S
han
Aur
Y
u-H
u L
iu, W
en-C
hing
Lin
,
Cho
-Lie
n C
hang
, Jin
g-S
han
Aur
NT
$2,0
00,0
00 (
incl
uded
) ~
N
T$3
,500
,000
(no
t inc
lude
d)
Shi
h-Jy
e C
heng
, Chi
n-S
hyh
Ou,
Y
uh-F
ong
Tang
, Tai
-Hau
r K
uo,
Kue
i-A
nn W
en
Shi
h-Jy
e C
heng
, Chi
n-S
hyh
Ou,
Y
uh-F
ong
Tang
, Tai
-Hau
r K
uo,
Kue
i-A
nn W
en
Chi
n-S
hyh
Ou,
Yuh
-Fon
g Ta
ng,
Tai-
Hau
r K
uo, K
uei-
Ann
Wen
C
hin-
Shy
h O
u, Y
uh-F
ong
Tang
, Ta
i-H
aur
Kuo
, Kue
i-A
nn W
en
NT
$3,5
00,0
00 (
incl
uded
) ~
N
T$5
,000
,000
(no
t inc
lude
d)
—
—
—
—
NT
$5,0
00,0
00 (
incl
uded
) ~
N
T$1
0,00
0,00
0 (n
ot in
clud
ed)
—
—
—
—
NT
$10,
000,
000
(inc
lude
d)
~
NT
$15,
000,
000
(not
incl
uded
) —
—
—
—
NT
$15,
000,
000
(inc
lude
d)
~
NT
$30,
000,
000
(not
incl
uded
) —
—
L
afai
r C
ho
Laf
air
Cho
NT
$30,
000,
000
(inc
lude
d)
~
NT
$50,
000,
000
(not
incl
uded
) —
—
S
hih-
Jye
Che
ng
Shi
h-Jy
e C
heng
NT
$50,
000,
000
(inc
lude
d)
~
NT
$100
,000
,000
(no
t inc
lude
d)
—
—
—
—
Mor
e th
an N
T$1
00,0
00,0
00
—
—
—
—
Tota
l 12
per
sons
12
per
sons
12
per
sons
12
per
sons
Not
e1 :
The
dis
clos
ed c
ompe
nsat
ion
cont
ent i
s di
ffer
ent f
rom
the
conc
ept o
f in
com
e de
fine
d in
Inc
ome
Tax
Act
. The
refo
re, t
his
tabl
e sh
all
mer
ely
be u
sed
for
the
purp
ose
of in
form
atio
n di
sclo
sure
and
sha
ll n
ot b
e us
ed f
or
taxa
tion
. N
ote
2 : Y
u-H
u L
iu, C
ho-L
ien
Cha
ng a
nd W
en-C
hing
Lin
: Te
rm e
xpir
ed o
n Ju
ne 1
0,20
19.
Bri
ght Y
eh (
repr
esen
tati
ve S
ilic
onw
are
Pre
cisi
on I
ndus
trie
s C
o., L
td.)
, T
eres
a W
ang
(rep
rese
ntat
ive
Sil
icon
war
e P
reci
sion
Ind
ustr
ies
Co.
, Ltd
.),
Laf
air
Cho
and
Jin
g-S
han
Aur
: N
ewly
ele
cted
on
June
10,
2019
.
2. R
emun
erat
ion
to s
uper
viso
rs: N
ot a
ppli
cabl
e.
19
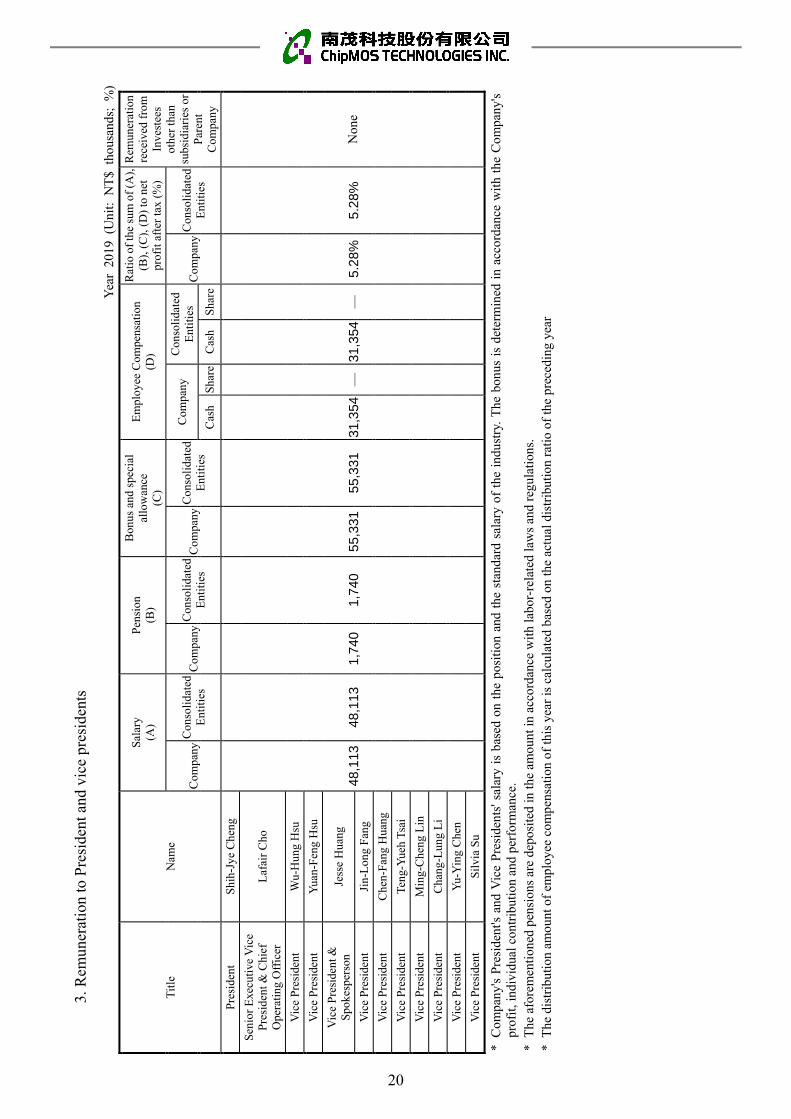
3. R
emun
erat
ion
to P
resi
dent
and
vic
e pr
esid
ents
Yea
r 20
19 (
Uni
t: N
T$
thou
sand
s; %
)
Tit
le
Nam
e
Sal
ary
(A)
Pen
sion
(B
)
Bon
us a
nd s
peci
al
allo
wan
ce
(C)
Em
ploy
ee C
ompe
nsat
ion
(D)
Rat
io o
f th
e su
m o
f (A
),
(B),
(C
), (
D)
to n
et
prof
it a
fter
tax
(%)
Rem
uner
atio
n re
ceiv
ed f
rom
In
vest
ees
othe
r th
an
subs
idia
ries
or
Par
ent
Com
pany
Com
pany
Con
soli
date
d E
ntiti
es
Com
pany
Con
soli
date
d E
ntiti
es
Com
pany
Con
soli
date
d E
ntiti
es
Com
pany
C
onso
lida
ted
Ent
itie
s C
ompa
nyC
onso
lida
ted
Ent
itie
s C
ash
Shar
eC
ash
Shar
e
Pres
iden
t Sh
ih-J
ye C
heng
48,1
1348
,113
1,
740
1,74
0 55
,331
55,3
31
31,3
54—
31,3
54—
5.28
%5.
28%
N
one
Sen
ior
Exe
cuti
ve V
ice
Pre
side
nt &
Chi
ef
Ope
rati
ng O
ffic
er
Laf
air
Cho
Vic
e P
resi
dent
W
u-H
ung
Hsu
Vic
e Pr
esid
ent
Yua
n-Fe
ng H
su
Vic
e Pr
esid
ent &
S
poke
sper
son
Jess
e H
uang
Vic
e P
resi
dent
Ji
n-L
ong
Fan
g
Vic
e Pr
esid
ent
Che
n-Fa
ng H
uang
Vic
e Pr
esid
ent
Teng
-Yue
h Ts
ai
Vic
e Pr
esid
ent
Min
g-C
heng
Lin
Vic
e P
resi
dent
C
hang
-Lun
g L
i
Vic
e Pr
esid
ent
Yu-
Yin
g C
hen
Vic
e Pr
esid
ent
Silv
ia S
u
* C
ompa
ny's
Pre
side
nt's
and
Vic
e P
resi
dent
s' s
alar
y is
bas
ed o
n th
e po
sitio
n an
d th
e st
anda
rd s
alar
y of
the
ind
ustr
y. T
he b
onus
is
dete
rmin
ed i
n ac
cord
ance
with
the
Com
pany
's
prof
it, in
divi
dual
con
trib
utio
n an
d pe
rfor
man
ce.
* T
he a
fore
men
tion
ed p
ensi
ons
are
depo
site
d in
the
amou
nt in
acc
orda
nce
with
labo
r-re
late
d la
ws
and
regu
latio
ns.
* T
he d
istr
ibut
ion
amou
nt o
f em
ploy
ee c
ompe
nsat
ion
of th
is y
ear
is c
alcu
late
d ba
sed
on th
e ac
tual
dis
trib
utio
n ra
tio o
f th
e pr
eced
ing
year
20

Rem
uner
atio
n B
rack
ets
Tabl
e fo
r P
resi
dent
and
Vic
e P
resi
dent
s
Inte
rval
of
Com
pens
atio
n P
aid
to P
resi
dent
and
Vic
e P
resi
dent
s
Nam
e of
Pre
side
nt/V
ice
Pre
side
nt
The
Com
pany
A
ll C
ompa
nies
Inc
lude
d in
the
Con
solid
ated
Fin
anci
al
Sta
tem
ents
Les
s th
an N
T$1
,000
,000
—
—
NT
$1,0
00,0
00 (
incl
uded
)~
N
T$2
,000
,000
(no
t inc
lude
d)
—
—
NT
$2,0
00,0
00 (
incl
uded
)~
N
T$3
,500
,000
(no
t inc
lude
d)
—
—
NT
$3,5
00,0
00 (
incl
uded
)~
N
T$5
,000
,000
(no
t inc
lude
d)
—
—
NT
$5,0
00,0
00 (
incl
uded
)~
N
T$1
0,00
0,00
0 (n
ot in
clud
ed)
Wu-
Hun
g H
su, Y
uan-
Fen
g H
su, J
esse
Hua
ng,
Jin-
Lon
g F
ang,
Che
n-F
ang
Hua
ng, T
eng-
Yue
h Ts
ai,
Min
g-C
heng
Lin
, Cha
ng-L
ung
Li,
Yu-
Yin
g C
hen
, S
ilvi
a S
u
Wu-
Hun
g H
su, Y
uan-
Fen
g H
su, J
esse
Hua
ng,
Jin-
Lon
g F
ang,
Che
n-F
ang
Hua
ng, T
eng-
Yue
h Ts
ai,
Min
g-C
heng
Lin
, Cha
ng-L
ung
Li,
Yu-
Yin
g C
hen
, S
ilvi
a S
u
NT
$10,
000,
000
(inc
lude
d)~
N
T$1
5,00
0,00
0 (n
ot in
clud
ed)
Laf
air
Cho
L
afai
r C
ho
NT
$15,
000,
000
(inc
lude
d)~
N
T$3
0,00
0,00
0 (n
ot in
clud
ed)
—
—
NT
$30,
000,
000
(inc
lude
d)~
N
T$5
0,00
0,00
0 (n
ot in
clud
ed)
Shi
h-Jy
e C
heng
S
hih-
Jye
Che
ng
NT
$50,
000,
000
(inc
lude
d)~
NT
$100
,000
,000
(no
t inc
lude
d)—
—
Mor
e th
an N
T$1
00,0
00,0
00
—
—
Tota
l 12
per
sons
12
per
sons
Not
e: T
he d
iscl
osed
com
pens
atio
n co
nten
t is
dif
fere
nt f
rom
the
con
cept
of
inco
me
defi
ned
in I
ncom
e Ta
x A
ct.
The
refo
re,
this
tab
le s
hall
mer
ely
be u
sed
for
the
purp
ose
of i
nfor
mat
ion
disc
losu
re a
nd s
hall
not
be
used
for
ta
xati
on.
21

4. Names of managers distributed employee compensation and the status of distribution Year 2019 (Unit: NT$ thousands; %)
Title Name Share Cash Total Ratio of the total amount to net profit after tax (%)
Man
ager
President Shih-Jye Cheng
— 33,836 33,836 1.31%
Senior Executive Vice President & Chief Operating Officer Lafair Cho
Vice President Wu-Hung Hsu
Vice President Yuan-Feng Hsu
Vice President & Spokesperson Jesse Huang
Vice President Jin-Long Fang
Vice President Chen-Fang Huang
Vice President Teng-Yueh Tsai
Vice President Ming-Cheng Lin
Vice President Chang-Lung Li
Vice President Yu-Ying Chen
Vice President Silvia Su
Senior Director Chao-Tung So
Senior Director JB Chyi
Manager Ling Cheng
Senior Manager Chi-Pei Cho
(II) Analysis Regarding the Ratio of the Total Remuneration to Net Profit After Tax
1. Analysis regarding the ratio of total remuneration paid to Company's directors,
supervisors, President and vice presidents in the most recent 2 years to net profit after tax,
and the relationship between such ratio and operational performance:
Item
Ratio of the Total Remuneration to Net Profit After Tax
2019 2018
The Company Consolidated
Entities The Company
Consolidated Entities
Director(including Independent Directors)
1.02% 1.02% 1.67% 1.67%
Supervisor — — — —
President and Vice President 5.28% 5.28% 12.06% 12.06%
Note 1: The difference in the ratio of President's and Vice Presidents' remuneration is due to the Company's net profit after tax of NT$2,584,161 thousand in 2019 and NT$1,103,075 thousand in 2018.
Note 2: The Company has established Audit Committee on June 28, 2007 and thus supervisor remuneration does not apply.
2. Relationship among remuneration policies, standards and combination, procedure of
determining remuneration and operational performance:
Company's "Regulations Governing the Payment of Directors' and Supervisors'
Remuneration" provided as follows:
(1) The Company enacted Remuneration Committee Charter based on the resolution
adopted by the Board of Directors on March 29, 2012 and established Remuneration
Committee.
(2) The purpose of Remuneration Committee:
A. Enact and periodically review directors' and managers' performance objective and
the policies, regulations, standards and structures of remuneration.
B. Supervise the Company's management regarding directors and managers' remuneration.
22

IV. Implementation of Corporate Governance(I) Board of Directors Meeting Status
The Board of Directors held 8 meetings (A) in the most recent year. The attendance of directors was as follows:
Title NameAttendance in Person
(B) By Proxy
Attendance Rate (%) (B/A)
Remarks
Chairman Shih-Jye Cheng 8 - 100.00% Re-election
Director
Teresa Wang (representative,
Siliconware Precision
Industries Co., Ltd.)
3 1 75.00% Newly elected on June 10, 2019.
Director
Bright Yeh (representative,
Siliconware Precision
Industries Co., Ltd.)
4 - 100.00% Newly elected on June 10, 2019.
Director Lafair Cho 4 - 100.00% Newly elected on June 10, 2019.
Ex-Director Wen-Ching Lin 4 - 100.00% Term expired on June 10, 2019.
Ex-Director Yu-Hu Liu 4 - 100.00% Term expired on June 10, 2019.
Independent Director
Chin-Shyh Ou 8 - 100.00% Re-election
Independent Director
Yuh-Fong Tang 7 1 87.50% Re-election
Independent Director
Tai-Haur Kuo 8 - 100.00% Re-election
Independent Director
Kuei-Ann Wen 8 - 100.00% Re-election
Independent Director
Jing-Shan Aur 4 - 100.00% Newly elected on June 10, 2019.
Ex-Independent Director
Cho-Lien Chang 3 1 75.00% Term expired on June 10, 2019.
Other mentionable items: I. If there are circumstances occurred during the operation of the Board of Directors, the date of meetings,
sessions and contents of motion of the Board of Directors, all independent directors' opinions and the Company’s responses to such opinions should be specified: (I) Circumstances referred to in Article 14-3 of the Securities and Exchange Act:
The Company has established an Audit Committee, and Article 14-3 of the Securities and Exchange Act is not applicable to the Company. Please refer to Page 24-26 of the Annual Report for related information of the operation status of the Audit Committee.
(II) Besides the foregoing items, other resolutions objected by independent directors or subject to a
23

qualified opinion and recorded or declared in writing: None. II. Implementation of resolutions of which directors refrained from participating due to conflict of interest:
(I) Resolution of the 26th meeting of the 8th Board of Directors regarding the adjustment of managers'compensation and position in 2019 involves personal interest of Chairman Shih-Jye Cheng, and thus he did not participate in discussion or voting in accordance with the Company Act. Director Tai-Haur Kuo served as the acting chairman and made inquiries with other directors present at the meeting. Such resolution was unanimously approved.
(II) Resolution of the 26th meeting of the 8 th Board of Directors regarding the discussion of managers' 2018 performance bonus involves personal interest of Chairman Shih-Jye Cheng, and thus he did not participate in discussion or voting in accordance with the Company Act. Director Tai-Haur Kuo served as the acting chairman and made inquiries with other directors present at the meeting. Such resolution was unanimously approved.
(III) Resolution of the 26th meeting of the 8th Board of Directors regarding managers' 2019 annual performance bonus plan involves personal interest of Chairman Shih-Jye Cheng , and thus he did not participate in discussion or voting in accordance with the Company Act. Director Tai-Haur Kuo served as the acting chairman and made inquiries with other directors present at the meeting. Such resolution was unanimously approved.
(IV) Resolution of the 2nd meeting of the 9th Board of Directors regarding distribution of cash employee bonus to managers of 2018 involves personal interest of Chairman Shih-Jye Cheng, and Director Lafair Cho, and thus they did not participate in discussion or voting in accordance with the Company Act. Director Tai-Haur Kuo served as the acting chairman and made inquiries with other directors present at the meeting. Such resolution was unanimously approved.
III. Measures taken to strengthen the functionality of the Board of Directors within current and the mostrecent year: To implement corporate governance and enhance the Company's board functions, and toset forth performance objectives to improve the operation efficiency of the board of directors, “The Rulesfor Performance Assessment of the Board of Directors” was established in 2020, and the Company shallconduct an internal board performance assessment once a year.
Note: The authority of the Company’s supervisors shall be exercised by Audit Committee composed of Independent Directors.
(II) Audit Committee Meeting Status 1. The Company established Audit Committee on June 28, 2007 to exercise the power of
supervisors provided in relevant laws and regulations.2. Audit Committee held 8 meetings (A) in the most recent year. The attendance of the
members was as follows:
Title Name Attendance in Person
(B) By Proxy
Attendance Rate (%) (B/A)
Remarks
Independent Director
Chin-Shyh Ou
8 ─ 100.00%
Audit Committee convener Re-elected
Independent Director
Yuh-Fong Tang
7 1 87.50% Re-elected
Independent Director
Tai-Haur Kuo
8 ─ 100.00% Re-elected
Independent Director
Kuei-Ann Wen
8 ─ 100.00% Re-elected
Independent Director
Jing-Shan Aur
4 ─ 100.00% Newly elected
Ex-Independent Director
Cho-Lien Chang
3 1 75.00% Term expired on June 10, 2019.
24

Other mentionable items: I. If any of the following circumstances occurred during the operation of the Audit Committee, the dates of
meetings, sessions, contents of motion of the Board of Directors, resolutions of the Audit Committee and the Company’s response to the Audit Committee’s opinions should be specified: (I) Circumstances stipulated in Article 14-5 of the Securities and Exchange Act
1. The resolutions of the 24th meeting of the 8th Board of Directors (March 7, 2019)
Sessions and contents of motion of the Board of Directors
Resolutions of the Audit Committee
The Company’s responses to the Audit Committee’s
opinions should be specified
1. The Company’s 2018 Statement of Internal Control.
Approved by all members present in the
meeting.
No further processing due to no directors ’comments
2. The Company's 2018 business report and financial statements.
3. Amendments to the Operational Procedures for the Acquisition or Disposal of Assets.
4. The amendments to the Company's "Internal Control System" and "Internal Audit Implementation Rules".
5. Resolution regarding the evaluation of the independence of Company's CPA and the engagement of CPA of 2019.
2. The resolutions of the 25 th meeting of the 8 th Board of Directors (April 2, 2019)
Sessions and contents of motion of the Board of Directors
Resolutions of the Audit Committee
The Company’s responses to the Audit Committee’s
opinions should be specified
1. Amendments to the Operational Procedures for Lending Funds to Other Parties.
Approved by all members present in the
meeting.
No further processing due to no directors ’comments
2. Amendments to the Operational Procedures for Endorsements and Guarantees.
3. Announcement of intending of disposal of the common shares of JMC ELECTRONICS CO., LTD.
3. The resolutions of the 26 th meeting of the 8 th Board of Directors (April 25, 2019)
Sessions and contents of motion of the Board of Directors
Resolutions of the Audit Committee
The Company’s responses to the Audit Committee’s
opinions should be specified
1. The Company’s 2018 Internal Audit Report on Internal Control Over Financial Reporting (ICFR).
Approved by all members present in the
meeting.
No further processing due to no directors ’comments
2. Adoption of Company's 2018 Annual Report Form 20-F (including the English consolidated financial statements of 2018 prepared by the Company in accordance with the International Financial Reporting Standards).
25

4. The resolutions of the 2nd meeting of the 9 th Board of Directors (June 27, 2019)
Sessions and contents of motion of the Board of Directors
Resolutions of the Audit Committee
The Company’s responses to the Audit Committee’s
opinions should be specified
1. Senior manager Chi-Pei Cho, the internalaudit officer of the Company, apply forresignation.
Approved by all members present in the
meeting.
No further processing due to no directors ’comments
2. Ling Cheng take over the internal auditofficer of the Company.
5. The resolutions of the 3 rd meeting of the 9 th Board of Directors (August 6, 2019)
Sessions and contents of motion of the Board of Directors
Resolutions of the Audit Committee
The Company’s responses to the Audit Committee’s
opinions should be specified
1. The Company's consolidated financialstatement of Q2, 2019. Approved by all
members present in the meeting.
No further processing due to no directors ’comments 2.The letter of guarantee made for importing
duty.
(II) Besides the foregoing items, other resolutions which failed to be approved by the Audit Committee butotherwise approved by a two-third majority of all the directors: None.
II. Implementation of resolutions of which independent directors refrained from participating due to conflictof interest:(I) There was no such situation in the Audit Committee in 2019.(II) Resolution of the 24th meeting of the 8th Board of Directors regarding the independent director
candidate nomination of re-election of Board of Directors at 2019 Annual Shareholders' Meeting involves personal interest of Independent Director Chin-Shyh Ou, Yuh-Fong Tang, Tai-Haur Kuo and Kuei-Ann Wen, and thus they did not participate in discussion or voting in accordance with the Company Act. The chairman made inquiries with other directors present at the meeting. Such resolution was unanimously approved.
(III) (III) Resolution of the 1st meeting of the 9th Board of Directors regarding the Appointment of members of the 4th Remuneration Committee involves personal interest of Independent Director Tai-Haur Kuo, Yuh-Fong Tang, and Chin-Shyh Ou, and thus they did not participate in discussion or voting in accordance with the Company Act. The chairman made inquiries with other directors present at the meeting. Such resolution was unanimously approved.
III. Communications between independent directors and the Company's internal audit supervisor and CPA(e.g. items, methods and results of the audits of corporate finance or operations, etc.):
(I) The internal audit supervisors shall attend the meeting of the Board of Directors, periodically provide internal auditing report to Audit Committee to make communication on the implementing status of internal auditing, and make timely report to Audit Committee in special occasions. No foregoing special occasions occurred in 2019. The communication between the Audit Committee and the internal auditing supervisors are fine.
(II) The CPAs engaged by the Company shall attend the meeting of Audit Committee, periodicallyreport on the review result of financial statements and other items as required by laws and regulations, and make timely report to the Audit Committee in special occasions. No foregoing special occasions occurred in 2019. The communication between Audit Committee and CPAs arefine.
(III) The internal audit head, the independent auditors and independent directors can contact each other as needed. The communication channels are seamless.
26

(III
) C
orpo
rate
Gov
erna
nce
Impl
emen
tati
on S
tatu
s an
d D
evia
tion
s fr
om th
e “
Cor
pora
te G
over
nanc
e B
est P
ract
ice
Pri
ncip
les
for
TW
SE
/TP
Ex
Lis
ted
Com
pani
es”
and
Rea
sons
:
Eva
luat
ion
Item
Impl
emen
tati
on S
tatu
s D
evia
tion
s fr
om th
e C
orpo
rate
Gov
erna
nce
Bes
t-P
ract
ice
Pri
ncip
les
for
TW
SE
/TP
Ex
Lis
ted
Com
pani
es a
nd R
easo
ns
Yes
No
Abs
trac
t Ill
ustr
atio
n
1. D
oes
the
com
pany
est
abli
sh a
nd d
iscl
ose
the
Cor
pora
te G
over
nanc
e B
est P
ract
ice
Pri
ncip
les
base
d on
“C
orpo
rate
Gov
erna
nce
Bes
t Pra
ctic
e P
rinc
iple
s fo
r T
WS
E/T
PE
x L
iste
d C
ompa
nies
”?
V
T
he C
ompa
ny h
as e
stab
lish
ed a
nd d
iscl
osed
cor
pora
te
gove
rnan
ce p
rinc
iple
s in
clud
ing
Pro
cedu
res
for
Eth
ical
Man
agem
ent a
nd G
uide
line
s fo
r C
ondu
ct,
Cod
e of
Eth
ics
and
Bus
ines
s C
ondu
ct, C
orpo
rate
S
ocia
l Res
pons
ibil
ity
Bes
t Pra
ctic
e P
rinc
iple
s, R
ules
G
over
ning
the
Sco
pe o
f P
ower
s of
Ind
epen
dent
D
irec
tors
, Rul
es G
over
ning
the
Exe
rcis
e of
Rig
hts
and
Par
tici
pati
on in
Res
olut
ions
by
Juri
stic
Per
son
Sha
reho
lder
s W
ith
Con
trol
ling
Pow
er, a
nd
Ope
rati
onal
Pro
cedu
res
for
Tra
nsac
tion
wit
h G
roup
E
nter
pris
es, S
peci
fic
Com
pany
and
Rel
ated
Par
ty in
ac
cord
ance
wit
h “C
orpo
rate
Gov
erna
nce
Bes
t Pra
ctic
e P
rinc
iple
s fo
r T
WS
E/T
PE
x L
iste
d C
ompa
nies
.”
Non
e
2. S
hare
hold
ing
stru
ctur
e an
d sh
areh
olde
rs' r
ight
s (1
) D
oes
the
com
pany
est
abli
sh in
tern
al
oper
atin
g pr
oced
ures
to d
eal w
ith
sh
areh
olde
r su
gges
tion
s, d
oubt
s, d
ispu
tes
and
liti
gati
on a
nd im
plem
ent b
ased
on
the
proc
edur
e?
V
(1
) T
he C
ompa
ny h
as e
stab
lish
ed C
orpo
rate
Soc
ial
Res
pons
ibil
ity
Bes
t Pra
ctic
e P
rinc
iple
s ba
sed
on
the
resp
ect t
o th
e st
akeh
olde
rs, a
nd to
iden
tify
the
stak
ehol
ders
of
the
Com
pany
as
wel
l as
esta
blis
hed
a de
sign
ated
sec
tion
on
its
web
site
for
th
e st
akeh
olde
rs. T
he C
ompa
ny, t
hrou
gh p
rope
r co
mm
unic
atio
n, u
nder
stan
ds th
e re
ason
able
ex
pect
atio
ns a
nd d
eman
ds o
f th
e st
akeh
olde
rs a
nd
prop
erly
resp
onds
to c
ritic
al c
orpo
rate
soc
ial
resp
onsi
bilit
y is
sues
of c
once
rn to
the
stak
ehol
ders
.
N
one
27
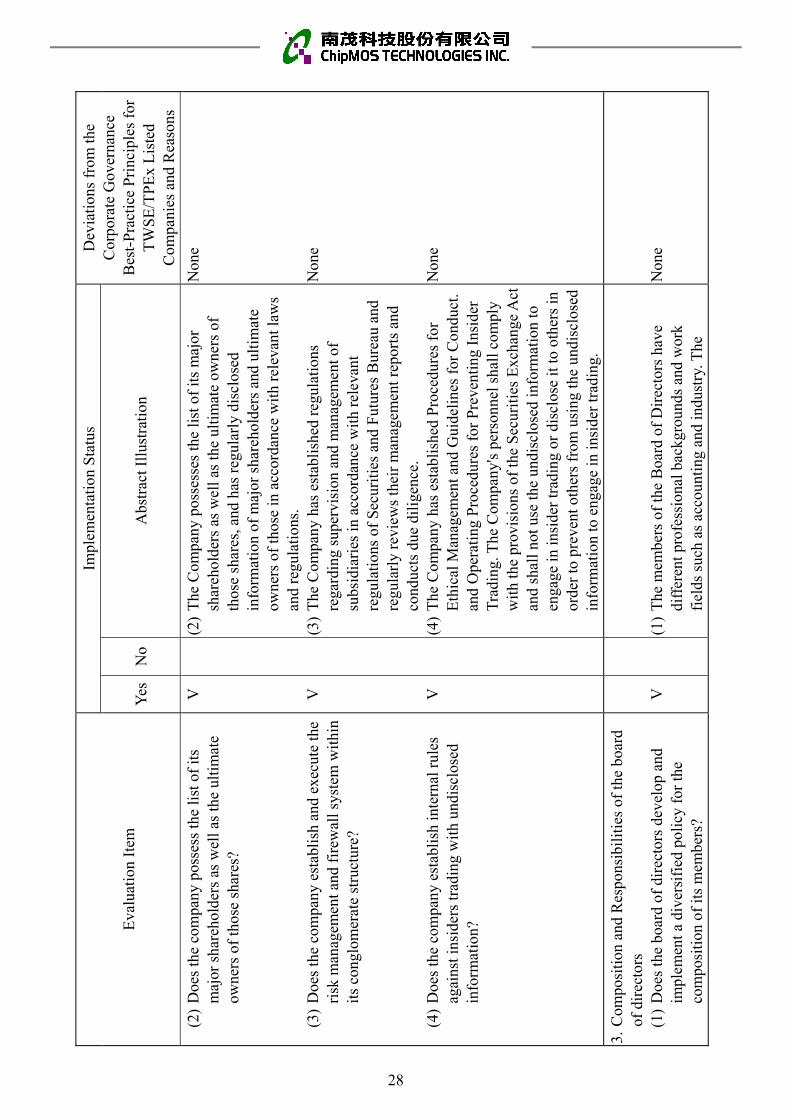
Eva
luat
ion
Item
Impl
emen
tati
on S
tatu
s D
evia
tion
s fr
om th
e C
orpo
rate
Gov
erna
nce
Bes
t-P
ract
ice
Pri
ncip
les
for
TW
SE
/TP
Ex
Lis
ted
Com
pani
es a
nd R
easo
ns
Yes
No
Abs
trac
t Ill
ustr
atio
n
(2)
Doe
s th
e co
mpa
ny p
osse
ss th
e li
st o
f it
s m
ajor
sha
reho
lder
s as
wel
l as
the
ulti
mat
e ow
ners
of
thos
e sh
ares
?
(3)
Doe
s th
e co
mpa
ny e
stab
lish
and
exe
cute
the
risk
man
agem
ent a
nd f
irew
all s
yste
m w
ithi
n it
s co
nglo
mer
ate
stru
ctur
e?
(4)
Doe
s th
e co
mpa
ny e
stab
lish
inte
rnal
rul
es
agai
nst i
nsid
ers
trad
ing
wit
h un
disc
lose
d in
form
atio
n?
V
V
V
(2)
The
Com
pany
pos
sess
es th
e li
st o
f it
s m
ajor
sh
areh
olde
rs a
s w
ell a
s th
e ul
tim
ate
owne
rs o
f th
ose
shar
es, a
nd h
as r
egul
arly
dis
clos
ed
info
rmat
ion
of m
ajor
sha
reho
lder
s an
d ul
tim
ate
owne
rs o
f th
ose
in a
ccor
danc
e w
ith
rele
vant
law
s an
d re
gula
tion
s.
(3)
The
Com
pany
has
est
abli
shed
reg
ulat
ions
re
gard
ing
supe
rvis
ion
and
man
agem
ent o
f su
bsid
iari
es in
acc
orda
nce
wit
h re
leva
nt
regu
lati
ons
of S
ecur
itie
s an
d F
utur
es B
urea
u an
d re
gula
rly
revi
ews
thei
r m
anag
emen
t rep
orts
and
co
nduc
ts d
ue d
ilig
ence
.
(4)
The
Com
pany
has
est
abli
shed
Pro
cedu
res
for
Eth
ical
Man
agem
ent a
nd G
uide
line
s fo
r C
ondu
ct.
and
Ope
rati
ng P
roce
dure
s fo
r P
reve
ntin
g In
side
r T
radi
ng. T
he C
ompa
ny's
per
sonn
el s
hall
com
ply
wit
h th
e pr
ovis
ions
of
the
Sec
urit
ies
Exc
hang
e A
ct
and
shal
l not
use
the
undi
sclo
sed
info
rmat
ion
to
enga
ge in
insi
der
trad
ing
or d
iscl
ose
it to
oth
ers
in
orde
r to
pre
vent
oth
ers
from
usi
ng th
e un
disc
lose
d in
form
atio
n to
eng
age
in in
side
r tr
adin
g.
Non
e
Non
e
Non
e
3.C
ompo
siti
on a
nd R
espo
nsib
ilit
ies
of th
e bo
ard
of d
irec
tors
(1)
Doe
s th
e bo
ard
of d
irec
tors
dev
elop
and
impl
emen
t a d
iver
sifi
ed p
olic
y fo
r th
e co
mpo
siti
on o
f it
s m
embe
rs?
V
(1)
The
mem
bers
of
the
Boa
rd o
f D
irec
tors
hav
e di
ffer
ent p
rofe
ssio
nal b
ackg
roun
ds a
nd w
ork
fiel
ds s
uch
as a
ccou
ntin
g an
d in
dust
ry. T
he
Non
e
28

Eva
luat
ion
Item
Impl
emen
tati
on S
tatu
s D
evia
tion
s fr
om th
e C
orpo
rate
Gov
erna
nce
Bes
t-P
ract
ice
Pri
ncip
les
for
TW
SE
/TP
Ex
Lis
ted
Com
pani
es a
nd R
easo
ns
Yes
No
Abs
trac
t Ill
ustr
atio
n
(2
) D
oes
the
com
pany
vol
unta
rily
est
abli
sh
othe
r fu
ncti
onal
com
mit
tees
in a
ddit
ion
to
rem
uner
atio
n co
mm
itte
e an
d au
dit
com
mit
tee?
(3)
Has
the
Com
pany
est
abli
shed
met
hodo
logy
fo
r ev
alua
ting
the
perf
orm
ance
of
its
Boa
rd
of D
irec
tors
, on
an a
nnua
l bas
is, r
epor
ted
the
resu
lts
of p
erfo
rman
ce to
the
Boa
rd o
f D
irec
tors
, and
use
the
resu
lts
as r
efer
ence
for
di
rect
ors’
rem
uner
atio
n an
d re
new
al?
(4
) D
oes
the
com
pany
reg
ular
ly e
valu
ate
the
inde
pend
ence
of
CPA
s?
V V
V
mem
bers
of
the
Boa
rd o
f D
irec
tors
incl
ude
two
fem
ale
dire
ctor
s to
war
ds g
ende
r di
vers
ific
atio
n to
im
plem
ent T
aiw
an's
Gen
der
Equ
alit
y P
olic
y G
uide
line
s an
d to
impr
ove
fem
ale
deci
sion
-mak
ing
part
icip
atio
n.
(2)
The
Com
pany
has
est
abli
shed
Rem
uner
atio
n C
omm
itte
e an
d A
udit
Com
mit
tee
purs
uant
to th
e la
ws
and
wil
l est
abli
sh o
ther
fun
ctio
nal
com
mit
tees
in c
onsi
dera
tion
of
the
scal
e an
d op
erat
ion
of th
e C
ompa
ny.
(3
) T
he C
ompa
ny e
stab
lish
ed e
valu
atio
n m
etho
ds a
nd
met
hods
for
eva
luat
ing
the
perf
orm
ance
of
its
Boa
rd o
f D
irec
tors
, and
con
duct
s pe
rfor
man
ce
eval
uati
on a
nnua
lly
and
regu
larl
y. T
he c
ompa
ny's
bo
ard
of d
irec
tors
per
form
ance
eva
luat
ion
met
hod
is d
iscl
osur
e on
Mar
ket O
bser
vati
on P
ost S
yste
m
and
the
Com
pany
's w
ebsi
te.T
he C
ompa
ny h
as
esta
blis
hed
Rem
uner
atio
n C
omm
itte
e to
reg
ular
ly
revi
ew th
e st
ruct
ure
of r
emun
erat
ion
as w
ell a
s re
gula
rly
eval
uate
the
rem
uner
atio
n of
the
dire
ctor
s.
(4)
The
Com
pany
ann
uall
y ev
alua
te th
e in
depe
nden
ce
of C
PAs.
The
eng
agem
ent o
f th
e C
ompa
ny's
CPA
s ha
s be
en a
ppro
ved
by m
ore
than
hal
f of
all
the
Aud
it C
omm
itte
e m
embe
rs, a
nd th
en s
ubm
itte
d to
an
d ad
opte
d by
the
Boa
rd o
f D
irec
tors
. The
CPA
s
Und
er d
iscu
ssio
n an
d pr
epar
atio
n N
one
Non
e
29

Eva
luat
ion
Item
Impl
emen
tati
on S
tatu
s D
evia
tion
s fr
om th
e C
orpo
rate
Gov
erna
nce
Bes
t-P
ract
ice
Pri
ncip
les
for
TW
SE
/TP
Ex
Lis
ted
Com
pani
es a
nd R
easo
ns
Yes
No
Abs
trac
t Ill
ustr
atio
n
are
not s
take
hold
ers
of th
e C
ompa
ny a
nd s
tric
tly
adhe
res
to in
depe
nden
ce.
The
gui
danc
e to
eva
luat
e th
e in
depe
nden
ce o
f th
e C
PA a
s fo
llow
s:
1.W
heth
er C
erti
fied
Pub
lic
Acc
ount
ant h
as d
irec
tor
sig
nifi
cant
indi
rect
fin
anci
al in
tere
sts
wit
hth
e C
ompa
ny.
2.W
heth
er o
r no
t Cer
tifi
ed P
ubli
c A
ccou
ntan
t has
any
fina
ncin
g or
gua
rant
ees
of c
ondu
ct w
ith
the
Com
pany
or
the
dire
ctor
s of
the
Com
pany
.3.
Whe
ther
Cer
tifi
ed P
ubli
c A
ccou
ntan
t has
acl
ose
busi
ness
rel
atio
nshi
p an
d po
tent
ial
empl
oym
ent r
elat
ions
hip
wit
h th
e C
ompa
ny.
4.W
heth
er C
erti
fied
Pub
lic
Acc
ount
ant o
rm
embe
rs o
f th
eir
audi
t tea
m h
ad a
ny p
osit
ions
in th
e C
ompa
ny a
s di
rect
ors,
man
ager
s or
sign
ific
ant i
nflu
ence
on
the
audi
t dur
ing
the
audi
t per
iod.
5.W
heth
er C
erti
fied
Pub
lic
Acc
ount
ant h
as a
nyno
n-au
dit s
ervi
ces
to th
e C
ompa
ny w
hich
may
dire
ctly
aff
ect t
he a
udit
wor
k.6.
Whe
ther
Cer
tifi
ed P
ubli
c A
ccou
ntan
t has
an
inte
rmed
iary
to is
sue
shar
es o
r ot
her
secu
riti
esof
the
Com
pany
.7.
Whe
ther
Cer
tifi
ed P
ubli
c A
ccou
ntan
t has
act
edas
the
Com
pany
's d
efen
der
or o
n be
half
of
the
30

Eva
luat
ion
Item
Impl
emen
tati
on S
tatu
s D
evia
tion
s fr
om th
e C
orpo
rate
Gov
erna
nce
Bes
t-P
ract
ice
Pri
ncip
les
for
TW
SE
/TP
Ex
Lis
ted
Com
pani
es a
nd R
easo
ns
Yes
No
Abs
trac
t Ill
ustr
atio
n
Com
pany
to c
oord
inat
e co
nfli
cts
wit
h ot
her
thir
d pa
rtie
s.
8. W
heth
er C
erti
fied
Pub
lic
Acc
ount
ant h
as a
ki
nshi
p w
ith
the
dire
ctor
s, m
anag
ers
of th
e C
ompa
ny o
r pe
rson
s w
ho h
ave
a si
gnif
ican
t in
flue
nce
on th
e au
dit w
ork.
9.
Whe
ther
Cer
tifi
ed P
ubli
c A
ccou
ntan
t doe
s no
t as
sum
e th
e C
ompa
ny’s
ext
erna
l aud
itor
for
7
cons
ecut
ive
year
s.
10. H
as a
nyon
e in
the
Com
pany
wor
ked
wit
h th
e ex
tern
al a
udit
or a
nd w
ithi
n th
e la
st y
ear
of
disa
ssoc
iati
ng f
rom
the
firm
join
ed p
csc
as a
di
rect
or, m
anag
er, o
r of
fice
r or
ano
ther
key
po
siti
on th
at c
an e
xert
sig
nifi
cant
infl
uenc
e ov
er th
e su
bjec
t mat
ter
of th
e en
gage
men
t. 11
. Whe
ther
Cer
tifi
ed P
ubli
c A
ccou
ntan
t vio
late
s th
e re
gula
tion
s of
The
Bul
leti
n of
Nor
m o
f P
rofe
ssio
nal E
thic
s fo
r C
erti
fied
Pub
lic
Acc
ount
ant o
f th
e R
epub
lic
of C
hina
No.
10
Inte
grit
y, O
bjec
tivi
ty a
nd I
ndep
ende
nce.
4. D
oes
the
Com
pany
app
oint
com
pete
nt a
nd
appr
opri
ate
corp
orat
e go
vern
ance
per
sonn
el a
nd
corp
orat
e go
vern
ance
off
icer
to b
e in
cha
rge
of
corp
orat
e go
vern
ance
aff
airs
(in
clud
ing
but n
ot
lim
ited
to f
urni
shin
g in
form
atio
n re
quir
ed f
or
busi
ness
exe
cuti
on b
y di
rect
ors,
ass
isti
ng
V
T
he C
ompa
ny c
oope
rate
s w
ith
the
regu
lati
ons
of th
e co
mpe
tent
aut
hori
ty a
nd w
ill a
ppoi
nt th
e es
tabl
ishm
ent o
f co
rpor
ate
gove
rnan
ce o
ffic
er b
efor
e Ju
ne 3
0, 2
021.
The
Com
pany
coo
pera
tes
wit
h th
e re
gula
tion
s of
the
com
pete
nt a
utho
rity
and
wil
l ap
poin
t the
est
abli
shm
ent o
f co
rpor
ate
gove
rnan
ce o
ffic
er
befo
re J
une
30, 2
021.
31

Eva
luat
ion
Item
Impl
emen
tati
on S
tatu
s D
evia
tion
s fr
om th
e C
orpo
rate
Gov
erna
nce
Bes
t-P
ract
ice
Pri
ncip
les
for
TW
SE
/TP
Ex
Lis
ted
Com
pani
es a
nd R
easo
ns
Yes
No
Abs
trac
t Ill
ustr
atio
n
dire
ctor
s’ c
ompl
ianc
e of
law
, han
dlin
g m
atte
rs
rela
ted
to b
oard
mee
ting
s an
d sh
areh
olde
rs’
mee
ting
s ac
cord
ing
to la
w, a
nd r
ecor
ding
m
inut
es o
f bo
ard
mee
ting
s an
d sh
areh
olde
rs’
mee
ting
s)?
5.D
oes
the
com
pany
est
abli
sh a
com
mun
icat
ion
chan
nel a
nd e
stab
lish
a d
esig
nate
d se
ctio
n on
its
web
site
for
sta
keho
lder
s (i
nclu
ding
but
not
lim
ited
to s
hare
hold
ers,
em
ploy
ees,
cli
ents
and
supp
lier
s), a
nd p
rope
rly
resp
ond
to c
riti
cal
corp
orat
e so
cial
res
pons
ibil
ity
issu
es o
f co
ncer
nto
sta
keho
lder
s?
V
The
Com
pany
has
est
abli
shed
fun
ctio
ns o
f va
riou
s de
part
men
ts, a
nd m
aint
aine
d sm
ooth
com
mun
icat
ion
chan
nels
wit
h th
e st
akeh
olde
rs s
uch
as s
hare
hold
ers,
em
ploy
ees,
cli
ents
, sup
plie
rs, g
over
nmen
t and
co
mm
unit
y.
The
Com
pany
est
abli
sh a
des
igna
ted
sect
ion
on it
s w
ebsi
te f
or s
take
hold
ers
and
prop
erly
res
pond
to
crit
ical
cor
pora
te s
ocia
l res
pons
ibil
ity
issu
es o
f co
ncer
n to
sta
keho
lder
s.
Non
e
6.D
oes
the
com
pany
app
oint
a p
rofe
ssio
nal
shar
ehol
der
serv
ice
agen
cy to
dea
l wit
hsh
areh
olde
r af
fair
s?
V
The
Com
pany
has
des
igna
ted
KG
I S
ecur
itie
s C
o. L
td.
to d
eal w
ith
shar
ehol
der
affa
irs.
N
one
7.In
form
atio
n di
sclo
sure
(1)
Doe
s th
e co
mpa
ny h
ave
a w
ebsi
te to
dis
clos
ebo
th th
e in
form
atio
n re
lati
ng to
fin
ance
, bu
sine
ss a
nd c
orpo
rate
gov
erna
nce?
(2)
Doe
s th
e co
mpa
ny h
ave
othe
r in
form
atio
n
V
V
(1)
The
Com
pany
has
est
abli
shed
the
Chi
nese
/Eng
lish
w
ebsi
te (
ww
w.c
hipm
os.c
om)
to a
ctiv
ely
disc
lose
in
form
atio
n re
gard
ing
the
Com
pany
's f
inan
ce,
busi
ness
and
cor
pora
te g
over
nanc
e, a
nd r
elev
ant
info
rmat
ion
can
be a
lso
foun
d on
Mar
ket
Obs
erva
tion
Pos
t Sys
tem
. (2
) T
he C
ompa
ny h
as e
stab
lish
ed th
e C
hine
se/E
ngli
sh N
one
Non
e
32

Eva
luat
ion
Item
Impl
emen
tati
on S
tatu
s D
evia
tion
s fr
om th
e C
orpo
rate
Gov
erna
nce
Bes
t-P
ract
ice
Pri
ncip
les
for
TW
SE
/TP
Ex
Lis
ted
Com
pani
es a
nd R
easo
ns
Yes
No
Abs
trac
t Ill
ustr
atio
n
disc
losu
re c
hann
els
(e.g
., bu
ildi
ng a
n E
ngli
sh w
ebsi
te, a
ppoi
ntin
g de
sign
ated
pe
ople
to h
andl
e in
form
atio
n co
llec
tion
and
di
sclo
sure
, cre
atin
g a
spok
espe
rson
sys
tem
, w
ebca
stin
g in
vest
or c
onfe
renc
es )
? (3
) D
oes
the
Com
pany
ann
ounc
e an
d re
port
the
annu
al f
inan
cial
sta
tem
ents
wit
hin
two
mon
ths
afte
r th
e en
d of
the
fisc
al y
ear,
and
anno
unce
and
rep
ort t
he f
irst
, sec
ond,
and
th
ird
quar
ter
fina
ncia
l sta
tem
ents
as
wel
l as
the
oper
atin
g st
atus
of
each
mon
th b
efor
e th
e pr
escr
ibed
dea
dlin
e?
V
web
site
to w
ebca
st in
vest
or c
onfe
renc
es. T
he
Com
pany
has
one
spo
kesp
erso
n an
d on
e de
puty
sp
okes
pers
on. T
he C
ompa
ny’s
Fin
ance
&
Acc
ount
ing
Man
agem
ent C
ente
r an
d S
trat
egy
and
Inve
stor
Rel
atio
ns o
ffic
e re
spon
sibl
e fo
r co
rpor
ate
info
rmat
ion
disc
losu
re o
n M
arke
t Obs
erva
tion
P
ost S
yste
m a
nd th
e C
ompa
ny's
web
site
. (3
) T
he C
ompa
ny a
nnou
nce
and
repo
rt th
e an
nual
fi
nanc
ial s
tate
men
ts, a
nd th
e fi
rst,
seco
nd, a
nd
thir
d qu
arte
r fi
nanc
ial s
tate
men
ts a
s w
ell a
s th
e op
erat
ing
stat
us o
f ea
ch m
onth
bef
ore
the
pres
crib
ed d
eadl
ine
The
Com
pany
ann
ounc
e an
d re
port
the
annu
al f
inan
cial
st
atem
ents
wit
hin
thre
e m
onth
s af
ter
the
end
of th
e fi
scal
yea
r be
fore
the
pres
crib
ed d
eadl
ine
8. I
s th
ere
any
othe
r im
port
ant i
nfor
mat
ion
to
faci
lita
te a
bet
ter
unde
rsta
ndin
g of
the
com
pany
’s c
orpo
rate
gov
erna
nce
prac
tice
s (e
.g.,
incl
udin
g bu
t not
lim
ited
to e
mpl
oyee
rig
hts,
em
ploy
ee w
elln
ess,
inve
stor
rel
atio
ns, s
uppl
ier
rela
tion
s, r
ight
s of
sta
keho
lder
s, d
irec
tors
’ and
su
perv
isor
s’ tr
aini
ng r
ecor
ds, t
he im
plem
enta
tion
st
atus
of
risk
man
agem
ent p
olic
ies
and
risk
ev
alua
tion
mea
sure
s, th
e im
plem
enta
tion
of
cust
omer
rel
atio
ns p
olic
ies,
and
pur
chas
ing
insu
ranc
e fo
r di
rect
ors
and
supe
rvis
ors)
?
V V
(1
) E
mpl
oyee
rig
hts
as w
ell a
s em
ploy
ee w
elln
ess:
the
Com
pany
has
impl
emen
ted
the
Lab
or S
tand
ards
A
ct a
nd r
elev
ant r
egul
atio
ns, r
egul
arly
con
duct
ed
educ
atio
n an
d tr
aini
ng, a
nd e
stab
lish
ed th
e E
mpl
oyee
Wel
fare
Com
mit
tee
to p
rote
ct
empl
oyee
s' r
ight
s an
d in
tere
sts.
(2
) In
vest
or r
elat
ions
: the
Com
pany
has
one
sp
okes
pers
on a
nd o
ne d
eput
y sp
okes
pers
on, a
nd
inve
stor
rel
atio
ns o
ffic
e re
spon
sibl
e fo
r de
alin
g w
ith
reco
mm
enda
tion
s an
d do
ubts
rai
sed
by
inve
stor
s.
Non
e N
one
33

Eva
luat
ion
Item
Impl
emen
tati
on S
tatu
s D
evia
tion
s fr
om th
e C
orpo
rate
Gov
erna
nce
Bes
t-P
ract
ice
Pri
ncip
les
for
TW
SE
/TP
Ex
Lis
ted
Com
pani
es a
nd R
easo
ns
Yes
No
Abs
trac
t Ill
ustr
atio
n
V
V
V
V
V
(3)
Sup
plie
r re
lati
ons:
the
Com
pany
has
uph
eld
the
prin
cipl
e of
goo
d fa
ith
to m
aint
ain
the
rela
tion
ship
w
ith
its
supp
lier
s, c
ondu
cted
ope
rati
ons
and
fina
ncia
l sta
tus
asse
ssm
ent f
or th
e m
ajor
pu
rcha
sers
to e
nsur
e th
e st
abil
ity
of th
e pu
rcha
se,
esta
blis
hed
good
rel
atio
nshi
p w
ith
supp
lier
s, a
nd
sim
ulta
neou
sly
deve
lope
d ot
her
poss
ible
al
tern
ativ
e m
ater
ials
and
ven
dors
to in
crea
se th
e fl
exib
ilit
y of
the
sour
ce o
f th
e pu
rcha
se.
(4)
Rig
hts
of s
take
hold
ers:
the
Com
pany
has
es
tabl
ishe
d fu
ncti
ons
of v
ario
us d
epar
tmen
ts, a
nd
mai
ntai
ned
smoo
th c
omm
unic
atio
n ch
anne
ls w
ith
the
stak
ehol
ders
suc
h as
sha
reho
lder
s, e
mpl
oyee
s,
clie
nts,
sup
plie
rs, g
over
nmen
t and
com
mun
ity.
(5
) C
onti
nuin
g ed
ucat
ion
of d
irec
tors
and
sup
ervi
sors
: th
e di
rect
ors
and
inde
pend
ent d
irec
tors
of
the
Com
pany
hav
e co
ntin
ued
atte
ndin
g tr
aini
ng
cour
ses
in a
ccor
danc
e w
ith
rele
vant
reg
ulat
ions
. (6
) T
he im
plem
enta
tion
sta
tus
of r
isk
man
agem
ent
poli
cies
and
ris
k ev
alua
tion
stan
dard
s: U
nder
the
poli
cy o
f st
able
ope
rati
on, t
he C
ompa
ny f
ollo
ws
gove
rnm
ent r
egul
atio
ns a
nd d
evot
es in
red
ucin
g po
ssib
le r
isks
thro
ugh
audi
t act
ions
con
duct
ed b
y in
tern
al a
udit
dep
artm
ent.
(7
) T
he im
plem
enta
tion
sta
tus
of c
usto
mer
rel
atio
ns
poli
cies
: Bef
ore
enga
ging
in b
usin
ess
wit
h ot
hers
,
Non
e
Non
e
Non
e
Non
e
Non
e
34

Eva
luat
ion
Item
Impl
emen
tati
on S
tatu
s D
evia
tion
s fr
om th
e C
orpo
rate
Gov
erna
nce
Bes
t-P
ract
ice
Pri
ncip
les
for
TW
SE
/TP
Ex
Lis
ted
Com
pani
es a
nd R
easo
ns
Yes
No
Abs
trac
t Ill
ustr
atio
n
V
the
Com
pany
has
take
n in
to a
ccou
nt th
e le
gali
ty o
f th
e cl
ient
s or
oth
er b
usin
ess
deal
ings
par
ties
and
w
heth
er th
ere
is a
ny r
ecor
d of
dis
hone
sty
and
avoi
ded
tran
sact
ions
wit
h cr
edit
ors
of d
isho
nest
y.
The
Com
pany
has
pro
duce
d hi
gh-q
uali
ty p
rodu
cts
to m
eet c
lien
ts' d
eman
d fo
r qu
alit
y an
d qu
anti
ty,
and
mai
ntai
ns g
ood
long
-ter
m r
elat
ions
hip
wit
h cl
ient
s.
(8)
The
sta
tus
of p
urch
asin
g li
abil
ity
insu
ranc
e fo
r di
rect
ors
and
supe
rvis
ors:
The
Com
pany
has
pu
rcha
sed
Dir
ecto
rs a
nd O
ffic
ers
Lia
bili
ty
Insu
ranc
e an
d su
ch in
form
atio
n ha
s be
en d
iscl
osed
on
Mar
ket O
bser
vati
on P
ost S
yste
m.
Non
e
9. P
leas
e in
dica
te i
mpr
ovem
ent
stat
us o
f th
e re
sult
s of
the
cor
pora
te g
over
nanc
e ev
alua
tion
iss
ued
by T
WS
E C
orpo
rate
Gov
erna
nce
Cen
ter
for
the
mos
t rec
ent y
ear
and
prop
ose
mat
ters
whi
ch s
houl
d be
giv
en p
rior
ity
and
mea
sure
s as
for
whi
ch h
ave
not y
et im
prov
ed:
T
he c
ompa
ny h
as a
men
ded
the
Com
pany
's A
rtic
les
of I
ncor
pora
tion
in th
e 20
19 A
nnua
l Sha
reho
lder
s’ M
eeti
ng to
sti
pula
te th
e no
min
atio
n sy
stem
fo
r th
e se
lect
ion
of d
irec
tors
(in
clud
ing
inde
pend
ent
dire
ctor
s) a
nd e
stab
lish
ed t
he b
oard
per
form
ance
eva
luat
ion
met
hod
in 2
020.
It
is p
lann
ed t
o co
mpl
ete
the
esta
blis
hmen
t of
corp
orat
e go
vern
ance
sup
ervi
sor
befo
re J
une
30, 2
021.
In
the
futu
re, w
e w
ill s
tren
gthe
n th
e ef
fici
ency
of
corp
orat
e go
vern
ance
to p
rovi
de in
form
atio
n to
the
stak
ehol
ders
.
35

(IV) Composition, Responsibilities and Operations of the Remuneration Committee
1. The 4rd Remuneration Committee
Title
Criteria
Name
Meets One of the Following Professional Qualification Requirements, Together with at
Least Five Years’ Work Experience Independence criteria (Note)
Number of Other Public Companies in
Which the Individual is Concurrently Serving as an Remuneration
Committee Member
Remarks
An instructor or higher position in a department of commerce, law, finance, accounting, or other academic department related to the business needs of the company in a public or private junior college, college or university
A judge, public prosecutor, attorney, certified publicaccountant, or other professional or technical specialists who has passed a national examination and been awarded a certificate in a profession necessary for the business of the company
Have work experience in the area of commerce, law, finance, or accounting, or otherwise necessary for the business ofthe company
1 2 3 4 5 6 7 8 9 10
Independent Director
Tai-Haur Kuo
V V V V V V V V V V V V 1
Independent Director
Yuh-Fong Tang
V V V V V V V V V V V 1
Independent Director
Chin-Shyh Ou
V V V V V V V V V V V V V 2
Note: Within the scope of execution of business, a remuneration committee member of a public company shall maintain independence, and may not have any direct or indirect interest relationship with the company. During the 2 years before being appointed or during the term of office, a remuneration committee member shall not have been or be any of the following:
1. An employee of the company or any of its affiliates.2. A director or supervisor of the company or any of its affiliates.3. A natural-person shareholder who holds shares, together with those held by the person's spouse, minor children, or held by the
person under any other's name, in an aggregate amount of 1 percent or more of the total number of issued shares of the company orranking in the top 10 in shareholding.
4. A spouse, relative within the second degree of kinship, or lineal relative within the third degree of kinship, of a managerial officerunder subparagraph 1 or any of the persons in the preceding two subparagraphs.
5. A director, supervisor, or employee of a corporate shareholder that directly holds 5 percent or more of the total number of issuedshares of the company, or that ranks in the top 5 in shareholding, or that designates its representative to serve as a director orsupervisor of the company under Article 27, paragraph 1 or 2 of the Company Act.
6. If a majority of the company's director seats or voting shares and those of any other company are controlled by the same person: adirector, supervisor, or employee of that other company.
7. If the chairperson, general manager, or person holding an equivalent position of the company and a person in any of thosepositions at another company or institution are the same person or are spouses: a director (or governor), supervisor, or employee ofthat other company or institution.
8. A director, supervisor, managerial officer, or shareholder holding 5 percent or more of the shares, of a specified company orinstitution that has a financial or business relationship with the company.
9. A professional individual who, or an owner, partner, director, supervisor, or managerial officer of a sole proprietorship, partnership,company, or institution that, provides auditing services to the company or any affiliate of the company, or that providescommercial, legal, financial, accounting or related services to the company or any affiliate of the company for which the providerin the past 2 years has received cumulative compensation exceeding NT$500,000, or a spouse thereof; provided that this restrictiondoes not apply to a member of the remuneration committee, public tender offer review committee, or special committee formerger/consolidation and acquisition, who exercises powers pursuant to the Act or to the Business Mergers and Acquisitions Actor related laws or regulations.
10. Not having any of the situations set forth in Article 30 of the Company Act.
36

2. Operation of the Remuneration Committee
(1) The time of establishment: The Company established Remuneration Committee
Charter as well as the Remuneration Committee on March 29, 2012.
(2) The purpose of the Remuneration Committee:
A. Establish and regularly review the performance targets of the directors and
managers as well as policies, systems, standards and structure of remuneration.
B. Supervise the management of the Company's remuneration of directors and
managers.
(3) Members: The Remuneration Committee includes three members who are all
independent directors .
(4) The tenure of the 4th Remuneration Committee starts from June 10, 2019 to June 09,
2022. The Remuneration Committee has held 5 meetings (A) in 2019. The
attendance of the directors was as follows:
Title NameAttendance
in person(B)
Attendance by
proxy
Attendance
rate (%)
(B/A)
Remarks
Convener Tai-Haur Kuo 5 0 100%
Member Yuh-Fong Tang 4 1 80%
Member Chin-Shyh Ou 5 0 100%
Other mentionable items:
I. If the Board of Directors declines to adopt or modifies a recommendation of the Remuneration
Committee's proposals, it should specify the date of meeting, sessions, content of the motion, resolution by
the Board of Directors and the Company’s response to the Remuneration Committee’s opinion (e.g., the
remuneration passed by the board of directors exceeds the recommendation committee, the circumstance
and cause for the difference shall be specified): None.
II. Resolutions of the Remuneration Committee objected by members or subject to a qualified opinion and
recorded or declared in writing, the date of the meeting, session, content of the motion of the Remuneration
Committee, all members' opinions and the response to members' opinion should be specified: None.
37
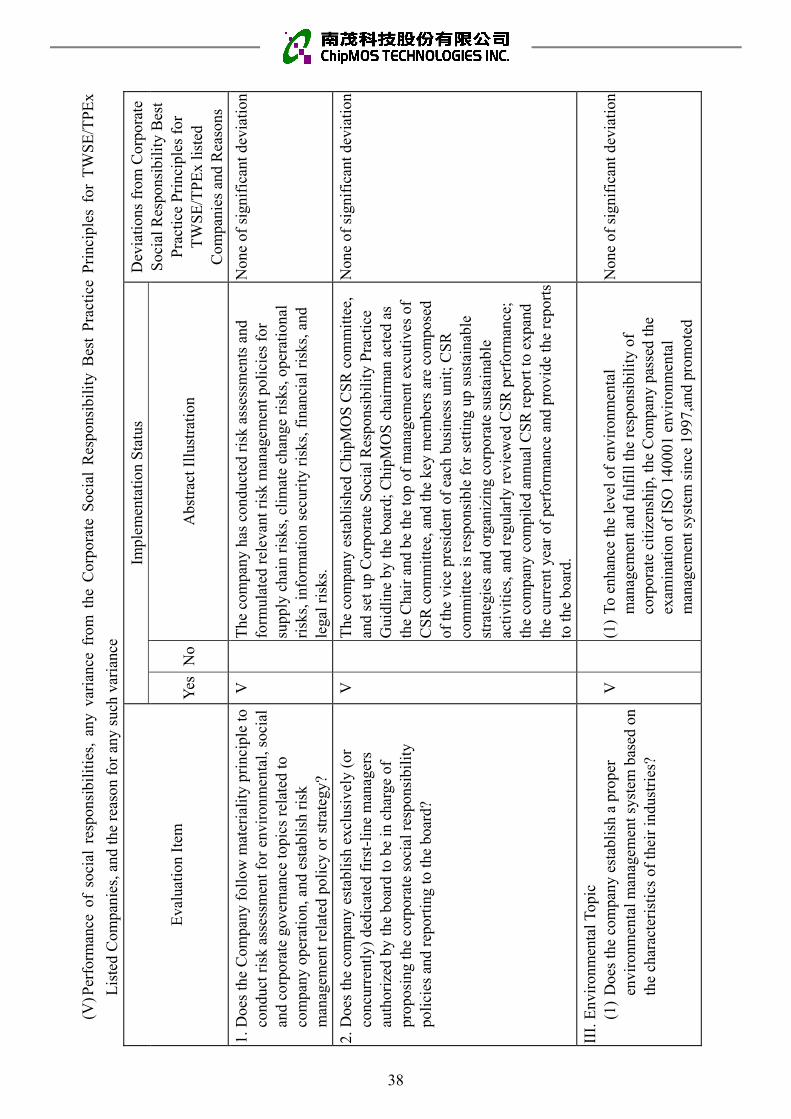
(V) P
erfo
rman
ce o
f so
cial
res
pons
ibil
itie
s, a
ny v
aria
nce
from
the
Cor
pora
te S
ocia
l R
espo
nsib
ilit
y B
est
Pra
ctic
e P
rinc
iple
s fo
r T
WS
E/T
PE
x
Lis
ted
Com
pani
es, a
nd th
e re
ason
for
any
suc
h va
rian
ce
Eva
luat
ion
Item
Impl
emen
tati
on S
tatu
s D
evia
tion
s fr
om C
orpo
rate
S
ocia
l Res
pons
ibil
ity
Bes
t P
ract
ice
Pri
ncip
les
for
TW
SE
/TP
Ex
list
ed
Com
pani
es a
nd R
easo
ns
Yes
No
Abs
trac
t Ill
ustr
atio
n
1.D
oes
the
Com
pany
fol
low
mat
eria
lity
pri
ncip
le to
cond
uct r
isk
asse
ssm
ent f
or e
nvir
onm
enta
l, so
cial
and
corp
orat
e go
vern
ance
topi
cs r
elat
ed to
com
pany
ope
rati
on, a
nd e
stab
lish
ris
km
anag
emen
t rel
ated
pol
icy
or s
trat
egy?
VT
he c
ompa
ny h
as c
ondu
cted
ris
k as
sess
men
ts a
nd
form
ulat
ed r
elev
ant r
isk
man
agem
ent p
olic
ies
for
supp
ly c
hain
ris
ks, c
lim
ate
chan
ge r
isks
, ope
rati
onal
ri
sks,
info
rmat
ion
secu
rity
ris
ks, f
inan
cial
ris
ks, a
nd
lega
l ris
ks.
Non
e of
sig
nifi
cant
dev
iati
on
2.D
oes
the
com
pany
est
abli
sh e
xclu
sive
ly (
orco
ncur
rent
ly)
dedi
cate
d fi
rst-
line
man
ager
sau
thor
ized
by
the
boar
d to
be
in c
harg
e of
prop
osin
g th
e co
rpor
ate
soci
al r
espo
nsib
ilit
ypo
lici
es a
nd r
epor
ting
to th
e bo
ard?
VT
he c
ompa
ny e
stab
lish
ed C
hipM
OS
CS
R c
omm
itte
e,
and
set u
p C
orpo
rate
Soc
ial R
espo
nsib
ilit
y P
ract
ice
Gui
dlin
e by
the
boar
d; C
hipM
OS
cha
irm
an a
cted
as
the
Cha
ir a
nd b
e th
e to
p of
man
agem
ent e
xcut
ives
of
CS
R c
omm
itte
e, a
nd th
e ke
y m
embe
rs a
re c
ompo
sed
of th
e vi
ce p
resi
dent
of
each
bus
ines
s un
it; C
SR
co
mm
itte
e is
res
pons
ible
for
set
ting
up
sust
aina
ble
stra
tegi
es a
nd o
rgan
izin
g co
rpor
ate
sust
aina
ble
acti
viti
es, a
nd r
egul
arly
rev
iew
ed C
SR
per
form
ance
; th
e co
mpa
ny c
ompi
led
annu
al C
SR
rep
ort t
o ex
pand
th
e cu
rren
t yea
r of
per
form
ance
and
pro
vide
the
repo
rts
to th
e bo
ard.
Non
e of
sig
nifi
cant
dev
iati
on
III.
Env
iron
men
tal T
opic
(1)
Doe
s th
e co
mpa
ny e
stab
lish
a p
rope
ren
viro
nmen
tal m
anag
emen
t sys
tem
bas
ed o
n th
e ch
arac
teri
stic
s of
thei
r in
dust
ries
?
V(1
) To
enh
ance
the
leve
l of
envi
ronm
enta
l m
anag
emen
t and
ful
fill
the
resp
onsi
bili
ty o
f co
rpor
ate
citi
zens
hip,
the
Com
pany
pas
sed
the
exam
inat
ion
of I
SO
140
001
envi
ronm
enta
l m
anag
emen
t sys
tem
sin
ce 1
997,
and
prom
oted
Non
e of
sig
nifi
cant
dev
iati
on
38

Eva
luat
ion
Item
Impl
emen
tati
on S
tatu
s D
evia
tion
s fr
om C
orpo
rate
S
ocia
l Res
pons
ibil
ity
Bes
t P
ract
ice
Pri
ncip
les
for
TW
SE
/TP
Ex
list
ed
Com
pani
es a
nd R
easo
ns
Yes
No
Abs
trac
t Ill
ustr
atio
n
.
QC
-080
000
prod
ucts
haza
rdou
s su
bsta
nces
pro
cess
m
anag
emen
t sys
tem
cer
tifi
cati
on in
201
2.
Sin
ce 2
013,
we
have
com
preh
ensi
vely
pro
mot
ed
envi
ronm
enta
l pro
tect
ion
rela
ted
syst
em
veri
fica
tion
in e
nvir
onm
enta
l fri
endl
ines
s,
incl
udin
g IS
O14
067
carb
on f
ootp
rint
, IS
O14
046
wat
er f
ootp
rint
, IS
O50
001
ener
gy m
anag
emen
t sy
stem
, IS
O14
051
mat
eria
l flo
w c
ost a
ccou
ntin
g,
in li
ne w
ith
inte
rnat
iona
l tre
nds
and
cust
omer
re
quir
emen
ts, d
eriv
ed f
rom
the
prod
ucti
on p
roce
ss.
Air
pol
luti
on, w
ater
pol
luti
on, a
nd w
aste
, in
addi
tion
to o
btai
ning
rel
evan
t lic
ense
s to
ope
rate
ac
cord
ing
to th
eir
requ
irem
ents
, are
act
ivel
y ta
king
m
any
mea
sure
s to
pur
sue
sust
aina
ble
envi
ronm
enta
l pro
tect
ion.
1.
Pro
mot
e en
viro
nmen
tal p
olic
y: C
onti
nuin
g to
educ
ate
empl
oyee
s an
d co
mm
unic
ate
thro
ugh
the
com
pany
's o
ffic
ial w
ebsi
te, c
omm
itti
ng to
the
inte
ntio
n of
exh
aust
, was
tew
ater
and
was
tepo
llut
ion
prev
enti
on a
nd w
ater
pow
er r
educ
tion
cont
rol.
2.R
educ
tion
of
air
poll
utio
n em
issi
ons:
In
term
s of
air
qual
ity,
the
goal
of
redu
cing
the
air
poll
utio
nem
issi
ons
by im
prov
ing
the
trea
tmen
t eff
icie
ncy
of th
e co
ntro
l equ
ipm
ent,
such
as
the
addi
tion
of
zeol
ite
runn
ers
and
RT
O h
igh-
effi
cien
cy a
irpo
llut
ion
cont
rol.
39

Eva
luat
ion
Item
Impl
emen
tati
on S
tatu
s D
evia
tion
s fr
om C
orpo
rate
S
ocia
l Res
pons
ibil
ity
Bes
t P
ract
ice
Pri
ncip
les
for
TW
SE
/TP
Ex
list
ed
Com
pani
es a
nd R
easo
ns
Yes
No
Abs
trac
t Ill
ustr
atio
n
(2)
Doe
s th
e co
mpa
ny e
ndea
vor
to u
tili
ze a
ll
reso
urce
s m
ore
effi
cien
tly
and
use
rene
wab
lem
ater
ials
whi
ch h
ave
low
impa
ct o
n th
e en
viro
nmen
t?
V
3.W
ater
/was
tew
ater
red
ucti
on a
nd r
ecov
ery:
Con
tinu
ousl
y im
prov
e th
e re
cove
ry r
ate
ofpr
oces
s w
aste
wat
er in
the
plan
t, an
d re
cycl
eco
nden
sate
and
rai
nwat
er to
the
cool
ing
tow
eran
d pu
blic
wat
er.
4.W
aste
reu
se: P
rom
ote
the
proc
ess
sour
ce to
opti
miz
e th
e us
e of
raw
mat
eria
ls a
nd w
aste
from
inci
nera
tion
/ la
ndfi
ll to
reu
se.
(2)
The
Com
pany
est
abli
shed
a m
anag
emen
t m
echa
nism
for
usi
ng r
e-us
e an
d re
cycl
ing
of
elec
tric
ity,
wat
er r
esou
rces
and
mat
eria
ls, a
nd h
as
cont
inue
d to
impr
ove
the
sour
ce m
anag
emen
t and
en
ergy
con
serv
atio
n an
d w
aste
red
ucti
on. I
n th
e m
anuf
actu
ring
pro
cess
, the
req
uire
men
ts f
or
effi
cien
cy im
prov
emen
t and
spe
cifi
cati
on
adju
stm
ent o
f su
pply
fac
ilit
ies
are
targ
eted
at
"ene
rgy
savi
ng"
and
"dec
reas
e", s
uch
as a
ir
cond
itio
ning
ene
rgy
savi
ng, i
nsta
llat
ion
of e
nerg
y sa
ving
ligh
ting
(L
ED
), in
crea
sing
the
effi
cien
cy o
f cl
ean
room
cir
cula
tion
fan
s (F
FU
), p
rom
otin
g th
e pr
oces
s of
impr
ovin
g en
ergy
sav
ing
and
was
te
redu
ctio
n pr
oces
s, s
olar
gre
en p
ower
gen
erat
ion,
pr
oces
s w
aste
wat
er a
nd r
ainw
ater
rec
over
y an
d th
roug
h th
e en
ergy
man
agem
ent,
mat
eria
l flo
w c
ost
acco
unti
ng v
erif
icat
ion
and
gree
n bu
ildi
ng, g
reen
Non
e of
sig
nifi
cant
dev
iati
on
40

Eva
luat
ion
Item
Impl
emen
tati
on S
tatu
s D
evia
tion
s fr
om C
orpo
rate
S
ocia
l Res
pons
ibil
ity
Bes
t P
ract
ice
Pri
ncip
les
for
TW
SE
/TP
Ex
list
ed
Com
pani
es a
nd R
easo
ns
Yes
No
Abs
trac
t Ill
ustr
atio
n
(3
) D
oes
the
com
pany
ass
ess
the
pote
ntia
l ris
ks
and
oppo
rtun
itie
s of
cli
mat
e ch
ange
men
t no
w a
nd in
the
futu
re, a
nd a
dopt
cl
imat
e-re
late
d ca
scad
ing
mea
sure
s?
(4)
Doe
s th
e co
mpa
ny c
ount
gre
enho
use
gas
emis
sion
s, w
ater
con
sum
ptio
n an
d to
tal
wei
ght o
f w
aste
in th
e pa
st tw
o ye
ars
and
form
ulat
e po
lici
es f
or e
nerg
y sa
ving
and
ca
rbon
red
ucti
on, g
reen
hous
e ga
s re
duct
ion,
w
ater
use
red
ucti
on o
r ot
her
was
te
man
agem
ent?
V V
fact
ory
mar
k, in
ord
er to
red
uce
the
load
of
envi
ronm
enta
l im
pact
, tow
ards
cir
cula
r ec
onom
y an
d ze
ro p
ollu
tion
. (3
) T
he c
ompa
ny is
com
mit
ted
to r
educ
ing
gree
nhou
se
gas
emis
sion
s. A
bout
97%
of
carb
on e
mis
sion
s ar
e fr
om e
lect
rici
ty. T
here
fore
, it i
ntro
duce
d th
e IS
O50
001
ener
gy m
anag
emen
t sys
tem
and
is
com
mit
ted
to r
educ
ing
carb
on e
mis
sion
s. T
he 1
st
sola
r po
wer
sys
tem
was
est
abli
shed
in 2
011
and
mer
ged
into
the
fact
ory'
s po
wer
sys
tem
; the
sec
ond
one
wil
l be
inst
alle
d in
201
8.
(4)
The
Com
pany
pay
att
enti
on to
the
impa
ct o
f cl
imat
e ch
ange
on
oper
atio
nal a
ctiv
itie
s. I
n ad
diti
on to
the
impl
emen
tati
on o
f IS
O 1
4064
gr
eenh
ouse
gas
inve
ntor
y an
nual
ly s
ince
201
3, th
e C
ompa
ny p
rom
oted
the
ener
gy-s
avin
g m
easu
res,
in
trod
uced
the
ener
gy m
anag
emen
t sys
tem
, and
pa
ssed
the
exam
inat
ion
of I
SO
500
01. I
n re
spon
se
to c
lien
ts a
nd m
eet t
heir
exp
ecta
tion
s of
lo
w-c
arbo
n pr
oduc
ts, t
he C
ompa
ny im
plem
ent
prod
uct c
arbo
n fo
otpr
int a
nd w
ater
foo
tpri
nt
inve
ntor
y to
red
uce
the
emis
sion
of
prod
uct c
arbo
n.
Ano
ther
, we
push
the
“Mat
eria
ls F
low
Cos
t A
ccou
ntin
g m
anag
emen
t (IS
O 1
4051
)” in
201
6 an
d 20
17 to
mee
t the
tren
d of
rec
ycle
eco
nom
ics.
Non
e of
sig
nifi
cant
dev
iati
on
Non
e of
sig
nifi
cant
dev
iati
on
41

Eva
luat
ion
Item
Impl
emen
tati
on S
tatu
s D
evia
tion
s fr
om C
orpo
rate
S
ocia
l Res
pons
ibil
ity
Bes
t P
ract
ice
Pri
ncip
les
for
TW
SE
/TP
Ex
list
ed
Com
pani
es a
nd R
easo
ns
Yes
No
Abs
trac
t Ill
ustr
atio
n
4.S
ocia
l Top
ic(1
) D
oes
the
com
pany
for
mul
ate
appr
opri
ate
man
agem
ent p
olic
ies
and
proc
edur
es
acco
rdin
g to
rel
evan
t reg
ulat
ions
and
the
Inte
rnat
iona
l Bil
l of
Hum
an R
ight
s?
(2)
Has
the
Com
pany
est
abli
shed
app
ropr
iate
ly
man
aged
em
ploy
ee w
elfa
re m
easu
res
(inc
lude
sa
lary
and
com
pens
atio
n, le
ave
and
othe
rs),
an
d li
nk o
pera
tion
al p
erfo
rman
ce o
r ac
hiev
emen
ts w
ith
empl
oyee
sal
ary
and
com
pens
atio
n?
(3)
Doe
s th
e co
mpa
ny p
rovi
de a
hea
lthy
and
saf
e w
orki
ng e
nvir
onm
ent a
nd o
rgan
ize
trai
ning
on
V V V
(1)
The
Com
pany
com
plie
d w
ith
loca
l lab
or la
ws
and
, ac
cord
ing
to th
e in
tern
atio
nal l
abor
and
hum
an
righ
ts s
tand
ards
of
" R
espo
nsib
le B
usin
ess
All
ianc
e "
(RB
A),
inco
rpor
ated
hum
aniz
ed m
anag
emen
t, de
velo
ped
wri
tten
em
ploy
ee p
olic
ies
and
publ
ishe
d it
in th
e co
mpa
ny's
em
ploy
ee b
ulle
tin
boar
d so
that
em
ploy
ees
may
que
ry a
nd u
nder
stan
d. H
uman
re
sour
ces
man
agem
ent c
ente
r al
so k
ept a
brea
st o
f th
e am
endm
ent t
o la
bor
law
s, ti
mel
y ad
just
ed
man
agem
ent s
yste
m, s
o th
at a
ll th
e em
ploy
ees'
la
bor
righ
ts a
nd in
tere
sts
wou
ld b
e pr
otec
ted.
(2)
The
Com
pany
has
est
abli
shed
a r
easo
nabl
e em
ploy
ee w
elfa
re p
olic
y (i
nclu
ding
com
pens
atio
n,
vaca
tion
and
oth
er b
enef
its)
and
pre
scri
bed
rela
ted
deta
ils
in p
erso
nnel
reg
ulat
ions
. In
addi
tion
, the
C
ompa
ny s
tipu
late
d th
e pr
ofit
s po
licy
of
empl
oyee
s in
the
Com
pany
's A
rtic
les
of
Inco
rpor
atio
n an
d re
gula
rly
impl
emen
t sal
ary
adju
stm
ents
bas
ed o
n th
e C
ompa
ny's
ope
rati
ng
cond
itio
ns a
nd e
mpl
oyee
per
form
ance
to r
etur
n op
erat
ing
resu
lts
to e
mpl
oyee
s.
(3)
In a
ddit
ion
to th
at th
e C
ompa
ny e
stab
lish
ed
poli
cies
to p
rote
ct e
mpl
oyee
s' s
afet
y an
d he
alth
, the
Non
e of
sig
nifi
cant
dev
iati
on
Non
e of
sig
nifi
cant
dev
iati
on
Non
e of
sig
nifi
cant
dev
iati
on
42

Eva
luat
ion
Item
Impl
emen
tati
on S
tatu
s D
evia
tion
s fr
om C
orpo
rate
S
ocia
l Res
pons
ibil
ity
Bes
t P
ract
ice
Pri
ncip
les
for
TW
SE
/TP
Ex
list
ed
Com
pani
es a
nd R
easo
ns
Yes
No
Abs
trac
t Ill
ustr
atio
n
heal
th a
nd s
afet
y fo
r it
s em
ploy
ees
on a
re
gula
r ba
sis?
Com
pany
pro
mot
ed th
e O
HS
AS
180
01
occu
pati
onal
saf
ety
and
heal
th m
anag
emen
t sys
tem
to
enh
ance
em
ploy
ees'
saf
ety.
In
the
area
of
occu
pati
onal
saf
ety
and
heal
th m
anag
emen
t, w
e fo
cus
on "
wor
kpla
ce s
afet
y" a
nd "
labo
r he
alth
" an
d ac
tive
ly p
rom
ote
the
divi
sion
of
elec
tric
al
expl
osio
n-pr
oof
area
s an
d ri
sk r
educ
tion
, ris
k as
sess
men
t and
cla
ssif
icat
ion
man
agem
ent o
f ch
emic
al e
xpos
ure
haza
rds,
hum
an f
acto
rs
engi
neer
ing,
etc
. thr
ough
app
ropr
iate
des
ign,
en
gine
erin
g an
d ad
min
istr
ativ
e co
ntro
l, pr
otec
tive
m
aint
enan
ce a
nd s
afe
oper
atin
g pr
oced
ures
and
sa
fety
kno
wle
dge
trai
ning
to r
educ
e, e
lim
inat
e an
d pr
even
t wor
kpla
ce h
azar
ds, a
nd im
plem
ent t
rain
ing
dril
ls th
roug
h em
erge
ncy
proc
edur
es to
min
imiz
e th
e im
pact
of
prop
erty
and
inju
ry, s
et o
ccup
atio
nal
safe
ty a
nd h
ealt
h pl
ans
ever
y ye
ar, a
nd im
plem
ent
educ
atio
n an
d tr
aini
ng a
ccor
ding
to th
e pl
an a
nd
the
mon
itor
ing
of th
e w
orki
ng e
nvir
onm
ent,
and
the
free
hea
lth
chec
k of
the
empl
oyee
s, th
e he
alth
pr
omot
ion
acti
viti
es, t
he M
inis
try
of S
cien
ce a
nd
Tech
nolo
gy S
cien
ce P
ark
Adm
inis
trat
ion
and
the
Nat
iona
l Hea
lth
Ber
eau
awar
ded
the
"Ope
rati
onal
S
afet
y an
d H
ealt
h E
xcel
lent
Uni
t" a
nd "
Hea
lthy
W
orkp
lace
Sel
f-ce
rtif
icat
ion"
mar
k A
nd w
eigh
t lo
ss p
erfo
rman
ce g
roup
s an
d in
divi
dual
aw
ards
,
43

Eva
luat
ion
Item
Impl
emen
tati
on S
tatu
s D
evia
tion
s fr
om C
orpo
rate
S
ocia
l Res
pons
ibil
ity
Bes
t P
ract
ice
Pri
ncip
les
for
TW
SE
/TP
Ex
list
ed
Com
pani
es a
nd R
easo
ns
Yes
No
Abs
trac
t Ill
ustr
atio
n
(4)
Doe
s th
e co
mpa
ny p
rovi
de it
s em
ploy
ees
wit
h ca
reer
dev
elop
men
t and
trai
ning
ses
sion
s?
V
succ
essf
ully
cre
atin
g a
safe
and
hea
lthy
pr
ofes
sion
al e
nvir
onm
ent..
(4)
The
Com
pany
off
ered
a c
ompl
ete
six
cate
gory
of
cour
ses,
so
that
eac
h em
ploy
ee a
t all
sta
ges
has
com
preh
ensi
ve tr
aini
ng o
ppor
tuni
ties
, and
pr
ovid
ed e
mpl
oyee
s w
ith
subs
idie
s to
par
tici
pate
in
exte
rnal
trai
ning
cou
rses
. The
Com
pany
pro
vide
d em
ploy
ees
wit
h ri
ch a
nd d
iver
se in
tern
al a
nd
exte
rnal
res
ourc
es s
o th
at e
mpl
oyee
s' c
aree
rs h
ave
oppo
rtun
itie
s to
gro
w.
1.N
ew e
mpl
oyee
ori
enta
tion
: to
enha
nce
the
unde
rsta
ndin
g of
the
Com
pany
's p
rodu
ctor
gani
zati
on, b
usin
ess
dire
ctio
n an
d co
re v
alue
sof
und
erst
andi
ng a
nd r
ecog
niti
on.
2.E
ngin
eeri
ng te
chno
logy
: in
line
wit
h th
est
rate
gic
dire
ctio
n of
to e
stab
lish
eng
inee
ring
and
tech
nica
l cou
rses
in o
rder
to la
y a
prof
essi
onal
cor
ners
tone
and
enh
ance
the
know
ledg
e; to
est
abli
sh C
hipM
OS
’s p
rofe
ssio
nal
trai
ning
pro
gram
for
eng
inee
rs (
BU
trai
ning
prog
ram
) w
ith
the
conc
ept o
f de
velo
pmen
t of
engi
neer
's p
rofe
ssio
nal a
bili
ty a
nd to
est
abli
shsy
stem
atic
trai
ning
cou
rses
, and
to p
rom
ote
the
effe
ctiv
e in
heri
tanc
e of
kno
wle
dge
and
expe
rien
ce.
Non
e of
sig
nifi
cant
dev
iati
on
44

Eva
luat
ion
Item
Impl
emen
tati
on S
tatu
s D
evia
tion
s fr
om C
orpo
rate
S
ocia
l Res
pons
ibil
ity
Bes
t P
ract
ice
Pri
ncip
les
for
TW
SE
/TP
Ex
list
ed
Com
pani
es a
nd R
easo
ns
Yes
No
Abs
trac
t Ill
ustr
atio
n
(5
) D
oes
the
Com
pany
’s
prod
uct a
nd s
ervi
ce
com
ply
wit
h re
late
d re
gula
tion
s an
d in
tern
atio
nal r
ules
for
cus
tom
ers’
hea
lth
and
safe
ty, p
riva
cy, s
ales
, lab
elli
ng a
nd s
et p
olic
es
to p
rote
ct c
onsu
mer
s’ r
ight
s an
d co
nsum
er
appe
al p
roce
dure
s?
V
3. Q
uali
ty m
anag
emen
t: to
pro
mot
e th
e C
ompa
ny's
qu
alit
y sy
stem
. 4.
Env
iron
men
tal s
afet
y an
d w
ork
heal
th: t
o m
ake
empl
oyee
acq
uire
qua
lifi
ed li
cens
e an
d ha
ve
rela
ted
know
ledg
e of
rig
ht w
orki
ng
envi
ronm
enta
l saf
ety.
5.
Lea
ders
hip
man
agem
ent:
to e
nhan
ce
man
agem
ent s
kill
s of
the
lead
ersh
ip p
ipel
ine
base
d on
the
com
pany
's a
nnua
l ope
rati
onal
st
rate
gies
and
the
requ
ired
com
pete
nce
at a
ll
leve
ls o
f m
anag
emen
t. 6.
Wor
k pe
rfor
man
ce: t
o pr
ovid
e em
ploy
ee w
ith
the
trai
ning
of
rele
vant
ski
lls
requ
ired
for
wor
k in
ord
er to
ena
ble
them
to w
ork
full
y by
usi
ng
wha
t the
y le
arne
d.
T
he C
ompa
ny r
ewar
ded
the
silv
er o
f ce
rtif
icat
ion
in T
aiw
an T
rain
Qua
lity
Sys
tem
by
Wor
kfor
ce D
evel
opm
ent A
genc
y, M
inis
try
of
Lab
or in
Nov
embe
r, 20
19.
(5
) T
he C
ompa
ny p
asse
d m
any
inte
rnat
iona
l sta
ndar
ds,
incl
udin
g IA
TF
169
49, I
SO
900
1, Q
C 0
8000
0,
IS
O 1
4001
, IS
O 5
0001
, IS
O 1
7025
, IS
O 2
7001
, O
HS
AS
180
01, A
NS
/ES
D S
20.2
0 an
d IS
O 2
6262
.
Non
e of
sig
nifi
cant
dev
iati
on
45

Eva
luat
ion
Item
Impl
emen
tati
on S
tatu
s D
evia
tion
s fr
om C
orpo
rate
S
ocia
l Res
pons
ibil
ity
Bes
t P
ract
ice
Pri
ncip
les
for
TW
SE
/TP
Ex
list
ed
Com
pani
es a
nd R
easo
ns
Yes
No
Abs
trac
t Ill
ustr
atio
n
(6)
Doe
s th
e C
ompa
ny s
et s
uppl
ier
man
agem
ent
poli
cy a
nd r
eque
st s
uppl
iers
to c
ompl
y w
ith
rela
ted
stan
dard
s on
the
topi
cs o
f en
viro
nmen
tal,
occu
pati
onal
saf
ety
and
heal
th
or la
bor
righ
t, an
d th
eir
impl
emen
tati
on
stat
us?
V(6
) W
hen
eval
uati
ng n
ew s
uppl
iers
, the
Com
pany
fo
llow
s th
e pu
rpos
e of
the
RB
A a
nd th
e re
leva
nt
guid
elin
es to
inve
stig
ate
whe
ther
it h
as th
e co
ncep
t of
env
iron
men
tal p
rote
ctio
n an
d co
rpor
ate
resp
onsi
bili
ty, o
ccup
atio
nal s
afet
y an
d he
alth
, goo
d co
rpor
ate
citi
zens
hip,
and
whe
ther
ther
e is
any
re
cord
of
envi
ronm
enta
l, oc
cupa
tion
al s
afet
y an
d he
alth
, and
soc
ial i
mpa
ct. T
he s
uppl
ier
wou
ld b
e as
ked
to r
epor
t and
impr
ove
the
resu
lts,
and
co
nfir
m th
e cu
rren
t act
ual i
mpl
emen
tati
on if
the
supp
lier
has
rel
ated
rec
ords
.
Non
e of
sig
nifi
cant
dev
iati
on
5.D
oes
the
Com
pany
ref
er to
inte
rnat
iona
l rep
orti
ngru
les
or g
uide
line
s to
pub
lish
CS
R R
epor
t to
disc
lose
non
-fin
anci
al in
form
atio
n of
the
Com
pany
? H
as th
e sa
id R
epor
t acq
uire
3rd
cert
ific
atio
n pa
rty
veri
fica
tion
or
stat
emen
t of
assu
ranc
e?
V20
18 C
hipM
OS
Cor
pora
te S
ocia
l Res
pons
ibil
ity
Rep
ort f
ollo
wed
the
qual
ity
prin
cipl
es r
equi
red
by G
RI
Sta
ndar
ds. T
o en
sure
qua
lity
of
info
rmat
ion
disc
losu
re,
the
repo
rt h
as b
een
veri
fied
by
the
BS
I Ta
iwan
and
was
in
acc
orda
nce
wit
h G
RI
Sta
ndar
ds c
ore
opti
ons
and
wit
h ty
pe I
mod
erat
e le
vel o
f AA
1000
AS
(200
8).
Non
e of
sig
nifi
cant
dev
iati
on
6.If
the
com
pany
has
est
abli
shed
the
corp
orat
e so
cial
res
pons
ibil
ity
prin
cipl
es b
ased
on
"Cor
pora
te S
ocia
l Res
pons
ibil
ity
Bes
t Pra
ctic
e P
rinc
iple
sfo
r T
WS
E/T
PE
x L
iste
d C
ompa
nies
", p
leas
e de
scri
be a
ny d
evia
tion
bet
wee
n th
e P
rinc
iple
s an
d th
eir
impl
emen
tati
on:
The
Com
pany
has
est
abli
shed
Cor
pora
te S
ocia
l Res
pons
ibil
ity
Pra
ctic
e G
uidl
ine
on A
ugus
t 13,
201
3 an
d re
vise
d it
on
Mar
ch 1
2, 2
015.
The
rele
vant
ope
rati
ons
wer
e in
acc
orda
nce
wit
h th
e pu
rpos
e of
cor
pora
te s
ocia
l res
pons
ibil
ity.
46

Eva
luat
ion
Item
Impl
emen
tati
on S
tatu
s D
evia
tion
s fr
om C
orpo
rate
S
ocia
l Res
pons
ibil
ity
Bes
t P
ract
ice
Pri
ncip
les
for
TW
SE
/TP
Ex
list
ed
Com
pani
es a
nd R
easo
ns
Yes
No
Abs
trac
t Ill
ustr
atio
n
7. O
ther
impo
rtan
t inf
orm
atio
n to
fac
ilit
ate
bett
er u
nder
stan
ding
of
the
com
pany
’s c
orpo
rate
soc
ial r
espo
nsib
ilit
y pr
acti
ces:
The
Com
pany
act
ivel
y pa
rtic
ipat
ed in
soc
ial e
nvir
onm
enta
l wel
fare
act
ivit
ies,
took
the
init
iati
ve to
par
tici
pate
in th
e fi
re a
nd e
nvir
onm
enta
l pr
otec
tion
act
ivit
ies
orga
nize
d by
the
com
pete
nt a
utho
riti
es, s
uch
as a
ssis
ting
119
to e
xpan
d fi
re p
reve
ntio
n, p
ubli
c to
ilet
s an
d be
ach
adop
tion
, pa
rtic
ipat
e in
env
iron
men
tal p
rote
ctio
n an
d be
ach
clea
nsin
g, e
ncou
ragi
ng e
mpl
oyee
s to
ent
er th
e co
mm
unit
y to
cle
an th
e st
reet
, hel
ping
cha
rity
cl
ean
the
envi
ronm
ent,
Env
iron
men
tal E
duca
tion
to th
e pa
rtia
l tow
nshi
p E
lem
enta
ry S
choo
l, do
nati
on o
f m
ater
ials
, blo
od d
onat
ion,
long
-ter
m
adop
tion
of
Tain
an S
cien
ce P
ark
Gre
enla
nd a
nd H
sinc
hu S
cien
ce P
ark
spor
ts p
ark
and
air
qual
ity
puri
fica
tion
are
a to
dem
onst
rate
the
dete
rmin
atio
n of
wor
king
saf
ety
and
envi
ronm
enta
l pro
tect
ion,
and
won
the
awar
ds f
rom
rel
evan
t aut
hori
ties
. 1.
Six
con
secu
tive
yea
rs f
rom
201
4 to
201
9 th
e C
ompa
ny w
as a
war
ded
"Exc
elle
nt O
rgan
izat
ion
of A
dopt
ion
of A
ir Q
uali
ty O
urif
icat
ion
Are
a" b
y th
e E
nvir
onm
enta
l Pro
tect
ion
Age
ncy.
2.
Fou
r co
nsec
utiv
e ye
ars
from
201
6 to
201
9 th
e C
ompa
ny p
asse
d th
e ex
amin
atio
n of
Env
iron
men
tal P
rote
ctio
n A
dmin
istr
atio
n an
d w
as r
ewar
ded
25th
to 2
7th
RO
C E
nter
pris
e E
nvir
onm
enta
l Pro
tect
ion
Aw
ard
and
the
1th N
atio
nal E
nter
pris
e E
nvir
onm
enta
l Pro
tect
ion
Aw
ard.
. 3.
In
2016
and
201
8~20
19, t
he C
ompa
ny w
as a
war
ded
the
"Wor
kpla
ce S
afet
y an
d H
ealt
h E
xcel
lent
Uni
t Saf
ety
Mod
el"
by th
e S
outh
ern
Tain
an
Sci
ence
Par
k B
erea
u.
4. I
n 20
17-2
019,
the
Com
pany
was
aw
arde
d th
e "E
nvir
onm
enta
l Pro
tect
ion
Exc
elle
nce
Pro
ject
" by
the
Sou
ther
n Ta
inan
Sci
ence
Par
k B
erea
u.
5. I
n 20
17-2
019,
the
Com
pany
was
aw
arde
d th
e “E
xcel
lent
Gre
en P
urch
asin
g E
nter
pris
e” b
y Ta
inan
Cit
y an
d H
sinc
hu C
ount
y E
nvir
onm
enta
l P
rote
ctio
n B
urea
u.
6. I
n 20
17-2
019,
the
Com
pany
was
aw
arde
d th
e "H
igh-
Qua
lity
Uni
t for
Roa
d R
ecog
nitio
n" b
y th
e H
sinc
hu C
ount
y E
nvir
onm
enta
l Pro
tect
ion
Bur
eau.
47

(VI)
Im
plem
enta
tion
of
Eth
ical
Cor
pora
te M
anag
emen
t an
d D
evia
tion
s fr
om “
Eth
ical
Cor
pora
te M
anag
emen
t B
est
Pra
ctic
e P
rinc
iple
s fo
r
TW
SE
/GT
SM
Lis
ted
Com
pani
es”
and
Rea
sons
:
Eva
luat
ion
Item
Impl
emen
tati
on S
tatu
s D
evia
tion
s fr
om th
e E
thic
al
Cor
pora
te M
anag
emen
t B
est-
Pra
ctic
e P
rinc
iple
s fo
r T
WS
E/T
PE
x L
iste
d C
ompa
nies
and
Rea
sons
Yes
No
Abs
trac
t Ill
ustr
atio
n
1.E
stab
lish
men
t of
ethi
cal c
orpo
rate
man
agem
ent p
olic
ies
and
prog
ram
s(1
) D
oes
the
com
pany
est
abli
sh a
n et
hica
l cor
pora
tem
anag
emen
t pol
icy
appr
oved
by
the
boar
d of
di
rect
ors,
and
dec
lare
its
ethi
cal c
orpo
rate
m
anag
emen
t pol
icie
s an
d pr
oced
ures
in it
s gu
idel
ines
an
d ex
tern
al d
ocum
ents
, as
wel
l as
the
com
mit
men
t fr
om it
s bo
ard
and
seni
or m
anag
emen
t to
impl
emen
t th
e po
lici
es?
(2)
Doe
s th
e co
mpa
ny e
stab
lish
mec
hani
sms
for
asse
ssin
g th
e ri
sk o
f un
ethi
cal c
ondu
ct, p
erio
dica
lly
anal
yze
and
asse
ss o
pera
ting
act
ivit
ies
wit
hin
the
scop
e of
bus
ines
s w
ith
rela
tive
ly h
igh
rish
of
unet
hica
l con
duct
, and
for
mul
ate
an u
neth
ical
co
nduc
t pre
vent
ion
plan
on
this
bas
is, w
hich
at l
east
in
clud
es p
reve
ntiv
e m
easu
res
for
cond
uct s
peci
fied
in
Art
icle
7, P
arag
rahp
2 o
f th
e E
thic
al C
orpo
rate
M
anag
emen
t Bes
t Pra
ctic
e P
rinc
iple
s fo
r T
WS
E/G
TS
M L
iste
d C
ompa
nies
?
(3)
Doe
s th
e co
mpa
ny s
peci
fy o
pera
ting
pro
cedu
res,
gu
idel
ines
for
con
duct
, pun
ishm
ents
for
vio
lati
on,
rule
s of
app
eal i
n th
e un
ethi
cal c
ondu
ct p
reve
ntio
n
V
V
V
(1)
The
Com
pany
has
est
abli
shed
“P
roce
dure
s fo
r E
thic
al M
anag
emen
t and
Gui
deli
nes
for
Con
duct
” an
d as
ked
the
Boa
rd o
f D
irec
tors
, the
m
anag
emen
t, an
d al
l the
em
ploy
ees
to c
ompl
y w
ith
it. T
he C
ompa
ny a
lso
disc
lose
d af
orem
enti
oned
on
the
Com
pany
's w
ebsi
te.
(2)
The
Com
pany
has
take
n ap
prop
riat
e pr
ecau
tion
ary
mea
sure
s ag
ains
t the
bus
ines
s ac
tivi
ties
wit
h th
e ri
sk o
f ba
d fa
ith.
(3)
The
Com
pany
has
est
abli
shed
“P
roce
dure
s fo
r E
thic
al M
anag
emen
t and
Gui
deli
nes
for
Con
duct
”, “
Whi
stle
Blo
wer
Pol
icy”
and
Non
e of
dev
iati
on
Non
e of
dev
iati
on
Non
e of
dev
iati
on
48

Eva
luat
ion
Item
Impl
emen
tati
on S
tatu
s D
evia
tion
s fr
om th
e E
thic
al
Cor
pora
te M
anag
emen
t B
est-
Pra
ctic
e P
rinc
iple
s fo
r T
WS
E/T
PE
x L
iste
d C
ompa
nies
and
Rea
sons
Yes
No
Abs
trac
t Ill
ustr
atio
n
plan
, and
doe
s it
impl
emen
t and
per
iodi
call
y re
view
an
d re
vise
the
plan
? “R
egul
atio
ns G
over
ning
Pro
fess
iona
l Mor
al
Con
dut”
and
ask
ed th
e B
oard
of
Dir
ecto
rs, t
he
man
agem
ent,
and
all t
he e
mpl
oyee
s to
com
ply
wit
h th
e fo
rego
ing
regu
lati
ons.
2.
Impl
emen
tati
on o
f et
hica
l cor
pora
te m
anag
emen
t(1
) D
oes
the
com
pany
eva
luat
e bu
sine
ss p
artn
ers’
eth
ical
reco
rds
and
incl
ude
ethi
cs-r
elat
ed c
laus
es in
bus
ines
s co
ntra
cts?
(2)
Doe
s th
e co
mpa
ny e
stab
lish
a d
edic
ated
uni
t und
er
the
boar
d of
dir
ecto
rs to
pro
mot
e et
hica
l cor
pora
te
man
agem
ent,
and
peri
odic
ally
(at
leas
t onc
e a
year
) re
port
to th
e bo
ard
of d
irec
tors
and
sup
ervi
se th
e im
plem
enta
tion
of
the
ethi
cal m
anag
emen
t pol
icy
and
unet
hica
l con
duct
pre
vent
ion
plan
?
(3)
Doe
s th
e co
mpa
ny e
stab
lish
pol
icie
s to
pre
vent
co
nfli
cts
of in
tere
st a
nd p
rovi
de a
ppro
pria
te
com
mun
icat
ion
chan
nels
, and
impl
emen
t it?
V V V
(1)
The
Com
pany
has
ass
esse
d th
e in
tegr
ity
reco
rds
of c
ount
erpa
rtie
s an
d in
clud
ed th
e te
rms
of
inte
grit
y co
nduc
t in
the
cont
ract
s w
ith
them
.
(2)
The
Com
pany
's A
udit
Off
ice
was
res
pons
ible
fo
r pr
omot
ing
corp
orat
e in
tegr
ity
and
regu
larl
y re
port
ed it
s im
plem
enta
tion
sta
tus
to th
e A
udit
C
omm
itte
e an
d th
e B
oard
of
Dir
ecto
rs.
(3)
The
Com
pany
has
est
abli
shed
“P
roce
dure
s fo
r E
thic
al M
anag
emen
t and
Gui
deli
nes
for
Con
duct
” an
d “R
egul
atio
ns G
over
ning
P
rofe
ssio
nal M
oral
Con
duct
” an
d as
ked
that
if
in th
e co
urse
of
cond
ucti
ng c
ompa
ny b
usin
ess,
an
y pe
rson
nel o
f th
is C
orpo
rati
on d
isco
vers
that
a
pote
ntia
l con
flic
t of
inte
rest
exi
sts
invo
lvin
g th
emse
lves
or
the
juri
stic
per
son
that
they
re
pres
ent,
or th
at th
ey o
r th
eir
spou
se, p
aren
ts,
chil
dren
, or
a pe
rson
wit
h w
hom
they
hav
e a
Non
e of
dev
iati
on
Non
e of
dev
iati
on
Non
e of
dev
iati
on
49

Eva
luat
ion
Item
Impl
emen
tati
on S
tatu
s D
evia
tion
s fr
om th
e E
thic
al
Cor
pora
te M
anag
emen
t B
est-
Pra
ctic
e P
rinc
iple
s fo
r T
WS
E/T
PE
x L
iste
d C
ompa
nies
and
Rea
sons
Yes
No
Abs
trac
t Ill
ustr
atio
n
(4)
Doe
s th
e co
mpa
ny h
ave
effe
ctiv
e ac
coun
ting
sys
tem
an
d in
tern
al c
ontr
ol s
yste
ms
set u
p to
fac
ilit
ate
ethi
cal
corp
orat
e m
anag
emen
t, do
es th
e in
tern
al a
udit
ing
unit
fo
rmul
ate
audi
t pla
ns b
ased
on
unet
hica
l con
duct
ris
k as
sess
men
t res
ults
, and
doe
s it
aud
it c
ompl
ianc
e w
ith
the
unet
hica
l con
duct
pre
vent
ion
plan
or
com
mis
sion
a
CPA
to p
erfo
rm th
e au
dit?
(5)
Doe
s th
e co
mpa
ny r
egul
arly
hol
d in
tern
al a
nd
exte
rnal
edu
cati
onal
trai
ning
s on
eth
ical
cor
pora
te
man
agem
ent?
V V
rela
tion
ship
of
inte
rest
is li
kely
to o
btai
n im
prop
er b
enef
its,
the
pers
onne
l sha
ll r
epor
t the
re
leva
nt m
atte
rs to
bot
h hi
s or
her
imm
edia
te
supe
rvis
or a
nd th
e L
egal
Off
ice,
and
the
imm
edia
te s
uper
viso
r sh
all p
rovi
de th
e pe
rson
nel w
ith
prop
er in
stru
ctio
ns.
(4)
The
Com
pany
has
est
abli
shed
an
effe
ctiv
e ac
coun
ting
sys
tem
and
inte
rnal
con
trol
sys
tem
, an
d w
as r
egul
arly
che
cked
by
Aud
it O
ffic
e.
And
the
CPA
con
duct
s an
aud
it o
f in
tern
al
cont
rol i
n ac
cord
ance
wit
h th
e “S
OX
404
Act
”,
whi
ch in
clud
es th
e fi
ve e
lem
ents
of
CO
SO
.
(5)
In 2
019,
the
com
pany
to c
olle
ague
s 3
tim
es
awar
enes
s se
ssio
ns o
f et
hics
cod
e vi
a co
mpa
ny
emai
l and
hel
d in
tern
al tr
aini
ngs
of e
thic
al
cond
uct,
incl
udin
g th
e un
ethi
cal c
ondu
ct
prev
enti
on, i
nsid
er tr
adin
g, a
nd in
tern
al c
ontr
ol
etc.
and
the
num
ber
of p
arti
cipa
nts
and
tota
l ho
urs
ther
e w
ere
3,63
3 pe
rson
and
2,4
22 h
ours
, re
spec
tive
ly.
Non
e of
dev
iati
on
Non
e of
dev
iati
on
50
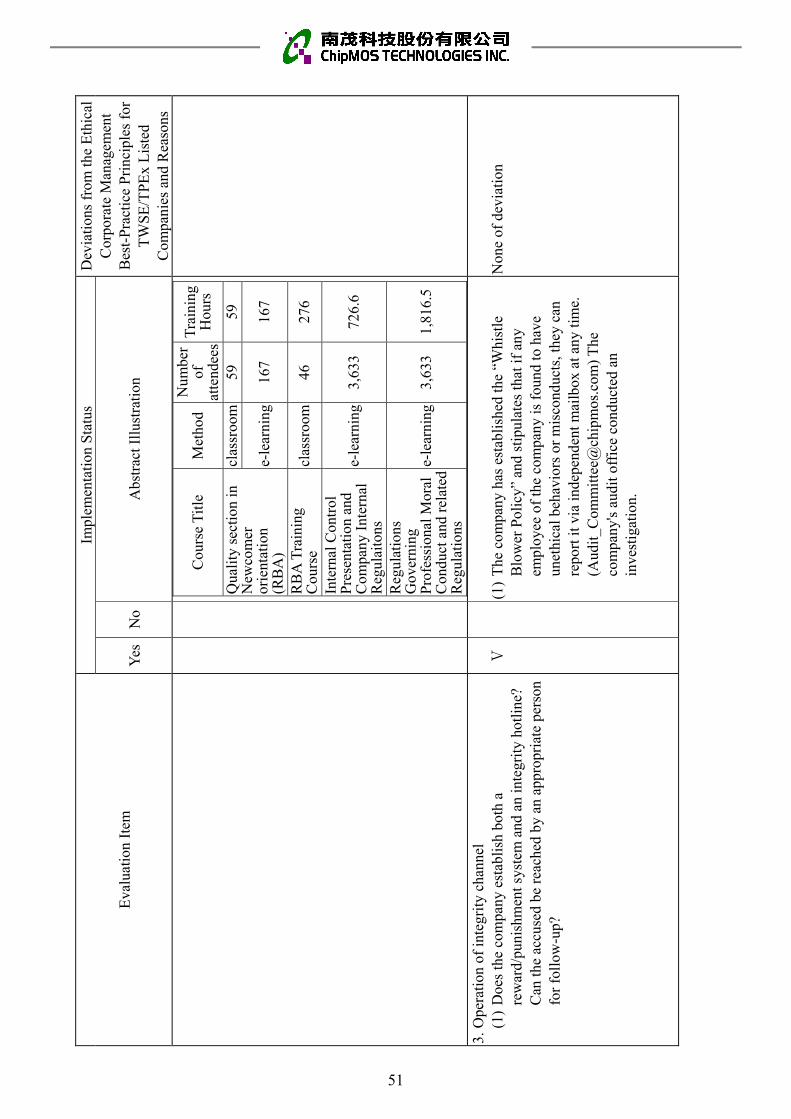
Eva
luat
ion
Item
Impl
emen
tati
on S
tatu
s D
evia
tion
s fr
om th
e E
thic
al
Cor
pora
te M
anag
emen
t B
est-
Pra
ctic
e P
rinc
iple
s fo
r T
WS
E/T
PE
x L
iste
d C
ompa
nies
and
Rea
sons
Yes
No
Abs
trac
t Ill
ustr
atio
n
Cou
rse
Tit
le
Met
hod
Num
ber
of
atte
ndee
s
Tra
inin
g H
ours
Qua
lity
sec
tion
in
New
com
er
orie
ntat
ion
(RB
A)
clas
sroo
m59
59
e-le
arni
ng16
7 16
7
RB
A T
rain
ing
Cou
rse
clas
sroo
m46
27
6
Inte
rnal
Con
trol
P
rese
ntat
ion
and
Com
pany
Int
erna
l R
egul
aito
ns
e-le
arni
ng3,
633
726.
6
Reg
ulat
ions
G
over
ning
P
rofe
ssio
nal M
oral
C
ondu
ct a
nd r
elat
ed
Reg
ulat
ions
e-le
arni
ng3,
633
1,81
6.5
3.O
pera
tion
of
inte
grit
y ch
anne
l(1
) D
oes
the
com
pany
est
abli
sh b
oth
are
war
d/pu
nish
men
t sys
tem
and
an
inte
grit
y ho
tlin
e?
Can
the
accu
sed
be r
each
ed b
y an
app
ropr
iate
per
son
for
foll
ow-u
p?
V(1
) T
he c
ompa
ny h
as e
stab
lish
ed th
e “W
hist
le
Blo
wer
Pol
icy”
and
sti
pula
tes
that
if a
ny
empl
oyee
of
the
com
pany
is f
ound
to h
ave
unet
hica
l beh
avio
rs o
r m
isco
nduc
ts, t
hey
can
repo
rt it
via
inde
pend
ent m
ailb
ox a
t any
tim
e.
(Aud
it_C
omm
itte
e@ch
ipm
os.c
om)
The
co
mpa
ny's
aud
it o
ffic
e co
nduc
ted
an
inve
stig
atio
n.
Non
e of
dev
iati
on
51

Eva
luat
ion
Item
Impl
emen
tati
on S
tatu
s D
evia
tion
s fr
om th
e E
thic
al
Cor
pora
te M
anag
emen
t B
est-
Pra
ctic
e P
rinc
iple
s fo
r T
WS
E/T
PE
x L
iste
d C
ompa
nies
and
Rea
sons
Yes
No
Abs
trac
t Ill
ustr
atio
n
(2)
Doe
s th
e co
mpa
ny e
stab
lish
sta
ndar
d op
erat
ing
proc
edur
es f
or c
onfi
dent
ial r
epor
ting
on
inve
stig
atin
g ac
cusa
tion
cas
es?
(3)
Doe
s th
e co
mpa
ny p
rovi
de p
rope
r w
hist
lebl
ower
pr
otec
tion
?
V V
(2)
The
com
pany
has
est
abli
shed
the
“Whi
stle
B
low
er P
olic
y” a
nd w
hen
the
com
pany
rec
eive
s re
port
s on
une
thic
al b
ehav
iors
or
mis
cond
ucts
an
d su
bseq
uent
inve
stig
atio
ns, t
he r
egar
ds th
em
as n
on-d
iscl
osur
e an
d co
nfid
enti
alit
y.
(3)
The
com
pany
has
est
abli
shed
the
"Whi
stle
B
low
er P
olic
y" a
nd s
tipu
late
s th
at n
o ad
vers
e pu
nish
men
t or
any
form
of
reta
liat
ion
may
be
take
n ag
ains
t the
rep
orte
r.
Non
e of
dev
iati
on
Non
e of
dev
iati
on
4.S
tren
gthe
ning
info
rmat
ion
disc
losu
reD
oes
the
com
pany
dis
clos
e it
s et
hica
l cor
pora
te
man
agem
ent p
olic
ies
and
the
resu
lts
of it
sim
plem
enta
tion
on
the
com
pany
’s w
ebsi
te a
nd th
eM
arke
t Obs
erva
tion
Pos
t Sys
tem
?
VT
he c
ompa
ny h
as p
lace
d re
leva
nt r
egul
atio
ns o
n in
tegr
ity
man
agem
ent o
n th
e co
mpa
ny's
inte
rnal
w
ebsi
te f
or c
olle
ague
s to
inqu
ire
at a
ny ti
me;
the
com
pany
's e
xter
nal w
ebsi
te a
nd M
arke
t Obs
erva
tion
P
ost S
yste
m d
iscl
ose
the
its
ethi
cal c
orpo
rate
m
anag
emen
t pol
icie
s an
d it
s im
plem
enta
tion
res
ults
.Non
e of
dev
iati
on
5.If
the
com
pany
has
est
abli
shed
the
ethi
cal c
orpo
rate
man
agem
ent p
olic
ies
base
d on
the
"Eth
ical
Cor
pora
te M
anag
emen
t Bes
t Pra
ctic
e P
rinc
iple
s fo
rT
WS
E/T
PE
x L
iste
d C
ompa
nies
," p
leas
e de
scri
be a
ny d
iscr
epan
cy b
etw
een
the
poli
cies
and
thei
r im
plem
enta
tion:
The
Com
pany
has
est
abli
shed
the
ethi
cal c
orpo
rate
man
agem
ent p
olic
ies
and
disc
lose
d re
leva
nt in
form
atio
n on
the
Mar
ket O
bser
vati
on P
ost S
yste
m.
6.O
ther
impo
rtan
t inf
orm
atio
n to
fac
ilit
ate
a be
tter
und
erst
andi
ng o
f th
e co
mpa
ny's
eth
ical
cor
pora
te m
anag
emen
t pol
icie
s: (
e.g.
, rev
iew
and
am
end
its
poli
cies
)T
he C
ompa
ny h
as e
stab
lish
ed e
thic
al c
orpo
rate
man
agem
ent p
olic
ies
and
regu
larl
y re
view
ed it
.
(VII
) If
the
Com
pany
has
est
abli
shed
Cor
pora
te G
over
nanc
e P
rinc
iple
s an
d R
elat
ed G
uide
line
s, D
iscl
ose
the
Mea
ns o
f A
cces
sing
thi
s
Info
rmat
ion:
The
C
ompa
ny d
iscl
osed
rel
evan
t inf
orm
atio
n on
Mar
ket O
bser
vati
on P
ost S
yste
m.
(VII
I) T
he C
ompa
ny s
hall
disc
lose
oth
er s
igni
fica
nt in
form
atio
n w
hich
may
impr
ove
the
unde
rsta
ndin
g of
cor
pora
te g
over
nanc
e an
d op
erat
ion:
Non
e.
52

(IX) Internal Control System Execution Status
1. Statement on Internal Control
ChipMOS TECHNOLOGIES INC. Internal Control System Statement
Date: March 10, 2020
Based on the findings of a self-assessment, ChipMOS TECHNOLOGIES INC. states the following with regard to its internal control system during the year 2019:
I. The Company acknowledges and understands that the establishment, enforcement and maintenance of the internal
control system are the responsibility of the Board of Directors and management, and that the Company has
already established such a system. The purpose is to provide reasonable assurance to the effectiveness and
efficiency of business operations (including profitability, performance and security of assets), the reliability,
timeliness, transparency, and regulatory compliance of reporting, and compliance with applicable laws,
regulations, and bylaws .
II. Internal control regulations possess inherent shortcomings. Regardless of its design, an effective internal control
system can only provide reasonable assurance of the three objectives as mentioned above. Furthermore, its
effectiveness may change due to changes in the Company's environment and circumstances. However,
self-supervision measures were implemented within the Company’s internal control policies to facilitate
immediate rectification once procedural flaws have been identified.
III. The Company evaluates the design and operating effectiveness of its internal control system based on the criteria
provided in the Regulations Governing the Establishment of Internal Control Systems by Public Companies
(herein below, the “Regulations”). The criteria adopted by the Regulations identify five key components of
managerial internal control: 1. Control Environment, 2. Risk Assessment, 3. Control Activities, 4. Information
and Communication, and 5. Monitoring Activities. Each of the elements in turn contains several items. Please
refer to " Regulations" for details.
IV. The Company has evaluated the design and operating effectiveness of its internal control system according to the
aforesaid Regulations.
V. Based on the findings of such evaluation, the Company believes that, on December 31, 2019, it has maintained, in
all material respects, an effective internal control systemit (that includes the supervision and management of our
subsidiaries), to provide reasonable assurance on our operational effectiveness and efficiency, reliability,
timeliness, transparency, and regulatory compliance of reporting, and compliance with applicable laws,
regulations, and bylaws.
VI. This statement shall be an integral part of the annual report and prospectus of the Company and will be made
public. If any fraudulent information, concealment or unlawful practices are discovered in the content of the
aforementioned information, the Company shall be held liable under Article 20, 32, 171 and 174 of the Securities
and Exchange Act.
VII. This statement was approved by the Board of Directors on March 10, 2020 in the presence of 9 directors, who
concurred unanimously.
ChipMOS TECHNOLOGIES INC.
Chairman and President: Shih-Jye Cheng
53

2. If the Company engages CPAs to examine its internal control system, it shall disclose
the CPA examination report: Not applicable.
(X) If there has been any legal penalty against the company or its internal personnel, or any
disciplinary penalty by the company against its internal personnel for violation of the
internal control system, during the most recent fiscal year or during the current fiscal year
up to the publication date of the annual report, where the result of such penalty could have
a material effect on shareholder equity or securities prices, the annual report shall disclose
the penalty, the main shortcomings, and condition of improvement.: None.
(XI) Important Resolutions Adopted in Shareholders Meeting and Board of Directors' Meeting
in the Most Recent Year and Up to the Date of Publication of the Annual Report
1. The major resolutions approved by the 24th meeting of the 8th Board of Directors
(March 7, 2019) are as follows:
(1) The Company's business report and financial statements of fiscal year 2018
(2) Earnings distribution plan for fiscal year 2018.
(3) Capital reduction in connection with the cancellation of redeemed issued restricted
employee shares.
(4) Capital reduction in connection with the cancellation of treasury shares.
(5) Amendments to Procedures for Acquisition or Disposal of Assets
(6) Amendments to Articles of Incorporation
(7) Amendments to Procedure for Election of Director and Independent Director
(8) Election of the 9th Board of Directors (including independent directors) at the 2019
annual shareholders' meeting.
(9) Nomination of independent director candidates for election at the 2019 annual
shareholders' meeting
(10) Release the Prohibition on New Directors from Participation in Competitive
Business under Article 209 of the Company Act.
(11) Matters related to the 2019 annual shareholders' meeting
(12) The time and place to submit shareholder's proposals and to nominate independent
director candidates for the 2019 annual shareholders' meeting
2. The major resolutions approved by the 25th meeting of the 8th Board of Directors (April
2, 2019) are as follows:
(1) Amendments to Company's Operational Procedures for Lending Funds to Other
Parties
(2) Amendments to Company's Operational Procedures for Endorsements and
Guarantees
(3) Matters for Discussion related to the 2019 annual shareholders' meeting. Additional
items
(4) Disposal of shares of JMC to reduce the shareholding of equity investment
54

3. The major resolutions approved by the 26th meeting of the 8th Board of Directors
(April 25, 2019) are as follows:
(1) The Company's 2018 Annual Report Form 20-F (including the English 2018
consolidated financial statements prepared by the Company in accordance with the
International Financial Reporting Standards).
(2) Appointment and discharge of R&D Officer
4. The major resolutions approved by the 27th meeting of the 8th Board of Directors (May
7, 2019) are as follows:
(1) The Company's consolidated financial statements of Q1, 2019.
5. The major resolutions approved by the 1st meeting of the 9th Board of Directors (June
10, 2019) are as follows:
(1) Election of Chairman
(2) Appointment of the 4th Remuneration committee
6. The major resolutions approved by the 2nd meeting of the 9th Board of Directors (June
27, 2019) are as follows:
(1) Determination of the record date for ex-dividend
(2) Appointment and discharge of Internal Audit Officer
7. The major resolutions approved by the 3rd meeting of the 9th Board of Directors
(August 6, 2019) are as follows:
(1) The Company's consolidated financial statements of Q2, 2019
(2) Capital reduction in connection with the cancellation of redeemed issued restricted
employee shares
(3) Capital reduction in connection with the cancellation of treasury shares
(4) Capital reduction in connection with the cancellation of dissenting shareholders
shares
8. The major resolutions approved by the 4th meeting of the 9th Board of Directors
(November 6, 2019) are as follows:
(1) The Company's consolidated financial statements of Q3, 2019
(2) Financing plan for Action Plan for Welcoming Overseas Taiwanese Businesses to
Return to Invest in Taiwan
9. The major resolutions approved by the 5th meeting of the 9th Board of Directors
(March 10, 2020) are as follows:
(1) The Company’s business report and financial statements of fiscal year 2019.
(2) Earnings distribution plan for fiscal year 2019
(3) Amendments to Articles of Incorporation
(4) Amendments to Rules of Procedure for Shareholders Meetings
(5) Amendments to Procedure for Election of Directors and Independent Directors
(6) Release the Prohibition on Directors from Participation in Competitive Business
under Article 209 of the Company Act..
55

(7) Matters related to the 2020 annual shareholders' meeting
(8) The time and place to submit shareholder's proposals and to nominate independent
director candidates for the 2020 annual shareholders' meeting.
10. The major resolutions approved by the 6th meeting of the 9th Board of Directors
(April 23, 2020) are as follows:
(1) The Company's 2019 Annual Report Form 20-F (including the English 2019
consolidated financial statements prepared by the Company in accordance with
the International Financial Reporting Standards).
(2) Matters related to the 2020 annual shareholders' meeting (additional item)
(3) To authorize the chairman to change the venue of 2020 annual shareholders'
meeting
11. The major resolutions adopted by the 2019 annual shareholders' meeting (June 10,
2019):
(I) Matters for Ratification
(1) Adoption of the financial statements for fiscal year 2018.
(2) Adoption of the earnings distribution plan for fiscal year 2018.
The Company has completed the distribution of earnings on August 30, 2019.
(II) Matters for Discussion
(1) Amendments to Articles of Incorporation
(2) Amendments to the Rules for Election of Directors and Independent Directors.
(3) Amendments to the Operational Procedures for the Acquisition or Disposal of
Assets
(4) Amendments to the Operational Procedures for Lending Funds to Other
Parties
(5) Amendments to the Operational Procedures for Endorsements and Guarantees.
(III) Elections
(1) To elect nine directors(including independent directors) of the 9th Board of Directors.
(VI) Other Proposals
(1) Release the Prohibition on the 9th Board of Directors from Participation in
Competitive Business under Article 209 of the Company Act.
(XII) Major Issues of Record or Written Statements Made by Any Director or Supervisor
Dissenting to Important Resolutions Passed by the Board of Directors: None.
(XIII) Resignation or Dismissal of the Company’s Key Individuals, Including the Chairman,
President, and Officers of Accounting, Finance, Internal Audit and R&D: Officer Name Date appointed Date
Resignation or Dismissal Reason
R&D officer Jesse Huang January 1,2018 April 25, 2019 Change in duties
Internal Audit officer Chi-Pei Cho July 1,2013 July 12, 2019 Resignation
56

V. Information Regarding Audit Fee
(I) Audit Fee
Accounting Firm Name of CPA Period Covered by
CPA’s Audit Remarks
PricewaterhouseCoopers,
Taiwan
Chun-Yuan
Hsiao
Chih-Cheng
Hsieh
January 1, 2019 ~
December 31, 2019
Unit: NT$ thousands
Fee category
Scale Audit Fee Non-audit Fee Total
1 Under 2,000 V 1,500
2 2,000(included) ~ 4,000(not included)
3 4,000(included) ~ 6,000(not included)
4 6,000(included) ~ 8,000(not included)
5 8,000(included) ~ 10,000(not included)
6 10,000 or above V 18,000
Unit: NT$ thousands
Accounting Firm Name of
CPA Audit fee
Non-audit fee Period Covered by
CPA’s Audit RemarksSystem
Design Company
RegistrationHuman
ResourceOthers Subtotal
PricewaterhouseCoopers, Taiwan
Chun-Yuan Hsiao
18,000 - - - 1,500
(Note 1)1,500
January 1, 2019 ~December 31, 2019Chih-Cheng
Hsieh Note 1: The non-audit fee is for the service: application for tax credits for research and development expenditure, costed for
NT$1,500 thousand.
(II) When the company changes its accounting firm and the audit fees paid for the year in which
such change took place are lower than those for the preceding year, the amounts of the audit
fees before and after the change and the reasons shall be disclosed: None.
(III) When the audit fees paid for the current fiscal year are lower than those for the preceding
fiscal year by 10% or more, the reduction in the amount of audit fees, reduction percentage,
and reason(s) therefor shall be disclosed: None.
VI. Replacement of CPA: Not applicable.
VII. Where the Company's Chairman, President, or any manager in charge of finance or
accounting matters has held a position at the accounting firm of its CPA or at an affiliated
enterprise of such accounting firm in the most recent year, the name and position of the
person, and the period during which the position was held, shall be disclosed. The term
"affiliated enterprise of a CPA's accounting firm" means one in which the CPA at the
accounting firm holds more than 50% of the shares, or of which such CPA holds more than
half of the directorships, or a company or institution listed as an affiliated enterprise in the
external publications or printed materials of the accounting firm of the CPA: None.
57
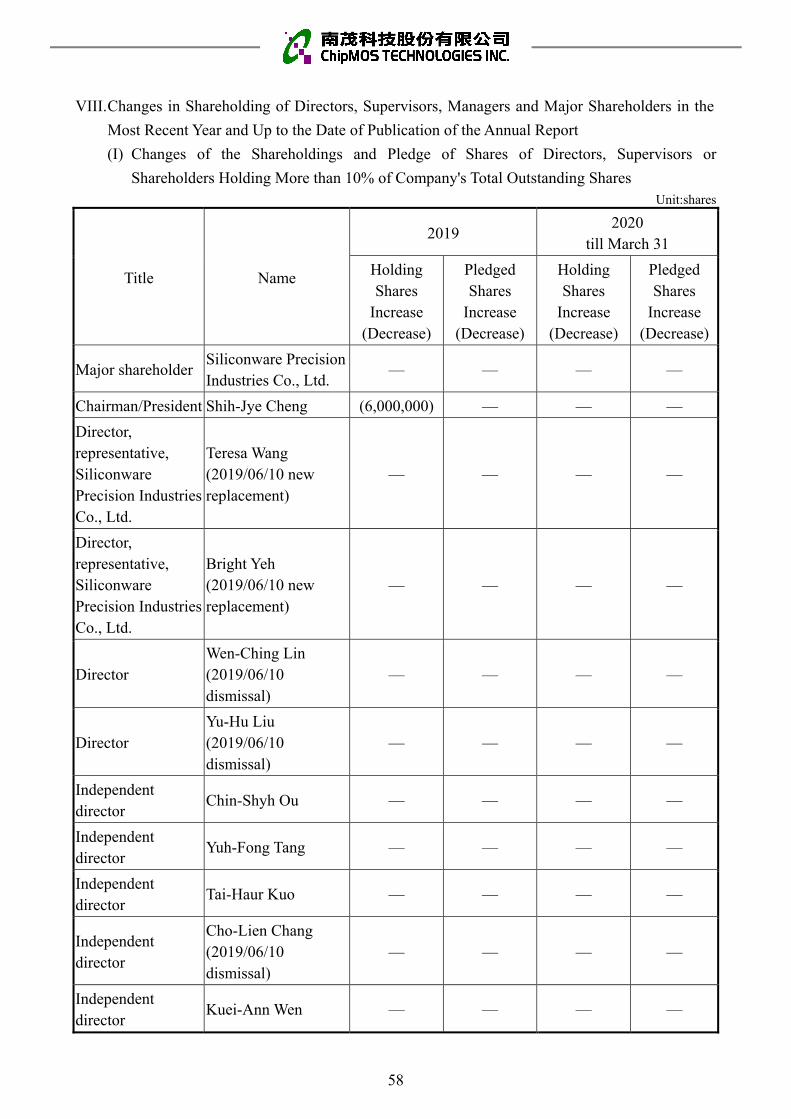
VIII. Changes in Shareholding of Directors, Supervisors, Managers and Major Shareholders in the
Most Recent Year and Up to the Date of Publication of the Annual Report
(I) Changes of the Shareholdings and Pledge of Shares of Directors, Supervisors or
Shareholders Holding More than 10% of Company's Total Outstanding Shares Unit:shares
Title Name
2019 2020
till March 31
Holding Shares
Increase (Decrease)
Pledged Shares
Increase (Decrease)
Holding Shares
Increase (Decrease)
Pledged Shares
Increase (Decrease)
Major shareholder Siliconware Precision Industries Co., Ltd.
— — — —
Chairman/President Shih-Jye Cheng (6,000,000) — — —
Director, representative, Siliconware Precision Industries Co., Ltd.
Teresa Wang (2019/06/10 new replacement)
— — — —
Director, representative, Siliconware Precision Industries Co., Ltd.
Bright Yeh (2019/06/10 new replacement)
— — — —
Director Wen-Ching Lin (2019/06/10 dismissal)
— — — —
Director Yu-Hu Liu (2019/06/10 dismissal)
— — — —
Independent director
Chin-Shyh Ou — — — —
Independent director
Yuh-Fong Tang — — — —
Independent director
Tai-Haur Kuo — — — —
Independent director
Cho-Lien Chang (2019/06/10 dismissal)
— — — —
Independent director
Kuei-Ann Wen — — — —
58

Title Name
2019 2020
till March 31
Holding Shares
Increase (Decrease)
Pledged Shares
Increase (Decrease)
Holding Shares
Increase (Decrease)
Pledged Shares
Increase (Decrease)
Independent director
Jing-Shan Aur (2019/06/10 new replacement)
— — — —
Director, Senior Executive Vice President & Chief Operating Officer
Lafair Cho (2019/06/10 new replacement Director)
— — — —
Vice President Wu-Hung Hsu — — — —
Vice President Yuan-Feng Hsu — — — —
Vice President Jesse Huang — — — —
Vice President Silvia Su — — — —
Vice President Yu-Ying Chen — — — —
Vice President Teng-Yueh Tsai (32,000) — — —
Vice President Chen-Fang Huang (25,000) — — —
Vice President Ming-Cheng Lin — — — —
Vice President Chang-Lung Li — — — —
Vice President Jin-Long Fang (15,000) — — —
Senior Director Chao-Tung So — — — —
Senior Director JB Chyi (2019/04/25 new replacement)
— — — —
Senior Manager Chi-Pei Cho (2019/07/12 resignation)
— — — —
Manager Ling Cheng (2019/07/12 new replacement)
— — 2,000 —
(II) Shares Trading with Related Parties:
Title Name Shares(Increase) Shares(Decrease)
Chairman/President Shih-Jye Cheng 6,000,000
Chairman/President Shareholding by Nominee Arrangement
Hao Hsiang Investment Co. Ltd.
6,000,000
(III) Shares Pledge with Related Parties: None.
59

IX. Information on Top 10 Shareholders of the Company Who are Spouses or Relatives Within
Two Degrees of Kinship to Each Other April 11, 2020(Unit: shares; %)
Name Shareholding
Spouse's / Minor
Children's Shareholding
Shareholdingby Nominee Arrangement
Name and Relationship Between the
Company's Top Ten Shareholders
Remarks
Shares % Shares % Shares % Name Relationship
Siliconware Precision Industries Co., Ltd.
148,910,390 20.48% — — — — None None —
First Bank in Its Capacity as Master Custodian for Custodial Account of ChipMOS’ American Depositary Shares
94,534,754 13.00% — — — — None None —
Citibank (Taiwan) in its capacity as Master Custodian for Investment Account of GIC Pte Ltd. (Singapore)
20,400,313 2.81% — — — — None None —
Fubon Life Insurance Co., Ltd.
13,683,762 1.88% — — — — None None —
Norges Bank. 12,955,840 1.78% — — — — None None —
JPMorgan Chase Bank N.A., Taipei Branch in custody for Vanguard Total International Stock Index Fund, a series of Vanguard Star Funds
11,102,348 1.53% — — — — None None —
Morgan Stanley & Co. International Plc
9,144,979 1.26% — — — — None None —
VANGUARD EMERGING MARKETS STOCK INDEX FUND, A SERIES OF VANGUARD INTERNATIONAL EQUITY INDEX FUNDS
8,330,568 1.15% — — — — None None —
60

Name Shareholding
Spouse's / Minor
Children's Shareholding
Shareholdingby Nominee Arrangement
Name and Relationship Between the
Company's Top Ten Shareholders
Remarks
Shares % Shares % Shares % Name Relationship
Goldman Sachs Funds - Goldman Sachs Emerging Markets CORE(R) Equity Portfolio
6,493,000 0.89% — — — — None None —
Hao Hsiang Investment Co. Ltd.(Note 4)
6,244,777 0.86% — — — — None None —
Note1: The Company shall list all the top ten shareholders as well as shall list the name of legal person shareholders and the name of their representatives respectively.
Note2: The shareholding ratio is calculated respectively in the name of the shareholders, their spouse, minor children or in the name of others.
Note3: The shareholders listed aforesaid, including juridical persons and natural persons, shall be disclosed regarding the relationship between them according to Regulations Governing the Preparation of Financial Reports by Securities Issuers.
Note4: The stockholder is held by chairman/president under the names of other parties.
X. The Combined Shareholding and Ratio of the Company, Directors, Supervisors, Managers and
Enterprises which Directly or Indirectly Controlled by the Company in Each Investee
December 31, 2019 (Unit: shares; %)
Investee
Investment by the Company
(A)
Investments by directors,supervisors, managers and
directly or indirectly controlled enterprises
(B)
Combined investment (A+B)
Shares % Shares % Shares %
ChipMOS U.S.A., Inc. 3,550,000 100.00% - - 3,550,000 100.00%
ChipMOS TECHNOLOGIES (BVI) LTD. 2,407,742,975 100.00% - - 2,407,742,975 100.00%
Unimos Microelectronics (Shanghai) Co., Ltd. - - Note1 46.14% Note1 46.14%
JMC ELECTRONICS CO., LTD. 10,000,000 10.00% - - 10,000,000 10.00%
Shanghai Zuzhu Business Consulting Partnership (Limited Partnership)
- - Note2 9.49% Note2 9.49%
Shanghai Zuzhan Business Consulting Partnership (Limited Partnership)
- - Note2 13.42% Note2 13.42%
Shanghai Zuchen Business Consulting Partnership (Limited Partnership)
- - Note2 11.34% Note2 11.34%
Shanghai Guizao Business Consulting Partnership (Limited Partnership)
- - Note2 11.85% Note2 11.85%
Note1: Limited company, hence does not issue common stock. Note2: Limited partnership, hence does not issue common stock.
61
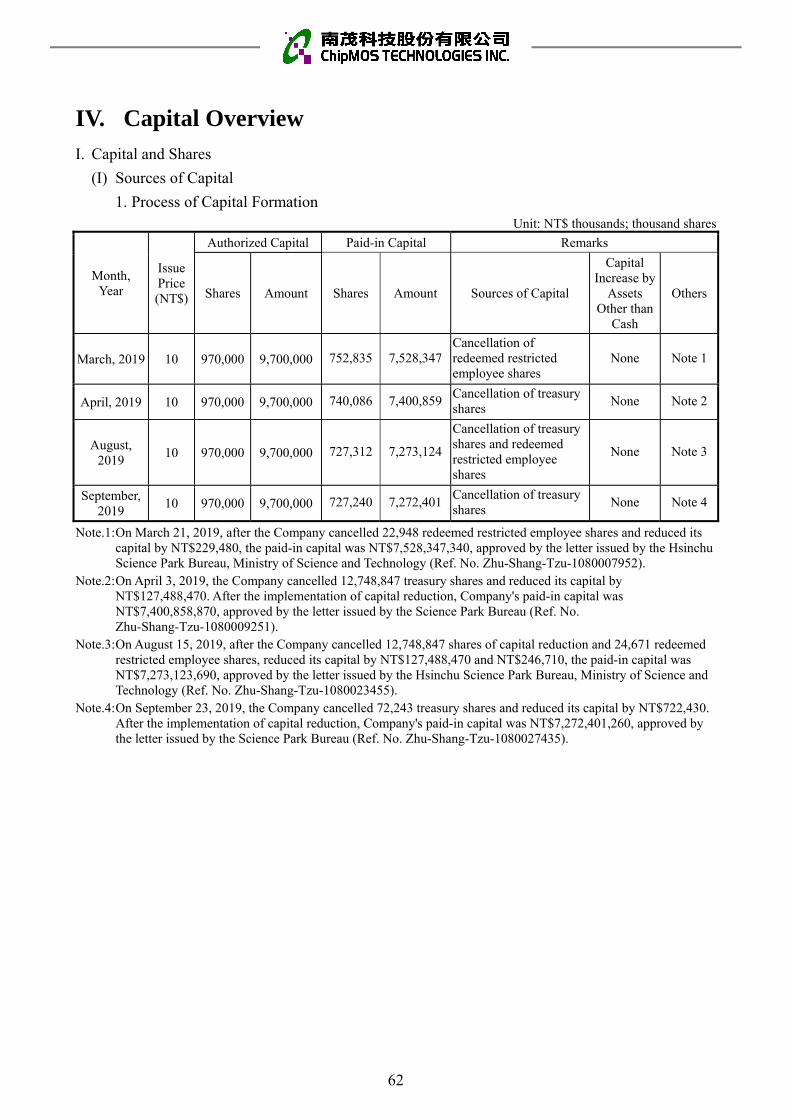
IV. Capital Overview I. Capital and Shares
(I) Sources of Capital
1. Process of Capital Formation Unit: NT$ thousands; thousand shares
Month, Year
Issue Price (NT$)
Authorized Capital Paid-in Capital Remarks
Shares Amount Shares Amount Sources of Capital
Capital Increase by
Assets Other than
Cash
Others
March, 2019 10 970,000 9,700,000 752,835 7,528,347Cancellation of redeemed restricted employee shares
None Note 1
April, 2019 10 970,000 9,700,000 740,086 7,400,859Cancellation of treasury shares
None Note 2
August, 2019
10 970,000 9,700,000 727,312 7,273,124
Cancellation of treasury shares and redeemed restricted employee shares
None Note 3
September, 2019
10 970,000 9,700,000 727,240 7,272,401Cancellation of treasury shares
None Note 4
Note.1: On March 21, 2019, after the Company cancelled 22,948 redeemed restricted employee shares and reduced its capital by NT$229,480, the paid-in capital was NT$7,528,347,340, approved by the letter issued by the Hsinchu Science Park Bureau, Ministry of Science and Technology (Ref. No. Zhu-Shang-Tzu-1080007952).
Note.2: On April 3, 2019, the Company cancelled 12,748,847 treasury shares and reduced its capital by NT$127,488,470. After the implementation of capital reduction, Company's paid-in capital was NT$7,400,858,870, approved by the letter issued by the Science Park Bureau (Ref. No. Zhu-Shang-Tzu-1080009251).
Note.3: On August 15, 2019, after the Company cancelled 12,748,847 shares of capital reduction and 24,671 redeemed restricted employee shares, reduced its capital by NT$127,488,470 and NT$246,710, the paid-in capital was NT$7,273,123,690, approved by the letter issued by the Hsinchu Science Park Bureau, Ministry of Science and Technology (Ref. No. Zhu-Shang-Tzu-1080023455).
Note.4: On September 23, 2019, the Company cancelled 72,243 treasury shares and reduced its capital by NT$722,430. After the implementation of capital reduction, Company's paid-in capital was NT$7,272,401,260, approved by the letter issued by the Science Park Bureau (Ref. No. Zhu-Shang-Tzu-1080027435).
62

2. Type of Stock April 11, 2020 (Unit: shares)
Share Type Authorized Capital
Remark Issued Shares Un-issued Shares Total Shares
Common Shares
727,240,126 242,759,874 970,000,000
Note: The shares are listed on Taiwan Stock Exchange.
(II) Status of Shareholders April 11, 2020 (Unit: persons; shares; %)
Composition ofShareholders
Amount
Government Agencies
FinancialInstitutions
Other JuridicalPersons
Domestic Natural Persons
Foreign Institutions &
Natural Persons
Total
Number of shareholders(persons)
— 19 176 42,781 285 43,261
Shareholding(shares) — 22,086,733 173,444,268 182,704,074 349,005,051 727,240,126
Percentage(%) — 3.04% 23.85% 25.12% 47.99% 100.00%
(III) Distribution of Shareholding
1. Common Shares
April 11, 2020 (Unit: persons; shares; %)
Class of Shareholding (shares) Number of
Shareholders(persons) Shareholding (shares) Percentage (%)
1 ~ 999 17,918 5,208,154 0.72%
1,000 ~ 5,000 18,496 41,057,138 5.65%
5,001 ~ 10,000 3,522 27,720,480 3.81%
10,001 ~ 15,000 940 11,861,873 1.63%
15,001 ~ 20,000 768 14,088,198 1.94%
20,001 ~ 30,000 541 13,885,834 1.91%
30,001 ~ 40,000 240 8,621,847 1.19%
40,001 ~ 50,000 178 8,196,369 1.13%
50,001 ~ 100,000 315 21,906,169 3.01%
100,001 ~ 200,000 121 16,966,656 2.33%
200,001 ~ 400,000 85 24,372,242 3.35%
400,001 ~ 600,000 32 15,453,350 2.12%
600,001 ~ 800,000 22 15,630,835 2.15%
800,001 ~ 1,000,000 9 8,025,201 1.10%
Above 1,000,001 74 494,245,780 67.96%
Total 43,261 727,240,126 100.00%
63
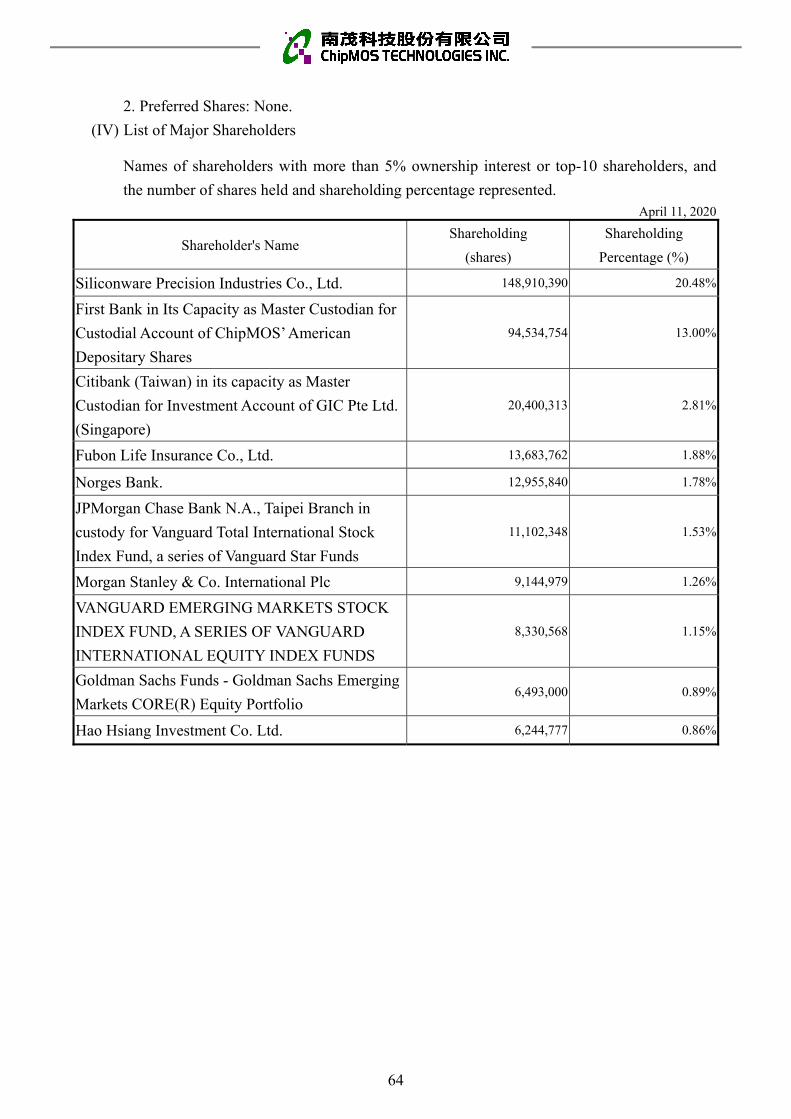
2. Preferred Shares: None. (IV) List of Major Shareholders
Names of shareholders with more than 5% ownership interest or top-10 shareholders, and
the number of shares held and shareholding percentage represented. April 11, 2020
Shareholder's Name Shareholding
(shares)
Shareholding
Percentage (%)
Siliconware Precision Industries Co., Ltd. 148,910,390 20.48%
First Bank in Its Capacity as Master Custodian for
Custodial Account of ChipMOS’ American
Depositary Shares
94,534,754 13.00%
Citibank (Taiwan) in its capacity as Master
Custodian for Investment Account of GIC Pte Ltd.
(Singapore)
20,400,313 2.81%
Fubon Life Insurance Co., Ltd. 13,683,762 1.88%
Norges Bank. 12,955,840 1.78%
JPMorgan Chase Bank N.A., Taipei Branch in
custody for Vanguard Total International Stock
Index Fund, a series of Vanguard Star Funds
11,102,348 1.53%
Morgan Stanley & Co. International Plc 9,144,979 1.26%
VANGUARD EMERGING MARKETS STOCK
INDEX FUND, A SERIES OF VANGUARD
INTERNATIONAL EQUITY INDEX FUNDS
8,330,568 1.15%
Goldman Sachs Funds - Goldman Sachs Emerging
Markets CORE(R) Equity Portfolio 6,493,000 0.89%
Hao Hsiang Investment Co. Ltd. 6,244,777 0.86%
64

(V) Market Price, Net Worth, Earnings, and Dividends per Share Unit: NT$; thousand shares
YearItem
2018 2019 Current Year
till March 31, 2020 (Note 6)
Market Price Per Share
(Note 1)
Highest 28.85 38.80 34.85
Lowest 19.70 22.15 22.50
Average 23.76 28.65 30.07
Net Worth Per Share
Before Distribution 24.85 27.02 -
After Distribution 23.65 - -
Earnings Per Share
Weighted Average Shares 802,725 727,111 -
Earnings Per Share(Equity Holders of the Company)
1.37 3.55 -
Dividends Per Share
Cash Dividends 1.2 Note 5 -
Share Dividend
Earnings Distribution - - -
Capital Distribution - - -
Accumulated Undistributed Dividend
- - -
Analysis of Return on Investment
Price/Earnings Ratio (Note 2) 17.34 8.07 -
Price/Dividend Ratio (Note 3) 19.8 Note 5 -
Cash Dividend Yield Rate (Note 4) 0.0505 Note 5 -
Note 1: The source of foregoing information is the website of Taiwan Stock Exchange. Note 2: Price/Earnings Ratio = Average Market Price / Earnings Per Share Note 3: Price/Dividend Ratio = Average Market Price / Cash Dividends Per Share Note 4: Cash Dividend Yield = Cash Dividends Per Share / Annual Average Market Price Note 5: On March 10, 2020, the Board of Directors adopted the 2019 earnings distribution plan, stipulated that each
share is distributed NT$1.8 cash dividend to shareholders. This plan has not yet been ratified by the Shareholders' Meeting
Note 6: As of the date of publication of the annual report, the most recent consolidated financial report dated March 31, 2020 has not yet been approved by the Board of Directors nor reviewed by certified public accountants. Other fields shall be filled with the information of the current year as of the date of publication of the annual report.
65
(VI) Dividend Policy and Implementation Status
1. Dividend Policy stated within the Company's Articles of Incorporation
Upon the final settlement of accounts, if there is net profit, the Company shall first
set aside the tax payable and offset its losses before setting aside a legal reserve at 10% of
the remaining profit. The Company shall then set aside or reverse the special reserve in
accordance with the laws and regulations and as requested by the competent authorities.
The remaining profit of that fiscal year, as well as the accumulated undistributed profit at
the beginning of the same year and the adjusted undistributed profit of the given fiscal
year, shall be distributable profit. If there is any surplus distributable profit after the
Board of Directors sets aside a reserve based on the Company's operational needs, such
surplus profit may be distributed in full or in part to shareholders as dividends, subject to
the approval of the Shareholders' Meeting.
A proposal on the distribution of dividends shall be submitted by the Board of
Directors annually to the Shareholders' Meeting, and be based on factors such as past
years' profit, the current and future investment environment, the Company's capital
needs, competition in the domestic and foreign markets, and budgets, with an aim to
pursuing shareholders' interests and balancing the dividend distribution and the
long-term financial plan of the Company. The distribution of profits of the Company can
be made in the form of cash dividends or stock dividends, provided that the cash
dividend shall account for at least 10% of the total profit distributed as dividends in the
given year.
2. Proposed Distribution of Dividend
The Company's net profit after tax of 2019 is NT$2,584,161 thousand. On March
10, 2020, the Board of Directors adopted that, after setting aside NT$258,416 thousand
as legal reserve, NT$19,802 thousand as special reserve, the accumulated distributable
profit of 2019 is NT$4,481,292 thousand; thus, the distribution of NT$1.8 cash
dividend per share and NT$1,309,032 thousand in total is proposed. The proposal will
be implemented in accordance with relevant regulations after being ratified by the
shareholders' meeting on June 9, 2020.
(VII) Impact on Company’s Operating Performance and Earnings Per Share due to
the Share Dividends Plan Proposed in this Shareholders’ Meeting: None.
(VIII) Employee Bonus and Directors' and Supervisors' Remuneration:
1. The Scope and Proportion of Compensation to Employees, Directors and Supervisors
Stipulated in the Articles of Incorporation:
If there is profit in any given year, the Company shall set aside 10% thereof as
employee compensation. The Board of Directors may resolve to pay said compensation
in the form of shares or cash. Such compensation may be paid to the employees of an
66

affiliated company who meet the conditions set by the Board of Directors. The Board of
Directors may resolve to set aside no more than 0.5% of the above-mentioned profit as
the compensation of the directors. A proposal on the compensation for the employees,
directors and supervisors shall be presented at the shareholders' meeting. If the Company
has accumulated losses, the amount for making up said losses shall be reserved before
setting aside the compensation for the employees, directors and supervisors at the rates
stated above.
2. The accounting management for the estimation base of estimated amount of
compensation to employees, directors and supervisors, the share calculation base of
distributed shares as employees' compensation, and in the event that actual distributed
amount are different from estimated figures:
In respect of estimated employees' compensation and directors' compensation
according to the Articles of Incorporation, if the actual distribution amount adopted by
the Board of Directors in the next year is different from the estimated figures, it shall
be handled in accordance with the management of changes in accounting estimates, the
profit and loss shall be adjusted in the year resolved by the Board of Directors.
3. Information of proposed distributable compensation adopted by the Board of Directors
(1) The amount of compensation to employee, directors and supervisors distributed in
cash or shares: In 2020, the 5th meeting of the 9th Board of Directors resolved to
distribute NT$338,356 thousand as compensation to employees and NT$16,918
thousand as compensation to directors. The foregoing has no difference with the
estimated amount of the expense recognized for this year.
(2) The proportion that the amount of employees' compensation distributed by shares is
accounted for the sum of the profit margin after tax provided in the current
individual or parent company only financial report and the total amount of
employees' compensation: The Company did not distribute employees'
compensation by shares.
4. The difference between actual distributed compensation to employees, directors and
supervisors (including distributed shares, amount, and price of shares) of the preceding
year and recognized compensation to employees, directors and supervisors, and the
amount, reasons, and management regarding such difference: No difference.
67

(IX) Buyback of Company Shares:
1. Buyback of Company shares (executed completely) April 23, 2020
Treasury stocks: Batch Order
First Second Third
Purpose of buy-back To maintain company’s
credits and shareholder’s equity
To transfer shares to employees
To transfer shares to employees
Timeframe of buy-back August 11, 2015 to October 10, 2015
February 5, 2016 to April 4, 2016
May 13, 2016 to July 12, 2016
Price range NT$21.04 to 41.34 NT$22.4 to 40.0 NT$21.88 to 40
Class, quantity of shares bought-back
20,000,000 common shares
15,000,000 common shares
15,000,000 common shares
Value of shares bought-back
NT$633,737,195 NT$510,819,237 NT$494,191,524
Quantity of cancelled shares
20,000,000 shares 15,000,000 shares 15,000,000 share
Accumulated number of
company shares held 0 share 0 share 0 shares
Percentage of total
company shares held
(%)
0% 0% 0%
2. Buyback of Company shares (under execution): None.
II. Bonds: None.
III. Preferred Shares: None.
68
IV. Global Depository Receipts March 31, 2020
Date of issuanceItem
November 1, 2016
Date of issuance November 1, 2016
Place of issuance and transaction NASDAQ
Total issued amount Not applicable
Issuance price per unit Not applicable
Total units issued 21,775,257 units
Source of representing security Company's common shares
Amount of representing security 4,736,737 units
Rights and obligations of depositary receipts holders As the same as common shares
Trustee None
Depository bank Citibank
Custodial bank First Bank
Unredeemed amount 4,736,737 units
Allocation of responsibility for payment of relevant fees incurred during the issue period and duration
Borne by the Company
Material covenants of depository agreement and custodial agreement
None
Market price per unit
2019
Highest US$24.83
Lowest US$13.92
Average US$18.43
Current year till March 31, 2020
Highest US$23.30
Lowest US$15.00
Average US$19.99
V. Employee Stock Options and Restricted Employee Shares
(I) Issuance of Employee Stock Options: None.
(II) Issuance of Restricted Employee Shares : None.
VI. Status of New Shares Issuance in Connection with Mergers and Acquisitions:
(I) Completed new shares issuance in connection with mergers and acquisitions in the
preceding year and up to the date of publication of the annual report:
1. The lead securities underwriter's evaluation opinion regarding the new shares issuance in
connection with mergers in the most recent quarter: Not applicable.
2. Status of implementation in the most recent quarter: Not applicable.
(II) New shares issuance in connection with mergers and acquisitions approved by the Board of
Directors in the most recent year and up to the date of publication of the annual report:
None.
VII. Financing Plans and Implementations: None.
69

V. Operational Highlights I. Business Contents
(I) Business Scope
1. Main Business Contents
The main business of the Company is to provide assembly and testing services for
various ICs. We also provide turnkey total solution and drop shipment services for our
clients.
2. Proportion of Main Products
The consolidated revenue of the Company comes from providing assembly and
testing services. Products of assembly and testing can be divided into two segments:
memory products and LCD driver ICs. Based on the process characteristics and the
operation administration of profit center, five business groups are set up as the
“Assembling Production Group,” “Memory Production Group,” “LCDD Production
Group,” “WB Production Group,” and “Testing Production Group.” Such groups all report
to “Operation Manufacturing Center.” Revenues, cost and gross margins of each group are
calculated respectively. Therefore, we classified the products of the Company into five
groups and explain the proportion of the main products as follows: Unit: NT$ thousands; %
Year Main Departments
2017 2018 2019
Amount % Amount % Amount %
Assembly 5,425,189 30.24 4,679,676 25.32 5,148,877 25.32
Product Testing 2,896,408 16.15 2,891,281 15.65 2,604,451 12.80
Driver IC 4,792,472 26.71 5,694,720 30.82 6,922,205 34.04
Wafer Bumping 3,055,000 17.03 3,315,534 17.94 4,008,999 19.71
Wafer Testing 1,998,881 11.14 1,898,816 10.27 1,653,349 8.13
Subtract: Amounts from Discontinued Operations
(227,095) (1.27) - - - -
Total 17,940,855 100.00 18,480,027 100.00 20,337,881 100.00
Note: Consolidated financial statements audited and certified by independent accountants.
3. Current Products (Services) of the Company
The main products of the Company is assembly and testing regarding thin small
outline package (“TSOP”), Fine Pitch BGA (“FBGA”), Tape Carrier Package (“TCP”),
Chip On Film (“COF”) and Chip On Glass (“COG”), and wafer bumping (“Bumping”).
Clients' products can be successfully applied to information, communications, office
automation, consumer electronics and other related products through the comprehensive IC
assembly and testing services provided by the Company.
70

4. New Products (Services) Development
In the future, in addition to increase of the capacity of the assembly and testing for
high-end memory, the Company and its subsidiaries will also enhance and increase the
capability and capacity of the assembly and testing for the products in the following areas
depending on the market applications and demands:
(1) Develop assembly technologies of 3D WLCSP (Chip on Wafer) and are implemented
for MEMS (Micro-electro-mechanical -systems) products.
(2) Develop Multi-Layer (3P/3M) Wafer Bumping and assembly technologies of Cu Pillar
Bump and Flip Chip, and are implemented for memory and mixed-signal products.
(3) Develop assembly technologies regarding biometrics authentication and are implemented for
fingerprint sensor products.
(4) Bumping, Assembly and testing services of 3P/ 2M wafer re-distribution layer and
multi-chip integration products, i.e., MCP (multi-chip packaging) for high density flash
memory and integrated multi-chip product.
(5) Stacked-Die packaging services for high density flash memory products.
(6) Wafer Level CSP (Wafer Level Chip-Scale Package) packaging services for consuming
and communication products.
(II) Industry Overview
1. Current Status and Development of the Industry
2018 revenue of Taiwan IC assembly and testing industry is NT$493 billion and the
annual growth rate shrank 3.4%. Mainly due to the increased demand for advanced
packaging from mobile communication electronic products, the penetration rate of high-end
and advanced packaging technologies such as WLCSP (Fan-in and Fan-out) driven by high
I/Os and high integration continued to rise. Coupled with the increase in memory prices, the
market for the quality and quantity of IC packaging and testing products simultaneously
improve. The production value of Taiwan IC assembly and testing industry in 2019 is
NT$501 billion, which shows an increase of 1.6% as compared to 2018.
Production Value of Taiwan’s Semiconductor Industry in Details Unit: NT$0.1 billion; %
Items
2017 2018 2019
Amount Amount Proportion (%)
Annual Growth
Rate (%)
Amount Proportion (%)
Annual Growth
Rate (%)
IC Design 6,171 6,413 24.48 3.9 6,928 25.99 8.0
IC Manufacturing 13,682 14,856 56.70 8.6 14,721 55.23 -0.9
Wafer Foundry 12,061 12,851 49.05 6.6 13,125 49.24 2.1
Memory and IDM 1,621 2,005 7.65 23.7 1,596 5.99 -20.4
IC Assembly and Testing 4,770 4,930 18.82 3.4 5,007 18.78 1.6
Production Value of IC Industry
24,623 26,199 100.00 6.4 26,656 100.00 1.7
Source:TSIA、IEK of Industrial Technology Research Institute.
71

2. Relevance Between the Upstream, Midstream, and Downstream of the Industry
Due to the trend and evaluation invoked by the overall vertical integration
regarding the division of labor within the semiconductor industry, semiconductor
industry in Taiwan can be divided into the upstream, IC design houses, the midstream,
IC manufacturing and foundry, and the downstream, IC assembly and testing houses.
In recent years, Taiwan’s IC industry keeps flourishing and the disintegration therein
is becoming more specialized. Each link in the supply chain engaged by various
entities, which causes the vertical disintegration, becomes clear and further specialized.
Therefore, the structure of the upstream, midstream and downstream of Taiwan’s IC
industry is more complete than before. The relevance of upstream, midstream and
downstream of the industry in which the Company is engaged as shown in below. The
main business of the Company is providing IC back-end services for memory IC, LCD
driver IC, and logic/mixed-signal IC, which belong to the downstream of the
semiconductor industry.
Source: MIC; IEK of Industrial Technology Research Institute (2013/04)
Equipment Funds,
Human Resource
Services Support
Logistics
Customs
Science Park
Materials
Logic Design Mask Design Testing and Dicing Assembly Product Testing
Crystal Growth
Wafer Dicing
Design Assembly Testing Mask
Wafer Chemicals Substrate
Lead Frame
Manufacturing
Structure of Taiwan's Semiconductor Industry
72

3. Trend of Development and Competition Regarding Products
(1) Trend of Development
A. IC Assembly and Testing Industry`
a. 3D IC will become a must of advanced assembly in the future.
Based on the low power consumption, high performance, multi-function
integration, and package minimization of industry trend, the multi-chips assembly
technologies which can integrate each IC, such as System on Chip (“SoC”), System
in Package (“SiP”) and 3D IC, are the trend of advanced assembly capability
development.
3D IC has advantages such as shortening interconnection and scaling down the
size of the chips. Therefore, 3D IC has risen as the mainstream technology in recent
years. Meanwhile, the type of assembly also shows a development toward TSV. Such
type of assembly differs from the traditional wire bonding. It etches holes on each
wafer and fills in conductive materials to provide connecting function and therefore
all the chips will be combined together. This method reduced the length of metal
wires and connection resistance, and further trimmed down the area of the chips. In
respect of the needs of digital electronic products in light and short sizes, high
efficiency and integration, highly system integration and wireless becomes
unavoidable trends and 3D IC’s new structure can meet such development trend of the
market. For example, smartphones have high requirements for IC’s function and
bandwidth. Aims as increasing the bandwidth and reducing the volume of elements
can be achieved through 3D IC. Compared with 3D IC, other assembly technologies,
such as SoC, SiP and TSV, have their own advantages and disadvantages respectively.
SoC technology has better performance in the costs of energy savings and low capacity
products, and is mainly used in products with large quantity and long life cycle. SiP has
advantages in heterogeneous integration, speed of production, reuse of design
resources and time of research and development, which is most applicable to products
for immediate marketing and those with high level heterogeneous integration. TSV has
better performance in efficiency and cost of high capacity products, and is currently
applied to memories, image sensors and MEMS fields. 3D IC has advantages in small
size, high efficiency and easier high level heterogeneous integration in application, and
thus becomes the main technology developing by the semiconductor assembling
industry at the current stage.
b. The ratio of smart handheld device in the semiconductor application market keeps
increasing.
Based on the integration of logic IC and mobile DRAM, mobile phone
becomes the largest application market. Along with the expanding trend of smart
handheld devices all over the world, smartphone and tablet computer markets
73
shows a trend of huge growth and becomes significant growth force of the world’s
semiconductor market. Further, competitive power of IC design houses regarding
elements such as CPU, GPU, baseband and networking chips in the smart handheld
device market also brings growth in wafer foundry and IC assembly and testing
market. In addition, increase in sales of smart handheld device also accelerated the
development of semiconductor elements toward high efficiency and integration,
and low power consuming. By seizing the turning point of the rise of smart
handheld device, there will also be a chance for growth in revenue.
c. Assembly and testing industry will show a trend of “The Big Ones Get Bigger.”
Although electronic terminal device shows a trend of light and short sizes, its
price keeps going down and thus indirectly depresses the prices and profit of the
assembly and testing industry which depends more on the raw material costs.
Entities lack of sufficient economic scale will face severe cost control in the future.
Further, along with the trend that major semiconductor companies engaged in
manufacture procedure in a higher level, the assembly method adopted therein will
become more difficult, and the capital expenditure will also become larger and
larger. Therefore, if assembly and testing services vendor with smaller scale fails
to secure its niche market, its competitive power will continually be weaken under
“the big ones get bigger” trend of the industry.
B. Storage Device Industry
NAND Flash is becoming the mainstream of the world’s memory market.
Decrease and increase can be found in the sales volume of DRAM and NAND Flash
respectively in recent years. It reflects the popularization of smartphones and tablet
computers. Cloud computing also brings different effects to the two major memory
products. Vendors who will implement the built-in NAND Flash and mobile device
processing units directly to smartphones in the future also successively provide
solutions supporting application of embedded memory (Emmc / eMCP). It is
well-established that the built-in NAND Flash will become the majority of
smartphone storage in the future. The successful rise of Ultrabook also accelerated the
implementation of solid state disk in the PC industry. Further, demand of data center
servers for NAND Flash will keep increasing. Therefore, NAND Flash will exceed
DRAM and become the most major memory product of the world.
C. Flat Panel Display End-Use Industry
a. Development of devices toward ultra high resolution panel.
Apple and Samsung continually released smartphones and tablet computers
with high resolution which earned good reputation in the market. Vendors of other
brands are also catching up with the trend. Therefore, high resolution panel is
becoming the specification necessary for high-end products. After smartphones,
74

tablet computers, notebooks, Ultrabooks and even LCD TVs are speeding up their
pace regarding the implementation of high resolution panels. Further, after Apple
released New iPhone and MacBook Pro which adopted fingerprint recognition
modules, other brands such as Samsung, Asus, Acer and Dell are also speeding up
their pace to implement fingerprint recognition modules in their cell phones, tablet
computers, notebooks and slim notebook products. Based on the slow sales in
LCD television market, Japanese and Taiwanese panel manufacturers are now
engaged in development and massive production of 4K×2K LCD panels and will
further implement products such as high-end LCD monitoring camera and LCD
TV.
b. AMOLED is considered as the advanced display technology of next generation.
AMOLED has self-luminous characteristic. Its response time is short and
may have high contrast efficacy. Therefore, AMOLED can show splendid colors
while effectively reduce electronic consumption. Further, products’ thickness may
be reduced significantly because such products can be lit up without the assistance
of backlight. Also, AMOLED has bendable characteristic because it can be
processed on soft substrates. The proportion of cell phone vendors in Mainland
China adopting AMOLED are increasing. Apple is also negotiating with panel
vendors regarding the distribution of OLED panels of iPhones and it is expected
that this may lead the movement of more cell phone vendors to catch up such
trend. Market share of AMOLED is expected to rise year by year.
(2) Competition Status.
A. Driver IC Back-End Services is an Oligopolistic Market and 12-inch Gold Bumping
and Testing Machinery Equipment are Significant Points of Expansion:
After integrations conducted in Taiwan’s LCD driver IC assembly and testing
industry, small vendors are merged into other vendors. After integrations of relevant
back-end services vendors (for example, Fupo, USTC, Megic, Chipbond, UOT,
ISTC, ChipMOS, AMCT, Aptos and SPIL), Chipbond and ChipMOS are the only
main vendors left and therefore cause the LCD driver IC back-end services to
become an oligopolistic market. Capacity of the two top vendors in Taiwan, i.e.,
Chipbond and ChipMOS, far exceeds other competitors. They are also able to offer
turnkey services and thus the order of the industry may be maintained. Currently,
capacity utilization rate of each vendor in peak seasons regarding the 8-inch Gold
Bumping is merely 70%. In the future, the rest of the capacity will be used in
assembly and testing for power management IC, MEMS, WLSCP and other
application products. Along with the rapid growing demand for smart handheld
device, design for small size driver IC is becoming more complicated due to the
increase of the resolution of Mobile Device panels. Testing period also becomes
75

longer. Therefore, expansion of each vendor in 2018 & 2019 had been focused on the
capacity of 12-inch Gold Bumping and testing machinery equipment.
B. DRAM Industry of the World Has Been “Carved Into Three Pieces” by Samsung,
Micron and SK Hynix:
Since Micron owns memory assembly and testing facilities, orders placed by
Micron are mainly for assembly of DRAM and NAND Flash while the testing are
mostly performed in-house. The main vendors engaged by Micron in Taiwan
regarding DRAM/NAND back-end services are PTI , ChipMOS and ASE. It is
highly possible that Micron will take lead in the manufacturing process technologies
of the next generation. Micron’s testing platform is solely developed by itself and
thus differs from most of the testing houses. If testing houses intend to continually
obtain Micron’s orders, they will need to increase their capital expenditures to
purchase new testing platforms. The Company has been working a long time on
raising production efficiency and reducing manufacturing cycle time and raw
material costs to enhance price competitive power. Further, the Company has
established a long-term and close cooperation relationship with Micron than other
competitors and provide Micron with satisfactory professional services. Taking into
consideration of the competitive ability of the technologies in the market of both
ChipMOS and Micron, the parties will jointly develop next-generation products
based on principles of equality and mutual benefit and financial stability. Investment
regarding new products and new manufacturing procedure in the future will be made
in a timely manner to raise the competitive ability of the Company.
(III) Status of Technologies and Research and Development
1. Technology Level, Research and Development of Operating Business.
(1) Technology level of operating business.
ChipMOS has committed to assembly and testing business for over 30 years which
originated from MOSEL’s back-end factory from 1986. 20 years has passed since
ChipMOS’ official independence from MOSEL on 1997. ChipMOS is now one of the
top ten assembly and testing vendors in the world.
Although assembly and testing services produce no inherent products, the scope of
such services includes military industry to daily consumer products. On the other hand,
assembly and testing services focus on the back-end of the overall semiconductor
supply chain. Any disorder of any link of such supply chain may affect the Time to
Market. Further, assembly and testing services are no longer being considered as a
traditional industry with low entry-barriers. Instead, such services are now facing
process miniature and irregular and rapid ups and downs within the industry. In
respect of the rise of new generation portable consumer electronics, such as
smartphones and tablet computers, vendors shall always be ready to provide their
76
clients with the best integration solution to establish win-win cooperation relationship.
In order to continually have a foothold in the assembly and testing industry,
ChipMOS has committed to product research and development for decades. Research
and development regarding assembly and testing generally refers to technical basis,
including the characteristics of materials and machines, which are the core business of
the Company, and the characteristics of electronics, which are becoming much more
focused. In general, the cores of researches are combinations of the foregoing three
main fields and other compositions. Relevant explanations are provided as follows:
A. Materials
The main mission of the package body is to protect ICs from the effects of external
stress and environmental pollutants, and further ensure the stability of any internal
heterojunction under long-term use. Therefore, the choices and applications of
materials are extremely important. Materials placed in a package body shall have a
most optimized combination. The best package body shall maintain certain
characteristics after severe burn-in test (adopting JEDEC standards) and then shall it be
confirmed as the most optimized combination of materials. In addition, how to select
assembly materials at a low costs to meet clients' needs of reducing costs of products
has always been the key point of ChipMOS' research and development.
B. Machine Characteristics
To protect internal IC chips from losing efficacy due to external stress, it is
important that the surface of the products shall be firm enough and the internal stress
shall be as little as possible. Especially the curve caused by periodical and
instantaneous thermal stress that occurs in the application of miniature product will
bring permanent damages to interface contacts. This will further cause the units to
lose efficacy. Therefore, machine characteristics require prior simulation and post
measurement. The characteristics and error range of such structure can be learned by
conducting analysis in all aspects.
C. Electronic Characteristics
Another mission of the package body is to distribute the signals from IC chips to
PCBs. This can be achieved through the design of the substrate. However, consumer
electronics are changing rapidly and the trend of high-speed and high-frequency/
microwave radio frequency has been established. Therefore, electronic
characteristics require prior simulation and post measurement by a different method
in order to meet various needs of the clients.
Based on the foregoing three basic researches, in respect of products of various
clients, the aim of improving package shall be achieved by selecting various
characteristics. Improvement of the main package of each generation solely depends
77

on advanced research and development. Current mainstream of assembly
technologies and ChipMOS' unique abilities can be realized step by step through the
following research and development plans.
(2) Research and Development
Research and Development Plans Regarding Assembly and Testing Technology in 2019
A. Continua1ly develop Cu Pillar Bump and Flip Chip assembly technologies and
implement applications in memory and mixed-signal products.
B. Continua1ly develop fine pitch, high aspect ratio application used UBM sputtering
technologies and implement applications in commercial and communication
products.
C. Continually develop Cu Pillar technologies and implement next-generation
products of biometrics authentication, fingerprint sensor products.
D. Wafer Level CSP (Wafer Level Chip-Scale Package) packaging services for
consumer and communication.
E. Continually develop multi-Cu RDL layers (3P2M) bumping capability and
Stacked-Die packaging services.
F. Continue to develop COF SMT capability to meet the requirement of sub-system
module.
Research and Development Plans Regarding Assembly and Testing Technology in 2020
A. Developing 3P/3M Cu pillar and WLCSP for high pin count product.
B. Continually develop fine pitch RDL line width and space (4um/4um) for copper
RDL application.
C. Developing fine pitch inner lead width and space for COF ILB assembly.
D. Evaluate thinner PI film of COF tape to increase the tape flexible property for full
screen of FDP device development.
E. Developing COF FT test condition in low temperature condition -40 for ℃
automotive device specification.
F. Implement DBG/ SDBG for thin wafer capability.
G. 16DP BGA/SiP product development
78

2. Invested Research and Development Expenses of the Most Recent Year and till the Date
of the Publication of the Annual Report. Unit: NT$ thousands
Year
Item 2019
Current year till March
31, 2020
A. Research and Development Expenses
1,007,631 ---
B. Revenue 20,337,881 ---
A/B 5% ---
Note: As of the publication date of the annual report, the most recent consolidated financial statements dated March 31, 2020 has not yet been approved by the Board of Directors nor reviewed by certified public accountants.
3. Successfully Developed Technologies or Products during Recent Years
Year Results of Research and Development Explanation of Contents
2019
Developing Cu Pillar Bump and Flip
Chip Assembly technologies
1. Developing Low temp (<230oC) and high temp (<390oC) PI
2. Developing mutiple RDL options (0P1M and 1P1M)
3. Able to flip chip bond by real and dummy bumps on a same die
Developing sputter fine line and high
aspect ratio bumping process
1. Fine line width and space (5um/5um)
2. Thin to thick Cu RDL line (3-21um)
Developing Wafer Level CSP 1. Low-temp (<230oC) and high-temp (<390oC) PI
2. Small to great form factor die size (0.8x0.8 mm2 ~ 5x5 mm2)
Developing multiple Cu RDLs
(3P2M) to achieve assembly die
stacking technology
1. Provide 3P2M RDL solution
2. Can support 8-die assembly stacking
3. Wafer thinning till 50um
4. Gold, Silver and Copper wires are available
2020
3P3M Cu pillar and WLCSP
development
1. Developing 3P/3M Cu pillar and WLCSP for high pin count product
requirement.
Developing fine pitch RDL Cu line
width and space
1. Developing fine pitch Cu RDL line width and space with 4um/4um
for high pin count memory product application
Developing fine pitch inner lead width
and space for COF ILB assembly
1. To intensify the ILB lead pitch to 18um (Line/Space=8/10 um)
2. Provide two metal COF turnkey process
3. To intensify the chip length more than 28mm and min chip thickness
200um
4. Consummated above technology to provide the turnkey solution for
TDDI, AMOLED new application
Developing COF with high flexible
property
1. Developing COF PI film thickness 25um for full screen of FPD
application
2. Provide the narrow bezel solution for display panel of smart phone.
79

Year Results of Research and Development Explanation of Contents
Developing FT test condition of COF
with -40 environment℃
1. Developing COF FT test environment from temperature range
-40 ~125℃ ℃
2. To meet automotive device specification.
Implement DBG/ SDBG technology 1. Implement DBG/ SDBG to enhance the capability of ultra-thin wafer
capability for 3D NAND Flash application
16DP BGA/SiP product development 1. Developing more die stacking for device capacity increasing.
(IV) Long-term and Short-term Business Development Plans.
The Company and its subsidiaries have taken the initiative in approaching clients and the
market for many years. Along with the growth of clients and the market, the Company and its
subsidiaries have successfully established the basis of product qualities and company images
and gradually gained a foothold in the market. In respect of the trend of industry
developments and competitions in domestic and foreign market, it is expected that the
condition of the Company can be adjusted according to the long-term and short-term
development plans in order to improve its overall competitive power.
1. Short-term Business Development Plans
(1) The Services Provider of Entire Back-End Processes within the Semiconductor
Market.
A. Provide services regarding the entire manufacturing process of core technology
products.
B. Focus on the capacity of the semiconductor assembly and testing market, and the
products and technologies jointly researched and developed with clients which a
win-win situation is expected.
C. Continue to maintain good relationships with existing clients and further obtain
new clients.
D. Based on customer demand to expand capacity of logic/mixed-signal IC,
AMOLED, and automotive driver ICs products. MEMS products shall be also set
as the targets of further expansion.
(2) Major Vendors' Acceleration of Outsourcing and Organization Integration Caused
Increase in ChipMOS' Business of Technical Services.
A. Major IDMs (Integrated Device Manufacturer) continually and rapidly increase
their business outsourcing related to semiconductor back-end assembly and testing
services in order to correspond to the quickly shortened life cycle of products and
raw material price fluctuation.
B. Based on historical data of OSATs, IDMs, wafer foundries and design houses will
continue to release capacities.
C. Due to integrations within the semiconductor assembly and testing market during
80

the recent years, the number of competitors has been reduced and thus improved
the market order. For example, Gold Bumping manufacture and TCP/COF.
(3) Business Strategic of Establishing Long-term Partnership with Clients.
A. Maintain a high-level profit margin.
(A) Adopt efficient management and diversification business strategy, and further
increase equipment's capacity utilization.
(B) Under horizontal competition in the industry with fewer competitors, better sale
price and gross profit may be maintained.
(C) Increase the profit margin by using the funds efficiently and adjusting the
product portfolio.
B. Enhance relationship with leading vendors and companies engaged in
semiconductor industry within Company's core business scope. Further, based on
the technical blue prints of the Company, to cooperate with clients closely, keep
devoting to innovation and research, and further expand capacity.
2. Long-term Business Development Plans
(1) Focus on High-Growth End-Use Market.
A. Focus on special end-use market.
B. Develop high-growth product application market by implementing advanced
technical service of entire back-end processes.
C. Focus on the research, development and innovation of core technologies to assist
clients lowering their operating costs.
(2) Focus on the Capacity Expansion, Development and Establishment of Advanced
Technologies; Establish Sufficient Capacity and Expand the Market Share of
High-Growth Products.
A. Develop 12-inch wafer Fine Pitch Bonding technologies which shall be applied to
LCD display driver IC products.
B. Establish implementation of Flip Chip technologies regarding assembly of memory
and logic/mixed-signal products.
C. Apply WLCSP and RDL technologies to electronic compasses, magnetometers and
other memory products.
D. Develop assembly technologies for high-profit assembly products, such as
Stacked-Die package, Multi-Chip package and SiP.
(3) Taking Initiative in Establishing Global Self-Owned Intellectual Properties Database
to Achieve the Aim of Protecting Specialized Technologies.
Use positive and innovative research and development power to cooperate with
clients' technology development and new products development and further establish
platform for patent development. Raise the value of non-core technologies by
transferring and selling patent rights.
81

II. Market, Production, and Sales Overview
(I) Market Analysis
1. Market Analysis
(1) The Sales Territory of Main Products (Services)
Unit: NT$ thousands; %
Year Territory
2018 2019
Amount Ratio (%) Amount Ratio (%)
Domestic Sales 14,751,766 79.83 15,875,027 78.06
Export Sales
Asia 3,346,664 18.11 4,151,793 20.41
America 255,738 1.38 150,702 0.74
Others 125,859 0.68 160,359 0.79
Subtotal 3,728,261 20.17 4,462,854 21.94
Total 18,480,027 100.00 20,337,881 100.00
(2) Market Share
The Company is professional IC assembly and testing companies, mainly providing
assembly and testing services of memory IC, LCD driver IC and logic/mixed-signal
products for IC design houses, integrated devices manufacturers (IDM) and IC fabs. The
aforementioned products are primarily applied in computers, storage devices for
consumer electronics, and terminal application products for displays. According to
statistics of IEK of Industrial Technology Research Institute, the production value of
Taiwan IC assembly and testing industry in 2019 is NT$501 billion, while the
consolidated revenue of Company in 2019 is about NT$20.3 billion, accounting for
about 4.05% of Taiwan's production value. The Company has many years of experience in
assembly and testing and professional R&D technical capabilities to provide adequate
capacity scale and full service of back-end processes to meet different needs of clients. In
recent years, the Company has a very good performance in terms of business scale,
reflecting that the Company' products and technology have obtained a high degree of
client recognition, and have already occupied a considerably competitive position in the
industry.
(3) Competitive Advantages
A. Industry-Experienced Management and Technology R&D team
Since the establishment of the Company in 1997, the Company has continued to
invest in the research and development of advanced technologies relating to the field of
assembly. The major R&D personnel and the management team have more than 10
years of working experience in the semiconductor industry, accumulating rich
experience relevant to assembly and testing, while equipped with a clear perception of
the industry trends, and a comprehensive grasp of the market demand. As a result, the
82

Company is able to meet clients' demand, timely developing key technologies
contributing to win more clients' orders.
B. Equipped with Advanced Process Technology
The competitions between domestic and foreign vendors in the IC assembly and
testing industry are fierce. Each vendor would develop innovative process technology
to reduce costs and lower prices to enter the market. As a result, price competition is a
major factor determining competitiveness in the IC assembly and testing industry, and
process technology is also an important indicator for competitiveness. The Company
has advanced assembly technology, continuing to improve the technologies in the
manufacturing process, and improve production efficiency, thus helping clients reduce
operating costs. In addition, the Company is actively pursuing innovation and R&D,
working with clients to develop new process technology and new products, while
establishing a platform of patent development. So far the Company has acquired 901
patents at home and abroad, and were named Astrum Award Winner by MDB Capital
Group, a US intellectual property (IP) investment bank, in 2011, revealing that the
advanced process technology possessed by the Company has become one of the
important competitive advantages.
C. Production Has Reached Economies of Scale and the Capacity Continues to Expand
The mass production of IC assembly and testing vendors can reduce the unit costs
of R&D, equipment procurement, and operation costs. Since the establishment of the
Company in 1997, the Company has focused on the R&D of technologies and
productions relating to the field of assembly and testing. So far the Company has built
up sufficient manpower and machinery equipment, and production capacity has
reached the economies of scale. In addition, the engineers and production line workers
are skilled in the manufacturing process and operation techniques, while the Company
is able to effectively manage the machinery equipment and adopt the strategy of
diversification, significantly increasing the production efficiency and relatively
reduced the unit cost. In order to increase the Company's market competitiveness, the
Company will closely observe the market and clients' needs in the future, continuously
expanding production capacity in response to the clients' demand for diversification
and reducing unit costs.
D. IC Assembly and Testing Turnkey Services
The Company provides clients with turnkey services including assembly and
testing of memory IC, LCD driver IC, logic/mixed-signal IC, wafer bumping
manufacturing and other products in order to meet the clients' demands of one
purchase to solve all needs, and shorten the delivery time while saving transportation
costs, indirectly saving clients' operating costs, strengthening each other's
competitiveness to jointly create a win-win situation.
83

E. Establishing Close and Long-term Partnership with Clients
The Company provides clients with a complete package of services including the
entire manufacturing process of core technology products. In the aspects of assembly
and testing technology, product quality and delivery service, our services can fully
meet the needs of clients and work with our clients to develop new products and new
process technology. Therefore, the Company has received accreditations and
recognitions from a number of domestic and foreign well-known IC manufacturers.
Furthermore, given the concerns of confidentiality of technology, quality and
long-term tacit understandings, unless significant deficiencies occur to the products,
the IC manufacturers would not easily replace the supplier. This fact demonstrates that
the Company has established close and long-term partnership with clients. In addition,
except continuing to maintain good relationships with existing clients and continuing
or extending existing OEM contracts or capacity reservation contracts, the Company
would use our advanced process technology as a basis in the future to focus on the
development of new clients of logic/mixed-signal and consumer IC products. This
practice would benefit the Company' future operation developments.
F. Solid Financial Structure
"The big ones get bigger" is one of the future development trends of assembly
and testing industry. The Company has sufficient cash flow and solid asset-liability
structure to ensure that the Company would continue to invest and develop steadily.
This is our key to maintain the stability of operations during the recession of the IC
industry. Therefore, the stability of the financial structure of the Company is an
important basis to long-term cooperation and mutual development with clients, and it
is also one of the competitive advantages of the Company.
G. Equipped with a Complete Product Development Blueprint and the Power to Pursue
Diversified Developments
The Company has an experienced R&D technical team. In addition to continuing to
strengthen and improve the IC assembly and testing technology and quality, the Company
is also actively developing state-of-the-art technology and services in response to the
needs of the future IC mainstream market (including high profit assembly products and
technologies currently under development such as the 12-inch wafer Fine Pitch
technology and Flip Chip, or ones that are applied to WLCSP and RDL technologies,
Stacked-Die Package, Multi-Chip, and SiP). With our own capabilities of technology
integration and development, the Company relies on a wide range of assembly and testing
technologies to provide a complete portfolio of product technologies in accordance with
market and client demands. The practice not only reduces the impact of the IC industry
recession, but also provides clients with more diversified and differentiated assembly and
testing services to increase the Company's competitive advantage.
84

(4) Advantages and Disadvantages of Development Prospects and Countermeasures
A. Advantages
(A) The Market is Capital and Technology-Intensive, and the Barriers to Entry are
Comparatively High
The semiconductor industry is a capital and technology-intensive
industry. Capital expenditures in the industry are becoming more costly because
the machinery equipment required for semiconductor testing is expensive, the
orders for IDM OEMs are increasing and the product technologies change rapidly.
In addition, as semiconductor assembly is technology-intensive, its process
technology and production defect-free rate determines the level of production
costs, and it is difficult to train and recruit R&D personnel while assembly and
testing products would only acquire orders after the certification of clients. These
factors result in a higher threshold for new competitors. The Company has an
excellent technical R&D team. We devoted ourselves to the industry for many
years, resulting in our rich experience in practice. Moreover, the Company fully
grasps the trends and needs in the semiconductor assembly industry, and we have
already reached economies of scale, while our process technology also obtained
the trust and quality certifications of international industry giants. All of these
successes indicate that the Company is competitive in the market.
(B) The Domestic Semiconductor Industry Has a Complete Model of Vertical
Disintegration
The vertical disintegration system of Taiwan's semiconductor industry
has developed for many years, and is equipped with advantages such as the
integrity of upstream and downstream industry chain, work specialization with
high supportiveness, significant industry cluster effect, and the
comprehensiveness of surrounding support industry. In addition, the wafer
foundries and assembly and testing houses of Taiwan possess professionalized
manufacturing capacity along with flexible production scheduling, world-class
service quality and rapid adaptability, and already reached economies of scale. The
capacity of Taiwan's semiconductor industry is not only in line with industry
trends and demand, but also is capable of providing high-quality and
internationally competitive products. This would be a great advantage for our
development in the future.
(C) The Industry and End-Use Market of Our Products Will Continue to Grow in the
Future
Due to the strong growth in shipments of smartphones, tablet computers,
Ultrabook and others led to the increase of relevant chips' assembly and testing
orders; the continuing trend of IDM OEM outsourcing; the fact that the amount of
85

copper wire will still has a lot room for growth as the orders of fables vendors in
the United States and IDMs in Japan will keep increasing; and along with the
improvement of the penetration rate of 1x nano-process technology, the demand
for advanced assembly and wire bonding would elevate simultaneously. This is
conducive to the increase of the added value of the industry, and the promotion of
the development of industry value upgrading. In addition, from the perspective of
the storage device industry, strong demand for smartphones, tablet computers and
other consumer electronics products is expected to stimulate the growth of DRAM
and NAND Flash; from the perspective of displays' end-use industry, although the
demand for LCD monitor and personal computer continues to decline, but as the
demand for LCD TV continues to increase, the annual growth rate of the
production value of the global large-size panel industry will rise slightly to 5.6%,
while the production value reaches US$98.1 billion. As for the small size panels,
as the demand for smartphones and tablet computers continues to rise, the annual
growth rate of production value of small and medium size panel industry is
expected to increase significantly to 28.6%, while the production value reaches
US$33.5 billion. To sum up, the growth of the Company is expected to continue
sustainably since the industry and the end-use market will continue to grow in the
future.
(D) The Trend of International IDM Industry Giants' Acceleration of Outsourcing is
Conducive to Assembly and Testing Market
In 2009, as the financial crisis inflicted a serious defeat on the global
economy and both the domestic and international IT industry, international IDMs
became more cautious in inventory control. They no longer invest in the expansion
of capacities and start to reduce capital expenditure while conservatively
expanding the capacity of back-end IC assembly and testing. In the meantime,
IDMs have begun to engage in operation modes revision (i.e. Fabless or Fab-Lite)
and structural reorganization. They concentrate on market development and R&D,
improving operational efficiency, while they strive to reduce the risk of self-built
fabs and focus on pooling of resources and production costs reduction, resulting in
the continuing of IDMs' increasing of the proportion of outsourcing. In addition, as
the IC production process continues to refine, the trend of semiconductor
assembly types moving towards high-end IC assembly and testing technology
emerges. Under such circumstances, IDMs are highly dependent on the
professional assembly and testing houses dedicated to continuous R&D of new
technologies in order to master high-end assembly technologies required for the
new types of IC products. As a result, the business opportunities of domestic IC
assembly and testing houses to gain outsourcing orders from international IDMs
will continue to increase.
86
The Company has industry-experienced R&D technology teams and
advanced process technology (for instance, assembly and testing technologies
including COF, COG/COP, Wafer Level CSP and MEMS, etc.), and is able to meet
clients' needs for timely development of key technologies, while continuously
improving process technologies in manufacturing processes and enhancing
production efficiency. All of these advantages would help clients reduce operating
costs. In addition, the Company has reached economies of scale, and are able to
continuously expand production capacity in accordance with the market and
clients' demand. The Company has sufficient capacity to meet major IDMs'
diversified demands and reduce unit costs, thereby increasing the price
competitive advantage, contributing to the winning of IDM OEM orders.
B. Disadvantages
(A) Capital expenditure gradually increases
The Company provides assembly and testing services, and all of our testing
machinery equipment is costly. As IDM's OEM orders are increasing, assembly
and testing vendors began to vigorously invest in the procurement of machinery
and equipment. In addition, in response to the rapid changes in assembly and
testing technologies, major semiconductor vendors have gradually entered a more
advanced level of process, while the difficulty of relevant assembly technologies
also simultaneously increases. As a result, the required capital expenditure is
becoming more enormous, and therefore the increase in capital expenditure would
elevate investment risks of the Company.
Countermeasures:
The Company has established a R&D center to research and develop
assembly and testing technology with clients and seize the market demand at any
time in order to understand new assembly and testing technology trends in the
future, ensuring that the Company could introduce the products and technologies
to meet market and clients' demands at an appropriate and right moment. In
addition, the Company has carefully evaluated the investment plans and the
management plans of personnel, machinery equipment, funds and technology,
adjusting the equipment portfolio in accordance with market demands in a timely
manner so as to use the minimal equipment and investment portfolio to respond to
diversified client demands, reduce assembly and testing technology-related
investment amount and risks, and pursue the efficient use of free cash flow while
maximizing our management effectiveness.
87
(B) The assembly and testing technologies change rapidly and the Company has less
dominance in the development of technologies
With the rapid expansion of the application of end applications, memory
applications and product categories are becoming more diverse. Moreover,
because the market are becoming more demanding of product functionality,
performance, cost and design along with the fierce horizontal competition in the
industry, semiconductor and testing technology changes rapidly; in addition, as the
designers and users are the players having dominance in the field of new assembly
and testing technologies, it is difficult for us to immediately grasp the market
acceptance of new technologies.
Countermeasures:
The Company provides a complete package of services for the entire
semiconductor back-end process, and our assembly and testing products are
required to be jointly certified by the IC manufacturer and the IC assembly and
testing vendors. Given the necessity of product technical confidentiality and
quality stability, IC manufacturers would select an appropriate IC back-end
assembly and testing vendor to engage in a close and long-term cooperation. Once
the cooperation relationship of supply and demand is confirmed, it is not easy to
alter the relationship. In addition, the Company and clients jointly develop new
products and technologies to ensure that we can introduce the products and
technologies to meet market and clients' demands at an appropriate and right
moment. Furthermore, the company is committed to the R&D and innovation of
core technologies. In addition to continuing to maintain good relations with
existing clients, we also continue to develop assembly and testing technologies for
other products such as logic/mixed-signal and consumer IC products in order to
win potential new clients, dispersing the risks of our product portfolios.
(C) The shortening of IC product life cycle results in significant fluctuations in the
industry's state of economy
The Company provides memory IC, LCD driver IC and logic/mixed-signal
products assembly and testing services for IC design houses, IDM and IC fabs.
Because IC assembly and testing is the back-end process of IC, the demand of our
services comes from the IC industry. Therefore the prosperity or recession of the
IC industry is closely related to the development of IC assembly and testing
industry.
88

Countermeasures:
The Company has advanced technology services for the entire semiconductor
back-end process, and we actively develop markets for high-growth end products.
In addition to continuously improve the assembly and testing technology and
quality for memory IC products and display driver IC products and shorten the
delivery period, adjusting the product portfolio at any time in response to market
demands, the Company's new process products such as Wafer Level CSP and
MEMS have obtained clients' verifications. We have also actively established the
application of flip chip technology in logic/mixed-signal products. Therefore, the
Company could reduce the risk of business cycle by providing clients with more
diversified assembly and testing services through our diversified product line.
Furthermore, the Company already established long-term and stable partnerships
with existing clients, while we actively develop new clients for logic/mixed-signal
products, resulting in a full and stable application of our production capacity. The
Company has been elastically responding to the substantial amount of orders
during the IC industry boom and the reduction in orders in the industry' downturn
by carefully assessing the impact of investment plans and management plans for
personnel, machinery equipment, capital and technology. In addition, the
Company maintains a solid financial structure and this advantage also reduces the
adverse impacts on the Company's operating stability when the IC industry is
experiencing a downturn.
(D) The difficulty in the training, recruitment and retention of professional IC
assembly and testing personnel
Because R&D team is very important to IC assembly and testing, obtaining
R&D personnel with rich experience and good quality is the key to success for IC
assembly and testing companies. With the rapid development of IC industry in
recent years, the demand for professional R&D personnel keeps growing.
However, it is difficult to train and recruit professional R&D personnel. Therefore,
the Company will also have to face the unfavorable factor of the shortage of
professional R&D personnel.
Countermeasures:
In addition to establishing various internal and external education and
training systems to enhance the professional skills of the staff, the Company also
provides employee with benefits and distribute employee restricted shares,
enabling employees to share our business results, cultivating employee's
coherence to the Company. At present, the Company is also listed on the stock
market, so that our stocks would have more liquidity, enabling the Company to
89

retain the existing professional R&D talents, and become more attractive to
professional R&D personnel during recruitment.
(E) The rising of raw material costs
The main key raw materials of the Company during the assembly and testing
process are materials such as lead frame, substrate, gold wire, IC carrier board, and
resin, claiming about 30% of the materials. As a result, the rising of raw material
prices would definitely bring impacts to the IC assembly and testing industry. The
Company would have to face an even greater challenge regarding the control of
raw materials costs and inventory.
Countermeasures:
In addition to fully grasping the relevant information on changes in the raw
materials, and keeping an eye on the changes in the industry trend any time, the
Company also improve the product defect-free rate, and reduce the negative
impacts of rising costs by proposing alternative raw materials, improving the
existing process technologies and developing advanced process technologies and
other solutions, facilitating the Company to maintain a stable competitive
advantage for profits.
(F) Horizontal Competition in the Industry:
Since the IC assembly and testing industry has already matured, horizontal
competition in the same industry is quite severe.
Countermeasures:
The Company would provide clients with better quality and services,
continuing to strengthen the capability of technology R&D capabilities and
process improvement to enhance production efficiency, product quality and reduce
production costs while pursuing to maintaining client satisfaction. In addition to
actively maintaining existing long-term client relationships, we would also strive
to develop other new clients to consolidate and further strengthen our market
position.
(II) The Important Purposes and Production Process of Our Main Products
1. The Purposes of Main Products
The main products of the Company is OEM services for the assembly and testing of
products such as TSOP, FBGA, TCP, COF, COG/COP, and wafer bumping. The client's
products can be successfully applied to information, communications, office automation,
consumer electronics and other related products through the comprehensive IC assembly
and testing services provided by the Company.
90

Gold Bumping
Wafer Probe
Assembly Testing
Wafer Probe
Assembly Burn-In Testing
2. The Production Process
Memory IC Products
LCD Driver IC
(III) The Supply Status of the Main Raw Materials
The main raw materials of the Company is Gold Salt (potassium gold cyanide),
Substrate, Gold Wire, Lead Frame, Molding Compound, etc. Our suppliers for the raw
materials listed above are all well-known domestic and foreign vendors providing stable
supply, high quality products, and accurate delivery. In addition, the Company implements a
random quality inspection for the main raw materials suppliers in order to obtain a supply of
better quality.
Main Raw Materials Name of Supplier Domestic Foreign Supply Status
Gold Salt SOLAR V Good
Metalor V Good
Substrate
Ryowa V Good
Unimicron V Good
Simmtech V Good
Kinsus V Good
ZDT V Good
Gold Wire Tanaka V Good
MKE V Good
Lead Frame
SHINKO V Good
CWE V Good
Fusheng Group V Good
HDS V Good
Molding Compound
Hitachi Chemical V Good
Kyocera V Good
ShinEtsu V Good
CWE V Good
91

(IV) The Percentage of Suppliers and Customers Accounting for More than 10% of The Total
Procurement (Sales) Amount in Either of The Most Recent Two Years, The Amount and
Proportion of Procurement (Sales) from Them and The Reasons for The Change
1. Major Suppliers of the Most Recent Two Years Unit: NT$ thousands; %
2018 2019 2020 Q1 (Note)
Item Name Amount % of
Total Net Purchases
Relationship with
Issuer Name Amount
% of Total Net Purchases
Relationship withIssuer
Name Amount % of
Total Net Purchases
Relationship with
Issuer
1 SOLAR 1,193,381 26.69 None SOLAR 1,392,524 27.98 None - - - -
2 RYOWA 451,662 10.10 None RYOWA 425,465 8.55 None - - - -
Others 2,826,306 63.21 Others 3,158,394 63.47 - - - -
Total 4,471,349 100.00 Total 4,976,383 100.00 - - - -
Note: As of the publication date of the annual report, the most recent consolidated financial statements dated March 31, 2020 has not yet been approved by the Board of Directors nor reviewed by certified public accountants.
Reason of Increase / Decrease in Purchases: The statistics of our suppliers are stable and
there has been no significant change in major suppliers in the most recent 2 years.
2. Major Customers of the Most Recent Two Years Unit: NT$ thousands; %
Note: As of the publication date of the annual report, the most recent consolidated financial statements dated March 31, 2020 has not yet been approved by the Board of Directors nor reviewed by certified public accountants.
Reasons of Changes in Sales: The statistics of our sales are stable and there has been no
significant change in major customers in the most recent 2 years.
2018 2019 2020 Q1(Note)
Item Name Amount % of
Total Net Sales
Relationship with
Issuer Name Amount
% of Total Net
Sales
Relationship with
Issuer Name Amount
% of Total Net
Sales
Relationship with Issuer
1 Client A 3,794,991 20.54 None Client A 4,756,755 23.39 None - - - -
2 Client K 2,637,053 14.27 None Client K 2,419,612 11.90 None - - - -
3 Client C 1,957,467 10.59 None Client C 2,048,260 10.07 None - - - -
Others 10,090,516 54.60 Others 11,113,254 54.64 - - - -
Total 18,480,027 100.00 Total 20,337,881 100.00 - - - -
92

(V) Production of the Most Recent Two Years Unit: thousand wafers/piece;NT$ thousands
(VI) Sales in the Most Recent Two Years Unit: thousand wafers/piece;NT$ thousands
2018 2019
Domestic Sales Export Sales Domestic Sales Export Sales
Volume Value Volume Value Volume Value Volume Value
Assembly 856,050 2,718,005 1,477,424 1,961,671 809,343 2,830,377 1,937,456 2,318,500
Product Testing 2,377,283 2,681,481 93,747 209,800 2,321,729 2,438,925 114,491 165,526
Driver IC 1,555,670 4,919,732 130,982 774,988 1,701,842 6,069,481 165,838 852,724
Wafer Bumping 1,198 2,816,913 118 498,621 1,161 3,260,017 152 748,982
Wafer Testing 538 1,615,635 80 283,181 542 1,276,227 160 377,122
Total 14,751,766 3,728,261 15,875,027 4,462,854
2018 2019
Capacity Output Production
Value Capacity Output
Production
Value
Assembly 3,461,467 2,335,324 4,536,008 3,559,312 2,793,638 4,918,748
Product Testing 3,557,981 2,489,778 2,136,623 3,634,690 2,464,450 2,153,213
Driver IC 2,455,423 1,817,088 4,009,820 2,736,018 1,948,120 4,784,346
Wafer Bumping 1,836 1,317 3,161,796 1,718 1,300 3,508,572
Wafer Testing 881 639 1,038,096 992 605 1,068,219
Total 14,882,343 16,433,098
YearProduction Value
Major Product (or Departments)
YearSales
Major Product (or Departments)
93

III. Employees Status
The number of employees employed for the 2 most recent fiscal years, and during the
current fiscal year up to the date of publication of the annual report, their average years of
service, average age, and education levels (including the percentage of employees at each level)
Year 2018 2019 Current Year
as of Mar. 31, 2020
Number of
Employees
(persons)
Direct Staff 3,502 3,243 3,158
Engineering 2,125 2,075 2,036
Management 374 370 351
Total 6,001 5,688 5,545
Average Age 35.7 36.8 37.0
Average Seniority (years) 7.6 8.7 8.9
Academic
Qualifications
(%)
Ph.D. 0.1 0.1 0.1
Master 7.3 7.3 7.2
Bachelor 66.7 67.3 67.2
High School 25.5 24.9 25.0
Degree of Lower
Levels 0.4 0.4 0.5
IV. Disbursements for environmental protection
1. Any losses suffered by the company in the most recent fiscal year and up to the annual report
publication date due to environmental pollution incidents (including any compensation paid
and any violations of environmental protection laws or regulations found in environmental
inspection, specifying the disposition dates, disposition reference numbers, the articles of law
violated, and the content of the dispositions), and disclosing an estimate of possible expenses
that could be incurred currently and in the future and measures being or to be taken. If a
reasonable estimate cannot be made, an explanation of the facts of why it cannot be made
shall be provided: None.
V. Labor Relations
(I) List any employee benefit plans, continuing education, training, retirement systems, and the
status of their implementation, and the status of labor-management agreements and
measures for preserving employees' rights and interests :
The Company is responsible for handling the related welfare and benefits for the staff
according to Labor Standards Act, Labor Insurance Act, the Employee Welfare Fund Act and
the related laws and regulations and conducts regular health examination, on-the-job training
and free group insurance services. In terms of the Employee Welfare Committee, in addition
to the various subsidies granted for weddings, funerals and birth, the welfare activities will
94

be held on a regular basis. Moreover, the Company also provides shuttle bus and
dormitory to take care of staff living far, and maintain sports parks in the Science Park,
carrying out various activities of club and subsidies to enhance exchanges among various
departments and improve morale among colleagues, holding departmental social mixer so as
to promote the harmonious relationship between labor and management. Besides, the
purpose of relieving staff’s body and mind is achieved by the establishment of staff leisure
center.
(II) List any losses suffered by the company in the most recent 2 fiscal years and up to the
annual report publication date due to labor disputes (including any violations of the Labor
Standards Act found in labor inspection, specifying the disposition dates, disposition
reference numbers, the articles of law violated, the substance of the legal violations, and the
content of the dispositions), and disclosing an estimate of possible expenses that could be
incurred currently and in the future and measures being or to be taken. If a reasonable
estimate cannot be made, an explanation of the facts of why it cannot be made shall be
provided.: None.
95

VI. Material Contracts
Categories of
Contracts Parties Term Main Purpose Restrictions
Contract
Assembly
Agreement
Company I Effective on
2007/11/13 and
may be terminated
according to the
terms of the
agreement.
To provide wafer
assembly services.
1. Product quality and
defect-free rate
agreement.
2. Indemnity clauses
for IP
infringements.
Contract
Assembly
Agreement
Company I Effective on
2004/07/01 and
may be terminated
according to the
terms of the
agreement.
To provide wafer
assembly services.
1. Quality and
Product defect-free
rate agreement.
2. Indemnity clauses
for IP
infringements.
IC OEM Services
Agreement
Company K From 2015/01/01 to
2019/12/31
To provide services
for assembly,
reliability tests,
marking/remarking,
and testing.
1. Warranty against
defects.
2. Indemnity clauses
for IP
infringements.
3. Liability limitation
agreement.
Certificate of
Commitment for
Service
Company C From 2016/01/01 to
2018/12/31 with
automatic extension
and may be
terminated
according to the
terms of the
agreement.
To provide wafer
processing
services.
1. Product defect-free
rate agreement.
2. Indemnity clauses
for IP
infringements.
IC Processing and
Assembly
Contract
Company M Effective on
2010/01/01 with
automatic extension
and may be
terminated
according to the
terms of the
agreement.
To provide IC
assembly services.
1. Product defect-free
rate agreement.
2. Indemnity clauses
for IP
infringements.
96

Categories of
Contracts Parties Term Main Purpose Restrictions
IC Assembly and
Testing Contract
Company G From 2018/07/01 to
2020/06/30
To provide IC
assembly and
testing services.
1. Product defect-free
rate agreement.
2. Indemnity clauses
for IP
infringements.
Service
Agreement
Company W Effective on
2013/07/01 and
may be terminated
according to the
terms of the
agreement.
To provide IC
assembly and
testing services.
1. Product quality and
defect-free rate
agreement.
2. Indemnity clauses
for IP
infringements.
Technology
Transfer
Agreement
Unimos
Microelectronics
(Shanghai) Co.,
Ltd.
From 2012/08/01 to
2022/07/31
(Termination on
2020/04/01)
To grant a license
to use patents.
1. Royalty agreement.
2. Liability clauses.
Technology
Transfer and
License
Agreement
Unimos
Microelectronics
(Shanghai) Co.,
Ltd.
From 2016/12/23 to
2039/12/22
(Termination on
2020/04/01)
To grant a license
to use patents.
1. Royalty agreement.
2. Liability clauses.
Joint Credit Facility Agreement and Amendment
Cooperative Bank; Bank of Taiwan; Land Bank of Taiwan; Taishin International Bank; Hua Nan Bank; Chang Hwa Bank; Yuanta Bank; First Bank; Shin Kong Commercial Bank; Bank of Panshin; Mega Bank.
Effective from 2018/05/15 to the date in which the Company performed all obligations of the credit facility agreement.
The banks jointly provided a loan for the Company. The total loan amount is NT$12 billion.
1. The Company made a commitment that it shall not perform specific actions except with the consent of the banks group, and it shall comply with relevant agreements including the financial matters.
2. Collaterals are provided to secure the loan.
97

Categories of
Contracts Parties Term Main Purpose Restrictions
Land Lease
Agreement
Southern Taiwan
Science Park
Bureau
From 2014/07/01 to
2024/06/30
To lease lands from
the Southern
Taiwan Science
Park Bureau.
1. Punitive damage
clauses.
2. Rent agreement
3. Early termination
clause.
Land Lease
Agreement
Southern Taiwan
Science Park
Bureau
From 2012/04/03 to
2032/04/02
To lease lands from
the Southern
Taiwan Science
Park Bureau.
1. Punitive damage
clauses.
2. Rent agreement
3. Early termination
clause.
Land Lease
Agreement
Hsinchu Science
Park Bureau
From 2008/09/18 to
2027/12/31
To lease lands from
the Hsinchu
Science Park
Bureau.
1. Punitive damage
clauses.
2. Rent and joint
liability agreement
3. Early termination
clause.
Land Lease
Agreement
Hsinchu Science
Park Bureau
From 2014/08/01 to
2034/07/31
To lease lands from
the Hsinchu
Science Park
Bureau.
1. Punitive damage
clauses.
2. Rent and joint
liability agreement
3. Early termination
clause.
Supply and
Precious Metals
Recovery
Contract and
Amendments
Solar Applied
Materials
Technology
Corporation
From 2016/09/01 to
2021/12/31
To supply materials
required for the
gold bumping
business.
Price calculation and
delivery period.
Supply
Agreement
Ryowa Co., Ltd. From 2014/09/01 to
2019/08/31 with
automatic extension
and may be
terminated
according to the
terms of the
agreement.
To supply materials
required for the IC
assembly business.
1. Payment terms.
2. Warranty and
liability clauses.
98

VI. Financial Information I. The last five years and as of the publication data of the annual report, the most recent
condensed Balance Sheets and Statements of Comprehensive Income (Based on International
Financial Reporting Standards)
(I) Condensed Balance Sheets
(1) Consolidated Financial Statements Unit: NT$ thousands
YearItem
Financial Summary for The Last 5 Years (Note 1) Financial information
of the current year
as of March 31,
2020 (Note 2)
2015 (adjusted) 2016 2017 2018 2019
Current assets 18,108,392 16,895,957 14,200,980 11,888,143 11,762,346 -Property, plant and equipment 14,211,560 13,497,218 15,265,311 16,819,621 17,979,444 -
Intangible assets - - - - - -Other assets 697,915 902,785 3,793,651 4,425,954 4,564,097 -Total assets 33,017,867 31,295,960 33,259,942 33,133,718 34,305,887 -
Current liabilities
Before distribution 6,186,136 4,664,500 6,670,608 5,190,195 4,901,701 -
After distribution 7,978,689 5,521,254 6,927,414 6,062,913 Note 3 -
Non-current liabilities 5,596,570 10,357,946 8,195,998 9,872,712 9,752,947 -
Total liabilities
Before distribution 11,782,706 15,022,446 14,866,606 15,062,907 14,654,648 -
After distribution 13,575,259 15,879,200 15,123,412 15,935,625 Note 3 -
Equity attributable to equity holders of the Company
19,107,629 16,273,514 18,393,336 18,070,811 19,651,239 -
Capital stock 8,962,066 8,869,663 8,862,971 7,528,577 7,272,401 -Capital surplus 3,755,849 6,888,826 6,288,377 6,280,482 6,059,651 -
Retained earnings
Before distribution 6,773,369 1,424,638 4,237,941 5,104,542 6,338,989 -
After distribution 4,980,816 1,167,612 3,981,135 4,231,824 Note 3 -
Other equity interest (383,655) 98,041 11,701 119,713 (19,802) -Treasury stock - (1,007,654) (1,007,654) (962,503) - -Non-controlling interests - - - - - -Equity attributable topredecessors' interests under common control
2,127,532 - - - - -
Total equity
Before distribution 21,235,161 16,273,514 18,393,336 18,070,811 19,651,239 -
After distribution 19,442,608 15,416,760 18,136,530 17,198,093 Note 3 -
Note1: The last 5 years financial information had been audited by certified public accountants. Note2: As of the publication date of the annual report, the most recent consolidated financial report dated March 31,
2020 has not yet been approved by the Board of Directors nor reviewed by certified public accountants. Note 3: As of the publication date of the annual report, 2019 earnings distribution has not yet been ratified by the Shareholders' Meeting, thus the amount after distribution is unlisted.
99
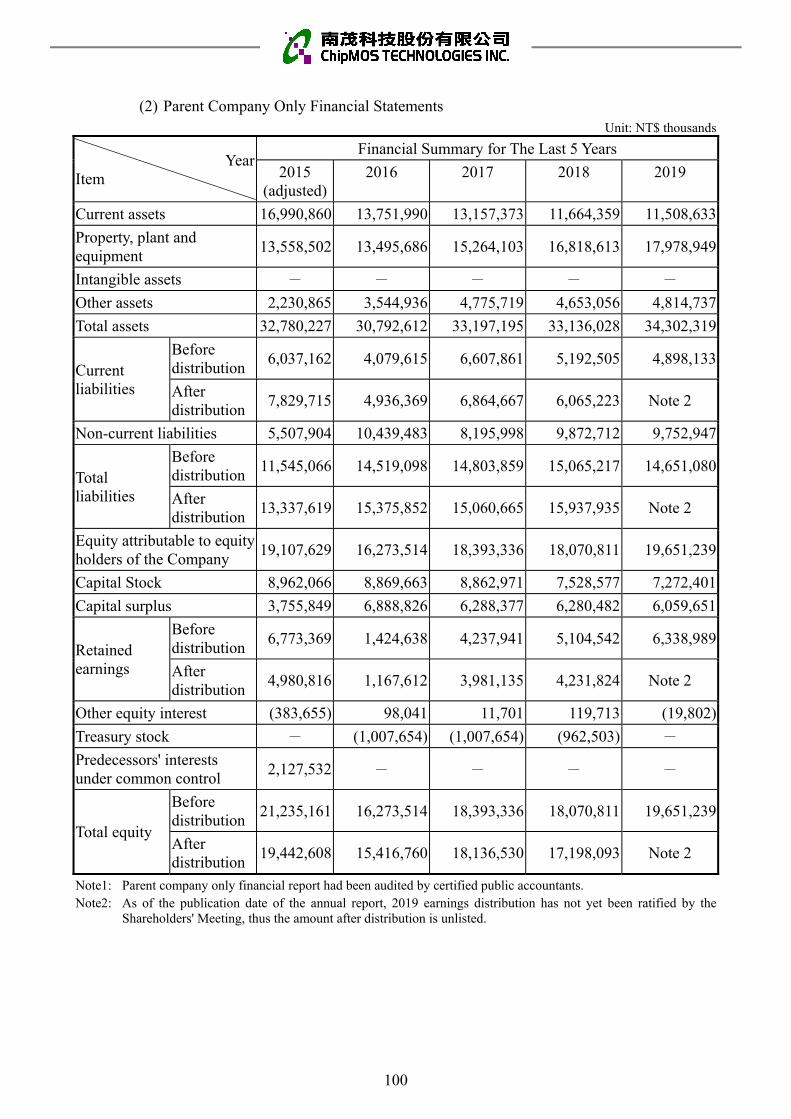
(2) Parent Company Only Financial Statements Unit: NT$ thousands
Year Item
Financial Summary for The Last 5 Years
2015 (adjusted)
2016
2017
2018
2019
Current assets 16,990,860 13,751,990 13,157,373 11,664,359 11,508,633
Property, plant and equipment
13,558,502 13,495,686 15,264,103 16,818,613 17,978,949
Intangible assets - - - - -
Other assets 2,230,865 3,544,936 4,775,719 4,653,056 4,814,737
Total assets 32,780,227 30,792,612 33,197,195 33,136,028 34,302,319
Current liabilities
Before distribution
6,037,162 4,079,615 6,607,861 5,192,505 4,898,133
After distribution
7,829,715 4,936,369 6,864,667 6,065,223 Note 2
Non-current liabilities 5,507,904 10,439,483 8,195,998 9,872,712 9,752,947
Total liabilities
Before distribution
11,545,066 14,519,098 14,803,859 15,065,217 14,651,080
After distribution
13,337,619 15,375,852 15,060,665 15,937,935 Note 2
Equity attributable to equity holders of the Company
19,107,629 16,273,514 18,393,336 18,070,811 19,651,239
Capital Stock 8,962,066 8,869,663 8,862,971 7,528,577 7,272,401
Capital surplus 3,755,849 6,888,826 6,288,377 6,280,482 6,059,651
Retained earnings
Before distribution
6,773,369 1,424,638 4,237,941 5,104,542 6,338,989
After distribution
4,980,816 1,167,612 3,981,135 4,231,824 Note 2
Other equity interest (383,655) 98,041 11,701 119,713 (19,802)
Treasury stock - (1,007,654) (1,007,654) (962,503) -
Predecessors' interests under common control
2,127,532 - - - -
Total equity
Before distribution
21,235,161 16,273,514 18,393,336 18,070,811 19,651,239
After distribution
19,442,608 15,416,760 18,136,530 17,198,093 Note 2
Note1: Parent company only financial report had been audited by certified public accountants. Note2: As of the publication date of the annual report, 2019 earnings distribution has not yet been ratified by the
Shareholders' Meeting, thus the amount after distribution is unlisted.
100

(II) Condensed Statements of Comprehensive Income
(1) Consolidated Financial Statements Unit: NT$ thousands, except earnings per share
Year Item
Financial Summary for The Last 5 Years (Note 1) Financial information
of the current
year as ofMarch 31,
2020 (Note 2)
2015 (adjusted) 2016 2017 2018 2019
Revenue 18,837,089 18,387,593 17,940,855 18,480,027 20,337,881 -
Gross profit 4,151,575 3,642,121 3,237,126 3,429,995 3,926,139 -
Operating profit 2,648,427 1,998,575 2,239,881 2,099,721 2,457,119 -
Non-operating income (expenses) 197,629 (298,140) (724,394) (317,279) 573,200 -
Profit before income tax 2,846,056 1,700,435 1,515,487 1,782,442 3,030,319 -
Profit for the year from continuing operations 2,010,346 1,348,385 1,211,575 1,103,075 2,584,161 -
Profit (loss) for the year from discontinued operations
(34,233) (122,105) 1,814,953 - - -
Profit for the year 1,976,113 1,226,280 3,026,528 1,103,075 2,584,161 -
Other comprehensive loss, net of income tax (47,200) (236,421) (189,902) (32,829) (123,772) -
Total comprehensive income for the year 1,928,913 989,859 2,836,626 1,070,246 2,460,389 -
Profit attributable to equity holders of the Company 2,230,469 1,532,292 3,026,528 1,103,075 2,584,161 -
Loss attributable to predecessors' interests under common control
(291,429) (306,012) - - - -
Profit attributable to non-controlling interests 37,073 - - - - -
Comprehensive income attributable to equity holders of the Company
2,205,275 1,295,871 2,836,626 1,070,246 2,460,389 -
Comprehensive loss attributable to predecessors' interests under common control
(291,429) (306,012) - - - -
Comprehensive income attributable to non-controlling interests
15,067 - - - - -
Earnings per share : equity holders of the Company 2.54 1.78 3.57 1.37 3.55 -
Earnings per share : predecessors' interests under common control
(0.33) (0.35) - - - -
Note1: The last 5 years financial information had been audited by the certified public accountants. Note2: As of the publication date of the annual report, the most recent consolidated financial report dated March 31,
2020 has not yet been approved by the Board of Directors nor reviewed by certified public accountants.
101

(2) Parent Company Only Financial Statements Unit: NT$ thousands, except earnings per share
Year Item
Financial Summary for The Last 5 Years
2015 (adjusted)
2016 2017 2018 2019
Revenue 18,275,095 18,389,205 17,941,102 18,480,027 20,337,881
Gross profit 3,955,276 3,643,246 3,236,803 3,429,995 3,926,139
Operating income 2,546,351 2,020,291 2,343,113 2,123,300 2,455,170
Non-operating income (expenses)
206,612 (442,959) 985,503 (342,005) 573,120
Profit before income tax 2,752,963 1,577,332 3,328,616 1,781,295 3,028,290
Profit for the year from continuing operations
1,939,040 1,226,280 3,026,528 1,103,075 2,584,161
Profit (loss) for the year from discontinued operations
- - - - -
Profit for the year 1,939,040 1,226,280 3,026,528 1,103,075 2,584,161
Other comprehensive loss,net of income tax
(25,194) (236,421) (189,902) (32,829) (123,772)
Total comprehensive income for the year
1,913,846 989,859 2,836,626 1,070,246 2,460,389
Profit attributable to equity holders of the Company
2,230,469 1,532,292 3,026,528 1,103,075 2,584,161
Loss attributable to predecessors' interests under common control
(291,429) (306,012) - - -
Profit attributable to non-controlling interests
- - - - -
Comprehensive income attributable to equity holders of the Company
2,205,275 1,295,871 2,836,626 1,070,246 2,460,389
Comprehensive loss attributable to predecessors' interests under common control
(291,429) (306,012) - - -
Comprehensive income attributable to non-controlling interests
- - - - -
Earnings per share : equity holders of the Company
2.54 1.78 3.57 1.37 3.55
Earnings per share : predecessors' interests under common control
(0.33) (0.35) - - -
Note: The parent company only financial reports had been audited by the certified public accountants.
102

(III) Auditors’ Name and Opinions
Year Accounting firm CPA Audit opinion
2015 PricewaterhouseCoopers,
Taiwan
Chun-Yuan Hsiao,
Chih-Cheng Hsieh Modified unqualified opinion
2016 PricewaterhouseCoopers,
Taiwan
Chun-Yuan Hsiao,
Chih-Cheng Hsieh Unqualified opinion
2017 PricewaterhouseCoopers,
Taiwan
Chun-Yuan Hsiao,
Chih-Cheng Hsieh Unqualified opinion
2018 PricewaterhouseCoopers,
Taiwan
Chun-Yuan Hsiao,
Chih-Cheng Hsieh Unqualified opinion
2019 PricewaterhouseCoopers,
Taiwan
Chun-Yuan Hsiao,
Chih-Cheng Hsieh Unqualified opinion
103
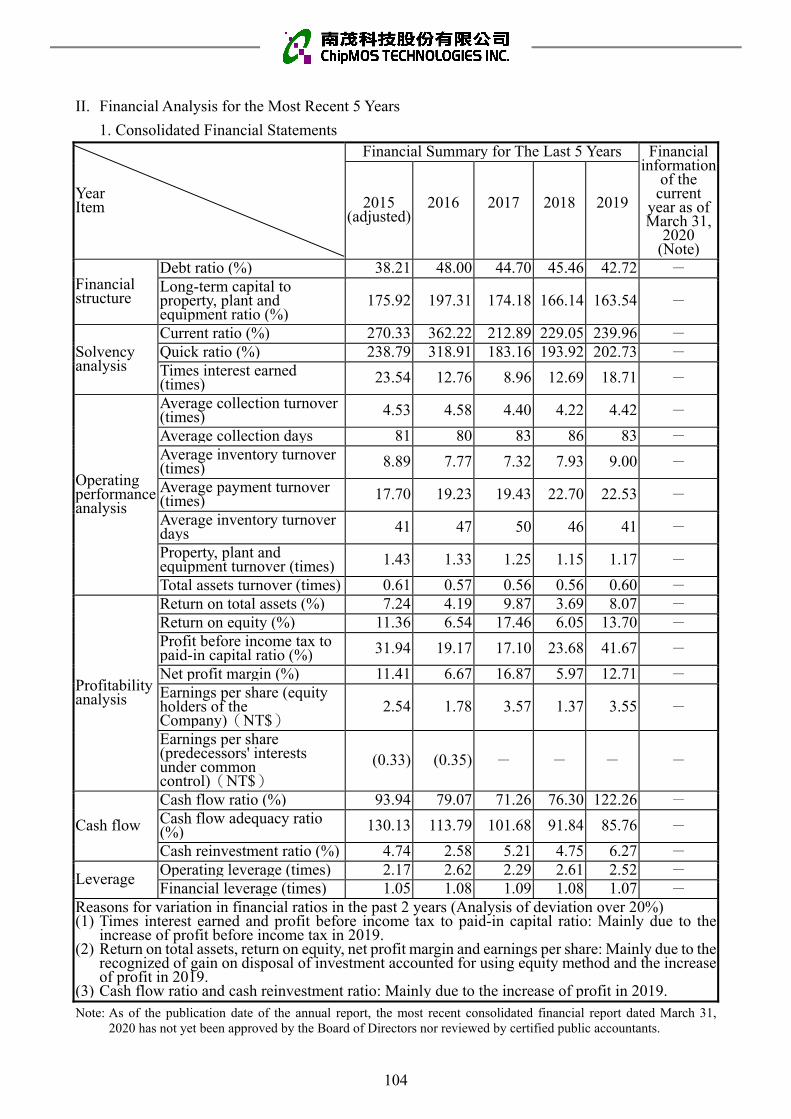
II. Financial Analysis for the Most Recent 5 Years
1. Consolidated Financial Statements
Year Item
Financial Summary for The Last 5 Years Financial information
of the current
year as ofMarch 31,
2020 (Note)
2015 (adjusted)
2016
2017
2018
2019
Financial structure
Debt ratio (%) 38.21 48.00 44.70 45.46 42.72 -Long-term capital to property, plant and equipment ratio (%)
175.92 197.31 174.18 166.14 163.54 -
Solvency analysis
Current ratio (%) 270.33 362.22 212.89 229.05 239.96 -Quick ratio (%) 238.79 318.91 183.16 193.92 202.73 -Times interest earned (times) 23.54 12.76 8.96 12.69 18.71 -
Operating performance analysis
Average collection turnover (times) 4.53 4.58 4.40 4.22 4.42 -
Average collection days 81 80 83 86 83 -Average inventory turnover (times) 8.89 7.77 7.32 7.93 9.00 -
Average payment turnover (times) 17.70 19.23 19.43 22.70 22.53 -
Average inventory turnover days 41 47 50 46 41 -
Property, plant and equipment turnover (times) 1.43 1.33 1.25 1.15 1.17 -
Total assets turnover (times) 0.61 0.57 0.56 0.56 0.60 -
Profitability analysis
Return on total assets (%) 7.24 4.19 9.87 3.69 8.07 -Return on equity (%) 11.36 6.54 17.46 6.05 13.70 -Profit before income tax to paid-in capital ratio (%) 31.94 19.17 17.10 23.68 41.67 -
Net profit margin (%) 11.41 6.67 16.87 5.97 12.71 -Earnings per share (equity holders of the
( )Company) NT$ 2.54 1.78 3.57 1.37 3.55 -
Earnings per share (predecessors' interests under common
( )control) NT$ (0.33) (0.35) - - - -
Cash flow
Cash flow ratio (%) 93.94 79.07 71.26 76.30 122.26 -Cash flow adequacy ratio (%) 130.13 113.79 101.68 91.84 85.76 -
Cash reinvestment ratio (%) 4.74 2.58 5.21 4.75 6.27 -
Leverage Operating leverage (times) 2.17 2.62 2.29 2.61 2.52 -Financial leverage (times) 1.05 1.08 1.09 1.08 1.07 -
Reasons for variation in financial ratios in the past 2 years (Analysis of deviation over 20%)(1) Times interest earned and profit before income tax to paid-in capital ratio: Mainly due to the
increase of profit before income tax in 2019. (2) Return on total assets, return on equity, net profit margin and earnings per share: Mainly due to the
recognized of gain on disposal of investment accounted for using equity method and the increase of profit in 2019.
(3) Cash flow ratio and cash reinvestment ratio: Mainly due to the increase of profit in 2019.Note: As of the publication date of the annual report, the most recent consolidated financial report dated March 31,
2020 has not yet been approved by the Board of Directors nor reviewed by certified public accountants.
104

2. Parent Company Only Financial Statements
Yearitem
Financial Summary for The Last 5 Years2015
(adjusted) 2016 2017 2018 2019
Financial structure
Debt ratio (%) 35.22 47.15 44.59 45.46 42.71Long-term capital to property, plant and equipment ratio(%) 197.24 197.94 174.20 166.15 163.55
Solvency analysis
Current ratio (%) 281.44 337.09 199.12 224.64 234.96Quick ratio (%) 253.34 288.67 169.10 189.52 197.70Times interest earned 22.64 11.91 18.48 12.69 18.73
Operating performance analysis
Average collection turnover (times) 5.00 4.72 4.40 4.22 4.42
Average collection days 73 77 83 86 83Average inventory turnover (times) 8.83 8.07 7.32 7.93 9.00
Average payment turnover (times) 22.52 20.19 19.43 22.70 22.53
Average inventory turnover days 41 45 50 46 41Property, plant and equipment turnover (times) 1.35 1.36 1.25 1.15 1.17
Total assets turnover (times) 0.58 0.58 0.56 0.56 0.6
Profitability analysis
Return on total assets (%) 6.44 4.24 9.95 3.69 8.07Return on equity (%) 9.61 6.54 17.46 6.05 13.70Profit before income tax to paid-in capital ratio (%) 30.72 17.78 37.56 23.66 41.64
Net profit margin (%) 10.61 6.67 16.87 5.97 12.71Earnings per share (equity holders of the
( )Company) NT$ 2.54 1.78 3.57 1.37 3.55
Earnings per share (predecessors' interests under
( )common control) NT$(0.33) (0.35) - - -
Cash flow Cash flow ratio (%) 113.75 101.48 72.81 81.30 122.10Cash flow adequacy ratio (%) 161.00 141.40 112.17 97.18 95.16Cash reinvestment ratio (%) 6.65 3.19 5.29 5.09 6.26
Leverage Operating leverage (times) 2.10 2.53 1.90 1.98 1.95Financial leverage (times) 1.05 1.08 1.06 1.05 1.05
Reasons for variation in financial ratios in the past two years (no analysis is required for variations below 20%) (1) Times interest earned and profit before income tax to paid-in capital ratio: Mainly due to the
increase of profit before income tax in 2019. (2) Return on total assets, return on equity, net profit margin and earnings per share: Mainly due to
the recognized of gain on disposal of investment accounted for using equity method and the increase of profit in 2019.
(3) Cash flow ratio and cash reinvestment ratio: Mainly due to the increase of profit in 2019.Note1: The computation formulas used in financial analysis are listed as follows (the opening balance of property,
plant and equipment and total assets are based on the CPA-audited IFRS numbers on December 31, 2013). Note2: The following computation formulas shall be listed at the end of this statement of the annual report:
105

1. Financial Structure
(1) Debt ratio = total liabilities / total assets
(2) Ratio of long-term capital to property, plant and equipment = (total shareholders' equity + non-current
liabilities) / net property, plant and equipment
2. Solvency analysis
(1) Current ratio = current assets / current liabilities
(2) Quick ratio = (current assets – inventories – prepaid expenses) / current liabilities
(3) Times interest earned = profit before income tax and interest expenses / interest expenses
3. Operating performance analysis
(1) Average collection turnover = net revenue / average accounts receivable (including accounts receivable
and notes receivable arising from operations)
(2) Average collection days= 365 / account receivables turnover
(3) Average inventory turnover = cost of revenue / average inventory
(4) Average payment turnover = cost of revenue / average accounts payable (including accounts payable and
notes payable arising from operations)
(5) Average inventory turnover days = 365 / inventory turnover
(6) Property, plant and equipment turnover = net revenue / average net property, plant and equipment
(7) Total asset turnover = net revenue / average total assets
4. Profitability analysis
(1) Return on total assets = [net profit + interest expenses (1- effective tax rate)] / average total assets
(2) Return on stareholders' equity = net profit / average stareholders' equity
(3) Net profit margin = net profit / net revenue
(4) Earnings per share = (profit attributable to equity holders of the company–preferred stock dividends) /
weighted average number of shares outstanding
5. Cash flow
(1) Cash flow ratio = Net cash provided by operating activities / current liabilities
(2) Cash flow adequacy ratio = five-year sum of cash from operation / (five-year sum of capital
expenditures, inventory additions and cash dividend)
(3) Cash reinvestment ratio = (Net cash flow from operating activities – cash dividend) / gross property,
plant and equipment + long-term investments + other non-current assets + working capital)
6. Leverage:
(1) Operating leverage = (net revenue – variable operating costs and expenses) / operating profit
(2) Financial leverage = operating profit / (operating profit - interest expenses)
106

III. Audit Committee’s Report of the Most Recent Year
Audit Committee's Review Report
The Board of Directors has prepared the Company's 2019 Business Report, Financial Statements, and
proposal for allocation of earnings. The audit firm of PricewaterhouseCoopers, Taiwan was retained
to audit the Company's Financial Statements and has issued an audit report. The Business Report,
Financial Statements, and earnings allocation proposal have been reviewed and determined to be
correct and accurate by the Audit Committee members of the Company. According to relevant
requirements of Article 14-4 of the Securities and Exchange Act and Article 219 of the Company Act,
the Audit Committee hereby submits this report.
ChipMOS TECHNOLOGIES INC.
Convener of the Audit Committee: Chin-Shyh Ou
March 10, 2020
107

REPORT OF INDEPENDENT ACCOUNTANTS
To the Board of Directors and Shareholders of ChipMOS TECHNOLOGIES INC.
OpinionWe have audited the accompanying consolidated balance sheets of ChipMOS TECHNOLOGIES INC. and its subsidiaries (the “Group”) as of December 31, 2019 and 2018, and the related consolidated statements of comprehensive income, of changes in equity and of cash flows for the years then ended, and the notes to the consolidated financial statements, including a summary of significant accounting policies.
In our opinion, based on our audits and the report of other independent accountants, as described in the Other matters section of our report, the accompanying consolidated financial statements present fairly, in all material respects, the consolidated financial position of the Group as of December 31, 2019 and 2018, and its consolidated financial performance and its consolidated cash flows for the years then ended, in accordance with the “Regulations Governing the Preparations of Financial Reports by Securities Issuers” and the International Financial Reporting Standards, International Accounting Standards, IFRIC Interpretations, and SIC Interpretations as endorsed by the Financial Supervisory Commission.
Basis for opinionWe conducted our audits in accordance with the “Regulations Governing Auditing and Attestation of Financial Statements by Certified Public Accountants” and generally accepted auditing standards in the Republic of China (“ROC GAAS”). Our responsibilities under those standards are further described in the Independent Accountant’s Responsibilities for the Audit of the Consolidated Financial Statements section of our report. We are independent of the Group in accordance with the Code of Professional Ethics for Certified Public Accountants in the Republic of China (the “Code”), and we have fulfilled our other ethical responsibilities in accordance with this Code. Based on our audits and the report of other independent accountants, we believe that the audit evidence we have obtained is sufficient and appropriate to provide a basis for our opinion.
Key audit mattersKey audit matters are those matters that, in our professional judgment, were of most significance in our audit of the consolidated financial statements of the current period. These matters were addressed in the context of our audit of the consolidated financial statements as a whole and, in forming our opinion thereon, we do not provide a separate opinion on these matters.
IV. Financial Report of the Most Recent Year
108

Key audit matters for the Group’s consolidated financial statements of the year ended December 31, 2019 are stated as follows:
Measuring progress towards complete satisfaction of performance obligation
Description
Please refer to Note 4(27) to the consolidated financial statements for the accounting policies on revenue recognition; Note 5(2) for uncertainty of accounting estimates and assumptions of revenue recognition; and Note 6(21) for details of the revenue.
The Group’s revenue is primarily generated from the assembly and testing services of high-integration and high-precision integrated circuits based on customer’s specification, and is recognized based on measuring progress towards complete satisfaction of performance obligation during the service period. For assembly services, services for Liquid Crystal Display and other Flat-Panel Display Driver Semiconductors and Bumping, the Group recognizes revenue on the basis of input costs to the satisfaction of performance obligation relative to the total expected input costs to the satisfaction of that performance obligation. Since the total expected input costs is uncertain and subject to management’s significant estimation, measuring progress towards complete satisfaction of performance obligation was identified as a key audit matter.
How our audit addressed the matter
Our key audit procedures performed in respect of the above included the following:
1. Interviewed with management to understand and evaluate the accounting policies on revenuerecognition, and validated the design and operating effectiveness of respective internal controls.
2. Validated management’s assessment on progress completion of performance obligation, and testedthe logics applied on calculating the progress completion of performance obligation.
3. Verified the related documents provided by management, validated management reports in relationto the calculation on progress completion of performance obligation, and tested the accuracy ofrevenue recognition.
109

Provisions for deficiency compensation
Description
Please refer to Note 4(21) to the consolidated financial statements for the accounting policies on provisions; Note 5(1) for uncertainty of accounting estimates and assumptions of provisions; and Note 6(11) for the details of the provisions for deficiency compensation.
The Group is primarily engaged in assembly and testing services for high-integration and high-precision integrated circuits. In case of deficiencies in the assembly and testing services provided, the Group has to clarify the reason for such deficiencies and attribute responsibilities, and determine whether to provide related provisions. Since the timing and amount of deficiency compensation are uncertain, and subject to management’s significant judgment, the provision for deficiency compensation was identified as a key audit matter.
How our audit addressed the matter
Our key audit procedures performed in respect of the above included the following:1. Interviewed with management and verified the internal process on estimating provisions for
deficiency compensation, and the consistency of process application during the financial reportingperiods.
2. Validated related documents and evidence provided by management, sampled and tested thereasonableness of providing and reversing provisions for deficiency compensation during the currentperiod.
3. Reviewed significant payments made subsequent to the reporting period and validated thereasonableness of provisions for deficiency compensation.
Other mattersThe report of the other independent accountants
We did not audit the financial statements of a certain investee company accounted for using equity method. Those financial statements were audited by other independent accountants, whose reports thereon have been furnished to us, and our opinion expressed herein, insofar as it relates to the amounts included in the consolidated financial statements and the information on the investee disclosed in Note 13 was based solely on the reports of the other independent accountants. Investments in this investee company amounted to NT$249,793 thousand and NT$406,792 thousand, respectively, representing 0.7% and 1.2% of total consolidated assets as of December 31, 2019 and 2018, and total net comprehensive income including the share of profit and other comprehensive income of associate accounted for using equity method amounted to NT$69,570 thousand and NT$39,245 thousand, representing 2.8% and 3.7% of total consolidated comprehensive income for the years then ended, respectively.
110

Parent company only financial reports
We have audited and expressed an unmodified opinion on the parent company only financial statements of ChipMOS TECHNOLOGIES INC. as of and for the years ended December 31, 2019 and 2018.
Responsibilities of management and those charged with governance for the consolidated financial statementsManagement is responsible for the preparation and fair presentation of the consolidated financial statements in accordance with the “Regulations Governing the Preparations of Financial Reports by Securities Issuers” and the International Financial Reporting Standards, International Accounting Standards, IFRIC Interpretations, and SIC Interpretations as endorsed by the Financial Supervisory Commission, and for such internal controls as management determines are necessary to enable the preparation of consolidated financial statements that are free from material misstatement, whether due to fraud or error.
In preparing the consolidated financial statements, management is responsible for assessing the Group’s ability to continue as a going concern, disclosing, as applicable, matters related to going concern and using the going concern basis of accounting unless management either intends to liquidate the Group or to cease operations, or has no realistic alternative but to do so.
Those charged with governance, including the Audit Committee, are responsible for overseeing the Group’s financial reporting process.
Independent accountant’s responsibilities for the audit of the consolidated financial statementsOur objectives are to obtain reasonable assurance about whether the consolidated financial statements as a whole are free from material misstatement, whether due to fraud or error, and to issue a report that includes our opinion. Reasonable assurance is a high level of assurance, but it is not a guarantee that an audit conducted in accordance with ROC GAAS will always detect a material misstatement when it exists. Misstatements can arise from fraud or error and are considered material if, individually or in the aggregate, they could reasonably be expected to influence the economic decisions of users taken on the basis of these consolidated financial statements.
111

As part of an audit in accordance with ROC GAAS, we exercise professional judgment and maintain professional skepticism throughout the audit. We also:
1. Identify and assess the risks of material misstatement of the consolidated financial statements, whetherdue to fraud or error, design and perform audit procedures responsive to those risks, and obtain auditevidence that is sufficient and appropriate to provide a basis for our opinion. The risk of not detectinga material misstatement resulting from fraud is higher than for one resulting from error, as fraud mayinvolve collusion, forgery, intentional omissions, misrepresentations, or the override of internalcontrols.
2. Obtain an understanding of internal controls relevant to the audit in order to design audit proceduresthat are appropriate in the circumstances, but not for the purpose of expressing an opinion on theeffectiveness of the Group’s internal controls.
3. Evaluate the appropriateness of accounting policies used and the reasonableness of accountingestimates and related disclosures made by management.
4. Conclude on the appropriateness of management’s use of the going concern basis of accounting and,based on the audit evidence obtained, whether a material uncertainty exists related to events orconditions that may cast significant doubt on the Group’s ability to continue as a going concern. If weconclude that a material uncertainty exists, we are required to draw attention in our report to the relateddisclosures in the consolidated financial statements or, if such disclosures are inadequate, to modifyour opinion. Our conclusions are based on the audit evidence obtained up to the date of our report.However, future events or conditions may cause the Group to cease to continue as a going concern.
5. Evaluate the overall presentation, structure and content of the consolidated financial statements,including the footnote disclosures, and whether the consolidated financial statements represent theunderlying transactions and events in a manner that achieves fair presentation.
6. Obtain sufficient appropriate audit evidence regarding the financial information of the entities orbusiness activities within the Group to express an opinion on the consolidated financial statements.We are responsible for the direction, supervision and performance of the Group’s audit. We remainsolely responsible for our audit opinion.
We communicate with those charged with governance regarding the planned scope and timing of the audit and significant audit findings, including any significant deficiencies in internal control that we identify during our audit.
We also provide those charged with governance with a statement that we have complied with relevant ethical requirements regarding independence, and to communicate with them all relationships and other matters that may reasonably be thought to bear on our independence, and where applicable, related safeguards.
112
From the matters communicated with those charged with governance, we determine those matters that were of most significance in the audit of the consolidated financial statements of the current period and are therefore the key audit matters. We describe these matters in our report unless law or regulation precludes public disclosure about the matter or when, in extremely rare circumstances, we determine that a matter should not be communicated in our report because the adverse consequences of doing so would reasonably be expected to outweigh the public interest benefits of such communication.
Chun-Yuan Hsiao Chih-Cheng Hsieh For and on behalf of PricewaterhouseCoopers, TaiwanMarch 10, 2020
----------------------------------------------------------------------------------------------------------------------------------------------------
The accompanying consolidated financial statements are not intended to present the financial position and results of operations and cash flows in accordance with accounting principles generally accepted in countries and jurisdictions other than the Republic of China. The standards, procedures and practices in the Republic of China governing the audit of such financial statements may differ from those generally accepted in countries and jurisdictions other than the Republic of China. Accordingly, the accompanying consolidated financial statements and report of independent accountants are not intended for use by those who are not informed about the accounting principles or auditing standards generally accepted in the Republic of China, and their applications in practice.
/s/ Chun-Yuan Hsiao /s/ Chih-Cheng Hsieh
113

ChipMOS TECHNOLOGIES INC. AND SUBSIDIARIESCONSOLIDATED BALANCE SHEETS
(Expressed in thousands of New Taiwan dollars)
December 31, 2019 December 31, 2018
Assets Notes Amount % Amount %
Current assets
1100 Cash and cash equivalents 6(1) $ 4,704,084 14 $ 4,642,522 15
1136 Current financial assets at amortized cost 6(2) 168,970 1 169,168 1
1140 Current contract assets 6(21) 377,869 1 299,835 1
1150 Notes receivable, net 765 - 1,595 -
1170 Accounts receivable, net 6(3) 4,452,904 13 4,745,693 14
1180 Accounts receivable related parties, net 1,045 - 140 -
1200 Other receivables 89,676 - 63,037 -
1210 Other receivables related parties 2,948 - 3,131 -
1220 Current tax assets 138,941 - 139,595 -
130X Inventories 6(4) 1,767,642 5 1,778,835 5
1410 Prepayments 57,502 - 44,592 -
11XX Total current assets 11,762,346 34 11,888,143 36
Non-current assets
1510 Non-current financial assets at fair value through profit or
loss
6(5)11,038 - 11,471 -
1517 Non-current financial assets at fair value through other
comprehensive income
6(6)121,808 - 174,357 1
1535 Non-current financial assets at amortized cost 6(2) and 8 68,450 - 99,103 -
1550 Investments accounted for using equity method 6(7) 3,392,910 10 3,863,741 11
1600 Property, plant and equipment 6(8) and 8 17,979,444 53 16,819,621 51
1755 Right-of-use assets 6(9) 687,068 2 - -
1840 Deferred tax assets 6(28) 194,552 1 226,716 1
1920 Refundable deposits 21,145 - 22,006 -
1990 Other non-current assets 67,126 - 28,560 -
15XX Total non-current assets 22,543,541 66 21,245,575 64
1XXX Total assets $ 34,305,887 100 $ 33,133,718 100
(Continued)
114
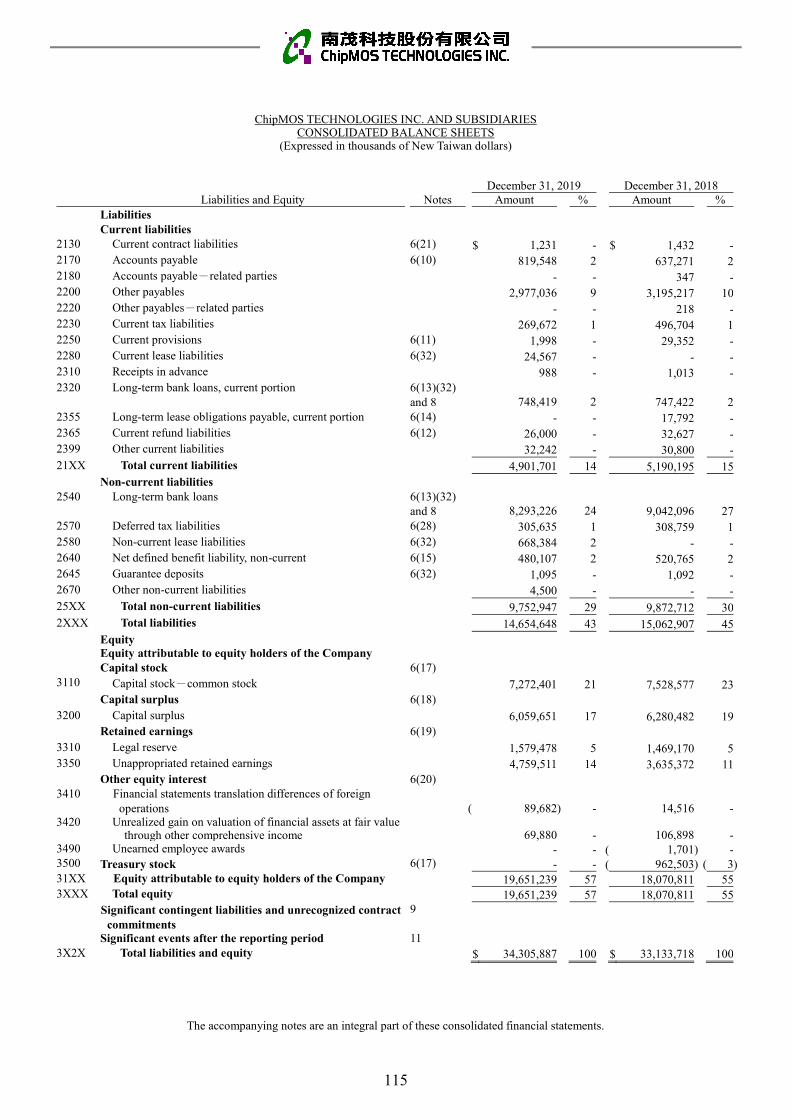
ChipMOS TECHNOLOGIES INC. AND SUBSIDIARIESCONSOLIDATED BALANCE SHEETS
(Expressed in thousands of New Taiwan dollars)
The accompanying notes are an integral part of these consolidated financial statements.
December 31, 2019 December 31, 2018Liabilities and Equity Notes Amount % Amount %
LiabilitiesCurrent liabilities
2130 Current contract liabilities 6(21) $ 1,231 - $ 1,432 -2170 Accounts payable 6(10) 819,548 2 637,271 22180 Accounts payable related parties - - 347 -2200 Other payables 2,977,036 9 3,195,217 102220 Other payables related parties - - 218 -2230 Current tax liabilities 269,672 1 496,704 12250 Current provisions 6(11) 1,998 - 29,352 -2280 Current lease liabilities 6(32) 24,567 - - -2310 Receipts in advance 988 - 1,013 -2320 Long-term bank loans, current portion 6(13)(32)
and 8 748,419 2 747,422 22355 Long-term lease obligations payable, current portion 6(14) - - 17,792 -2365 Current refund liabilities 6(12) 26,000 - 32,627 -2399 Other current liabilities 32,242 - 30,800 -21XX Total current liabilities 4,901,701 14 5,190,195 15
Non-current liabilities2540 Long-term bank loans 6(13)(32)
and 8 8,293,226 24 9,042,096 272570 Deferred tax liabilities 6(28) 305,635 1 308,759 12580 Non-current lease liabilities 6(32) 668,384 2 - -2640 Net defined benefit liability, non-current 6(15) 480,107 2 520,765 22645 Guarantee deposits 6(32) 1,095 - 1,092 -2670 Other non-current liabilities 4,500 - - -25XX Total non-current liabilities 9,752,947 29 9,872,712 302XXX Total liabilities 14,654,648 43 15,062,907 45
EquityEquity attributable to equity holders of the Company Capital stock 6(17)
3110 Capital stock common stock 7,272,401 21 7,528,577 23Capital surplus 6(18)
3200 Capital surplus 6,059,651 17 6,280,482 19Retained earnings 6(19)
3310 Legal reserve 1,579,478 5 1,469,170 53350 Unappropriated retained earnings 4,759,511 14 3,635,372 11
Other equity interest 6(20)3410 Financial statements translation differences of foreign
operations ( 89,682) - 14,516 -3420 Unrealized gain on valuation of financial assets at fair value
through other comprehensive income 69,880 - 106,898 -3490 Unearned employee awards - - ( 1,701) -3500 Treasury stock 6(17) - - ( 962,503) ( 3)31XX Equity attributable to equity holders of the Company 19,651,239 57 18,070,811 553XXX Total equity 19,651,239 57 18,070,811 55
Significant contingent liabilities and unrecognized contract commitments
9
Significant events after the reporting period 113X2X Total liabilities and equity $ 34,305,887 100 $ 33,133,718 100
115

ChipMOS TECHNOLOGIES INC. AND SUBSIDIARIESCONSOLIDATED STATEMENTS OF COMPREHENSIVE INCOME
(Expressed in thousands of New Taiwan dollars, except earnings per share)
The accompanying notes are an integral part of these consolidated financial statements.
Years ended December 31,
2019 2018
Items Notes Amount % Amount %
4000 Revenue 6(21) $ 20,337,881 100 $ 18,480,027 1005000 Cost of revenue 6(4)(26)(27) ( 16,411,742) ( 81) ( 15,050,032) ( 81)5900 Gross profit 3,926,139 19 3,429,995 19
Operating expenses 6(26)(27)6100 Sales and marketing expenses ( 56,076) - ( 53,451) -6200 General and administrative expenses ( 498,241) ( 3) ( 485,068) ( 3)6300 Research and development expenses ( 1,007,631) ( 5) ( 939,269) ( 5)6000 Total operating expenses ( 1,561,948) ( 8) ( 1,477,788) ( 8)6500 Other income (expenses), net 6(22) 92,928 1 147,514 16900 Operating profit 2,457,119 12 2,099,721 12
Non-operating income (expenses)7010 Other income 6(23) 75,127 1 58,361 -7020 Other gains and losses 6(24) 833,261 4 114,709 17050 Finance costs 6(25) ( 180,262) ( 1) ( 190,248) ( 1)7060 Share of loss of associates and joint ventures accounted for
using equity method6(7)
( 154,926) ( 1) ( 300,101) ( 2)7000 Total non-operating income (expenses) 573,200 3 ( 317,279) ( 2)7900 Profit before income tax 3,030,319 15 1,782,442 107950 Income tax expense 6(28) ( 446,158) ( 2) ( 679,367) ( 4)8200 Profit for the year $ 2,584,161 13 $ 1,103,075 6
Other comprehensive income (loss)8311 Profit (loss) on remeasurements of defined benefit plans 6(15) $ 20,916 - ( $ 59,961) -8316 Unrealized (loss) gain on valuation of equity instruments at
fair value through other comprehensive income6(6)
( 52,549) - 85,022 -8320 Share of other comprehensive income (loss) of associates
and joint ventures accounted for using equity method that will not be reclassified to profit or loss 5,732 - ( 2,687) -
8349 Income tax effect on components that will not be reclassified to profit or loss
6(28)6,327 - ( 4,126) -
8310 Components of other comprehensive (loss) income that will not be reclassified to profit or loss ( 19,574) - 18,248 -
8361 Exchange differences on translation of foreign operations 6(20) ( 104,198) ( 1) ( 51,077) -8360 Components of other comprehensive loss that will be
reclassified to profit or loss ( 104,198) ( 1) ( 51,077) -8300 Other comprehensive loss, net of income tax ($ 123,772) ( 1) ($ 32,829) -
8500 Total comprehensive income for the year $ 2,460,389 12 $ 1,070,246 6
9750 Earnings per share - basic 6(29) $ 3.55 $ 1.37
9850 Earnings per share - diluted 6(29) $ 3.51 $ 1.36
116

Chi
pMO
S TE
CH
NO
LOG
IES
INC
. AN
D S
UB
SID
IAR
IES
CO
NSO
LID
ATED
STA
TEM
ENTS
OF
CH
AN
GES
IN E
QU
ITY
(Exp
ress
ed in
thou
sand
s of N
ew T
aiw
an d
olla
rs)
The
acco
mpa
nyin
g no
tes a
re a
n in
tegr
al p
art o
f the
se c
onso
lidat
ed fi
nanc
ial s
tate
men
ts.
Ret
aine
d ea
rnin
gsO
ther
equ
ity in
tere
st
Not
esC
apita
l sto
ckco
mm
on st
ock
Cap
ital
surp
lus
Lega
l res
erve
Una
ppro
pria
ted
reta
ined
e
arni
ngs
Fina
ncia
l st
atem
ents
tra
nsla
tion
diffe
renc
es o
f fo
reig
n op
erat
ions
Unr
ealiz
ed g
ain
(loss
) on
valu
atio
n of
fin
anci
al a
sset
s at
fair
valu
e th
roug
h ot
her
com
preh
ensi
ve
inco
me
Unr
ealiz
ed
gain
(los
s) o
n va
luat
ion
of
avai
labl
e-fo
r-sa
le fi
nanc
ial
asse
ts
Une
arne
d em
ploy
ee
awar
dsTr
easu
ry st
ock
Tota
l equ
ity
Year
201
8
Bala
nce
at Ja
nuar
y 1,
201
8$
8,86
2,97
1$
6,28
8,37
7$
1,16
6,51
7$
3,07
1,42
4$
65,5
93$
-$
678
($54
,570
)($
1,00
7,65
4)$
18,3
93,3
36
Effe
cts o
n in
itial
app
licat
ion
of IF
RS
9 an
d IF
RS
15-
--
65,0
50-
42,8
43(
678)
--
107,
215
Adj
uste
d ba
lanc
e at
Janu
ary
1, 2
018
8,86
2,97
16,
288,
377
1,16
6,51
73,
136,
474
65,5
9342
,843
-(
54,5
70)
(1,
007,
654)
18,5
00,5
51
Prof
it fo
r the
yea
r-
--
1,10
3,07
5-
--
--
1,10
3,07
5
Oth
er c
ompr
ehen
sive
(loss
) inc
ome
6(20
)-
--
(45
,807
)(
51,0
77)
64,0
55-
--
(32
,829
)
To
tal c
ompr
ehen
sive
inco
me
(loss
) for
the
year
--
-1,
057,
268
(51
,077
)64
,055
--
-1,
070,
246
App
ropr
iatio
n of
prio
r yea
r’s e
arni
ngs:
6(19
)
Leg
al re
serv
e-
-30
2,65
3(
302,
653)
--
--
--
Cas
h di
vide
nds
--
-(
256,
806)
--
--
-(
256,
806)
Res
trict
ed sh
ares
6(16
)(
4,94
8)(
7,96
7)-
1,08
9-
--
52,8
69-
41,0
43
Cap
ital r
educ
tion
6(17
)(
1,32
9,44
6)72
--
--
--
45,1
51(
1,28
4,22
3)
Bala
nce
at D
ecem
ber 3
1, 2
018
$7,
528,
577
$6,
280,
482
$1,
469,
170
$3,
635,
372
$14
,516
$10
6,89
8$
-($
1,70
1)($
962,
503)
$18
,070
,811
Year
201
9
Bala
nce
at Ja
nuar
y 1,
201
9$
7,52
8,57
7$
6,28
0,48
2$
1,46
9,17
0$
3,63
5,37
2$
14,5
16$
106,
898
$-
($1,
701)
($96
2,50
3)$
18,0
70,8
11
Prof
it fo
r the
yea
r-
--
2,58
4,16
1-
--
--
2,58
4,16
1
Oth
er c
ompr
ehen
sive
inco
me
(loss
) 6(
20)
--
-17
,372
(10
4,19
8)(
36,9
46)
--
-(
123,
772)
To
tal c
ompr
ehen
sive
inco
me
(loss
) for
the
year
--
-2,
601,
533
(10
4,19
8)(
36,9
46)
--
-2,
460,
389
App
ropr
iatio
n of
prio
r yea
r’s e
arni
ngs:
6(19
)
Leg
al re
serv
e-
-11
0,30
8(
110,
308)
--
--
--
Cas
h di
vide
nds
--
-(
872,
718)
--
--
-(
872,
718)
Res
trict
ed sh
ares
6(16
)(
477)
(41
2)-
10-
--
1,70
1-
822
Can
cella
tion
of tr
easu
ry st
ock
6(17
)(
255,
699)
(21
2,35
4)-
(49
4,45
0)-
--
-96
2,50
3-
Disp
osal
of i
nves
tmen
t acc
ount
ed fo
r usi
ng e
quity
met
hod
6(18
)-
(8,
065)
-72
-(
72)
--
-(
8,06
5)
Bala
nce
at D
ecem
ber 3
1, 2
019
$7,
272,
401
$6,
059,
651
$1,
579,
478
$4,
759,
511
($89
,682
)$
69,8
80$
-$
-$
-$
19,6
51,2
39
117

ChipMOS TECHNOLOGIES INC. AND SUBSIDIARIESCONSOLIDATED STATEMENTS OF CASH FLOWS
(Expressed in thousands of New Taiwan dollars)Years ended December 31,
Notes 2019 2018CASH FLOWS FROM OPERATING ACTIVITIES Profit before income tax $ 3,030,319 $ 1,782,442
Adjustments to reconcile profit (loss) Depreciation expenses 6(8)(9)(26) 3,731,914 3,376,579 (Reversal of) expected credit losses ( 806 ) 348 Interest expense 6(25) 171,075 152,416 Interest income 6(23) ( 64,368 ) ( 49,971 ) Dividend income 6(23) ( 585 ) ( 571 ) Share-based payments 6(16)(27) 822 41,043 Share of loss of associates and joint ventures accounted for using
equity method6(7)
154,926 300,101 Gain on valuation of financial assets at fair value through profit or
loss6(5)(24)
( 1,317 ) ( 1,485 ) Gain on disposal of property, plant and equipment 6(22) ( 20,271 ) ( 14,274 ) Impairment loss on property, plant and equipment 6(8)(22) 9,938 - Gain on disposal of investment accounted for using equity method 6(7)(24) ( 981,675 ) - Deferred income ( 12,279 ) ( 42,857 ) Changes in operating assets and liabilities Changes in operating assets
Financial assets at fair value through profit or loss 1,750 1,447Current contract assets ( 78,013 ) ( 44,858 )Notes receivable 830 434Accounts receivable 293,579 ( 734,129 )Accounts receivable related parties ( 905 ) ( 129 )Other receivables ( 8,082 ) 5,238Other receivables related parties 12,437 16,317Inventories 11,193 ( 58,101 )Prepayments ( 4,333 ) 46,781Other non-current assets 6,914 6,914
Changes in operating liabilitiesCurrent contract liabilities ( 201 ) 280Accounts payable 182,277 ( 50,689 )Accounts payable related parties ( 347 ) 121Other payables 331,207 ( 301,711 )Other payables related parties ( 218 ) 182Current provisions ( 27,354 ) ( 27,803 )Current refund liabilities ( 6,627 ) ( 37,529 )Other current liabilities 1,442 ( 475 )Net defined benefit liability, non-current ( 19,742 ) ( 17,722 )
Cash generated from operations 6,713,500 4,348,339 Interest received 67,105 48,590 Dividends received 20,585 6,184 Interest paid ( 171,149 ) ( 154,307 ) Income tax paid ( 637,169 ) ( 119,473 )
Net cash generated from operating activities 5,992,872 4,129,333
(Continued)
118

ChipMOS TECHNOLOGIES INC. AND SUBSIDIARIESCONSOLIDATED STATEMENTS OF CASH FLOWS
(Expressed in thousands of New Taiwan dollars)Years ended December 31,
Notes 2019 2018
The accompanying notes are an integral part of these consolidated financial statements.
CASH FLOWS FROM INVESTING ACTIVITIES
Decrease (increase) in financial assets at amortized cost $ 30,851 ( $ 198,030 )
Acquisition of investments accounted for using equity method 6(7) and 7 - ( 794,694 )
Proceeds from disposal of investment accounted for using equity
method
6(7)
1,180,179 -
Acquisition of property, plant and equipment 6(31) ( 5,440,621 ) ( 4,154,198 )
Proceeds from disposal of property, plant and equipment 21,434 18,160
Decrease (increase) in refundable deposits 861 ( 664 )
Increase in other non-current assets ( 45,480 ) -
Increase in other non-current liabilities 4,500 -
Net cash used in investing activities ( 4,248,276 ) ( 5,129,426 )
CASH FLOWS FROM FINANCING ACTIVITIES 6(32)
Proceeds from short term bank loans 834,955 1,053,202
Payments on short term bank loans ( 834,955 ) ( 2,022,555 )
Payments on lease liabilities ( 48,161 ) -
Proceeds from long term bank loans - 12,663,550
Payments on long term bank loans ( 756,450 ) ( 12,553,300 )
Increase (decrease) in guarantee deposits 3 ( 279 )
Cash dividend paid 6(19) ( 872,718 ) ( 256,806 )
Capital reduction - ( 1,284,223 )
Net cash used in financing activities ( 1,677,326 ) ( 2,400,411 )
Effect of foreign exchange rate changes ( 5,708 ) 7,312
Net increase (decrease) in cash and cash equivalents 61,562 ( 3,393,192 )
Cash and cash equivalents at beginning of year 4,642,522 8,035,714
Cash and cash equivalents at end of year $ 4,704,084 $ 4,642,522
119

ChipMOS TECHNOLOGIES INC. AND SUBSIDIARIES
NOTES TO THE CONSOLIDATED FINANCIAL STATEMENTS
YEARS ENDED DECEMBER 31, 2019 AND 2018
(Expressed in thousands of New Taiwan dollars, except as otherwise indicated)
1. HISTORY AND ORGANIZATION
ChipMOS TECHNOLOGIES INC. (the “Company”) was incorporated on July 28, 1997. The Company
and its subsidiaries (collectively referred herein as the “Group”) are primarily engaged in the research,
development, manufacturing and sale of high-integration and high-precision integrated circuits and
related assembly and testing services. On April 11, 2014, the Company’s shares were listed on the Taiwan
Stock Exchange. On November 1, 2016, the Company’s American Depositary Shares (“ADSs”) were
listed on the NASDAQ Global Select Market.
2. THE AUTHORIZATION OF THE CONSOLIDATED FINANCIAL STATEMENTS
The accompanying consolidated financial statements were authorized for issuance by the Board of
Directors on March 10, 2020.
3. APPLICATION OF NEW AND AMENDED INTERNATIONAL FINANCIAL REPORTING
STANDARDS AND INTERPRETATIONS
(1) Effect of the adoption of new or amended International Financial Reporting Standards (“IFRS”) as
endorsed by the Financial Supervisory Commission (“FSC”)
A. New standards, interpretations and amendments endorsed by the FSC effective from 2019 are as
follows:
New Standards, Interpretations and Amendments
Effective date issued by
International Accounting
Standards Board (“IASB”)
Amendments to IFRS 9 “Prepayment Features with Negative
Compensation”
January 1, 2019
IFRS 16 “Leases” January 1, 2019
Amendments to International Accounting Standards (“IAS”) 19
“Plan Amendment, Curtailment or Settlement”
January 1, 2019
Amendments to IAS 28 “Long-term Interests in Associates and
Joint Ventures”
January 1, 2019
International Financial Reporting Interpretations Committee
(“IFRIC”) 23 “Uncertainty Over Income Tax Treatments”
January 1, 2019
Annual Improvements to IFRSs 2015-2017 Cycle January 1, 2019
B. Except for the following, the above standards and interpretations have no significant impact on
the Group’s financial position and financial performance based on the Group’s assessment.
IFRS 16 “Leases”
(a) IFRS 16 “Leases” (“IFRS 16”), supersedes IAS 17 “Leases” (“IAS 17”) and the related
interpretations issued by the Standing Interpretation Committee. The standard requires lessees
to recognize a right-of-use asset and a lease liability (except for those leases with terms of 12
months or less and leases of low-value assets). The accounting stays the same for lessors,
which is to classify their leases as either finance leases or operating leases and account for
those two types of leases differently. IFRS 16 only requires enhanced disclosures to be
120

provided by lessors.
(b) The Group has elected to apply IFRS 16 by not restating the comparative information (referred
herein as the “modified retrospective approach”) when applying IFRS, IAS, IFRIC
interpretations, and SIC interpretations effective in 2019 as endorsed by FSC (“IFRSs”).
Accordingly, the Group increased right-of-use assets and lease liabilities by $898,387 and
$884,275, respectively, and decreased leased assets and lease obligations payable by $31,904
and $17,792, respectively.
(c) The Group has adopted the following practical expedients permitted by the standard at the
date of initial application of IFRS 16:
i. Reassessment as to whether a contract is, or contains, a lease is not required, instead, the
application of IFRS 16 depends on whether or not the contracts were previously identified
as leases applying IAS 17 and IFRIC 4 “Determining whether an Arrangement contains a
Lease”.
ii. The use of a single discount rate to a portfolio of leases with reasonably similar
characteristics.
iii. The accounting for operating leases whose period will end before December 31, 2019 as
short-term leases and accordingly, rent expense of $28,126 was recognized for the year
ended 2019.
(d) The Group calculated the present value of lease liabilities by using the incremental borrowing
interest rate, ranging from 1.7895% to 3.9474%.
(e) The reconciliation between operating lease commitments for the remaining lease payments
under IAS 17 and lease liabilities recognized as of January 1, 2019, measured at the present
value of the remaining lease payments, discounted using the lessee’s incremental borrowing
rate is as follows:
Operating lease commitments disclosed by applying IAS 17 as of
December 31, 2018 $ 320,214
Add: Lease payable recognized under finance lease by applying
IAS 17 as of December 31, 2018 17,792
Less: Short-term leases ( 28,121 )
Add: Adjustments as a result of a different treatment of extension and
termination options 874,298
Total lease contracts amount recognized as lease liabilities by
applying IFRS 16 on January 1, 2019 $ 1,184,183
Incremental borrowing interest rate at the date of initial application 1.7895%~3.9474%
Lease liabilities recognized as of January 1, 2019 by applying
IFRS 16 $ 884,275
121
(2) Effect of new, revised or amended IFRSs endorsed by the FSC that has not been adopted
A. New standards, interpretations and amendments endorsed by the FSC effective from 2020 are as
follows:
New Standards, Interpretations and Amendments
Effective date issued by
IASB
Amendments to IAS 1 and IAS 8 “Disclosure Initiative-
Definition of Material”
January 1, 2020
Amendments to IFRS 3 “Definition of a Business” January 1, 2020
Amendments to IFRS 9, IAS 39 and IFRS 7, “Interest Rate
Benchmark Reform”
January 1, 2020
B. Based on the Group’s assessment, the above standards and interpretations have no significant
impact on the Group’s financial position and financial performance.
(3) The IFRSs issued by IASB but not yet endorsed by the FSC
A. New standards, interpretations and amendments issued by IASB but not yet included in the IFRSs
endorsed by the FSC are as follows:
New Standards, Interpretations and Amendments
Effective date issued by
IASB
Amendments to IFRS 10 and IAS 28 “Sale or Contribution of
Assets between an Investor and its Associate or Joint Venture”
To be determined by
IASB
IFRS 17 “Insurance Contracts” January 1, 2021
Amendments to IAS 1, “Classification of Liabilities as Current or
Non-current”
January 1, 2022
B. Based on the Group’s assessment, the above standards and interpretations have no significant
impact on the Group’s financial position and financial performance.
4. SUMMARY OF SIGNIFICANT ACCOUNTING POLICIES
The significant accounting policies applied in the preparation of these accompanying consolidated
financial statements are set out below. These policies have been consistently applied during the reported
periods, unless otherwise stated.
(1) Statement of compliance
The consolidated financial statements of the Group have been prepared in accordance with
“Regulations Governing the Preparation of Financial Reports by Securities Issuers” and IFRSs.
(2) Basis of preparation
A. Except for the following items, the consolidated financial statements have been prepared under
the historical cost convention:
(a) Financial assets at fair value through profit or loss (including derivative instruments).
(b) Financial assets at fair value through other comprehensive income.
(c) Defined benefit liabilities were recognized based on the net amount of pension fund assets
less the present value of benefit obligation.
B. The preparation of the consolidated financial statements in conformity with IFRSs requires the
use of certain critical accounting estimates. It also requires management to exercise its judgment
in the process of applying the Group’s accounting policies. The areas involving a higher degree
122

of judgment or complexity, or areas where assumptions and estimates are significant to the
consolidated financial statements are disclosed in Note 5.
(3) Basis of consolidation
A. Basis for preparation of consolidated financial statements:
(a) All subsidiaries are included in the Group’s consolidated financial statements. Subsidiaries are
all entities controlled by the Group. The Group controls an entity when the Group is exposed,
or has rights, to variable returns from its involvement with the entity and has the ability to
affect those returns through its power over the entity. Consolidation of subsidiaries begins from
the date the Group obtains control of the subsidiaries and ceases when the Group loses control
of the subsidiaries.
(b) Transactions, balances and unrealized gains or losses on transactions between companies
within the Group are eliminated. Accounting policies of subsidiaries have been adjusted where
necessary to ensure consistency with the policies adopted by the Group.
(c) Profit or loss and each component of other comprehensive income are attributed to the owners
of the parent and to the non-controlling interests. Total comprehensive income is attributed to
the owners of the parent and to the non-controlling interests even if this results in a deficit
balance in the non-controlling interests.
(d) Changes in a parent’s ownership interest in a subsidiary that do not result in the parent losing
control of the subsidiary (transactions with non-controlling interests) are accounted for as
equity transactions, i.e. transactions with owners in their capacity as owners. Any difference
between the amount by which the non-controlling interests are adjusted and the fair value of
the consideration paid or received is recognized directly in equity.
(e) When the Group loses control of a subsidiary, the Group remeasures any investment retained
in the former subsidiary at its fair value. That fair value is regarded as the fair value on initial
recognition of a financial asset or the cost on initial recognition of the associate or joint venture.
Any difference between fair value and carrying amount is recognized in profit or loss. All
amounts previously recognized in other comprehensive income in relation to the subsidiary
are reclassified to profit or loss on the same basis as would be required if the related assets or
liabilities were disposed of. That is, when the Group loses control of a subsidiary, all gains or
losses previously recognized in other comprehensive income in relation to the subsidiary
should be reclassified from equity to profit or loss, if such gains or losses would be reclassified
to profit or loss when the related assets or liabilities are disposed of.
B. Subsidiaries included in the consolidated financial statements:
Percentage of Ownership (%)
Name of investor Name of investee Main business December 31, 2019 December 31, 2018
The Company ChipMOS U.S.A., Inc.
(“ChipMOS USA”)
Research, development, and marketing
of semiconductors, circuits, electronic
related products
100 100
The Company ChipMOS
TECHNOLOGIES
(BVI) LTD.
(“ChipMOS BVI”)
Holding company 100 100
C. Subsidiaries not included in the consolidated financial statements: None.
123

D. Adjustments for subsidiaries with different balance sheet dates: Not applicable.
E. No significant restrictions on the ability of subsidiaries to transfer funds to parent company.
F. Subsidiaries that have non-controlling interests that are material to the Group: None.
(4) Foreign currency translation
Items included in the financial statements of each of the Group’s entities are measured using the
currency of the primary economic environment in which the entity operates (the “functional
currency”). The consolidated financial statements are presented in New Taiwan dollars (NTD), which
is the Company’s functional currency and the Group’s presentation currency.
A. Foreign currency transactions and balances
(a) Foreign currency transactions are translated into the functional currency using the exchange
rates on the trade date or measurement date. Therefore, foreign exchange differences resulting
from the settlement of such transactions are recognized in profit or loss in the period in which
they arise.
(b) Monetary assets and liabilities denominated in foreign currencies at the period end are re-
translated at the exchange rates prevailing at the balance sheet date. Exchange differences
arising upon re-translation are recognized in profit or loss on the balance sheet date.
(c) Non-monetary assets and liabilities denominated in foreign currencies held at fair value
through profit or loss are re-translated at the exchange rates prevailing at the balance sheet
date; their exchange differences are recognized in profit or loss. Non-monetary assets and
liabilities denominated in foreign currencies held at fair value through other comprehensive
income are re-translated at the exchange rates prevailing at the balance sheet date; their
exchange differences are recognized in other comprehensive income. However, non-monetary
assets and liabilities denominated in foreign currencies that are not measured at fair value are
translated using the historical exchange rates at the initial dates of the transactions.
(d) All foreign exchange differences are presented in the statement of comprehensive income
under “Other gains and losses” by the nature of transactions.
B. Translation of foreign operations
The operating results and financial position of all the group entities, associates that have different
functional currency and presentation currency are translated into the presentation currency as
follows:
(a) Assets and liabilities for each balance sheet are translated at the exchange rates prevailing at
the balance sheet date;
(b) Income and expenses for each statement of comprehensive income are translated at average
exchange rates of that period; and
(c) All exchange differences are recognized in other comprehensive income.
(5) Classification of current and non-current assets and liabilities
A. Assets that meet one of the following criteria are classified as current assets:
(a) Assets arising from operating activities that are expected to be realized, or are intended to be
sold or consumed within the normal operating cycle;
124

(b) Assets held mainly for trading purposes;
(c) Assets that are expected to be realized within 12 months from the balance sheet date;
(d) Cash and cash equivalents, excluding restricted cash and cash equivalents and those that are to
be exchanged or used to pay off liabilities more than 12 months after the balance sheet date.
All assets that do not meet the above criteria are classified as non-current assets.
B. Liabilities that meet one of the following criteria are classified as current liabilities:
(a) Liabilities that are expected to be settled within the normal operating cycle;
(b) Liabilities arising mainly from trading activities;
(c) Liabilities that are to be settled within 12 months from the balance sheet date;
(d) Liabilities for which the repayment date cannot be unconditionally extended to more than 12
months after the balance sheet date. Liabilities bearing terms that could, at the option of the
counterparty, result in its settlement by the issue of equity instruments do not affect its
classification.
All liabilities that do not meet the above criteria are classified as non-current liabilities.
(6) Cash equivalents
Cash equivalents refer to short-term, highly liquid investments that are readily convertible to known
amounts of cash and are subject to an insignificant risk of changes in value (including time deposits
with less than 3 months contract period). Time deposits that meet the above definition and are held
for the purpose of meeting short-term cash commitments in operations are classified as cash
equivalents.
(7) Financial assets at fair value through profit or loss
A. Financial assets at fair value through profit or loss are financial assets that are not measured at
amortized cost or fair value through other comprehensive income.
B. On a regular way purchase or sale basis, financial assets at fair value through profit or loss are
recognized and derecognized using settlement date accounting.
C. At initial recognition, the Group measures the financial assets at fair value and recognizes the
transaction costs in profit or loss. The Group subsequently measures the financial assets at fair
value, and recognizes the gain or loss in profit or loss.
D. The Group recognizes the dividend income when the right to receive such payment is confirmed,
inflow of the future economic benefits associated with the dividend is probable to the Group and
the amount of the dividend can be measured reliably.
(8) Financial assets at fair value through other comprehensive income
A. Financial assets at fair value through other comprehensive income comprise equity instruments
which are not held for trading, and for which the Group has made an irrevocable election at initial
recognition to recognize changes in fair value in other comprehensive income.
B. On a regular way purchase or sale basis, financial assets at fair value through other comprehensive
income are recognized and derecognized using settlement date accounting.
C. At initial recognition, the Group measures the financial assets at fair value plus transaction costs.
The Group subsequently measures the financial assets at fair value:
The changes in fair value of equity instruments that were recognized in other comprehensive
125

income are reclassified to retained earnings and are not reclassified to profit or loss following the
derecognition of the investment. Dividends are recognized as income when the right to receive
such payment is confirmed, inflow of the future economic benefits associated with the dividend
is probable to the Group and the amount of the dividend can be measured reliably.
(9) Financial assets at amortized cost
A. Financial assets at amortized cost are those that meet all of the following criteria:
(a) The objective of the Group’s business model is achieved by collecting contractual cash flows.
(b) The financial assets’ contractual cash flows represent solely payments of principal and interest.
B. The Group’s bank deposits which do not fall under cash equivalents are those with a short
maturity period and are measured at initial investment amount as the effect of discounting is
immaterial.
(10) Accounts and notes receivable
A. Accounts and notes receivable entitle the Group a legal right to receive consideration in exchange
for transferred goods or rendered services.
B. The short-term accounts and notes receivable without bearing interest are subsequently measured
at initial invoice amount as the effect of discounting is immaterial.
(11) Impairment of financial assets
For financial assets at amortized cost, at each reporting date, the Group recognizes the impairment
provision for 12 months expected credit losses if there has not been a significant increase in credit
risk since initial recognition or recognizes the impairment provision for the lifetime expected credit
losses if such credit risk has increased since initial recognition after taking into consideration all
reasonable and verifiable information that includes forecasts. On the other hand, for accounts
receivable or contract assets that do not contain a significant financing component, the Group
recognizes the impairment provision for lifetime expected credit losses.
(12) Derecognition of financial assets
The Group derecognizes a financial asset when the contractual rights to receive the cash flows from
the financial asset have expired.
(13) Inventories
Inventories are initially recorded at cost. Cost is determined on a weighted-average cost basis. At the
end of reporting period, the differences were allocated to inventories and cost of revenue based on
an appropriate rate. Allocation of fixed production overheads is based on the normal operating
capacity of the production facilities. Costs associated with underutilized capacity are expensed in the
period that the cost occurs.
Inventories are valued at the lower of cost and net realizable value. Net realizable value is the
estimated selling price in the ordinary course of business less the estimated costs of completion and
the estimated costs necessary to make the sale. The item by item approach is used in raw materials.
The amount of any write-down of inventories to net realizable value and all losses of inventories are
recognized as an expense in the period the write-down or loss occurs.
126

(14) Investments accounted for using equity method – associates
A. Associates are all entities over which the Group has significant influence but not control. In
general, it is presumed that the investor has significant influence, if an investor holds, directly or
indirectly 20 percent or more of the voting power of the investee. Investments in associates are
accounted for using the equity method and are initially recognized at cost.
B. The Group’s share of its associates’ post-acquisition profits or losses is recognized in profit or
loss, and its share of post-acquisition movements in other comprehensive income is recognized
in other comprehensive income. When the Group’s share of losses in an associate equals or
exceeds its interests in the associate, including any other unsecured receivables, the Group does
not recognize further losses, unless it has incurred legal or constructive obligations or made
payments on behalf of the associate.
C. When changes in an associate’s equity that are not recognized in profit or loss or other
comprehensive income of the associate and such changes not affecting the Group’s ownership
percentage of the associate, the Group recognizes the Group’s share of change in equity of the
associate in “Capital surplus” in proportion to its ownership.
D. Unrealized gains on transactions between the Group and its associates are eliminated to the extent
of the Group’s interests in the associates. Unrealized losses are also eliminated unless the
transaction provides evidence of an impairment of the asset transferred. Accounting policies of
associates have been adjusted where necessary to ensure consistency with the policies adopted
by the Group.
E. In the case where an associate issues new shares and the Group does not subscribe or
proportionately acquire the new shares, which results in a change in the Group’s ownership
percentage of the associate while maintaining significant influence on the associate, then “Capital
surplus” and “Investments accounted for using equity method” shall be adjusted for the increase
or decrease of its share of equity interests. If the above condition causes a decrease in the Group’s
ownership percentage of the associate, in addition to the above adjustment, the amounts
previously recognized in other comprehensive income in relation to the associate are reclassified
to profit or loss proportionately on the same basis as would be required if the relevant assets or
liabilities were disposed of.
F. When the Group disposes of its investment in an associate, if it loses significant influence on this
associate, the amounts previously recognized in other comprehensive income in relation to the
associate are reclassified to profit or loss, on the same basis as would be required if the relevant
assets or liabilities were disposed of. If it still retains significant influence on this associate, then
the amounts previously recognized in other comprehensive income in relation to the associate are
reclassified to profit or loss proportionately in accordance with the aforementioned approach.
(15) Property, plant and equipment
A. Property, plant and equipment are initially recorded at cost. Borrowing costs incurred during the
construction period are capitalized.
B. Subsequent costs are included in the asset’s carrying amount or recognized as a separate asset, as
appropriate, only when it is probable that future economic benefits associated with the item will
flow to the Group and the cost of the item can be measured reliably. The carrying amount of the
127

replaced part is derecognized. All other repairs and maintenance are charged to profit or loss
during the financial period in which they are incurred.
C. Land is not depreciated. Other property, plant and equipment apply cost model and are
depreciated using the straight-line method to allocate their cost over their estimated useful lives.
Each part of an item of property, plant and equipment with a cost that is significant in relation to
the total cost of the item must be depreciated separately.
D. The assets’ residual values, useful lives and depreciation methods are reviewed, and adjusted if
appropriate, at each financial year-end. If expectations for the assets’ residual values and useful
lives differ from previous estimates or the patterns of consumption of the assets’ future economic
benefits embodied in the assets have changed significantly, any change is accounted for as a
change in estimate under IAS 8 “Accounting Policies, Change in Accounting Estimates and
Errors”, from the date of the change. The estimated useful lives of property, plant and equipment
are as follows:
Buildings 5 to 51 years
Machinery and equipment 2 to 8 years
Tools 2 to 4 years
Others 2 to 6 years
(16) Leasing arrangements (lessee)-right-of-use assets / lease liabilities
Effective from 2019
A. Leases are recognized as a right-of-use asset and a corresponding lease liability at the date at
which the leased asset is available for use by the Group. For short-term leases or leases of low
value assets, lease payments are recognized as an expense on a straight-line basis over the lease
term.
B. Lease liabilities include the net present value of the remaining lease payments at the
commencement date, discounted using the incremental borrowing interest rate.
Lease payments are comprised of the following:
(a) Fixed payments, less any lease incentives receivable;
(b) The exercise price of a purchase option, if the lessee is reasonably certain to exercise that
option.
The Group subsequently measures the lease liability at amortized cost using the interest method
and recognizes interest expense over the lease term. The lease liability is remeasured and the
amount of remeasurement is recognized as an adjustment to the right-of-use asset when there are
changes in the lease term or lease payments and such changes do not arise from contract
modifications.
C. At the commencement date, the right-of-use asset is stated at the amount of the initial
measurement of lease liability. The right-of-use asset is measured subsequently using the cost
model and is depreciated from the commencement date to the earlier of the end of the asset’s
useful life or the end of the lease term. When the lease liability is remeasured, the amount of
remeasurement is recognized as an adjustment to the right-of-use asset.
128

(17) Leased assets / operating leases (lessee)
Prior to 2019
A. Based on the terms of a lease contract, a lease is classified as a finance lease if the Group assumes
substantially all the risks and rewards incidental to ownership of the leased asset.
(a) A finance lease is recognized as an asset and a liability at the lease’s commencement at the
lower of the fair value of the leased asset or the present value of the minimum lease payments.
(b) The minimum lease payments are apportioned between the finance charges and the reduction
of the outstanding liability. The finance charges are allocated to each period over the lease
term so as to produce a constant periodic rate of interest on the remaining balance of the
liability.
(c) Property, plant and equipment held under finance leases are depreciated over their estimated
useful lives. If there is no reasonable certainty that the Group will obtain ownership at the
end of the lease, the asset shall be depreciated over the shorter of the lease term and its useful
life.
B. Payments made under an operating lease (net of any incentives received from the lessor) are
recognized in profit or loss on a straight-line basis over the lease term.
(18) Impairment of non-financial assets
The Group assesses at each balance sheet date the recoverable amounts of those assets where there
is an indication that they are impaired. An impairment loss is recognized for the amount by which
the asset’s carrying amount exceeds its recoverable amount. The recoverable amount is the higher
of an asset’s fair value less costs to sell or value in use. When the circumstances or reasons for
recognizing impairment loss for an asset in prior years no longer exist or diminish, the impairment
loss is reversed. The increased carrying amount due to reversal should not be more than what the
depreciated or amortized historical cost would have been if the impairment had not been recognized.
(19) Loans
Loans comprise long-term and short-term bank loans. Loans are recognized initially at fair value,
net of transaction costs incurred. Loans are subsequently stated at amortized cost; any difference
between the proceeds (net of transaction costs) and the redemption value is recognized as interest
expense in profit or loss over the period of the loans using the effective interest method.
(20) Accounts payable
Accounts payable are liabilities for purchases of raw materials, goods or services. The short-term
accounts payable without bearing interest are subsequently measured at initial invoice amount as
the effect of discounting is immaterial.
(21) Provisions for deficiency compensation
Provisions are recognized when the Group has a present legal or constructive obligation as a result
of past events, and it is probable that an outflow of economic resources will be required to settle the
obligation and the amount of the obligation can be reliably estimated. Provisions are measured at
the present value of the expenditures expected to be required to settle the obligation on the balance
sheet date, which is discounted using a pre-tax discount rate that reflects the current market
assessments of the time value of money and the risks specific to the obligation. When discounting
129

is used, the increase in the provision arising from the passage of time is recognized as interest
expense. Provisions are not recognized for future operating losses.
(22) Employee benefits
A. Short-term employee benefits
Short-term employee benefits are measured at the undiscounted amount of the benefits expected
to be paid in respect of service rendered by employees and should be recognized as expenses
when the employees render service.
B. Pensions
(a) Defined contribution plans
For defined contribution plans, the contributions are recognized as pension expenses when
they are due on an accrual basis. Prepaid contributions are recognized as an asset to the extent
of a cash refund or a reduction in future payments.
(b) Defined benefit plans
i. Net obligation under a defined benefit plan is defined as the present value of an amount of
pension benefits that employees will receive on retirement for their services with the Group
in the current period or prior periods. The liability recognized in the balance sheet in respect
of defined benefit pension plans is the present value of the defined benefit obligation at the
balance sheet date less the fair value of plan assets. The net defined benefit obligation is
calculated annually by independent actuaries using the projected unit credit method. The
discount rate is determined by using the interest rates of government bonds that are
denominated in the currency in which the benefits will be paid, and that have terms to
maturity approximating to the terms of the related pension liability.
ii. Remeasurements arising on defined benefit plans are recognized in other comprehensive
income in the period in which they arise and are recorded as retained earnings.
iii. Past service costs are recognized immediately in profit or loss.
C. Termination benefits
Termination benefits are employee benefits provided in exchange for the termination of
employment as a result from either the Group’s decision to terminate an employee’s employment
before the normal retirement date, or an employee’s decision to accept an offer of redundancy
benefits in exchange for the termination of employment. The Group recognizes an expense as it
can no longer withdraw an offer of termination benefits, or it recognizes related restructuring
costs, whichever is earlier. Benefits that are expected to be due more than 12 months after balance
sheet date shall be discounted to their present value.
D. Employees’ compensation and directors’ remuneration
Employees’ compensation and directors’ remuneration are recognized as expenses and liabilities,
provided that such recognition is required under legal obligation or constructive obligation and
those amounts can be reliably estimated. Any difference between the resolved amounts and the
subsequently actual distributed amounts is accounted for as changes in estimates.
130

(23) Employee share-based payments
Restricted shares
A. Restricted shares issued to employees are measured at the fair value of the equity instruments
granted at the grant date, and are recognized as compensation cost over the vesting period.
B. For restricted shares where those shares do not restrict distribution of dividends to employees
and employees are not required to return the dividends received if they resign during the vesting
period, the Group recognizes the fair value of the dividends received by employees who are
expected to resign during the vesting period as a compensation cost at the date the dividends
were declared.
C. For restricted shares where employees do not need to pay to acquire those shares, if an employee
resigns during the vesting period, the Group will recover and retire those shares at no cost.
(24) Income tax
A. The income tax expense for the period comprises current and deferred tax. Income tax is
recognized in profit or loss, except to the extent that it relates to items recognized in other
comprehensive income or items recognized directly in equity, in which cases the income tax is
recognized in other comprehensive income or equity.
B. The current income tax expense is calculated on the basis of the tax laws enacted or substantively
enacted at the balance sheet date in the countries where the Group and its subsidiaries operate
and generate taxable income. Management periodically evaluates positions taken in tax returns
with respect to situations in accordance with applicable tax regulations. It establishes provisions
where appropriate based on the amounts expected to be paid to the tax authorities. An additional
income tax is levied on the unappropriated retained earnings and is recorded as income tax
expense in the year the stockholders resolve to retain the earnings.
C. Deferred tax is recognized, using the balance sheet liability method, on temporary differences
arising between the tax bases of assets and liabilities and their carrying amounts in the
consolidated balance sheet. However, the deferred tax is not accounted for if it arises from initial
recognition of an asset or liability in a transaction other than a business combination that at the
time of the transaction affects neither accounting nor taxable profit or loss. Deferred tax is
provided on temporary differences arising on investments in subsidiaries and associates, except
where the timing of the reversal of the temporary difference is controlled by the Group and it is
probable that the temporary difference will not reverse in the foreseeable future. Deferred tax is
determined using tax rates (and laws) that have been enacted or substantially enacted at the
balance sheet date and are expected to apply when the related deferred tax asset is realized or the
deferred tax liability is settled.
D. Deferred tax assets are recognized only to the extent that it is probable that future taxable profit
will be available against which the temporary differences can be utilized. At each balance sheet
date, unrecognized and recognized deferred tax assets are reassessed.
E. A deferred tax asset shall be recognized for the carryforward of unused tax credits resulting from
equity investments to the extent that it is possible that future taxable profit will be available
against which the unused tax credits can be utilized.
131

F. If a change in tax rate is enacted or substantively enacted, the Group recognizes the effect of the
change immediately in the period in which the change occurs. The effect of the change on items
recognized outside profit or loss is recognized in other comprehensive income or equity while
the effect of the change on items recognized in profit or loss is recognized in profit or loss.
(25) Capital stock
A. Ordinary shares are classified as equity. Incremental costs directly attributable to the issue of
new shares in net proceeds of tax are shown in equity as a deduction.
B. Where the Company repurchases the Company’s shares that have been issued, the consideration
paid, including any directly attributable incremental costs (net of income taxes) is deducted from
equity attributable to the Company’s equity holders. Where such shares are subsequently reissued,
the difference between their book value and any consideration received, net of any directly
attributable incremental transaction costs and the related income tax effects, is included in equity
attributable to the Company’s equity holders.
(26) Dividends
Dividends are recorded in the Company’s financial statements in the period in which they are
resolved by the Company’s shareholders. Cash dividends are recorded as liabilities; stock dividends
are recorded as stock dividends to be distributed and are reclassified to ordinary shares on the
effective date of new shares issuance.
(27) Revenue recognition
A. The Group is primarily engaged in the customized assembly and testing services of high-
integration and high-precision integrated circuits based on customer’s specification demand to
create or enhance the product. When providing assembly and testing services, the Group
considers:
(a) Customer controls the provided raw materials and the Group receives the instruction from
the customer on providing assembly and testing services and subsequent treatments.
(b) The Group provides assembly and testing services to create or enhance an asset which is
solely provided and controlled by the customer. The Group has no right to transfer the asset
for another use.
As the asset ownership belongs to the customer, who bears the significant risk and rewards and
rights on the use of the asset, the Group recognizes assembly and testing service revenue based
on the progress towards completion of performance obligation during the service period.
B. The progress towards completion on assembly services, services for Liquid Crystal Display and
other Flat-Panel Display Driver Semiconductors (“LCDD”) and Bumping are measured by the
actual input costs relative to estimate total expected input costs. The progress towards completion
on testing services is measured by the actual incurred testing volume. The Group believes that
aforementioned methods are the most appropriate manner to measure the satisfaction of
performance obligation to customers because the input costs incurred to assembly and testing
volume completed in testing services are based on customer’s specification and not linear over
the duration of these services. Customer payment on assembly and testing services is based on
predetermined payment schedule. A contract asset is recognized when the Group provides
services in excess of customer’s payment.
132

(28) Operating segments
Operating segments are reported in a manner consistent with the internal reporting provided to the
chief operating decision maker. The Group’s chief operating decision maker, who is responsible for
allocating resources and assessing performance of the operating segments, has been identified as
the Chairman of the Board of Directors that makes strategic decisions.
5. CRITICAL ACCOUNTING JUDGMENTS, ESTIMATES AND KEY SOURCES OF ASSUMPTION
UNCERTAINTY
The preparation of the accompanying consolidated financial statements requires management to make
critical judgments in applying the Group’s accounting policies and make critical assumptions and
estimates concerning future events. Assumptions and estimates may differ from the actual results and are
continually evaluated and adjusted based on historical experience and other factors. Such assumptions
and estimates have a significant risk of causing a material adjustment to the carrying amounts of assets
and liabilities within the next financial year; and the related information is addressed below:
(1) Critical judgments in applying the Group’s accounting policies
Provisions for deficiency compensation
The Group is primarily engaged in the research, development, manufacturing, sale, and assembly and
testing of high-integration and high-precision integrated circuits. In any cases where deficiencies in
the assembly and testing services arise, the Group has to clarify the reason for deficiencies and
attribute of responsibilities. The Group follows the guidance of IAS 37 “Provisions, Contingent
Liabilities and Contingent Assets” to determine warranty provisions. Since the timing and amount of
these warranties are based on assumptions and estimates it requires management to make critical
judgments.
(2) Critical accounting estimates and assumptions
Revenue recognition
A. The Group recognizes revenue from services for assembly, LCDD and Bumping based on the
progress towards completion of performance obligation during the service period. The Group
estimates total expected input costs based on historical experience and measures the progress
towards completion by the actual input costs relative to the total expected input costs.
B. The Group estimates sales refund liabilities for sales allowance based on historical results and
other known factors. Provisions for such liabilities are recorded as a deduction to revenues when
the sales are recognized. The Group reassesses the reasonableness of estimates of discounts and
returns periodically.
6. DETAILS OF SIGNIFICANT ACCOUNTS
(1) Cash and cash equivalents
December 31, 2019 December 31, 2018
Cash on hand and petty cash $ 470 $ 470
Checking accounts and demand deposits 915,134 1,396,302
Time deposits 3,788,480 3,245,750
$ 4,704,084 $ 4,642,522
133

A. The Group transacts with a variety of financial institutions all with high credit quality to disperse
credit risk, so it expects that the probability of counterparty default is remote.
B. No cash and cash equivalents of the Group were pledged to others.
(2) Financial assets at amortized cost
December 31, 2019 December 31,2018
Current:
Time deposits $ 168,970 $ 169,168
Non-current:
Time deposits $ - $ 30,715
Restricted bank deposits 68,450 68,388
$ 68,450 $ 99,103
A. Amounts recognized in profit or loss in relation to financial assets at amortized cost are listed
below:
2019 2018
Interest income $ 4,467 $ 920
B. Without taking into account any collateral held or other credit enhancements, the maximum
exposure to credit risk in respect of the amount that best represents the financial assets at
amortized cost held by the Group is the carrying amount at the end of each reporting period.
C. Information about the financial assets at amortized cost that were pledged to others as collateral
is provided in Note 8.
D. Information relating to credit risk of financial assets at amortized cost is provided in Note 12(2).
(3) Accounts receivable
December 31, 2019 December 31, 2018
Accounts receivable $ 4,454,255 $ 4,747,834
Less: Loss allowance ( 1,351) ( 2,141)
$ 4,452,904 $ 4,745,693
A. The Group’s credit term granted to customers is 30~90 days. Receivables do not bear interest.
The loss allowance is determined based on the credit quality of customers. Information relating
to credit risk is provided in Note 12(2).
B. The aging analysis of accounts receivable based on past due date is as follows:
December 31, 2019 December 31, 2018
Current $ 4,440,081 $ 4,595,300
Within 1 month 13,733 18,807
1-2 months 441 131,787
2-3 months - 1,436
3-4 months - 180
Over 4 months - 324
$ 4,454,255 $ 4,747,834
134

C. As of December 31, 2019 and 2018, accounts receivable were all from contracts with customers.
And as of January 1, 2018, the balance of accounts receivable from contracts with customers was
$4,013,705.
D. Without taking into account of any collateral held or other credit enhancements, the amount that
best reflects the Group’ maximum exposure to credit risk in respect of the accounts receivable is
the carrying amount at the end of each reporting period.
E. No accounts receivable of the Group were pledged to others.
(4) Inventories
December 31, 2019
Cost
Allowance for
impairment losses Carrying amount
Raw materials $ 1,831,140 ($ 63,498 ) $ 1,767,642
December 31, 2018
Cost
Allowance for
impairment losses Carrying amount
Raw materials $ 1,814,992 ($ 36,157 ) $ 1,778,835
The cost of inventories recognized as an expense for the year:
2019 2018
Cost of revenue $ 16,372,032 $ 15,057,605
Loss on abandonment 12,369 5,497
Allowance for (reversal of) inventory valuation and
obsolescence loss 27,341 ( 13,070 )
$ 16,411,742 $ 15,050,032
A. Reversal of allowance for inventory valuation and obsolescence loss was recognized due to the
change in net realizable market value.
B. No inventories of the Group were pledged to others.
(5) Non-current financial assets at fair value through profit or loss
December 31, 2019 December 31, 2018
Financial assets mandatorily measured at fair value
through profit or loss
Foreign partnership interests $ 10,940 $ 10,940
Valuation adjustment 98 531
$ 11,038 $ 11,471
135

A. Amounts recognized in profit or loss in relation to the financial assets at fair value through profit
or loss are listed below:
2019 2018
Financial assets mandatorily measured at fair value through profit or loss
Foreign partnership interests ($ 433) $ 38 Beneficiary certificates 1,750 1,396
Derivative instruments - 51
$ 1,317 $ 1,485
B. No financial assets at fair value through profit or loss were pledged to others.
(6) Non-current financial assets at fair value through other comprehensive income
December 31, 2019 December 31, 2018
Designation of equity instruments
Foreign unlisted stocks $ 38,534 $ 38,534
Valuation adjustment 83,274 135,823
$ 121,808 $ 174,357
A. Based on the Group’s business model, the foreign unlisted stocks held for strategic investments
were elected to classify as “Financial assets at fair value through other comprehensive income”.
As of December 31, 2019 and 2018, the fair value of aforementioned investments is the carrying
amount at the end of each reporting period.
B. Amounts recognized in other comprehensive income in relation to the financial assets at fair value
through other comprehensive income are listed below:
2019 2018 Financial assets at fair value through other
comprehensive income
Foreign unlisted stocks ($ 52,549) $ 85,022
C. No financial assets at fair value through other comprehensive income were pledged to others.
(7) Investments accounted for using equity method
Associates December 31, 2019 December 31, 2018
JMC ELECTRONICS CO., LTD. (“JMC”) $ 249,793 $ 406,792
Unimos Microelectronics (Shanghai) Co., Ltd.
(“Unimos Shanghai”) 3,143,117 3,456,949
$ 3,392,910 $ 3,863,741
A. In January 2018, ChipMOS BVI participated in Unimos Shanghai’s increase of paid-in capital
based on its shareholding amounted to $794,694.
B. JMC has quoted market prices. As of December 31, 2019 and 2018, the fair value was $807,000
and $2,081,900, respectively.
136
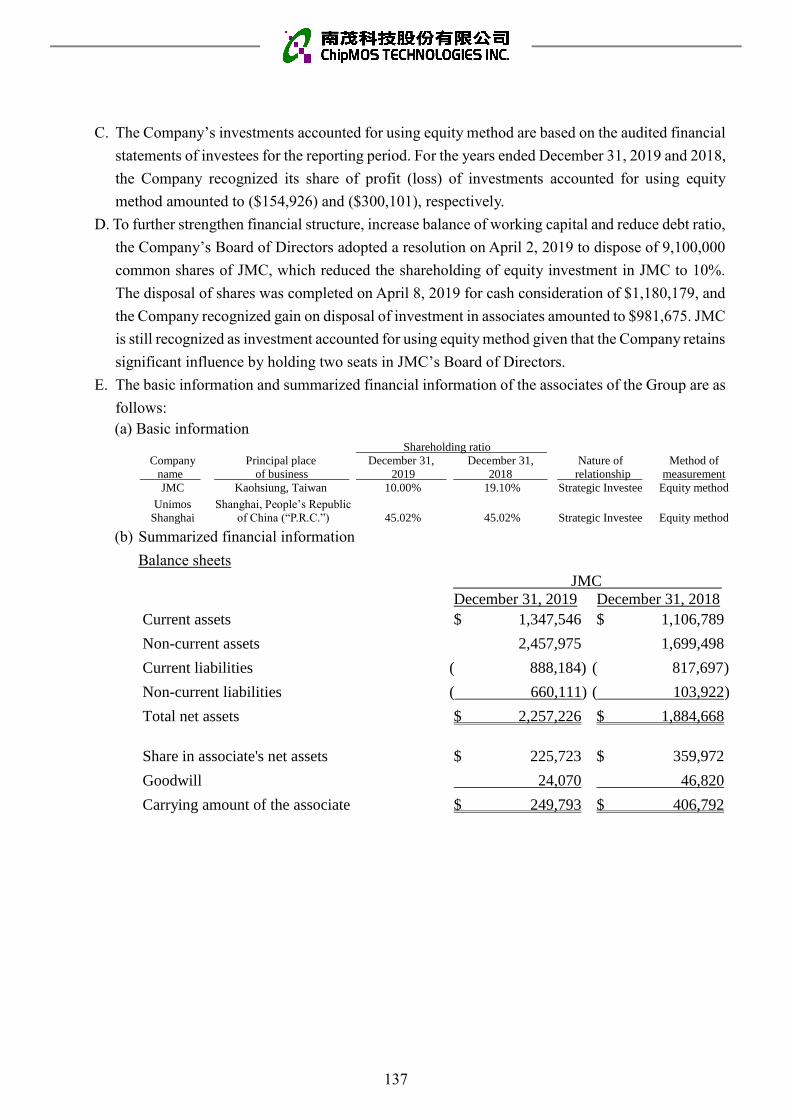
C. The Company’s investments accounted for using equity method are based on the audited financial
statements of investees for the reporting period. For the years ended December 31, 2019 and 2018,
the Company recognized its share of profit (loss) of investments accounted for using equity
method amounted to ($154,926) and ($300,101), respectively.
D. To further strengthen financial structure, increase balance of working capital and reduce debt ratio,
the Company’s Board of Directors adopted a resolution on April 2, 2019 to dispose of 9,100,000
common shares of JMC, which reduced the shareholding of equity investment in JMC to 10%.
The disposal of shares was completed on April 8, 2019 for cash consideration of $1,180,179, and
the Company recognized gain on disposal of investment in associates amounted to $981,675. JMC
is still recognized as investment accounted for using equity method given that the Company retains
significant influence by holding two seats in JMC’s Board of Directors.
E. The basic information and summarized financial information of the associates of the Group are as
follows:
(a) Basic information Shareholding ratio
Company
name
Principal place
of business
December 31,
2019
December 31,
2018
Nature of
relationship
Method of
measurement
JMC Kaohsiung, Taiwan 10.00% 19.10% Strategic Investee Equity method
Unimos
Shanghai
Shanghai, People’s Republic
of China (“P.R.C.”) 45.02% 45.02% Strategic Investee Equity method
(b) Summarized financial information
Balance sheets
JMC
December 31, 2019 December 31, 2018
Current assets $ 1,347,546 $ 1,106,789
Non-current assets 2,457,975 1,699,498
Current liabilities ( 888,184) ( 817,697 )
Non-current liabilities ( 660,111) ( 103,922 )
Total net assets $ 2,257,226 $ 1,884,668
Share in associate's net assets $ 225,723 $ 359,972
Goodwill 24,070 46,820
Carrying amount of the associate $ 249,793 $ 406,792
137

Balance sheets
Unimos Shanghai
December 31, 2019 December 31, 2018
Current assets $ 3,042,377 $ 3,946,082
Non-current assets 3,499,819 3,254,687
Current liabilities ( 459,502) ( 554,160 )
Non-current liabilities ( 448,929) ( 442,306 )
Total net assets $ 5,633,765 $ 6,204,303
Share in associate's net assets $ 2,536,558 $ 2,793,438
Depreciable assets 584,441 644,718
Goodwill 22,118 22,118
Inter-company transactions and amortization - ( 3,325 )
Carrying amount of the associate $ 3,143,117 $ 3,456,949
Statements of comprehensive income
JMC
2019 2018
Revenue $ 3,017,155 $ 1,931,008
Profit for the year from continuing operations $ 524,347 $ 219,544
Other comprehensive income (loss), net
of income tax 48,211 ( 14,074 )
Total comprehensive income $ 572,558 $ 205,470
Dividends received from the associate $ 20,000 $ 5,730
Statements of comprehensive income
Unimos Shanghai
2019 2018
Revenue $ 1,584,648 $ 1,334,196
Loss for the year from continuing operations ($ 352,008) ($ 629,303)
Other comprehensive income (loss), net of
income tax - -
Total comprehensive loss ($ 352,008) ($ 629,303)
Dividends received from the associate $ - $ -
138
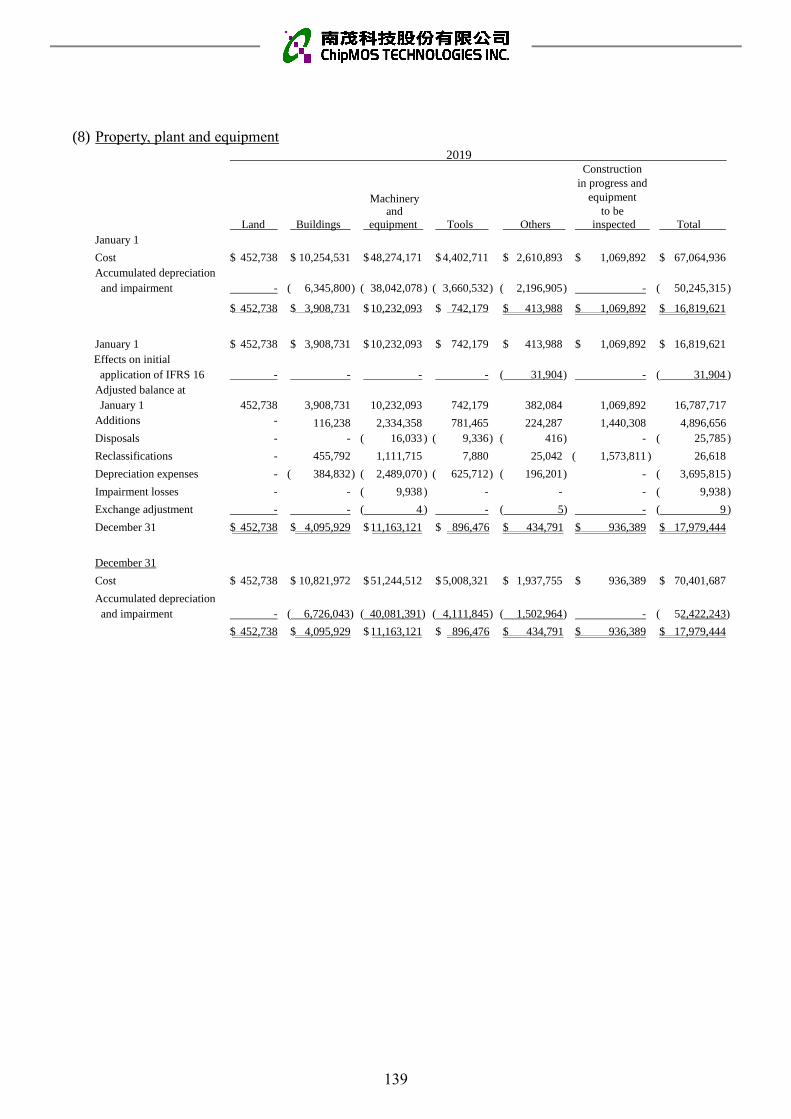
(8) Property, plant and equipment
2019
Machinery and
Construction
in progress and
equipment
to be
Land Buildings equipment Tools Others inspected Total
January 1
Cost $ 452,738 $ 10,254,531 $ 48,274,171 $ 4,402,711 $ 2,610,893 $ 1,069,892 $ 67,064,936
Accumulated depreciation
and impairment - ( 6,345,800 ) ( 38,042,078 ) ( 3,660,532 ) ( 2,196,905 ) - ( 50,245,315 )
$ 452,738 $ 3,908,731 $ 10,232,093 $ 742,179 $ 413,988 $ 1,069,892 $ 16,819,621
January 1 $ 452,738 $ 3,908,731 $ 10,232,093 $ 742,179 $ 413,988 $ 1,069,892 $ 16,819,621
Effects on initial
application of IFRS 16 - - - - ( 31,904 ) - ( 31,904 )
Adjusted balance at
January 1 452,738 3,908,731 10,232,093 742,179 382,084 1,069,892 16,787,717
Additions - 116,238 2,334,358 781,465 224,287 1,440,308 4,896,656
Disposals - - ( 16,033 ) ( 9,336 ) ( 416 ) - ( 25,785 )
Reclassifications - 455,792 1,111,715 7,880 25,042 ( 1,573,811 ) 26,618
Depreciation expenses - ( 384,832 ) ( 2,489,070 ) ( 625,712 ) ( 196,201 ) - ( 3,695,815 )
Impairment losses - - ( 9,938 ) - - - ( 9,938 )
Exchange adjustment - - ( 4 ) - ( 5) - ( 9 )
December 31 $ 452,738 $ 4,095,929 $ 11,163,121 $ 896,476 $ 434,791 $ 936,389 $ 17,979,444
December 31
Cost $ 452,738 $ 10,821,972 $ 51,244,512 $ 5,008,321 $ 1,937,755 $ 936,389 $ 70,401,687
Accumulated depreciation
and impairment - ( 6,726,043) ( 40,081,391) ( 4,111,845 ) ( 1,502,964 ) - ( 52,422,243)
$ 452,738 $ 4,095,929 $ 11,163,121 $ 896,476 $ 434,791 $ 936,389 $ 17,979,444
139

2018
Machinery and
Construction
in progress and
equipment
to be
Land Buildings equipment Tools Others inspected Total
January 1
Cost $ 452,738 $ 9,809,970 $ 45,778,207 $ 4,004,703 $ 2,624,083 $ 968,719 $ 63,638,420
Accumulated depreciation
and impairment - ( 5,890,884 ) ( 36,964,480 ) ( 3,314,234 ) ( 2,203,511 ) - ( 48,373,109 )
$ 452,738 $ 3,919,086 $ 8,813,727 $ 690,469 $ 420,572 $ 968,719 $ 15,265,311
January 1 $ 452,738 $ 3,919,086 $ 8,813,727 $ 690,469 $ 420,572 $ 968,719 $ 15,265,311
Additions - 247,186 2,445,313 591,229 172,652 1,489,190 4,945,570
Disposals - - ( 904 ) ( 11,745 ) ( 2,067 ) - ( 14,716 )
Reclassifications - 199,724 1,154,663 7,604 26,026 ( 1,388,017 ) -
Depreciation expenses - ( 457,265 ) ( 2,180,718 ) ( 535,378 ) ( 203,218 ) - ( 3,376,579 )
Exchange adjustment - - 12 - 23 - 35
December 31 $ 452,738 $ 3,908,731 $ 10,232,093 $ 742,179 $ 413,988 $ 1,069,892 $ 16,819,621
December 31
Cost $ 452,738 $ 10,254,531 $ 48,274,171 $ 4,402,711 $ 2,610,893 $ 1,069,892 $ 67,064,936
Accumulated depreciation
and impairment - ( 6,345,800 ) ( 38,042,078 ) ( 3,660,532 ) ( 2,196,905 ) - ( 50,245,315 )
$ 452,738 $ 3,908,731 $ 10,232,093 $ 742,179 $ 413,988 $ 1,069,892 $ 16,819,621
A. Amount of borrowing costs capitalized as part of property, plant and equipment and the range of
the interest rates for such capitalization are as follows:
2019 2018
Amount of interest capitalized $ 15,114 $ 18,542
Range of the interest rates for capitalization 1.7822% 1.7582%
B. Information about the property, plant and equipment that were pledged to others as collaterals is
provided in Note 8.
(9) Leasing arrangements-lessee
Effective from 2019
A. The Group leases various assets, including land, buildings, machinery and equipment, and others.
Lease agreements are typically made for periods of 2 to 30 years. Lease terms are negotiated on
an individual basis and contain a wide range of different terms and conditions. The lease
agreements do not impose covenants, but leased assets may not be used as security for borrowing
purposes.
140

B. The carrying amount of right-of-use assets and the depreciation expenses are as follows:
December 31, 2019 2019
Carrying amount Depreciation expenses
Land $ 669,967 ( $ 22,657 )
Buildings 15,043 ( 7,113 )
Machinery and equipment - ( 4,520 )
Others 2,058 ( 1,809 )
$ 687,068 ( $ 36,099 )
C. For the year ended December 31, 2019, additions to right-of-use assets was $11,183.
D. The information on profit and loss accounts relating to lease contracts is as follows:
2019
Items affecting profit or loss
Interest expense on lease liabilities $ 14,349
Expense on short-term lease contracts 230,589
E. For the year ended December 31, 2019, the Group’s total cash outflow for leases was $273,709.
(10) Accounts payable
December 31, 2019 December 31, 2018
Accounts payable $ 419,520 $ 267,368
Estimated accounts payable 400,028 369,903
$ 819,548 $ 637,271
(11) Current provisions
A. Movements in provisions are as follows:
Provisions for deficiency
compensation
2019
January 1 $ 29,352
Provision 5,204
Reversal ( 1,967 )
Payment ( 30,591 )
December 31 $ 1,998
B. The detailed explanation of provisions for deficiency compensation is provided in Note 5(1).
141
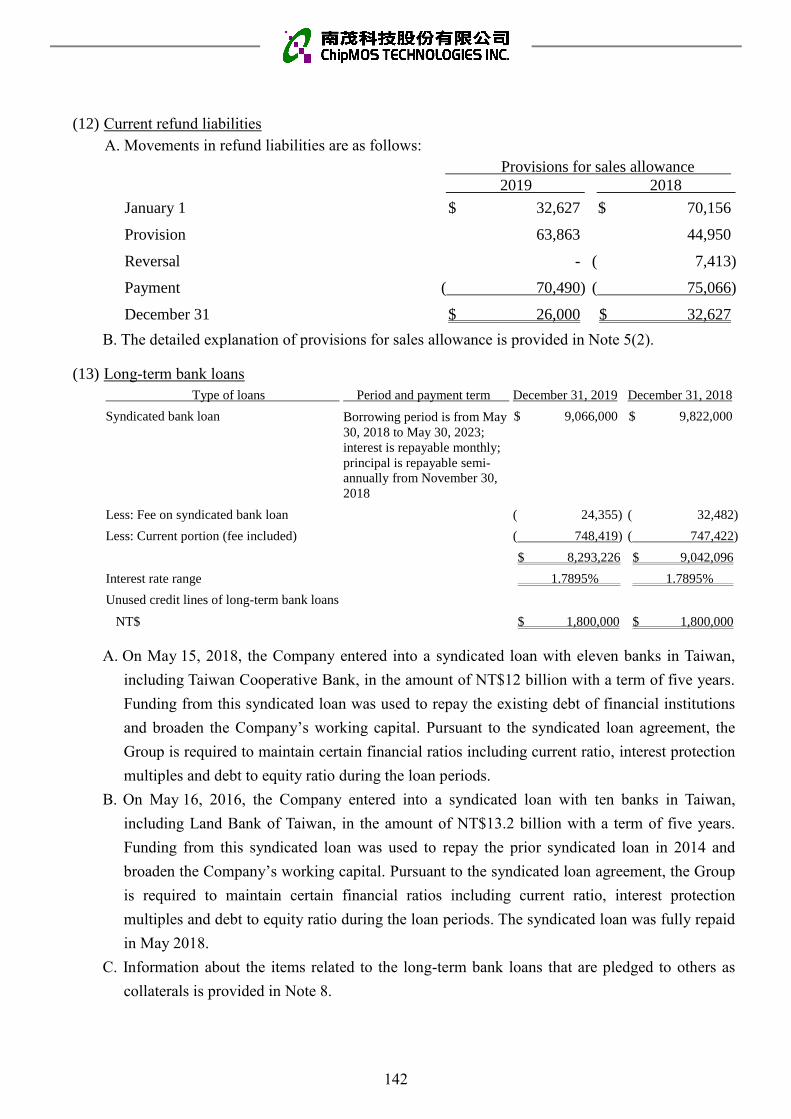
(12) Current refund liabilities
A. Movements in refund liabilities are as follows:
Provisions for sales allowance
2019 2018
January 1 $ 32,627 $ 70,156
Provision 63,863 44,950
Reversal - ( 7,413)
Payment ( 70,490) ( 75,066)
December 31 $ 26,000 $ 32,627
B. The detailed explanation of provisions for sales allowance is provided in Note 5(2).
(13) Long-term bank loans
Type of loans Period and payment term December 31, 2019 December 31, 2018
Syndicated bank loan Borrowing period is from May
30, 2018 to May 30, 2023;
interest is repayable monthly;
principal is repayable semi-
annually from November 30,
2018
$ 9,066,000 $ 9,822,000
Less: Fee on syndicated bank loan ( 24,355 ) ( 32,482)
Less: Current portion (fee included) ( 748,419) ( 747,422)
$ 8,293,226 $ 9,042,096
Interest rate range 1.7895% 1.7895%
Unused credit lines of long-term bank loans
NT$ $ 1,800,000 $ 1,800,000
A. On May 15, 2018, the Company entered into a syndicated loan with eleven banks in Taiwan,
including Taiwan Cooperative Bank, in the amount of NT$12 billion with a term of five years.
Funding from this syndicated loan was used to repay the existing debt of financial institutions
and broaden the Company’s working capital. Pursuant to the syndicated loan agreement, the
Group is required to maintain certain financial ratios including current ratio, interest protection
multiples and debt to equity ratio during the loan periods.
B. On May 16, 2016, the Company entered into a syndicated loan with ten banks in Taiwan,
including Land Bank of Taiwan, in the amount of NT$13.2 billion with a term of five years.
Funding from this syndicated loan was used to repay the prior syndicated loan in 2014 and
broaden the Company’s working capital. Pursuant to the syndicated loan agreement, the Group
is required to maintain certain financial ratios including current ratio, interest protection
multiples and debt to equity ratio during the loan periods. The syndicated loan was fully repaid
in May 2018.
C. Information about the items related to the long-term bank loans that are pledged to others as
collaterals is provided in Note 8.
142
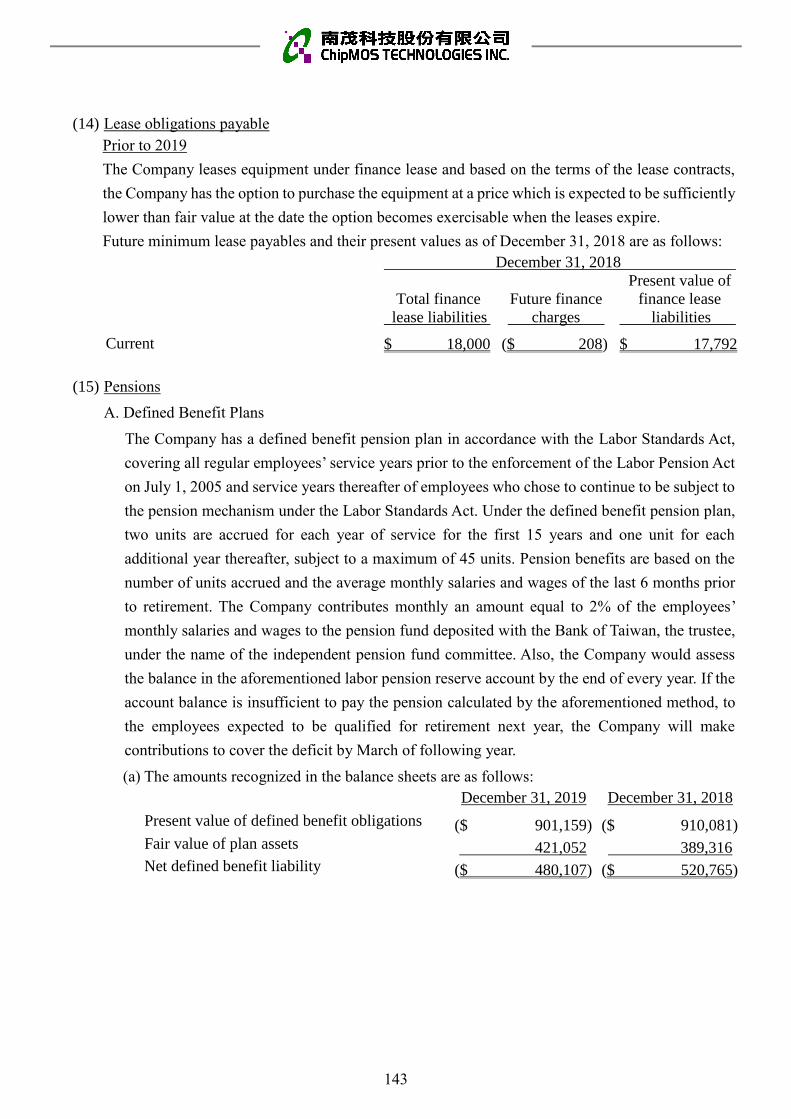
(14) Lease obligations payable
Prior to 2019
The Company leases equipment under finance lease and based on the terms of the lease contracts,
the Company has the option to purchase the equipment at a price which is expected to be sufficiently
lower than fair value at the date the option becomes exercisable when the leases expire.
Future minimum lease payables and their present values as of December 31, 2018 are as follows:
December 31, 2018
Total finance
lease liabilities
Future finance
charges
Present value of
finance lease
liabilities
Current $ 18,000 ($ 208) $ 17,792
(15) Pensions
A. Defined Benefit Plans
The Company has a defined benefit pension plan in accordance with the Labor Standards Act,
covering all regular employees’ service years prior to the enforcement of the Labor Pension Act
on July 1, 2005 and service years thereafter of employees who chose to continue to be subject to
the pension mechanism under the Labor Standards Act. Under the defined benefit pension plan,
two units are accrued for each year of service for the first 15 years and one unit for each
additional year thereafter, subject to a maximum of 45 units. Pension benefits are based on the
number of units accrued and the average monthly salaries and wages of the last 6 months prior
to retirement. The Company contributes monthly an amount equal to 2% of the employees’
monthly salaries and wages to the pension fund deposited with the Bank of Taiwan, the trustee,
under the name of the independent pension fund committee. Also, the Company would assess
the balance in the aforementioned labor pension reserve account by the end of every year. If the
account balance is insufficient to pay the pension calculated by the aforementioned method, to
the employees expected to be qualified for retirement next year, the Company will make
contributions to cover the deficit by March of following year.
(a) The amounts recognized in the balance sheets are as follows:
December 31, 2019 December 31, 2018
Present value of defined benefit obligations ($ 901,159) ($ 910,081)
Fair value of plan assets 421,052 389,316
Net defined benefit liability ($ 480,107) ($ 520,765)
143

(b) Movements in net defined benefit liability are as follows:
2019
Present value of
defined benefit Fair value of Net defined
obligations plan assets benefit liability
January 1 ($ 910,081 ) $ 389,316 ($ 520,765 )
Current services cost ( 332 ) - ( 332 )
Interest (expense) income ( 11,170 ) 4,831 ( 6,339 )
( 921,583 ) 394,147 ( 527,436 )
Remeasurements:
Return on plan assets (excluding
amounts included in interest income
or expense) - 12,601 12,601
Financial assumption movement
effect ( 27,993 ) - ( 27,993 )
Experience adjustments 36,308 - 36,308
8,315 12,601 20,916
Pension fund contribution - 26,413 26,413
Paid pension 12,109 ( 12,109 ) -
December 31 ($ 901,159 ) $ 421,052 ($ 480,107 )
2018
Present value of
defined benefit Fair value of Net defined
obligations plan assets benefit liability
January 1 ($ 838,543 ) $ 360,017 ($ 478,526 )
Current services cost ( 382 ) - ( 382 )
Interest (expense) income ( 14,429 ) 6,291 ( 8,138 )
( 853,354 ) 366,308 ( 487,046 )
Remeasurements:
Return on plan assets (excluding
amounts included in interest income
or expense) - 8,145 8,145
Financial assumption movement
effect ( 56,934 ) - ( 56,934 )
Experience adjustments ( 11,172 ) - ( 11,172 )
( 68,106 ) 8,145 ( 59,961 )
Pension fund contribution - 26,242 26,242
Paid pension 11,379 ( 11,379 ) -
December 31 ($ 910,081 ) $ 389,316 ($ 520,765 )
144

(c) The Bank of Taiwan was commissioned to manage the fund of the Company’s defined benefit
pension plan in accordance with the fund’s annual investment and utilization plan and the
“Regulations for Revenues, Expenditures, Safeguard and Utilization of the Labor Retirement
Fund” (Article 6: The scope of utilization for the fund includes deposit in domestic or foreign
financial institutions, investment in domestic or foreign listed, over-the-counter, or private
placement equity securities, investment in domestic or foreign real estate securitization
products, etc.). With regard to the utilization of the fund, its minimum earnings in the annual
distributions on the final financial statements shall be no less than the earnings attainable
from the amounts accrued from two-year time deposits with the interest rates offered by local
banks. If the earnings is less than aforementioned rates, government shall make payment for
the deficit after being authorized by the authority. The Company has no right to participate in
managing and operating that fund and hence the Company is unable to disclose the
classification of the fair value of plan asset in accordance with IAS 19 “Employee Benefits”
paragraph 142. The composition of fair value of plan assets as of December 31, 2019 and
2018 is given in the Annual Labor Retirement Fund Utilization Report announced by the
government.
(d) The principal actuarial assumptions used were as follows:
2019 2018
Discount rate 1.00% 1.25%
Future salary increase 3.50% 3.50%
Assumptions regarding future mortality are set based on actuarial advice in accordance with
published statistics and experience in each territory.
Because the main actuarial assumption changed, the present value of defined benefit
obligations is affected. The analysis was as follows:
Discount rate Future salary increase
Increase Decrease Increase Decrease
0.25% 0.25% 0.25% 0.25%
December 31, 2019
Effect on present value of
defined benefit obligations ($ 27,993 ) $ 29,284 $ 28,501 ($ 27,407 )
December 31, 2018
Effect on present value of
defined benefit obligations ($ 29,052 ) $ 30,430 $ 29,692 ($ 28,513 )
The sensitivity analysis above is based on a change in an assumption while holding all other
assumptions constant. In practice, changes in some of the assumptions may be correlated.
The method of sensitivity analysis and the method of calculating net defined benefit liability
in the balance sheet are the same.
The methods and types of assumptions used in preparing the sensitivity analysis remain
unchanged from previous period.
145

(e) Expected contributions to the defined benefit pension plans of the Company for the year
ending December 31, 2020 amounts to $27,337.
(f) As of December 31, 2019, the weighted average duration of that retirement plan is 12.8 years.
The analysis of timing of the future pension payment was as follows:
Within 1 year $ 35,272
1-2 years 34,647
2-5 years 122,670
5-10 years 167,707
$ 360,296
B. Defined Contribution Plans
Effective from July 1, 2005, the Company established a defined contribution pension plan (“New
Plan”) under the Labor Pension Act, covering all regular employees with Republic of China
(“R.O.C.”) nationality. Under the New Plan, the Company contributes monthly an amount based
on 6% of the employees’ monthly salaries and wages to the employees’ individual pension
accounts at the Bureau of Labor Insurance. The benefits accrued are paid monthly or in lump
sum upon termination of employment. The pension costs under defined contribution pension
plans of the Company for the years ended December 31, 2019 and 2018 were $187,502 and
$193,047, respectively.
(16) Share-based payments
Restricted shares
A. On July 14, 2015, the Company’s Board of Directors approved the issuance of restricted shares.
The record dates for the shares issuance were July 21, 2015 and May 10, 2016. The relevant
information is as follows: Share price Number of Number of shares returned due to
employee resignation (in thousands) Type of on grant date shares Contract
arrangement Grant date (in dollars) (in thousands) 2019 2018 period Vesting condition Restricted shares
award agreement
July 21,
2015
36.1 15,752 - ( 256) 3 years Meet service and
performance
conditions Restricted shares
award agreement
May 10,
2016
30.6 1,548 ( 25) ( 116) 3 years Meet service and
performance
conditions
The restricted shares issued by the Company cannot be transferred during the vesting period, but
voting right and dividend right are not restricted. Employees are required to return the shares but
not required to return the dividends received if they resign during the vesting period. When the
employees accomplish the years of service and performance conditions, the received restricted
shares will be vested based on the vesting ratio.
B. The expenses incurred on share-based payment transactions for the years ended December 31,
2019 and 2018 were $822 and $41,043, respectively.
146

(17) Capital stock
A. As of December 31, 2019, the Company’s authorized capital was $9,700,000, consisting of
970,000 thousand ordinary shares, and the paid-in capital was $7,272,401 with a par value of
$10 (in dollars) per share, consisting of 727,240 thousand ordinary shares. All proceeds from
shares issued have been collected.
B. As of December 31, 2019, the outstanding ADSs were approximately 4,801,737 units
representing 96,035 thousand ordinary shares and each ADS represents 20 ordinary shares of the
Company. The major terms and conditions of the ADSs are summarized as follows:
(a) Voting rights:
ADS holders have no right to directly vote in shareholders’ meetings with respect to the
deposited shares. The depository bank shall vote on behalf of ADS holders or provide voting
instruction to the designated person of the Company. The depository bank shall vote in the
manner as instructed by ADS holders.
(b) Distribution of dividends:
ADS holders are deemed to have the same rights as holders of ordinary shares with respect
to the distribution of dividends.
C. Movements in the number of the Company’s ordinary shares outstanding are as follows:
Number of shares (in thousands)
2019 2018
January 1 727,265 856,059
Restricted shares − cancelled ( 25 ) ( 349 )
Restricted shares − uncancelled - ( 23 )
Capital reduction - ( 128,422 )
December 31 727,240 727,265
D. Treasury stock
(a) On March 7, 2019 and August 6, 2019, the Company’s Board of Directors approved the
cancellation of treasury stock 25,570 thousand shares amounted to $962,503. As of December
31, 2019, all of the Company's treasury stocks were cancelled. As of December 31, 2018, the
reasons for share repurchases are as follows:
December 31, 2018
Name of company Number of shares
holding the shares Reason for repurchase (in thousands) Carrying amount
The Company To be reissued to employees 30,000 $ 1,005,011
The Company Dissenting shareholders 85 2,643
The Company Capital reduction ( 4,515 ) ( 45,151 )
25,570 $ 962,503
147

(b) Pursuant to the R.O.C. Securities and Exchange Act, the number of shares repurchased as
treasury stock may not exceed 10% of the number of the Company’s issued shares and the
amount bought back may not exceed the sum of retained earnings, paid-in capital in excess
of par value and realized capital surplus.
(c) Pursuant to the R.O.C. Securities and Exchange Act, treasury stock may not be pledged as
collateral and is not entitled to dividends before it is reissued.
(d) Pursuant to the R.O.C. Securities and Exchange Act, treasury stock should be reissued to the
employees within five years from the reacquisition date and shares not reissued within the
five-year period are to be retired. Treasury stock to enhance the Company’s credit rating and
the stockholders’ equity should be retired within six months from acquisition.
E. In order to adjust capital structure and increase return of equity, the Company’s shareholders
adopted a resolution on June 26, 2018 to reduce capital stock and return cash to shareholders.
Subsequently, the record date of the capital reduction was fixed on August 15, 2018, and capital
was reduced approximately 15% amounted to $1,329,446, consisting of 132,945 thousand
ordinary shares.
(18) Capital surplus
Pursuant to the R.O.C. Company Act, any capital surplus arising from paid-in capital in excess of
par value on issuance of ordinary shares and donations can be used to cover accumulated deficits or
to issue new shares or cash to shareholders in proportion to their share ownership, provided that the
Company has no accumulated deficits. Furthermore, the R.O.C. Securities and Exchange Act
requires that the amount of capital surplus to be capitalized mentioned above may not exceed 10%
of the paid-in capital each year. The capital surplus may not be used to cover accumulated deficits
unless the legal reserve is insufficient.
2019
Share
Employee
restricted Long-term
premium shares investment Total
January 1 $ 5,873,743 $ 382,506 $ 24,233 $ 6,280,482
Share-based payments - ( 412 ) - ( 412 )
Cancellation of treasury stock ( 199,501) ( 12,853 ) - ( 212,354 )
Disposal of investment accounted for using
equity method - - ( 8,065) ( 8,065 )
December 31 $ 5,674,242 $ 369,241 $ 16,168 $ 6,059,651
2018
Share
Employee
restricted Long-term
premium shares investment Total
January 1 $ 5,873,743 $ 390,401 $ 24,233 $ 6,288,377
Share-based payments - ( 7,967 ) - ( 7,967 )
Capital reduction - 72 - 72
December 31 $ 5,873,743 $ 382,506 $ 24,233 $ 6,280,482
148

(19) Retained earnings
A. Under the Company’s Articles of Incorporation, the current year’s earnings, if any, shall first be
used to pay all taxes and offset prior years’ operating losses and then 10% of the remaining
amount shall be set aside as a legal reserve. The Company may then appropriate or reverse a
certain amount as special reserve according to the relevant regulations. After the distribution of
earnings, the remaining earnings and prior years’ unappropriated retained earnings may be
appropriated according to a proposal by the Board of Directors and approved in the shareholders’
meeting.
B. The Company’s dividend policy is summarized here. As the Company operates in a volatile
business environment, the issuance of dividends to be distributed takes into consideration the
Company’s financial structure, operating results and future expansion plans. The earnings
distribution of the Company may be made by way of cash dividends or stock dividends, provided
that cash dividends account for at least 10% of the total dividends distributed. The earnings
distribution will be proposed by the Board of Directors and approved at the shareholders’ meeting.
C. Except for covering accumulated deficits or issuing new shares or cash to shareholders in
proportion to their share ownership, the legal reserve may not be used for any other purpose. The
use of the legal reserve for the issuance of shares or cash to shareholders in proportion to their
share ownership is permitted, provided that the distribution of the reserve is limited to the portion
in excess of 25% of the Company’s paid-in capital.
D. In accordance with the regulations, the Company must set aside a special reserve from the debit
balance on other equity items at the balance sheet date before distributing earnings. When the
debit balance on other equity items is reversed subsequently, the reversed amount may be
included in the distributable earnings.
E. The appropriations of 2018 and 2017 earnings were resolved in the shareholders’ meetings held
on June 10, 2019 and June 26, 2018, respectively. The appropriations and dividends per share
are as follows:
2018 2017
Cash
distribution
Cash
distribution
per share per share
Amount (in dollars) Amount (in dollars)
Legal reserve $ 110,308 $ 302,653
Cash dividend 872,718 $ 1.20 256,806 $ 0.30
F. The information relating to employees’ compensation and directors’ remuneration is provided in
Note 6(27).
149

(20) Other equity interest
2019
Financial
statements
translation
differences of
foreign
Unrealized gain
(loss) on valuation
of financial assets at
fair value through
other comprehensive
Unearned
employee
operations income awards Total
January 1 $ 14,516 $ 106,898 ($ 1,701) $ 119,713
Currency translation differences
- The Company ( 104,198) - - ( 104,198 )
Employee restricted shares
- The Company - - 1,701 1,701
Evaluation adjustment
- The Company - ( 52,549) - ( 52,549 )
- Associates - 5,093 - 5,093
Evaluation adjustment related tax
- The Company - 10,510 - 10,510
Disposal of investment accounted
for using equity method - ( 72 ) - ( 72 )
December 31 ($ 89,682) $ 69,880 $ - ($ 19,802)
2018
Financial
statements
translation
differences
of foreign
Unrealized gain
(loss) on
valuation of
financial assets
at fair value
through other
comprehensive
Unrealized
gain (loss)
on valuation
of available-
for-sale
financial
Unearned
employee
operations income assets awards Total
January 1 $ 65,593 $ - $ 678 ($ 54,570) $ 11,701
Effects on initial application of
IFRS 9 - 42,843 ( 678 ) - 42,165
Adjusted beginning balance 65,593 42,843 - ( 54,570) 53,866
Currency translation differences
- The Company ( 51,077) - - - ( 51,077)
Employee restricted shares
- The Company - - - 52,869 52,869
Evaluation adjustment
- The Company - 85,022 - - 85,022
- Associates - ( 2,438) - - ( 2,438)
Evaluation adjustment related tax
- The Company - ( 18,529) - - ( 18,529)
December 31 $ 14,516 $ 106,898 $ - ($ 1,701) $ 119,713
150
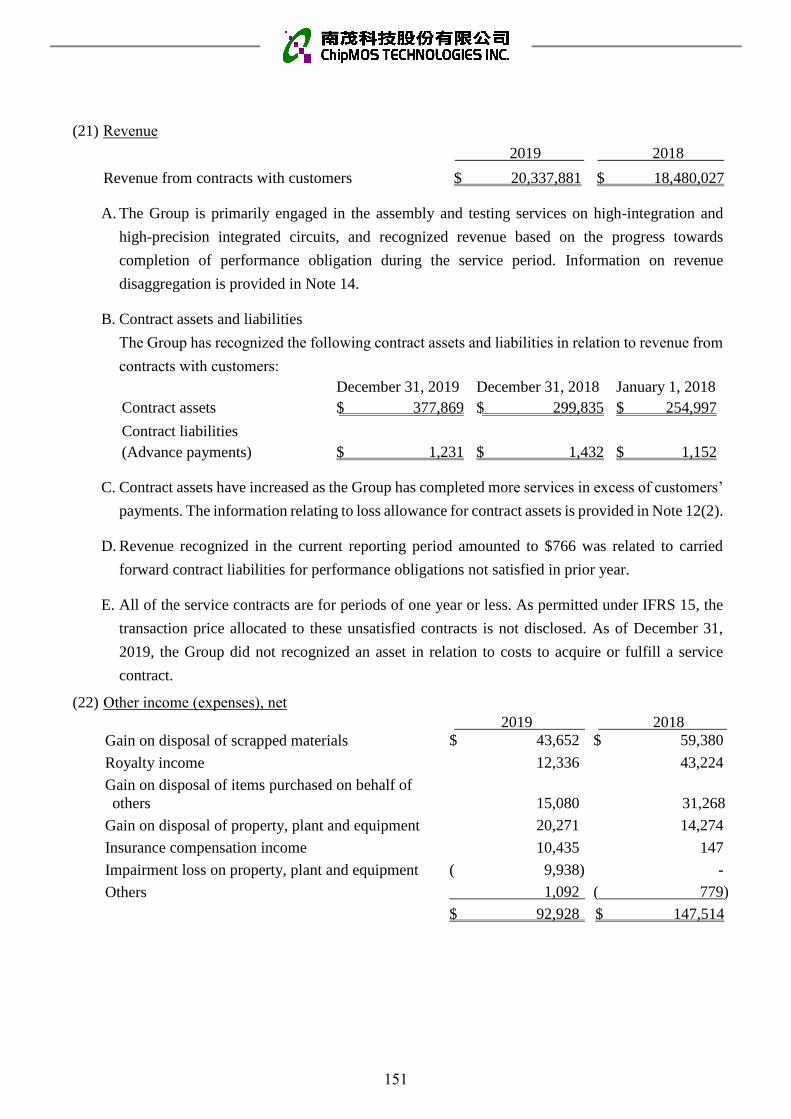
(21) Revenue
2019 2018
Revenue from contracts with customers $ 20,337,881 $ 18,480,027
A. The Group is primarily engaged in the assembly and testing services on high-integration and
high-precision integrated circuits, and recognized revenue based on the progress towards
completion of performance obligation during the service period. Information on revenue
disaggregation is provided in Note 14.
B. Contract assets and liabilities
The Group has recognized the following contract assets and liabilities in relation to revenue from
contracts with customers:
December 31, 2019 December 31, 2018 January 1, 2018
Contract assets $ 377,869 $ 299,835 $ 254,997
Contract liabilities
(Advance payments) $ 1,231 $ 1,432 $ 1,152
C. Contract assets have increased as the Group has completed more services in excess of customers’
payments. The information relating to loss allowance for contract assets is provided in Note 12(2).
D. Revenue recognized in the current reporting period amounted to $766 was related to carried
forward contract liabilities for performance obligations not satisfied in prior year.
E. All of the service contracts are for periods of one year or less. As permitted under IFRS 15, the
transaction price allocated to these unsatisfied contracts is not disclosed. As of December 31,
2019, the Group did not recognized an asset in relation to costs to acquire or fulfill a service
contract.
(22) Other income (expenses), net
2019 2018
Gain on disposal of scrapped materials $ 43,652 $ 59,380
Royalty income 12,336 43,224
Gain on disposal of items purchased on behalf of
others 15,080 31,268
Gain on disposal of property, plant and equipment 20,271 14,274
Insurance compensation income 10,435 147
Impairment loss on property, plant and equipment ( 9,938) -
Others 1,092 ( 779)
$ 92,928 $ 147,514
151

(23) Other income
2019 2018
Interest income
Bank deposits $ 59,901 $ 49,051
Financial assets at amortized cost 4,467 920
64,368 49,971
Rental income 9,249 7,819
Dividend income 585 571
Grant income 925 -
$ 75,127 $ 58,361
(24) Other gains and losses
2019 2018
Foreign exchange (losses) gains, net ($ 154,993 ) $ 93,104
Gain on disposals of investment accounted for using
equity method 981,675 -
Reimbursement of ADSs service charge 4,292 13,269
Gain on valuation of financial assets at fair value
through profit or loss 1,317 1,485
Others 970 6,851
$ 833,261 $ 114,709
(25) Finance costs
2019 2018
Interest expense
Bank loans $ 171,840 $ 170,476
Lease liabilities 14,349 -
Lease obligations payable - 482
Less: Amounts capitalized in qualifying assets ( 15,114 ) ( 18,542 )
171,075 152,416
Finance expense 9,187 37,832
$ 180,262 $ 190,248
(26) Expenses by nature
2019 2018
Raw materials and supplies used $ 3,575,283 $ 3,079,909
Employee benefit expenses 6,075,773 5,606,833
Depreciation expenses 3,731,914 3,376,579
Others 4,590,720 4,464,499
$ 17,973,690 $ 16,527,820
152

(27) Employee benefit expenses
2019 2018
Salaries $ 5,114,790 $ 4,628,039
Directors’ remuneration 26,266 18,456
Labor and health insurance 422,106 406,111
Pension 194,173 201,567
Share-based payments 822 41,043
Other personnel expenses 317,616 311,617
$ 6,075,773 $ 5,606,833
A. In accordance with the Company’s Articles of Incorporation, employees’ compensation is based
on the current year’s earnings, which should first be used to cover accumulated deficits, if any,
and then 10% of the remaining balance distributed as employees’ compensation, including
distributions to certain qualifying employees in affiliate companies, and no more than 0.5% as
directors’ remuneration. Subject to the Board of Directors’ approval, employees’ compensation
may be made by way of cash or share issuance. Distribution of employees’ compensation and
directors’ remuneration shall be presented and reported in the subsequent shareholders’ meeting.
B. Based on profit distributable as of the end of reporting period, for the years ended December 31,
2019 and 2018, the employees’ compensation were accrued at $338,356 and $199,027,
respectively; the directors’ remuneration were accrued at $16,918 and $ 9,951, respectively.
C. For the year of 2018, employees’ compensation and directors’ remuneration recognized were
consistent with the amounts resolved in the Board of Directors’ meetings.
Information about the appropriation of employees’ compensation and directors’ remuneration by
the Company as approved by the Board of Directors is posted in the “Market Observation Post
System”.
153

(28) Income tax expense
A. Income tax expense
(a) Components of income tax expense:
2019 2018
Current income tax:
Current income tax on profits for the period $ 408,788 $ 326,057
Income tax on unappropriated retained earnings 7,019 250,914
Prior year income tax (over) under estimation ( 5,016 ) 3,729
Total current income tax 410,791 580,700
Deferred income tax:
Relating to origination and reversal of temporary
differences 35,367 101,441
Impact of change in tax rate - ( 2,774)
Total deferred income tax 35,367 98,667
Income tax expense $ 446,158 $ 679,367
(b) The income tax (charge)/credit relating to components of other comprehensive income is as
follows:
2019 2018
Unrealized (loss) gain on valuation of financial assets
at fair value through other comprehensive income ($ 10,510) $ 17,005
Remeasurement of defined benefit obligations 4,183 ( 11,992 )
Impact of change in tax rate - ( 887 )
($ 6,327) $ 4,126
B. Reconciliation of income tax expense and the accounting profit:
2019 2018
Tax calculated based on profit before tax and statutory
tax rate $ 606,917 $ 356,488
Expenses disallowed by tax regulation 3,055 14,689
Tax exempted (income) expenses by tax regulation ( 165,979 ) 66,353
Temporary difference not recognized as deferred tax
assets ( 608 ) ( 10,951 )
Prior year income tax (over) under estimation ( 5,016 ) 3,729
Income tax on unappropriated retained earnings 7,019 250,914
Impact of change in tax rate - ( 2,774 )
Effect of different tax rates in countries in which the
Group operates 770 919
Income tax expense $ 446,158 $ 679,367
154
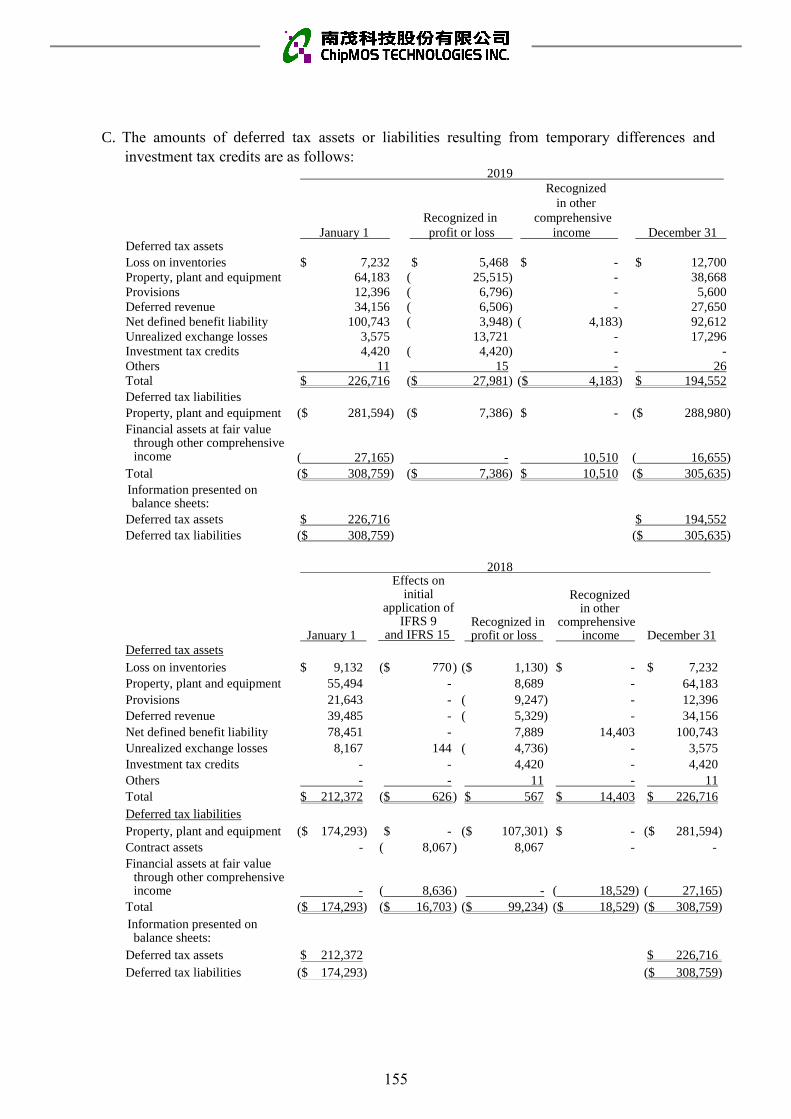
C. The amounts of deferred tax assets or liabilities resulting from temporary differences and
investment tax credits are as follows: 2019
Recognized in
Recognized
in other
comprehensive
January 1 profit or loss income December 31 Deferred tax assets
Loss on inventories $ 7,232 $ 5,468 $ - $ 12,700
Property, plant and equipment 64,183 ( 25,515) - 38,668
Provisions 12,396 ( 6,796) - 5,600
Deferred revenue 34,156 ( 6,506) - 27,650
Net defined benefit liability 100,743 ( 3,948) ( 4,183) 92,612
Unrealized exchange losses 3,575 13,721 - 17,296
Investment tax credits 4,420 ( 4,420) - -
Others 11 15 - 26
Total $ 226,716 ($ 27,981) ($ 4,183) $ 194,552
Deferred tax liabilities
Property, plant and equipment ($ 281,594) ($ 7,386) $ - ($ 288,980)
Financial assets at fair value through other comprehensive income ( 27,165) - 10,510 ( 16,655)
Total ($ 308,759) ($ 7,386) $ 10,510 ($ 305,635)
Information presented on balance sheets:
Deferred tax assets $ 226,716 $ 194,552
Deferred tax liabilities ($ 308,759) ($ 305,635)
2018 Effects on
initial application of
IFRS 9 and IFRS 15
Recognized in profit or loss
Recognized in other
comprehensive income January 1 December 31
Deferred tax assets
Loss on inventories $ 9,132 ($ 770 ) ($ 1,130) $ - $ 7,232
Property, plant and equipment 55,494 - 8,689 - 64,183
Provisions 21,643 - ( 9,247) - 12,396
Deferred revenue 39,485 - ( 5,329) - 34,156
Net defined benefit liability 78,451 - 7,889 14,403 100,743
Unrealized exchange losses 8,167 144 ( 4,736) - 3,575
Investment tax credits - - 4,420 - 4,420
Others - - 11 - 11
Total $ 212,372 ($ 626 ) $ 567 $ 14,403 $ 226,716
Deferred tax liabilities
Property, plant and equipment ($ 174,293) $ - ($ 107,301) $ - ($ 281,594)
Contract assets - ( 8,067 ) 8,067 - -
Financial assets at fair value through other comprehensive income - ( 8,636 ) - ( 18,529) ( 27,165)
Total ($ 174,293) ($ 16,703 ) ($ 99,234) ($ 18,529) ($ 308,759)
Information presented on balance sheets:
Deferred tax assets $ 212,372 $ 226,716
Deferred tax liabilities ($ 174,293) ($ 308,759)
155

D. The Company has not recognized deductible and taxable temporary differences associated with
investments as deferred tax assets and liabilities. As of December 31, 2019 and 2018, the amount
of taxable temporary differences not recognized as deferred tax liability were $180,395 and
$495,154, respectively.
E. The Company’s income tax returns through 2016 have been assessed and approved by the Tax
Authority.
F. The amendment to the Income Tax Act has been approved and promulgated in February 2018 to
raise the profit-seeking enterprise income tax rate from 17% to 20%, decrease the tax rate on
unappropriated retained earnings from 10% to 5%, and abandon the imputation tax credit
account effective from fiscal year starting January 1, 2018.
G. On October 31, 2016, the Company merged with its former parent company, ChipMOS
TECHNOLOGIES (Bermuda) LTD. and as a result, the Company recognized its own shares
originally held by former parent company as treasury stock. Subsequently, the Company
deducted unappropriated retained earnings by $5,052,343 to reflect the loss due from the
cancellation of treasury stock. In January 2017, the Company has filed an application to the
National Taxation Bureau of the Northern Area, Ministry of Finance to apply the accumulated
deficit amount, derived from subtracting the aforementioned amount from unappropriated
retained earnings generated prior to year 2015 (not including 2015 unappropriated retained
earnings), as a deduction in the calculation of years 2016 and 2015 additional 10% tax on
unappropriated retained earnings. On August 26, 2019, the Ministry of Finance issued
Interpretation No.10804006760 and agreed the aforementioned deduction of unappropriated
retained earnings to reflect the loss due from the cancellation of treasury stock as a result of the
merger. As of the issue date of this report, the Company has not received the Notice for
Assessment of Tax approved by the National Taxation Bureau of the Northern Area, Ministry of
Finance.
(29) Earnings per share 2019
Amount after
Weighted average
number of ordinary
shares outstanding
Earnings per
share
Basic earnings per share income tax (in thousands) (in dollars)
Profit attributable to common share of the Company $ 2,584,161 727,111 $ 3.55
Diluted earnings per share
Assumed conversion of all dilutive potential ordinary
shares:
Employees' compensation 9,879
Restricted shares 126
Profit attributable to common share of the Company $ 2,584,161 737,116 $ 3.51
156

2018
Amount after
Weighted average
number of ordinary
shares outstanding
Earnings per
share
Basic earnings per share income tax (in thousands) (in dollars)
Profit attributable to common share of the Company $ 1,103,075 802,725 $ 1.37
Diluted earnings per share
Assumed conversion of all dilutive potential ordinary
shares:
Employees' compensation 7,626
Restricted shares 3,356
Profit attributable to common share of the Company $ 1,103,075 813,707 $ 1.36
(30) Operating lease commitments
Prior to 2019
A. The Company has entered into several operating lease contracts for land with Hsinchu and
Southern Taiwan Science Park Bureaus. These renewable operating leases will expire by 2032
and 2034. In accordance with the lease contracts, Science Park Bureau reserves the right to adjust
annual rents and the annual rents for the year ended 2018 was $33,142.
B. ChipMOS USA has entered into renewable operating lease contracts for its office. The renewable
operating leases will expire by 2019 and 2020.
C. Future aggregate minimum lease obligations payable under the aforementioned leases are as
follows:
December 31, 2018
Within 1 year $ 68,631
1 to 5 years 140,137
Over 5 years 111,446
$ 320,214
(31) Supplemental cash flow information
Partial cash paid for investing activities
Property, plant and equipment
2019 2018
Purchase of property, plant and equipment $ 4,896,656 $ 4,945,570
Add: Beginning balance of payable on equipment 1,516,735 713,313
Beginning balance of payable on lease - 29,842
Less: Ending balance of payable on equipment ( 972,770 ) ( 1,516,735 )
Ending balance of payable on lease - ( 17,792 )
Cash paid during the year $ 5,440,621 $ 4,154,198
157

(32) Changes in liabilities from financing activities
2019
Long-term
bank loans
(including
current portion)
Guarantee
deposits
Lease
liabilities
Total liabilities
from financing
activities
January 1 $ 9,789,518 $ 1,092 $ - $ 9,790,610
Effects on initial application of
IFRS 16 - - 884,275 884,275
Adjusted balance at January 1 9,789,518 1,092 884,275 10,674,885
Changes in cash flow from
financing activities ( 756,450) 3 ( 48,161) ( 804,608)
Adjustment to right-of-use assets - - ( 148,512) ( 148,512)
Reclassification to payable on
equipment from lease liabilities - - ( 9,000) ( 9,000)
Amortization of loan fees 8,577 - - 8,577
Amortization of interest expense - - 14,349 14,349
December 31 $ 9,041,645 $ 1,095 $ 692,951 $ 9,735,691
2018
Short-term
bank loans
Long-term
bank loans
(including
current portion)
Guarantee
deposits
Total liabilities
from financing
activities
January 1
$ 969,353 $
9,642,021
$ 1,371 $ 10,612,745
Changes in cash flow from
financing activities ( 969,353) 110,250 ( 279) ( 859,382)
Amortization of loan fees - 37,247 - 37,247
December 31 $ - $ 9,789,518 $ 1,092 $ 9,790,610
7. RELATED PARTY TRANSACTIONS
(1) Parent and ultimate controlling party
The Company has neither a parent company nor an ultimate controlling party. The transactions
between the Company and its subsidiaries were eliminated in the accompanying consolidated
financial statements and were not disclosed herein. The transactions between the Group and other
related parties are as follows.
(2) Names of related parties and relationship
Name Relationship
Unimos Shanghai Associate
JMC Associate
158

(3) Significant related party transactions
A. Purchases of materials
2019 2018
JMC $ 9 $ 132,494
Purchases of materials from associate is based on normal commercial terms and conditions. The
payment terms of the purchases from associate have no significant differences with third party
suppliers.
B. Acquisition of financial assets
In January 2018, ChipMOS BVI participated in Unimos Shanghai’s increase of paid-in capital
based on its shareholding amounted to $794,694, please refer to Note 6(7).
(4) Key management personnel compensation
2019 2018
Salaries and other short-term employee benefits $ 178,713 $ 151,095
Post-employment compensation 2,049 2,067
Share-based payments - 6,763
$ 180,762 $ 159,925
8. PLEDGED ASSETSCarrying amount
Assets Purpose December 31, 2019 December 31, 2018
Non-current financial assets at
amortized cost Lease and bank loan $ 68,450 $ 68,388
Property, plant and equipment
- Land Bank loan 452,738 452,738
- Buildings Bank loan 4,095,929 3,908,731
- Machinery and equipment Bank loan 4,105,912 5,310,769
$ 8,723,029 $ 9,740,626
9. SIGNIFICANT CONTINGENT LIABILITIES AND UNRECOGNIZED CONTRACT COMMITMENTS
(1) A letter of guarantee was issued by the Bank of Taiwan to the Customs Administration of the Ministry
of Finance for making payment of customs-duty deposits when importing. As of December 31, 2019
and 2018, the amounts of $100,800 and $97,500, respectively, were guaranteed by the Bank of Taiwan.
(2) Capital expenditures that are contracted for, but not provided for, are as follows:
December 31, 2019 December 31, 2018
Property, plant and equipment $ 1,640,712 $ 2,508,797
10. SIGNIFICANT DISASTER LOSS
None.
159

11. SIGNIFICANT EVENTS AFTER THE REPORTING PERIOD
On January 1, 2019, Ministry of Economic Affairs, R.O.C. (“MOEA”) implemented the “Action Plan
for Welcoming Overseas Taiwanese Businesses to Return to Invest in Taiwan” and companies are
subsidized with preferential interest loans for qualified investment projects. The Company has obtained
the qualification from the MOEA, and signed loan agreements with financial institutions during
January and February 2020 with the line of credit amounted to $10,710,000 and terms from seven to
ten years. As of the issue date of this report, the Company has not used the credit line of the
aforementioned project loans.
12. OTHERS
(1) Capital management
The Group’s objectives when managing capital are to safeguard the Group’s ability to continue as
a going concern in order to provide returns for shareholders and to maintain an optimal capital
structure to reduce the cost of capital. In order to maintain or adjust the capital structure, the Group
may adjust the amount of dividends paid to shareholders, return capital to shareholders, issue new
shares or sell assets to reduce debt. The Group monitors capital on the basis of the liabilities to
assets ratio. Total capital is shown as “Equity” in the consolidated balance sheet, which is also equal
to total assets minus total liabilities.
The liabilities to assets ratio at December 31, 2019 and 2018 were as follows:
December 31, 2019 December 31, 2018
Total liabilities $ 14,654,648 $ 15,062,907
Total assets 34,305,887 33,133,718
Liabilities to assets ratio 42.72% 45.46%
(2) Financial instruments
A. Financial instruments by category
December 31,
2019
December 31,
2018
Financial assets
Financial assets at fair value through profit or loss
Financial assets mandatorily measured at fair
value through profit or loss $ 11,038 $ 11,471
Financial assets at fair value through other
comprehensive income
Designation of equity instruments 121,808 174,357
Financial assets at amortized cost
Cash and cash equivalents 4,704,084 4,642,522
Financial assets at amortized cost 237,420 268,271
Notes receivable 765 1,595
Accounts receivable 4,452,904 4,745,693
Accounts receivable-related parties 1,045 140
Other receivables 89,676 63,037
Other receivables-related parties 2,948 3,131
Refundable deposits 21,145 22,006
$ 9,642,833 $ 9,932,223
160

December 31,
2019
December 31,
2018
Financial liabilities
Financial liabilities at amortized cost
Accounts payable $ 819,548 $ 637,271
Accounts payable-related parties - 347
Other payables 2,977,036 3,195,217
Other payables-related parties - 218
Long-term bank loans (including current portion) 9,041,645 9,789,518
Guarantee deposits 1,095 1,092
$ 12,839,324 $ 13,623,663
Lease liabilities (including current portion) $ 692,951 $ -
B. Risk management policies
(a) The Group’s risk management objective is to manage the market risk, credit risk and
liquidity risk related to its operating activities.
(b) The Group has established appropriate policies, procedures and internal controls for
financial risk management. Before entering into significant financial transactions, a due
approval process must be carried out by the Board of Directors based on related protocols
and internal control procedures. The Group complies with its financial risk management
policies at all times.
(c) In order to minimize and manage financial risks, the Group’s overall risk management
program focuses on analyzing, identifying, and evaluating financial risk factors that may
potentially have adverse effects on the Group’s financial position, and provide feasible
solutions to avoid those factors.
C. Significant financial risks and degrees of financial risks
(a) Market risk
The Group’s market risk is the risk that the fair value or future cash flows of a financial
instrument will fluctuate because of changes in market prices. Market risks comprise foreign
currency risk, interest rate risk, and other price risks.
In practice, the risk variable rarely changes individually, and the change of each risk variable
is usually correlative. The following sensitivity analysis did not consider the interaction of
each risk variable.
Foreign exchange risk
i. The Group’s exposure to the risk of changes in foreign exchange rates relates primarily
to the Group’s operating activities (when revenue or expense is denominated in a
different currency from the Company’s and its subsidiaries’ functional currency) and the
Group’s net investments in foreign operations.
ii. The Group applies natural hedges by using accounts receivable and accounts payable
denominated in the same currency. However, this natural hedge does not concur with the
requirement for hedge accounting. Furthermore, as net investments in foreign operations
are for strategic purposes, they are not hedged by the Group.
161

iii. The Group’s foreign currency exposure gives rise to market risks associated with
exchange rate movements against the NT dollar for cash and cash equivalents, accounts
receivable, other receivables, bank loans, accounts payable and other payables.
iv. The Group’s businesses involve some non-functional currency operations. The
information on assets and liabilities denominated in foreign currencies whose values
would be materially affected by the exchange rate fluctuations is as follows:
December 31, 2019
Foreign currency Carrying amount
(in thousands) Exchange rate (NTD)
(Foreign currency: functional
currency)
Financial assets
Monetary items
USD:NTD $ 188,369 29.9800 $ 5,647,303
JPY:NTD 266,819 0.2760 73,642
RMB:NTD 6,197 4.3050 26,678
Financial liabilities
Monetary items
USD:NTD $ 7,867 29.9800 $ 235,853
JPY:NTD 1,033,394 0.2760 285,217
December 31, 2018
Foreign currency Carrying amount
(in thousands) Exchange rate (NTD)
(Foreign currency: functional
currency)
Financial assets
Monetary items
USD:NTD $ 170,270 30.7150 $ 5,229,843
JPY:NTD 177,557 0.2782 49,396
RMB:NTD 8,850 4.4720 39,577
Financial liabilities
Monetary items
USD:NTD $ 18,230 30.7150 $ 559,934
JPY:NTD 2,436,140 0.2782 677,734
v. The total exchange (loss) gain, including realized and unrealized (losses) gains arising
from significant foreign exchange variations on monetary items held by the Group for the
years ended December 31, 2019 and 2018, amounted to ($154,993) and $93,104,
respectively.
162

vi. Analysis of foreign currency market risk arising from significant foreign exchange
variations:
2019
Sensitivity analysis
Change in
exchange Effect on
Effect on other
comprehensive
rate profit (loss) income
Financial assets
Monetary items
USD:NTD 5% $ 282,365 $ -
JPY:NTD 5% 3,682 -
RMB:NTD 5% 1,334 -
Financial liabilities
Monetary items
USD:NTD 5% $ 11,793 $ -
JPY:NTD 5% 14,261 -
2018
Sensitivity analysis
Change in
exchange Effect on
Effect on other
comprehensive
rate profit (loss) income
Financial assets
Monetary items
USD:NTD 5% $ 261,492 $ -
JPY:NTD 5% 2,470 -
RMB:NTD 5% 1,979 -
Financial liabilities
Monetary items
USD:NTD 5% $ 27,997 $ -
JPY:NTD 5% 33,887 -
Price risk
i. The Group’s financial instruments, which are exposed to price risk, are the financial assets
at fair value through profit or loss and financial assets at fair value through other
comprehensive income. To manage its price risk arising from investments in financial
instruments, the Group diversifies its portfolio. Diversification of the portfolio is in
accordance with the limits set by the Group.
ii. The Group’s investments in financial instruments comprise foreign unlisted stocks and
partnership. The prices of financial instruments would change due to different valuation
models and assumptions used. Analysis related to the effect on profit or other
comprehensive income if these assumptions change is provided in Note 12(3)G.
163

Interest rate risk on cash flow and fair value
i. Interest rate risk is the risk that the fair value or future cash flows of a financial instrument
will fluctuate because of changes in market interest rates. The Group’s exposure to the
risk of changes in market interest rates relates primarily to the Group’s bank loans with
floating interest rates. The Group manages its interest rate risk by having a balanced
portfolio of fixed and variable rate bank loans. The Group reassesses the hedge
management periodically to make sure it complies with the cost effectiveness.
ii. The sensitivity analysis depends on the exposure of interest rate risk at the end of the
reporting period.
iii. Analysis of debt with floating interest rates is based on the assumption that the
outstanding debt at the end of the reporting period is outstanding throughout the period.
The degree of variation the Group used to report to internal management is increase or
decrease of 1% in interest rates which is assessed as the reasonable degree of variation by
the management.
iv. For the years ended December 31, 2019 and 2018, it is estimated that a general increase
or decrease of 1% in interest rates, with all other variables held constant, would decrease
or increase the Group’s profit approximately by $90,660 and $98,220, respectively,
mainly due to the Group’s floating rate on bank loans.
(b) Credit risk
i. Credit risk is the risk that a counterparty will not meet its obligations under a financial
instrument or customer contract, leading to a financial loss, mainly resulted from its
operating activities (primarily notes and accounts receivable) and from its financing
activities (primarily deposits with banks and financial instruments). The Group is exposed
to credit risk arising from the carrying amount of the financial assets recognized in the
consolidated balance sheet.
ii. Each business unit performs ongoing credit evaluations of its debtors’ financial conditions
according to the Group’s established policies, procedures and controls relating to
customer credit risk management. The Group maintains an account for loss allowance
based upon the available facts and circumstances, history of collection and write-off
experiences of all trade and other receivables which consequently minimize the Group’s
exposure to bad debts.
iii. Credit risk from balances with banks and financial institutions is managed by the Group’s
finance unit in accordance with the Group’s policies. Transaction counterparty of the
Group is determined through its internal controls policy. For banks and financial
institutions, only parties rated above BBB+ by Taiwan Ratings are accepted. The
probability of counterparty default is remote, so there is no significant credit risk.
iv. The Group adopts the assumptions under IFRS 9 “Financial Instruments” (“IFRS 9”) and
the default is deemed to have occurred when the contract payments are past due over 90
days.
v. The Group categorized contract assets, accounts receivable and other receivables by
164

characteristics of credit risk and applied the simplified approach using loss rate
methodology to estimate expected credit loss.
vi. The Group referred to the forecastability of business monitoring indicators published by
the National Development Council to adjust the loss rate which is based on historical and
current information when assessing the future default possibility of contract assets,
accounts receivable and other receivables. As of December 31, 2019 and 2018, the loss
rate methodologies are as follows:
December 31, 2019
Contract
assets
Accounts
receivable
(including
related parties)
Other
receivables
(including
related parties)
Expected loss rate 0.030% 0.030% 0.030%
Total carrying amount $ 377,983 $ 4,455,300 $ 92,642
Loss allowance ( $ 114 ) ( $ 1,351 ) ( $ 18 )
December 31, 2018
Contract
assets
Accounts
receivable
(including
related parties)
Other
receivables
(including
related parties)
Expected loss rate 0.045% 0.045% 0.045%
Total carrying amount $ 299,970 $ 4,747,974 $ 66,181
Loss allowance ( $ 135 ) ( $ 2,141 ) ( $ 13 )
vii. Under the simplified approach, movements in relation to loss allowance for contract
assets, accounts receivable, and other receivables are as follows:2019
Contract
assets
Accounts
receivable
(including
related parties)
Other
receivables
(including
related parties)
January 1 ( $ 135 ) ( $ 2,141 ) ( $ 13 )
Provision for impairment loss - - ( 5 )
Reversal of impairment loss 21 790 -
December 31 ( $ 114 ) ( $ 1,351 ) ( $ 18 )
2018
Contract
assets
Accounts
receivable
(including
related parties)
Other
receivables
(including
related parties)
January 1_ IAS 39 $ - $ - $ -
Adjustments for applying new
standards ( 115 ) ( 1,819 ) ( 7 )
January 1_IFRS 9 ( 115 ) ( 1,819 ) ( 7 )
Provision for impairment loss ( 20 ) ( 322 ) ( 7 )
Reversal of impairment loss - - 1
December 31 ( $ 135 ) ( $ 2,141 ) ( $ 13 )
165

viii. For investments in debt instruments at amortized cost, the credit rating levels are as
follows:
December 31, 2019
By lifetime
12 months
Increase in
credit risk
Impairment
of credit Total
Financial assets at
amortized cost
Bank deposits (Note) $ 237,420 $ - $ - $237,420
December 31, 2018
By lifetime
12 months
Increase in
credit risk
Impairment
of credit Total
Financial assets at
amortized cost
Bank deposits (Note) $ 268,271 $ - $ - $268,271
Note: Time deposits with contract period over three months and restricted bank deposits.
(c) Liquidity risk
i. The Group manages and maintains adequate cash and cash equivalents to finance the
Group’s operations, and minimize the impact from cash flow fluctuations. The Group also
monitors its debt financing plans to ensure it is in compliance with the financial covenants
required under its loan agreements.
ii. The primary source of liquidity for the Group is from bank loans. See Note 6(13) for
details of the unused credit lines of the Group as of December 31, 2019 and 2018.
iii. The contractual undiscounted cash flows of accounts payable (including related parties)
and other payables (including related parties) are due within one year and are equivalent
to their carrying amounts. Except for the aforementioned, the table below summarizes the
maturity profile of the Group’s non-derivative financial liabilities based on the earliest
repayment dates and contractual undiscounted payments, including principal and interest.
The Group does not consider the probability of early repayments requested by the banks.
December 31, 2019
Within Over
1 year 1 to 3 years 3 to 5 years 5 years Total
Non-derivative financial
liabilities
Long-term bank loans $ 914,159 $ 1,786,842 $ 6,848,327 $ - $ 9,549,328
Lease liabilities 36,806 60,111 57,836 762,699 917,452
Guarantee deposits - - - 1,095 1,095
$ 950,965 $ 1,846,953 $ 6,906,163 $ 763,794 $ 10,467,875
166

December 31, 2018
Within Over
1 year 1 to 3 years 3 to 5 years 5 years Total
Non-derivative financial
liabilities
Long-term bank loans $ 927,243 $ 1,814,344 $ 7,734,983 $ - $ 10,476,570
Lease obligations payable 18,000 - - - 18,000
Guarantee deposits - - - 1,092 1,092
$ 945,243 $ 1,814,344 $ 7,734,983 $ 1,092 $ 10,495,662
The difference between the floating interest rates and estimated interest rates will affect
the non-derivative financial liabilities stated above.
(3) Fair value information
A. The different levels of inputs used in valuation techniques to measure fair value of financial and
non-financial instruments are defined as follows:
Level 1: Quoted prices (unadjusted) in active markets for identical assets or liabilities that can
be accessed at the measurement date. An active market is a market in which trading
for the asset or liability take place with sufficient frequency and volume to provide
pricing information on an ongoing basis.
Level 2: Inputs other than quoted prices from Level 1 that are observable information for the
asset or liability, either directly or indirectly.
Level 3: Unobservable inputs for the asset or liability. The fair value of the Group’s investment
in equity investment without active market is included in Level 3.
B. The carrying amounts of cash and cash equivalents, financial assets at amortized cost, contract
assets, notes receivable, accounts receivable, other receivables, refundable deposits, bank loans,
contract liabilities, accounts payable, other payables, lease liabilities and guarantee deposits are
approximate to their fair values.
C. The related information of financial and non-financial instruments measured at fair value by
level on the basis of the nature, characteristics and risks of the assets and liabilities are as
follows:
(a) The related information of natures of the assets and liabilities is as follows:
December 31, 2019
Level 1 Level 2 Level 3 Total
Assets
Recurring fair value measurements
Financial assets at fair value through profit or loss
- Foreign partnership interests $ - $ - $ 11,038 $ 11,038
Financial assets at fair value through other comprehensive income
- Foreign unlisted stocks - - 121,808 121,808
$ - $ - $ 132,846 $ 132,846
167

December 31, 2018
Level 1 Level 2 Level 3 Total
Assets
Recurring fair value measurements
Financial assets at fair value through profit or loss
- Foreign partnership interests $ - $ - $ 11,471 $ 11,471
Financial assets at fair value through other comprehensive income
- Foreign unlisted stocks - - 174,357 174,357
$ - $ - $ 185,828 $ 185,828
(b) The methods and assumptions the Group used to measure fair value are as follows:
i. The fair value of the Group’s financial instruments is measured by using valuation
techniques or by reference to counterparty quotes. The fair value of financial
instruments measured by using valuation techniques can be referred to current fair value
of instruments with similar terms and characteristics in substance, discounted cash flow
method or other valuation methods, including calculated by applying model using
market information available at the consolidated balance sheet date.
ii. The Group’s financial assets at fair value through profit or loss is measured by using the
discounted cash flow method, which derives present value estimates by discounting
expected future operating effectiveness and free cash flows projections.
iii. The Group’s financial assets at fair value through other comprehensive income is
measured by the comparable company valuation (EV/EBITDA ratio and P/B ratio).
iv. The Group takes into account adjustments for credit risks to measure the fair value of
financial and non-financial instruments to reflect credit risk of the counterparty and the
Group’s credit quality.
D. The following table shows the movements of Level 3 for the years ended December 31, 2019
and 2018:
2019
Debt instruments Equity instruments Total
January 1 $ 11,471 $ 174,357 $ 185,828
Gains or losses recognized in profit or loss
Recorded as non-operating expenses ( 433) - ( 433)
Gains or losses recognized in other
comprehensive income
Recorded as unrealized losses on valuation of
financial assets at fair value through other
comprehensive income - ( 52,549) ( 52,549)
December 31 $ 11,038 $ 121,808 $ 132,846
168

2018
Debt instruments Equity instruments Total
January 1 $ - $ - $ -
Effects on initial application of IFRS 9 11,433 89,335 100,768
Gains or losses recognized in profit or loss
Recorded as non-operating income 38 - 38
Gains or losses recognized in other
comprehensive income
Recorded as unrealized gains on valuation of
financial assets at fair value through other
comprehensive income - 85,022 85,022
December 31 $ 11,471 $ 174,357 $ 185,828
E. The Group engaged an external appraiser to perform the fair value measurements being
categorized within Level 3, and the accounting unit is in charge of valuation procedures to
independently verify the fair value of financial instruments. Such assessment is to ensure the
valuation results are reasonable by applying independent information to make results close to
current market conditions, confirming the resource of information is independent, reliable and
in line with other resources and represented as the exercisable price, and frequently calibrating
valuation model, performing back-testing, updating inputs used to the valuation model and
making any other necessary adjustments to the fair value.
F. The following is the qualitative information and sensitivity analysis of changes in significant
unobservable inputs under valuation model used in Level 3 fair value measurement:
Fair value as of
December 31,
2019
Valuation
technique
Significant
unobservable input
Range
(weighted
average method)
Relationship of
inputs to fair value
Non-derivative debt
instrument: Foreign partnership
interests
$ 11,038 Discounted
cash flow
Discount rate 0.30% The lower the discount
rate, the higher the fair
value
Non-derivative equity
instrument:
Foreign unlisted
stocks
121,808 Comparable
companies
Price to book ratio
multiple
1.22 The higher the
multiple, the higher the
fair value
Enterprise value to
EBITDA multiple
10.51 The higher the
multiple, the higher the
fair value
Discount for lack
of marketability
15.80% The higher the
discount for lack of
marketability, the
lower the fair value
169

Fair value as of
December 31,
2018
Valuation
technique
Significant
unobservable input
Range
(weighted
average method)
Relationship of
inputs to fair value
Non-derivative debt
instrument: Foreign partnership
interests
$ 11,471 Discounted
cash flow
Discount rate 0.35% The lower the discount
rate, the higher the fair
value
Non-derivative equity
instrument:
Foreign unlisted
stocks
174,357 Comparable
companies
Price to book ratio
multiple
1.19 The higher the
multiple, the higher the
fair value
Enterprise value to
EBITDA multiple
7.69 The higher the
multiple, the higher the
fair value
Discount for lack
of marketability
15.80% The higher the
discount for lack of
marketability, the
lower the fair value
G. The Group has carefully assessed the valuation models and assumptions used to measure fair
value. However, use of different valuation models or assumptions may result in different
measurement. The following is the effect of profit or loss or of other comprehensive income
from financial assets categorized within Level 3 if the inputs used to valuation models have
changed:
December 31, 2019
Recognized in
profit or loss
Recognized in other
comprehensive income
Input Change
Favorable
change
Unfavorable
change
Favorable
change
Unfavorable
change
Financial assets
Foreign partnership
interests Discount rate Note $ - $ - $ - $ -
Foreign unlisted stocks Price to book ratio
multiple ± 1% - - 53 53
Enterprise value to
EBITDA multiple ± 1% - - 850 900
Discount for lack of
marketability ± 1% - - 1,460 1,460
$ - $ - $ 2,363 $ 2,413
170
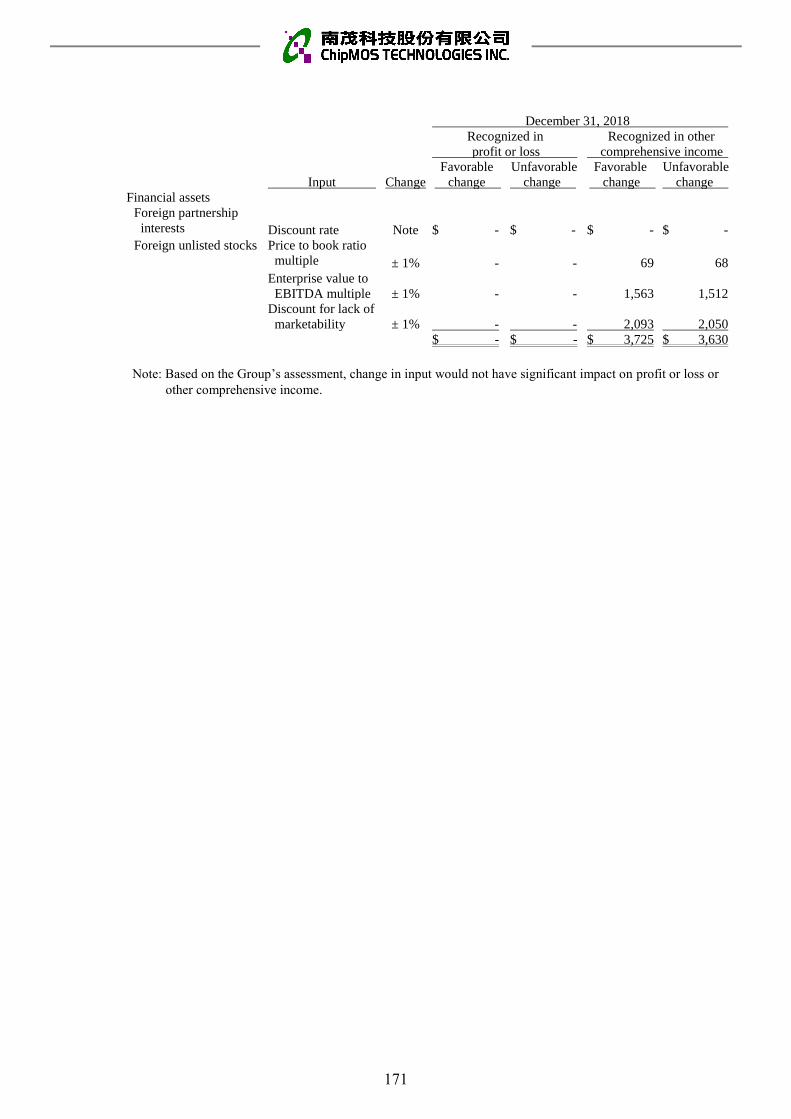
December 31, 2018
Recognized in
profit or loss
Recognized in other
comprehensive income
Input Change
Favorable
change
Unfavorable
change
Favorable
change
Unfavorable
change
Financial assets
Foreign partnership
interests Discount rate Note $ - $ - $ - $ -
Foreign unlisted stocks Price to book ratio
multiple ± 1% - - 69 68
Enterprise value to
EBITDA multiple ± 1% - - 1,563 1,512
Discount for lack of
marketability ± 1% - - 2,093 2,050
$ - $ - $ 3,725 $ 3,630
Note: Based on the Group’s assessment, change in input would not have significant impact on profit or loss or
other comprehensive income.
171

13
.S
UP
PL
EM
EN
TA
RY
DIS
CL
OS
UR
ES
(1)
Sig
nif
ican
t tr
ansa
ctio
ns
info
rmat
ion
A.
Fin
anci
ngs
pro
vid
ed:
No
ne.
B.
En
do
rsem
ents
an
d g
uar
ante
es p
rov
ided
: T
her
e w
ere
no
en
do
rsem
ents
an
d g
uar
ante
es p
rov
ided
by t
he
Co
mp
any.
Fo
r in
form
atio
n r
elat
ed t
o t
he
Co
mp
any’s
let
ter
of
gu
aran
tee
for
du
ty,
ple
ase
refe
r to
No
te 9
(1).
C.
Mar
ket
able
sec
uri
ties
hel
d a
t th
e en
d o
f th
e p
erio
d (
excl
ud
ing i
nv
estm
ents
in
su
bsi
dia
ries
, as
soci
ates
an
d j
oin
t v
entu
res)
:
As
of
Dec
emb
er 3
1, 2
01
9
Hel
d c
om
pan
y n
am
e
Mar
ket
able
sec
uri
ties
typ
e an
d n
am
e
Rel
atio
nsh
ip w
ith
the
com
pan
y
Gen
eral
led
ger
acc
ou
nt
Nu
mb
er o
f sh
ares
Car
ryin
g
am
ou
nt
Ow
ner
ship
(%)
Fai
r val
ue
No
te
The
Co
mp
an
y
RY
OW
A C
O.,
LT
D.
N/A
F
inanci
al a
sset
s at
fai
r valu
e
thro
ugh o
ther
co
mp
rehen
sive
inco
me
42
0
$1
16
,72
6
18
.12
$
11
6,7
26
The
Co
mp
an
y
CO
NN
EC
TE
C J
AP
AN
Co
rpo
rati
on
N/A
F
inanci
al a
sset
s at
fai
r valu
e
thro
ugh o
ther
co
mp
rehen
sive
inco
me
56
,497
5,0
82
2.7
4
5,0
82
Chip
MO
S B
VI
Shang
hai
Zuzh
u B
usi
ness
Co
nsu
ltin
g P
artn
ersh
ip (
Lim
ited
Par
tner
ship
) (“
Zuzh
u”)
N/A
F
inanci
al a
sset
s at
fai
r valu
e
thro
ugh p
rofi
t o
r lo
ss
-
4
,49
2
5.1
0
4,4
92
Chip
MO
S B
VI
Shang
hai
Zuzh
an B
usi
ness
Co
nsu
ltin
g P
artn
ersh
ip (
Lim
ited
Par
tner
ship
) (“
Zuzhan”)
N/A
F
inanci
al a
sset
s at
fai
r valu
e
thro
ugh p
rofi
t o
r lo
ss
-
2
,21
9
13
.42
2,2
19
Chip
MO
S B
VI
Shang
hai
Zuch
en B
usi
ness
Co
nsu
ltin
g P
artn
ersh
ip (
Lim
ited
Par
tner
ship
) (“
Zuchen”)
N/A
F
inanci
al a
sset
s at
fai
r valu
e
thro
ugh p
rofi
t o
r lo
ss
-
2
,16
4
11
.34
2,1
64
Chip
MO
S B
VI
Shang
hai
Guiz
ao B
usi
nes
s
Co
nsu
ltin
g P
artn
ersh
ip (
Lim
ited
Par
tner
ship
) (“
Guiz
ao”)
N/A
F
inanci
al a
sset
s at
fai
r valu
e
thro
ugh p
rofi
t o
r lo
ss
-
2
,16
3
11
.85
2,1
63
172

D. M
arket
able
sec
uri
ties
acq
uir
ed o
r dis
pose
d o
f w
ith
acc
um
ula
ted a
mount
exce
edin
g t
he
low
er o
f $300
mil
lion o
r 20%
of
the
pai
d-i
n c
apit
al:
Bal
ance
as
of
Jan
uar
y 1
, 2
019
A
cqu
isit
ion
Dis
po
sal
Bal
ance
as
of
Dec
emb
er 3
1,
20
19
Inves
tor
Mar
ket
able
secu
riti
es
typ
e
and
nam
e
Gen
eral
led
ger
acco
un
t C
ou
nte
rpar
ty
Rel
atio
nsh
ip
wit
h
the
inves
tee
Nu
mb
er o
f
shar
es/u
nit
s
(in
th
ou
san
ds)
A
mo
un
t
Nu
mb
er o
f
shar
es/u
nit
s
(in
th
ou
san
ds)
A
mo
un
t
Nu
mb
er o
f
shar
es/u
nit
s
(in
th
ou
san
ds)
Sel
lin
g
pri
ce
Bo
ok
val
ue
Gai
n o
n
dis
po
sal
Nu
mb
er o
f
shar
es/u
nit
s
(in
th
ou
san
ds)
A
mo
un
t
Th
e
Co
mp
any
Tai
shin
169
9
Mo
ney
Mar
ket
Fu
nd
No
te
N/A
N
/A
- $
-
73
,891 $
1,0
00
,00
0
73
,891 $
1,0
00
,72
9 $
1,0
00
,00
0 $
7
29
- $
-
Th
e
Co
mp
any
Un
ion
Mo
ney
Mar
ket
Fu
nd
No
te
N/A
N
/A
- -
45
,417
60
0,0
00
45
,417
60
0,2
31
60
0,0
00
2
31
-
-
Th
e
Co
mp
any
UP
AM
C
Jam
es B
on
d
Mo
ney
Mar
ket
Fu
nd
No
te
N/A
N
/A
- -
17
,949
30
0,0
00
17
,949
30
0,1
83
30
0,0
00
18
3
- -
Th
e
Co
mp
any
JMC
Inves
tmen
ts
acco
un
ted
for
usi
ng
equ
ity
met
ho
d
N/A
N
/A
19
,100
40
6,7
92
- -
9
,10
0
1,1
80
,179
20
6,5
69
9
81,6
75
10
,000
24
9,7
93
No
te :
Acc
ou
nte
d f
or
as “
Fin
anci
al a
sset
s at
fai
r val
ue
thro
ugh
pro
fit
or
loss
”.
E.
Acq
uis
itio
n o
f re
al e
stat
e pro
per
ties
wit
h a
mount
exce
edin
g t
he
low
er o
f $3
00 m
illi
on o
r 20%
of
the
pai
d-i
n c
apit
al:
None.
F.
Dis
posa
l of
real
est
ate
pro
per
ties
wit
h a
mount
exce
edin
g t
he
low
er o
f $300
mil
lion o
r 20%
of
pai
d-i
n c
apit
al:
None.
G. P
urc
has
es f
rom
or
sale
s to
rel
ated
par
ties
wit
h a
mount
exce
edin
g t
he
low
er o
f $100 m
illi
on o
r 20%
of
pai
d-i
n c
apit
al o
r m
ore
: N
one.
H. R
ecei
vab
les
from
rel
ated
par
ties
wit
h a
mount
exce
edin
g t
he
low
er o
f $100
mil
lion o
r 20%
of
pai
d-i
n c
apit
al o
r m
ore
: N
on
e.
I.
Tra
din
g i
n d
eriv
ativ
e in
stru
men
ts u
nder
taken
du
ring t
he
report
ing p
erio
ds:
None.
173

J. S
ignif
ican
t in
ter-
com
pan
y t
ransa
ctio
ns
duri
ng t
he
report
ing p
erio
ds:
T
ransa
ctio
n
Num
ber
C
om
pan
y n
am
e
Counte
rpar
ty
Rel
atio
nsh
ip
Gen
eral
led
ger
acc
ount
Am
ount
Tra
nsa
ctio
n
term
s
Per
centa
ge
of
conso
lidat
ed t
ota
l
reven
ues
or
tota
l
asse
ts (
%)
0
T
he
Com
pan
y
C
hip
MO
S U
SA
Note
S
ervic
e ex
pen
se
$ 32,8
26
- 0.1
6
Note
: R
epre
sents
the
tran
sact
ions
from
par
ent
com
pan
y t
o s
ubsi
dia
ry.
(2)
Info
rmat
ion o
n i
nves
tees
Nam
es, lo
cati
ons
and r
elat
ed i
nfo
rmat
ion o
f in
ves
tees
(ex
cludin
g i
nfo
rmat
ion o
n i
nves
tmen
ts i
n t
he
P.R
.C.)
:
Ori
gin
al i
nves
tmen
t am
ou
nt
Sh
ares
hel
d a
s of
Dec
emb
er 3
1, 2
019
Net
pro
fit
(loss
) of
the
inves
tee
for
the
yea
r
end
ed D
ecem
ber
3
1, 2
019
Inves
tmen
t in
com
e
(loss
) re
cogn
ized
for
the
yea
r en
ded
D
ecem
ber
31
, 20
19
Note
In
ves
tor
Inves
tee
Loca
tion
Mai
n b
usi
nes
s ac
tivit
ies
End
ing
bal
ance
B
egin
nin
g
bal
ance
N
um
ber
of
shar
es
Ow
ner
ship
(%
) C
arry
ing
amoun
t
Th
e C
om
pan
y
Chip
MO
S U
SA
S
an J
ose
, U
SA
Res
earc
h, d
evel
op
men
t an
d m
ark
etin
g
of
sem
icon
du
ctors
, ci
rcu
its,
ele
ctro
nic
re
late
d p
rod
uct
s $
2
17
,91
8
$
217
,918
3,5
50
,00
0
100
$
235
,742
$
4
,26
7
$
4,2
67
Th
e C
om
pan
y
JMC
K
aoh
siu
ng,
Tai
wan
Man
ufa
ctu
rin
g, p
roce
ssin
g a
nd t
radin
g
of
hig
h-e
nd
fle
xib
le I
C s
ub
stra
tes
for
dis
pla
y d
river
IC
s 1
65
,00
7
315
,16
4
10,0
00
,000
10
249
,79
3
524
,34
7
63,8
38
Note
Th
e C
om
pan
y
Chip
MO
S B
VI
Bri
tish
Vir
gin
Isla
nd
s H
old
ing c
om
pan
y
3,0
72
,71
2
3,0
72
,71
2
2,4
07
,74
2,9
75
100
3,1
75
,04
0
( 2
19
,69
2)
( 2
19
,69
2)
Note
: C
om
pan
y’s
ass
oci
ate
acco
unte
d f
or
usi
ng e
qu
ity m
eth
od.
174

(3)
Info
rmat
ion o
n i
nves
tmen
ts i
n t
he
P.R
.C.
A. B
asic
info
rmat
ion:
Inves
tee
in
P.R
.C.
M
ain b
usi
nes
s
acti
vit
ies
Paid
-in c
apit
al
Inves
tment
met
ho
d
Acc
um
ula
ted
am
ou
nt
of
rem
itta
nce
fro
m
Taiw
an t
o
P.R
.C.a
s o
f
Jan
uar
y 1
, 2
01
9
Am
ou
nt
rem
itte
d f
rom
Taiw
an t
o
P.R
.C./
Am
ou
nt
rem
itte
d b
ack
to
Taiw
an f
or
the
yea
r end
ed
Dec
em
ber
31
, 2
01
9
Acc
um
ula
ted
am
ou
nt
of
rem
itta
nce
fro
m
Taiw
an t
o P
.R.C
. as
of
Dec
em
ber
31
,
20
19
Net
lo
ss o
f
inves
tee
for
the
yea
r end
ed
Dec
em
ber
31
,
20
19
Ow
ners
hip
(%)
held
by t
he
Co
mp
an
y
(dir
ectl
y
or
ind
irec
tly
)
Inves
tment
loss
rec
og
niz
ed
for
the
yea
r
end
ed D
ecem
ber
31
, 2
01
9
Car
ryin
g
am
ou
nt
of
inves
tments
in
P.R
.C. as
of
Dec
em
ber
31
, 2
01
9
Acc
um
ula
ted
am
ou
nt
of
invest
ment
inco
me
rem
itte
d b
ack
to
Taiw
an
thro
ug
h
Dec
em
ber
31,
20
19
N
ote
Rem
itte
d t
o
P.R
.C.
R
emit
ted
bac
k
to T
aiw
an
Un
imo
s
Shan
ghai
Sem
ico
nd
ucto
r
asse
mb
lin
g a
nd
tes
tin
g
serv
ices
$
1
0,8
17
,19
1
No
te 1
$
2
,88
5,5
86
$
- $
- $
2,8
85
,58
6
($
3
52
,00
8)
45
.02
($
21
8,7
64
) 3
,14
3,1
17
$
- N
ote
2
Zuzh
u
Busi
nes
s co
nsu
ltin
g
serv
ices
8
7,1
39
N
ote
1
- -
- -
( 2
) 5
.10
-
4,4
92
-
Zuzhan
B
usi
nes
s co
nsu
ltin
g
serv
ices
1
6,6
06
N
ote
1
- -
- -
( 1
)
13
.42
-
2,2
19
-
Zuchen
B
usi
nes
s co
nsu
ltin
g
serv
ices
1
9,6
73
N
ote
1
- -
- -
( 1
)
11
.34
-
2,1
64
-
Gu
izao
B
usi
nes
s co
nsu
ltin
g
serv
ices
1
8,8
10
N
ote
1
- -
- -
( 1
)
11
.85
-
2,1
63
-
No
te 1
: T
hro
ug
h i
nv
esti
ng i
n a
n e
xis
tin
g c
om
pan
y (
Ch
ipM
OS
BV
I) i
n t
he
thir
d a
rea,
wh
ich t
hen i
nves
ted
in t
he
inves
tee
in P
.R.C
..
No
te 2
: T
he
financia
l st
atem
ents
that
are
aud
ited
by
the
Co
mp
an
y’s
in
dep
end
ent
acco
unta
nts
.
Co
mp
an
y
nam
e
Acc
um
ula
ted
am
ou
nt
of
rem
itta
nce
fro
m
Taiw
an t
o P
.R.C
.
as o
f D
ecem
ber
31
,
20
19
Inves
tment
am
ou
nt
app
roved
by t
he
Inves
tment
Co
mm
issi
on o
f
MO
EA
Lim
it o
n i
nv
estm
ents
in P
.R.C
. im
po
sed
by
the
Inv
estm
ent
Co
mm
issi
on o
f
MO
EA
The
Co
mp
an
y
$
2,8
85
,58
6
$
2,8
85
,58
6
$
11
,79
0,7
43
B. S
ignif
ican
t tr
ansa
ctio
ns,
eit
her
dir
ectl
y o
r in
dir
ectl
y t
hro
ugh a
thir
d a
rea,
wit
h i
nves
tee
com
pan
ies
in t
he
P.R
.C.:
None.
175
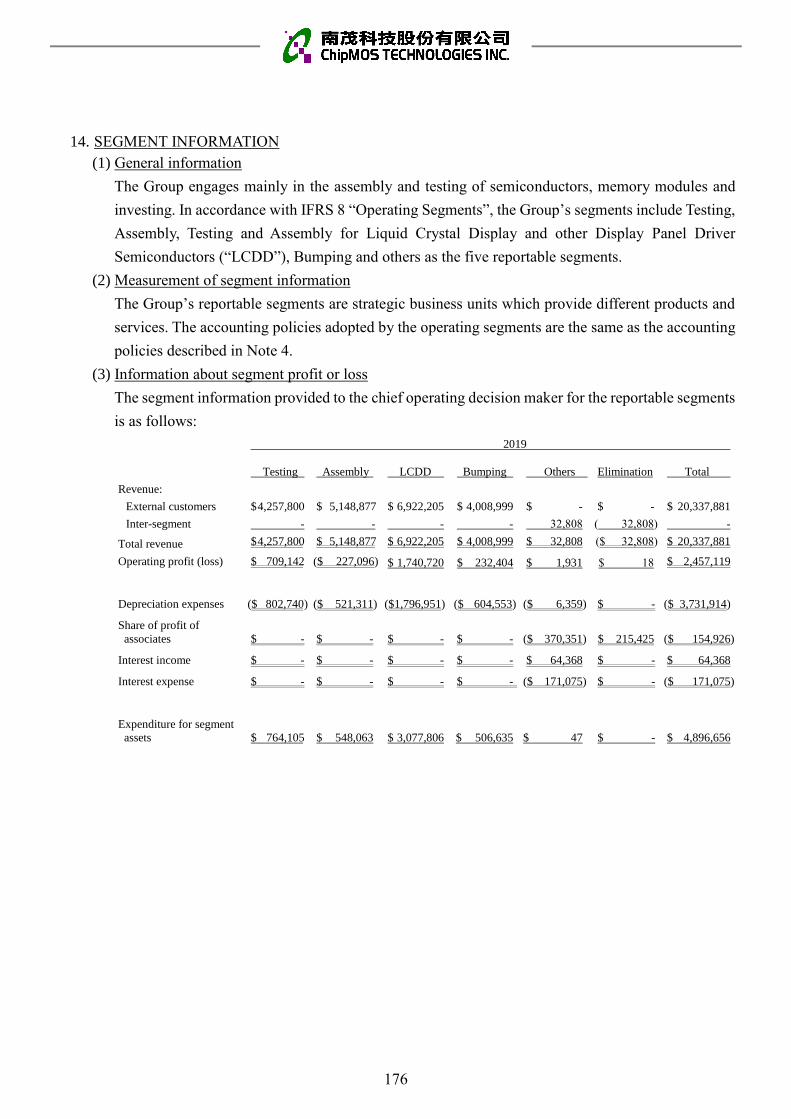
14. SEGMENT INFORMATION
(1) General information
The Group engages mainly in the assembly and testing of semiconductors, memory modules and
investing. In accordance with IFRS 8 “Operating Segments”, the Group’s segments include Testing,
Assembly, Testing and Assembly for Liquid Crystal Display and other Display Panel Driver
Semiconductors (“LCDD”), Bumping and others as the five reportable segments.
(2) Measurement of segment information
The Group’s reportable segments are strategic business units which provide different products and
services. The accounting policies adopted by the operating segments are the same as the accounting
policies described in Note 4.
(3) Information about segment profit or loss
The segment information provided to the chief operating decision maker for the reportable segments
is as follows:
2019
Testing Assembly LCDD Bumping Others Elimination Total
Revenue:
External customers $ 4,257,800 $ 5,148,877 $ 6,922,205 $ 4,008,999 $ - $ - $ 20,337,881
Inter-segment - - - - 32,808 ( 32,808) -
Total revenue $ 4,257,800 $ 5,148,877 $ 6,922,205 $ 4,008,999 $ 32,808 ($ 32,808) $ 20,337,881
Operating profit (loss) $ 709,142 ($ 227,096) $ 1,740,720 $ 232,404 $ 1,931 $ 18 $ 2,457,119
Depreciation expenses ($ 802,740) ($ 521,311) ($1,796,951) ($ 604,553) ($ 6,359) $ - ($ 3,731,914)
Share of profit of
associates $ - $ - $ - $ - ($ 370,351) $ 215,425 ($ 154,926)
Interest income $ - $ - $ - $ - $ 64,368 $ - $ 64,368
Interest expense $ - $ - $ - $ - ($ 171,075) $ - ($ 171,075)
Expenditure for segment
assets $ 764,105 $ 548,063 $ 3,077,806 $ 506,635 $ 47 $ - $ 4,896,656
176

2018
Testing Assembly LCDD Bumping Others Elimination Total
Revenue:
External customers $ 4,790,097 $ 4,679,676 $ 5,694,720 $ 3,315,534 $ - $ - $ 18,480,027
Inter-segment - - - - 35,738 ( 35,738) -
Total revenue $ 4,790,097 $ 4,679,676 $ 5,694,720 $ 3,315,534 $ 35,738 ($ 35,738) $ 18,480,027
Operating profit (loss) $ 1,306,742 ($ 207,700) $ 1,226,755 ($ 202,497) ($ 23,433) ($ 146) $ 2,099,721
Depreciation expenses ($ 769,660) ($ 578,205) ($1,400,784) ($ 627,412) ($ 518) $ - ($ 3,376,579)
Share of profit of
associates $ - $ - $ - $ - ($ 668,377) $ 368,276 ($ 300,101)
Interest income $ - $ - $ - $ - $ 49,971 $ - $ 49,971
Interest expense $ - $ - $ - $ - ($ 152,416) $ - ($ 152,416)
Expenditure for segment
assets $ 1,563,919 $ 321,976 $ 2,732,141 $ 327,251 $ 283 $ - $ 4,945,570
The application of IFRS 16 had the following impact on the segment information in 2019:
Testing Assembly LCDD Bumping Others Elimination Total
Depreciation expenses
increased $ 7,631 $ 6,035 $ 10,703 $ 1,137 $ 5,808 $ - $ 31,314
Interest expense increased $ 4,207 $ 3,260 $ 5,862 $ 492 $ 319 $ - $ 14,140
Segment assets increased $ 207,593 $ 160,864 $ 289,259 $ 24,188 $ 5,164 $ - $ 687,068
Segment liabilities
increased $ 209,328 $ 162,208 $ 291,677 $ 24,390 $ 5,348 $ - $ 692,951
(4) Reconciliation for segment income (loss)
Revenue from external customers and segment income (loss) reported to the chief operating decision
maker are measured using the same method as for revenue and operating profit in the financial
statements. Thus, no reconciliation is needed.
(5) Information on products and services
2019 2018
Revenue % Revenue %
Testing $ 4,257,800 21 $ 4,790,097 26
Assembly 5,148,877 25 4,679,676 25
LCDD 6,922,205 34 5,694,720 31
Bumping 4,008,999 20 3,315,534 18
$ 20,337,881 100 $ 18,480,027 100
177

(6) Geographical information
2019 2018
Revenue
Non-current
assets Revenue
Non-current
assets
Taiwan $ 15,875,027 $ 18,727,979 $ 14,751,766 $ 16,936,724
Japan 1,905,032 - 1,825,479 -
Singapore 1,333,114 - 1,143,661 -
P.R.C. 789,496 - 163,831 -
Others 435,212 5,659 595,290 1,851
$ 20,337,881 $ 18,733,638 $ 18,480,027 $ 16,938,575
(7) Major customer information
The information on the major customers which constituted more than 10% of the Group’s total
revenue for the years ended December 31, 2019 and 2018 is as follows:
2019 2018
Company name Amount % Amount %
Customer A $ 4,756,755 23 $ 3,794,991 21
Customer K 2,419,612 12 2,637,053 14
Customer C 2,048,260 10 1,957,467 11
Customer X 1,977,427 10 1,328,752 7
178

REPORT OF INDEPENDENT ACCOUNTANTS
To the Board of Directors and Shareholders of ChipMOS TECHNOLOGIES INC.
OpinionWe have audited the accompanying parent company only balance sheets of ChipMOS TECHNOLOGIES INC. (the “Company”) as of December 31, 2019 and 2018, and the related parent company only statements of comprehensive income, of changes in equity and of cash flows for the years then ended, and notes to the parent company only financial statements, including a summary of significant accounting policies.
In our opinion, based on our audits and the report of other independent accountants, as described in the Other matters section of our report, the accompanying parent company only financial statements present fairly, in all material respects, the financial position of the Company as of December 31, 2019 and 2018, and its financial performance and its cash flows for the years then ended in accordance with the “Regulations Governing the Preparations of Financial Reports by Securities Issuers”.
Basis for opinionWe conducted our audits in accordance with the “Regulations Governing Auditing and Attestation of Financial Statements by Certified Public Accountants” and generally accepted auditing standards in the Republic of China (“ROC GAAS”). Our responsibilities under those standards are further described in the Independent Accountant’s Responsibilities for the Audit of the Parent Company Only Financial Statements section of our report. We are independent of the Company in accordance with the Code of Professional Ethics for Certified Public Accountants in the Republic of China (the “Code”), and we have fulfilled our other ethical responsibilities in accordance with this Code. Based on our audits and the report of other independent accountants, we believe that the audit evidence we have obtained is sufficient and appropriate to provide a basis for our opinion.
Key audit mattersKey audit matters are those matters that, in our professional judgment, were of most significance in our audit of the parent company only financial statements of the current period. These matters were addressed in the context of our audit of the parent company only financial statements as a whole and, in forming our opinion thereon, we do not provide a separate opinion on these matters.
V. Parent Company Only Financial Report of the Most Recent Year
179

Key audit matters for the Company’s parent company only financial statements of the year ended December 31, 2019 are stated as follows:
Measuring progress towards complete satisfaction of performance obligation
Description
Please refer to Note 4(26) to the parent company only financial statements for the accounting policies on revenue recognition; Note 5(2) for uncertainty of accounting estimate and assumptions of revenue recognition; and Note 6(20) for details of the revenue.
The Company’s revenue is primarily generated from the assembly and testing services of high-integration and high-precision integrated circuits based on customer’s specification, and is recognized based on measuring progress towards complete satisfaction of performance obligation during the service period. For assembly services, services for Liquid Crystal Display and other Flat-Panel Display Driver Semiconductors and Bumping, the Company recognizes revenue on the basis of input costs to the satisfaction of performance obligation relative to the total expected input costs to the satisfaction of that performance obligation. Since the total expected input costs is uncertain and subject to management’s significant estimation, measuring progress towards complete satisfaction of performance obligation was identified as a key audit matter.
How our audit addressed the matter
Our key audit procedures performed in respect of the above included the following:1. Interviewed with management to understand and evaluate the accounting policies on revenue
recognition, and validated the design and operating effectiveness of respective internal controls.2. Validated management’s assessment on progress completion of performance obligation and tested
the logics applied on calculating the progress completion of performance obligation.3. Verified the related documents provided by management, validated management report in relation
to the calculation on progress completion of performance obligation, and tested the accuracy ofrevenue recognition.
180

Provisions for deficiency compensation
Description
Please refer to Note 4(20) to the parent company only financial statements for the accounting policies on provisions; Note 5(1) for uncertainty of accounting estimate and assumptions of provisions; and Note 6(10) for details of the provisions for deficiency compensation.
The Company is primarily engaged in assembly and testing services for high-integration and high-precision integrated circuits. In case of deficiencies in the assembling and testing services provided, the Company has to clarify the reason for such deficiencies and attribute responsibilities, and determine whether to provide related provisions. Since the timing and amounts of deficiency compensation are uncertain, and subject to management’s significant judgment, the provision for deficiency compensation was identified as a key audit matter.
How our audit addressed the matter
Our key audit procedures performed in respect of the above included the following:1. Interviewed with management and verified the internal process on estimating provisions for
deficiency compensation, and the consistency of process application during the financial reportingperiods.
2. Validated related documents and evidence provided by management, sampled and tested thereasonableness of providing and reversing provisions for deficiency compensation during the currentperiod.
3. Reviewed significant payments made subsequent to the reporting period and validated thereasonableness of provisions for deficiency compensation.
Other matters
The report of the other independent accountants
We did not audit the financial statements of a certain investee company accounted for using equity method. Those financial statements were audited by the other independent accountants whose reports thereon have been furnished to us, and our opinion expressed herein, insofar as it relates to the amounts included in the financial statements and the information on the investee disclosed in Note 13 was based solely on the reports of the other independent accountants. Investments in this investee company amounted to NT$249,793 thousand and NT$406,792 thousand, respectively, representing 0.7% and 1.2% of total assets as of December 31, 2019 and 2018, and total net comprehensive income including the share of profit and other comprehensive income of associate accounted for using equity method
181

amounted to NT$69,570 thousand and NT$39,245 thousand, representing 2.8% and 3.7% of total comprehensive income for the years then ended, respectively.
Responsibilities of management and those charged with governance for the financial statements
Management is responsible for the preparation and fair presentation of the parent company only financial statements in accordance with the “Regulations Governing the Preparations of Financial Reports by Securities Issuers”, and for such internal controls as management determines are necessary to enable the preparation of parent company only financial statements that are free from material misstatement, whether due to fraud or error.
In preparing the parent company only financial statements, management is responsible for assessing the Company’s ability to continue as a going concern, disclosing, as applicable, matters related to going concern and using the going concern basis of accounting unless management either intends to liquidate the Company or to cease operations, or has no realistic alternative but to do so.
Those charged with governance, including the Audit Committee, are responsible for overseeing the Company’s financial reporting process.
Independent accountant’s responsibilities for the audit of the parent company only financial statements
Our objectives are to obtain reasonable assurance about whether the parent company only financial statements as a whole are free from material misstatement, whether due to fraud or error, and to issue a report that includes our opinion. Reasonable assurance is a high level of assurance, but is not a guarantee that an audit conducted in accordance with ROC GAAS will always detect a material misstatement when it exists. Misstatements can arise from fraud or error and are considered material if, individually or in the aggregate, they could reasonably be expected to influence the economic decisions of users taken on the basis of these parent company only financial statements.
As part of an audit in accordance with ROC GAAS, we exercise professional judgment and maintain professional skepticism throughout the audit. We also:1. Identify and assess the risks of material misstatement of the parent company only financial
statements, whether due to fraud or error, design and perform audit procedures responsive to thoserisks, and obtain audit evidence that is sufficient and appropriate to provide a basis for our opinion.The risk of not detecting a material misstatement resulting from fraud is higher than for oneresulting from error, as fraud may involve collusion, forgery, intentional omissions,misrepresentations, or the override of internal controls.
182
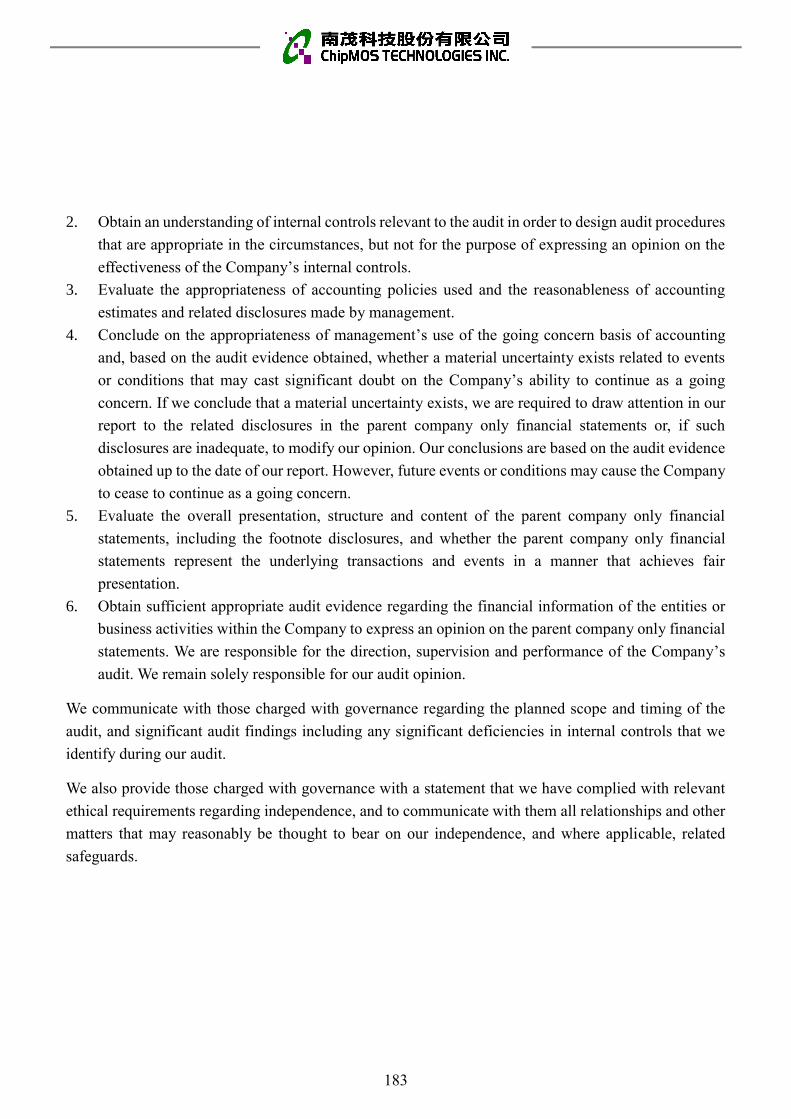
2. Obtain an understanding of internal controls relevant to the audit in order to design audit proceduresthat are appropriate in the circumstances, but not for the purpose of expressing an opinion on theeffectiveness of the Company’s internal controls.
3. Evaluate the appropriateness of accounting policies used and the reasonableness of accountingestimates and related disclosures made by management.
4. Conclude on the appropriateness of management’s use of the going concern basis of accountingand, based on the audit evidence obtained, whether a material uncertainty exists related to eventsor conditions that may cast significant doubt on the Company’s ability to continue as a goingconcern. If we conclude that a material uncertainty exists, we are required to draw attention in ourreport to the related disclosures in the parent company only financial statements or, if suchdisclosures are inadequate, to modify our opinion. Our conclusions are based on the audit evidenceobtained up to the date of our report. However, future events or conditions may cause the Companyto cease to continue as a going concern.
5. Evaluate the overall presentation, structure and content of the parent company only financialstatements, including the footnote disclosures, and whether the parent company only financialstatements represent the underlying transactions and events in a manner that achieves fairpresentation.
6. Obtain sufficient appropriate audit evidence regarding the financial information of the entities orbusiness activities within the Company to express an opinion on the parent company only financialstatements. We are responsible for the direction, supervision and performance of the Company’saudit. We remain solely responsible for our audit opinion.
We communicate with those charged with governance regarding the planned scope and timing of the audit, and significant audit findings including any significant deficiencies in internal controls that we identify during our audit.
We also provide those charged with governance with a statement that we have complied with relevant ethical requirements regarding independence, and to communicate with them all relationships and other matters that may reasonably be thought to bear on our independence, and where applicable, related safeguards.
183

From the matters communicated with those charged with governance, we determine those matters that were of most significance in the audit of the parent company only financial statements of the current period and are therefore the key audit matters. We describe these matters in our report unless law or regulation precludes public disclosure about the matter or when, in extremely rare circumstances, we determine that a matter should not be communicated in our report because the adverse consequences of doing so would reasonably be expected to outweigh the public interest benefits of such communication.
Chun-Yuan Hsiao Chih-Cheng Hsieh For and on behalf of PricewaterhouseCoopers, TaiwanMarch 10, 2020
----------------------------------------------------------------------------------------------------------------------------- --------------------The accompanying parent company only financial statements are not intended to present the financial position and results of operations and cash flows in accordance with accounting principles generally accepted in countries and jurisdictions other than the Republic of China. The standards, procedures and practices in the Republic of China governing the audit of such financial statements may differ from those generally accepted in countries and jurisdictions other than the Republic of China. Accordingly, the accompanying parent company only financial statements and report of independent accountants are not intended for use by those who are not informed about the accounting principles or auditing standards generally accepted in the Republic of China, and their applications in practice.
/s/ Chun-Yuan Hsiao /s/ Chih-Cheng Hsieh
184

ChipMOS TECHNOLOGIES INC.PARENT COMPANY ONLY BALANCE SHEETS
(Expressed in thousands of New Taiwan dollars)
December 31, 2019 December 31, 2018Assets Notes Amount % Amount %
Current assets
1100 Cash and cash equivalents 6(1) $ 4,619,365 14 $ 4,589,280 14
1140 Current contract assets 6(20) 377,869 1 299,835 1
1150 Notes receivable, net 765 - 1,595 -
1170 Accounts receivable, net 6(2) 4,452,904 13 4,745,693 14
1180 Accounts receivable related parties, net 1,045 - 140 -
1200 Other receivables 89,652 - 62,317 -
1210 Other receivables related parties 2,948 - 3,131 -
1220 Current tax assets 138,941 1 138,941 1
130X Inventories 6(3) 1,767,642 5 1,778,835 5
1410 Prepayments 57,502 - 44,592 -
11XX Total current assets 11,508,633 34 11,664,359 35
Non-current assets
1517 Non-current financial assets at fair value
through other comprehensive income
6(4)
121,808 - 174,357 1
1535 Non-current financial assets at amortized
cost
6(5) and 8
68,450 - 68,388 -
1550 Investments accounted for using equity
method
6(6)
3,660,575 11 4,133,873 12
1600 Property, plant and equipment 6(7) and 8 17,978,949 52 16,818,613 51
1755 Right-of-use assets 6(8) 681,904 2 - -
1840 Deferred tax assets 6(27) 194,552 1 226,716 1
1920 Refundable deposits 20,322 - 21,162 -
1990 Other non-current assets 67,126 - 28,560 -
15XX Total non-current assets 22,793,686 66 21,471,669 65
1XXX Total assets $ 34,302,319 100 $ 33,136,028 100
(Continued)
185

ChipMOS TECHNOLOGIES INC.PARENT COMPANY ONLY BALANCE SHEETS
(Expressed in thousands of New Taiwan dollars)
The accompanying notes are an integral part of these financial statements.
December 31, 2019 December 31, 2018Liabilities and Equity Notes Amount % Amount %
LiabilitiesCurrent liabilities
2130 Current contract liabilities 6(20) $ 1,231 - $ 1,432 -2170 Accounts payable 6(9) 819,548 2 637,271 22180 Accounts payable related parties - - 347 -2200 Other payables 2,977,036 9 3,195,217 102220 Other payables related parties 2,628 - 2,528 -2230 Current tax liabilities 268,825 1 496,704 12250 Current provisions 6(10) 1,998 - 29,352 -2280 Current lease liabilities 6(31) 19,218 - - -2310 Receipts in advance 988 - 1,013 -2320 Long-terms bank loans, current portion 6(12)(31) and 8 748,419 2 747,422 22355 Long-term lease obligations payable,
current portion6(13)
- - 17,792 -2365 Current refund liabilities 6(11) 26,000 - 32,627 -2399 Other current liabilities 32,242 - 30,800 -21XX Total current liabilities 4,898,133 14 5,192,505 15
Non-current liabilities2540 Long-terms bank loans 6(12)(31) and 8 8,293,226 24 9,042,096 272570 Deferred tax liabilities 6(27) 305,635 1 308,759 12580 Non-Current lease liabilities 6(31) 668,384 2 - -2640 Net defined benefit liability, non-
current6(14)
480,107 2 520,765 22645 Guarantee deposits 6(31) 1,095 - 1,092 -2670 Other non-current liabilities 4,500 - - -25XX Total non-current liabilities 9,752,947 29 9,872,712 302XXX Total liabilities 14,651,080 43 15,065,217 45
EquityCapital stock 6(16)
3110 Capital stock common stock 7,272,401 21 7,528,577 23Capital surplus 6(17)
3200 Capital surplus 6,059,651 17 6,280,482 19Retained earnings 6(18)
3310 Legal reserve 1,579,478 5 1,469,170 53350 Unappropriated retained earnings 4,759,511 14 3,635,372 11
Other equity interest 6(19)3400 Other equity interest ( 19,802) - 119,713 -3500 Treasury stock 6(16) - - ( 962,503) ( 3)3XXX Total equity 19,651,239 57 18,070,811 55
Significant contingent liabilities andunrecognized contract commitments
9
Significant events after the reporting period
11
3X2X Total liabilities and equity $ 34,302,319 100 $ 33,136,028 100
186

ChipMOS TECHNOLOGIES INC.PARENT COMPANY ONLY STATEMENTS OF COMPREHENSIVE INCOME
(Expressed in thousands of New Taiwan dollars, except earnings per share)
Years ended December 31,2019 2018
Items Notes Amount % Amount %
4000 Revenue 6(20) $ 20,337,881 100 $ 18,480,027 100
5000 Cost of revenue 6(3)(25)(26) ( 16,411,742) ( 81) ( 15,050,032) ( 81)
5900 Gross profit 3,926,139 19 3,429,995 19
Operating expenses 6(25)(26)
6100 Sales and marketing expenses ( 88,902) ( 1) ( 89,043) ( 1)
6200 General and administrative expenses ( 467,364) ( 2) ( 425,897) ( 2)
6300 Research and development expenses ( 1,007,631) ( 5) ( 939,269) ( 5)
6000 Total operating expenses ( 1,563,897) ( 8) ( 1,454,209) ( 8)
6500 Other income (expenses), net 6(21) 92,928 1 147,514 1
6900 Operating profit 2,455,170 12 2,123,300 12
Non-operating income (expenses)
7010 Other income 6(22) 70,226 1 56,481 -
7020 Other gains and losses 6(23) 834,423 4 117,982 1
7050 Finance costs 6(24) ( 179,942) ( 1) ( 190,248) ( 1)
7070 Share of profit (loss) of subsidiaries,
associates and joint ventures accounted
for using equity method
6(6)
( 151,587) ( 1) ( 326,220) ( 2)
7000 Total non-operating income (expenses) 573,120 3 ( 342,005) ( 2)
7900 Profit before income tax 3,028,290 15 1,781,295 10
7950 Income tax expense 6(27) ( 444,129) ( 2) ( 678,220) ( 4)
8200 Profit for the year $ 2,584,161 13 $ 1,103,075 6
(Continued)
187

ChipMOS TECHNOLOGIES INC.PARENT COMPANY ONLY STATEMENTS OF COMPREHENSIVE INCOME
(Expressed in thousands of New Taiwan dollars, except earnings per share)
The accompanying notes are an integral part of these financial statements.
Years ended December 31,2019 2018
Items Notes Amount % Amount %Other comprehensive income (loss)
8311 Profit (loss) on remeasurements of defined benefit plans
6(14)$ 20,916 - ($ 59,961) -
8316 Unrealized (loss) gain on valuation of equity instruments at fair value through other comprehensive income
6(4)
( 52,549) - 85,022 -8330 Share of other comprehensive income
(loss) of subsidiaries, associates and joint ventures accounted for using equity method that will not be reclassified to profit or loss 5,732 - ( 2,687) -
8349 Income tax effect on components that will not be reclassified to profit or loss
6(27)6,327 - ( 4,126) -
8310 Components of other comprehensive (loss) income that will not be reclassified to profit or loss ( 19,574) - 18,248 -
8361 Exchange differences on translation of foreign operations
6(19)( 104,198) ( 1) ( 51,077) -
8360 Components of other comprehensive loss that will be reclassified to profit or loss ( 104,198) ( 1) ( 51,077) -
8300 Other comprehensive loss, net of income tax ($ 123,772) ( 1) ($ 32,829) -
8500 Total comprehensive income for the year $ 2,460,389 12 $ 1,070,246 6
9750 Earnings per share-basic 6(28) $ 3.55 $ 1.379850 Earnings per share-diluted 6(28) $ 3.51 $ 1.36
188

Chi
pMO
S TE
CH
NO
LOG
IES
INC
.PA
REN
T C
OM
PAN
Y O
NLY
STA
TEM
ENTS
OF
CH
AN
GES
IN E
QU
ITY
(Ex
pres
sed
in th
ousa
nds o
f New
Tai
wan
dol
lars
)
Ret
aine
d ea
rnin
gsO
ther
equ
ity in
tere
st
Not
esC
apita
l sto
ck -
com
mon
stoc
kC
apita
l sur
plus
Lega
l res
erve
Una
ppro
pria
ted
reta
ined
ear
ning
s
Fina
ncia
l st
atem
ents
tra
nsla
tion
diffe
renc
es o
f fo
reig
n op
erat
ions
Unr
ealiz
ed g
ain
(loss
) on
valu
atio
n of
fina
ncia
l ass
ets
at fa
ir va
lue
thro
ugh
othe
r co
mpr
ehen
sive
in
com
e
Unr
ealiz
ed g
ain
(loss
) on
valu
atio
n of
ava
ilabl
e-fo
r-sa
le fi
nanc
ial
asse
ts
Une
arne
dem
ploy
ee
awar
dsTr
easu
ry st
ock
Tota
l equ
ity
The
acco
mpa
nyin
g no
tes a
re a
n in
tegr
al p
art o
f the
se fi
nanc
ial s
tate
men
ts.
Year
201
8Ba
lanc
e at
Janu
ary
1, 2
018
$8,
862,
971
$6,
288,
377
$1,
166,
517
$3,
071,
424
$65
,593
$-
$67
8($
54,5
70)
($1,
007,
654)
$18
,393
,336
Effe
cts o
n in
itial
app
licat
ion
of IF
RS
9 an
d IF
RS
15-
--
65,0
50-
42,8
43(
678)
--
107,
215
Adj
uste
d ba
lanc
e at
Janu
ary
1, 2
018
8,86
2,97
16,
288,
377
1,16
6,51
73,
136,
474
65,5
9342
,843
-(
54,5
70)
(1,
007,
654)
18,5
00,5
51Pr
ofit
for t
he y
ear
--
-1,
103,
075
--
--
-1,
103,
075
Oth
er c
ompr
ehen
sive
(los
s) in
com
e6(
19)
--
-(
45,8
07)
(51
,077
)64
,055
-(
-)-
(32
,829
)
Tota
l com
preh
ensi
ve in
com
e (lo
ss) f
or th
e ye
ar-
--
1,05
7,26
8(
51,0
77)
64,0
55-
(-)
-1,
070,
246
App
ropr
iatio
n of
prio
r yea
r's e
arni
ngs
6(18
) L
egal
rese
rve
--
302,
653
(30
2,65
3)-
--
--
-
Cas
h di
vide
nds
--
-(
256,
806)
--
--
-(
256,
806)
Res
trict
ed sh
ares
6(15
)(
4,9
48)
(7,
967)
-1,
089
--
-52
,869
-41
,043
Cap
ital r
educ
tion
6(16
)(
1,
329,
446)
72-
--
--
-45
,151
(1,
284,
223)
Bala
nce
at D
ecem
ber 3
1, 2
018
$7,
528,
577
$6,
280,
482
$1,
469,
170
$3,
635,
372
$14
,516
$10
6,89
8$
-($
1,70
1)($
962,
503)
$18
,070
,811
Year
201
9Ba
lanc
e at
Janu
ary
1, 2
019
$7,
528,
577
$6,
280,
482
$1,
469,
170
$3,
635,
372
$14
,516
$10
6,89
8$
-($
1,70
1)($
962,
503)
$18
,070
,811
Prof
it fo
r the
yea
r-
--
2,58
4,16
1-
--
--
2,58
4,16
1O
ther
com
preh
ensi
ve in
com
e (lo
ss)
6(19
)-
--
17,3
72(
104,
198)
(36
,946
)-
--
(12
3,77
2)
Tota
l com
preh
ensi
ve in
com
e (lo
ss) f
or th
e ye
ar-
--
2,60
1,53
3(
104,
198)
(36
,946
)-
--
2,46
0,38
9A
ppro
pria
tion
of p
rior y
ear's
ear
ning
s6(
18)
Leg
al re
serv
e-
-11
0,30
8(
110,
308)
--
--
--
Cas
h di
vide
nds
--
-(
872,
718)
--
--
-(
872,
718)
Res
trict
ed sh
ares
6(15
)(
477)
(41
2)-
10-
--
1,70
1-
822
Can
cella
tion
of tr
easu
ry st
ock
6(16
)(
255,
699)
(21
2,35
4)-
(49
4,45
0)-
--
-96
2,50
3-
Disp
osal
of i
nves
tmen
t acc
ount
ed fo
r usi
ng e
quity
met
hod
6(17
)-
(8,
065)
-72
-(
72)
--
-(
8,06
5)Ba
lanc
e at
Dec
embe
r 31,
201
9$
7,27
2,40
1$
6,05
9,65
1$
1,57
9,47
8$
4,75
9,51
1($
89,6
82)
$69
,880
$-
$-
$-
$19
,651
,239
189

ChipMOS TECHNOLOGIES INC.PARENT COMPANY ONLY STATEMENTS OF CASH FLOWS
(Expressed in thousands of New Taiwan dollars)
Years ended December 31,Notes 2019 2018
CASH FLOWS FROM OPERATING ACTIVITIES Profit before income tax $ 3,028,290 $ 1,781,295 Adjustments to reconcile profit (loss)
Depreciation expenses 6(7)(8)(25) 3,725,555 3,376,061(Reversal of) expected credit losses ( 806 ) 348Interest expense 6(24) 170,755 152,416Interest income 6(22) ( 59,467 ) ( 48,091 )Dividend income 6(22) ( 585 ) ( 571 )Share-based payments 6(15)(26) 822 41,043Share of loss of subsidiaries and associates accounted
for using equity method6(6)
151,587 326,220Gain on valuation of financial assets at fair value through
profit or loss6(23)
( 1,750 ) ( 1,447 )Gain on disposal of property, plant and equipment 6(21) ( 20,271 ) ( 14,274 )Impairment loss on property, plant and equipment 6(7)(21) 9,938 -Gain on disposal of investment accounted for using equity
method6(6)(23)
( 981,675 ) -Deferred income ( 12,279 ) ( 42,857 )
Changes in operating assets and liabilities Changes in operating assets
Financial assets at fair value through profit or loss 1,750 1,447Current contract assets ( 78,013 ) ( 44,858 )Notes receivable 830 434Accounts receivable 293,579 ( 734,129 )Accounts receivable related parties ( 905 ) ( 129 )Other receivables ( 8,079 ) 3,337Other receivables related parties 12,437 16,317Inventories 11,193 ( 58,101 )Prepayments ( 4,333 ) 46,781Other non-current assets 6,914 6,914
Changes in operating liabilitiesCurrent contract liabilities ( 201 ) 280Accounts payable 182,277 ( 50,689 )Accounts payable related parties ( 347 ) 121Other payables 330,886 ( 235,417 )Other payables related parties 100 55Current provisions ( 27,354 ) ( 27,803 )Current refund liabilities ( 6,627 ) ( 37,529 )Other current liabilities 1,442 ( 475 )Net defined benefit liability, non-current ( 19,742 ) ( 17,722 )
Cash generated from operations 6,705,921 4,438,977 Interest received 61,507 47,430 Dividends received 20,585 6,184 Interest paid ( 170,830 ) ( 154,307 ) Income tax paid ( 636,642 ) ( 116,881 )
Net cash generated from operating activities 5,980,541 4,221,403
(Continued)
190

ChipMOS TECHNOLOGIES INC.PARENT COMPANY ONLY STATEMENTS OF CASH FLOWS
(Expressed in thousands of New Taiwan dollars)
Years ended December 31,Notes 2019 2018
The accompanying notes are an integral part of these financial statements.
CASH FLOWS FROM INVESTING ACTIVITIES
(Increase) decrease in financial assets at amortized cost
Acquisition of investments accounted for using equity method 6(6) and 7
Proceeds from disposal of investment accounted for using equity
method
6(6)
Acquisition of property, plant and equipment 6(30)
Proceeds from disposal of property, plant and equipment
Decrease (increase) in refundable deposits
Increase in other non-current assets
Increase in other non-current liabilities
Net cash used in investing activities
CASH FLOWS FROM FINANCING ACTIVITIES 6(31)
Proceeds from short-term bank loans
Payments on short-term bank loans
Payments on lease liabilities
Proceeds from long-term bank loans
Payments on long-term bank loans
Increase (decrease) in guarantee deposits
Cash dividend paid 6(18)
Capital reduction
Net cash used in financing activities
Net increase (decrease) in cash and cash equivalents
Cash and cash equivalents at beginning of year
Cash and cash equivalents at end of year
191

ChipMOS TECHNOLOGIES INC.
NOTES TO THE PARENT COMPANY ONLY FINANCIAL STATEMENTS
YEARS ENDED DECEMBER 31, 2019 AND 2018
(Expressed in thousands of New Taiwan dollars, except as otherwise indicated)
1. HISTORY AND ORGANIZATION
ChipMOS TECHNOLOGIES INC. (the “Company”) was incorporated on July 28, 1997. The Company
is primarily engaged in the research, development, manufacturing and sale of high-integration and high-
precision integrated circuits and related assembly and testing services. On April 11, 2014, the Company’s
shares were listed on the Taiwan Stock Exchange. On November 1, 2016, the Company’s American
Depositary Shares (“ADSs”) were listed on the NASDAQ Global Select Market.
2. THE AUTHORIZATION OF THE PARENT COMPANY ONLY FINANCIAL STATEMENTS
The accompanying parent company only financial statements were authorized for issuance by the Board
of Directors on March 10, 2020.
3. APPLICATION OF NEW AND AMENDED INTERNATIONAL FINANCIAL REPORTING
STANDARDS AND INTERPRETATIONS
(1) Effect of the adoption of new or amended International Financial Reporting Standards (“IFRS”) as
endorsed by the Financial Supervisory Commission (“FSC”)
A. New standards, interpretations and amendments endorsed by the FSC effective from 2019 are as
follows:
New Standards, Interpretations and Amendments
Effective date issued by
International Accounting
Standard Board (“IASB”)
Amendments to IFRS 9 “Prepayment Features with Negative
Compensation”
January 1, 2019
IFRS 16 “Leases” January 1, 2019
Amendments to International Accounting Standards (“IAS”) 19
“Plan Amendment, Curtailment or Settlement”
January 1, 2019
Amendments to IAS 28 “Long-term Interests in Associates and
Joint Ventures”
January 1, 2019
International Financial Reporting Interpretations Committee
(“IFRIC”) 23 “Uncertainty Over Income Tax Treatments”
January 1, 2019
Annual Improvements to IFRSs 2015-2017 Cycle January 1, 2019
B. Except for the following, the above standards and interpretations have no significant impact on
the Company’s financial position and financial performance based on the Company’s assessment.
IFRS 16 “Leases”
(a) IFRS 16 “Leases” (“IFRS 16”), supersedes IAS 17 “Leases” (“IAS 17”) and the related
interpretations issued by the Standing Interpretation Committee. The standard requires lessees
to recognize a right-of-use asset and a lease liability (except for those leases with terms of 12
months or less and leases of low-value assets). The accounting stays the same for lessors,
which is to classify their leases as either finance leases or operating leases and account for
192

those two types of leases differently. IFRS 16 only requires enhanced disclosures to be
provided by lessors.
(b) The Company has elected to apply IFRS 16 by not restating the comparative information
(referred herein as the “modified retrospective approach”) when applying IFRS, IAS, IFRIC
interpretations, and SIC interpretations effective in 2019 as endorsed by FSC (“IFRSs”).
IFRSs effective in 2019 as endorsed by the FSC. Accordingly, the Company increased right-
of-use assets and lease liabilities by $887,325 and $873,213, respectively, and decreased
leased assets and lease obligations payable by $31,904 and $17,792, respectively.
(c) The Company has adopted the following practical expedients permitted by the standard at the
date of initial application of IFRS 16:
i. Reassessment as to whether a contract is, or contains, a lease is not required, instead, the
application of IFRS 16 depends on whether or not the contracts were previously identified
as leases applying IAS 17 and IFRIC 4 “Determining whether an Arrangement contains a
Lease”.
ii. The use of a single discount rate to a portfolio of leases with reasonably similar
characteristics.
iii. The accounting for operating leases whose period will end before December 31, 2019 as
short-term leases and accordingly, rent expense of $27,972 was recognized for the year
ended 2019.
(d) The Company calculated the present value of lease liabilities by using the incremental
borrowing interest rate, ranging from 1.7895% to 2.0000%.
(e) The reconciliation between operating lease commitments for the remaining lease payments
under IAS 17 and lease liabilities recognized as of January 1, 2019, measured at the present
value of the remaining lease payments, discounted using the lessee’s incremental borrowing
rate is as follows:
Operating lease commitments disclosed by applying IAS 17 as of
December 31, 2018 $ 308,807
Add: Lease payable recognized under finance lease by applying
IAS 17 as of December 31, 2018 17,792
Less: Short-term leases ( 27,972 )
Add: Adjustments as a result of a different treatment of extension and
termination options 874,298
Total lease contracts amount recognized as lease liabilities by
applying IFRS 16 on January 1, 2019 $ 1,172,925
Incremental borrowing interest rate at the date of initial application 1.7895%~2.0000%
Lease liabilities recognized as of January 1, 2019 by applying
IFRS 16 $ 873,213
193

(2) Effect of new, revised or amended IFRSs endorsed by the FSC that has not been adopted
A. New standards, interpretations and amendments endorsed by the FSC effective from 2020 are as
follows:
New Standards, Interpretations and Amendments
Effective date issued by
IASB
Amendments to IAS 1 and IAS 8 “Disclosure Initiative-
Definition of Material”
January 1, 2020
Amendments to IFRS 3 “Definition of a Business” January 1, 2020
Amendments to IFRS 9, IAS 39 and IFRS 7, “Interest Rate
Benchmark Reform”
January 1, 2020
B. Based on the Company’s assessment, the above standards and interpretations have no significant
impact on the Company’s financial position and financial performance.
(3) The IFRSs issued by IASB but not yet endorsed by the FSC
A. New standards, interpretations and amandments issued by IASB but not yet included in the IFRSs
endorsed by the FSC are as follows:
New Standards, Interpretations and Amendments
Effective date issued by
IASB
Amendments to IFRS 10 and IAS 28 “Sale or Contribution of
Assets between an Investor and its Associate or Joint Venture”
To be determined by
IASB
IFRS 17 “Insurance Contracts” January 1, 2021
Amendments to IAS 1, “Classification of Liabilities as Current or
Non-current”
January 1, 2022
B. Based on the Company’s assessment, the above standards and interpretations have no significant
impact on the Company’s financial position and financial performance.
4. SUMMARY OF SIGNIFICANT ACCOUNTING POLICIES
The significant accounting policies applied in the preparation of these accompanying parent company
only financial statements are set out below. These policies have been consistently applied during the
reported periods, unless otherwise stated.
(1) Statement of compliance
The parent company only financial statements of the Company have been prepared in accordance
with “Regulations Governing the Preparation of Financial Reports by Securities Issuers”.
(2) Basis of preparation
A. Except for the following items, the parent company only financial statements have been prepared
under the historical cost convention:
(a) Financial assets at fair value through profit or loss (including derivative instruments).
(b) Financial assets at fair value through other comprehensive income.
(c) Defined benefit liabilities were recognized based on the net amount of pension fund assets
less the present value of benefit obligation.
B. The preparation of the parent company only financial statements in conformity with IFRSs,
requires the use of certain critical accounting estimates. It also requires management to exercise
194

its judgment in the process of applying the Company’s accounting policies. The areas involving
a higher degree of judgment or complexity, or areas where assumptions and estimates are
significant to the parent company only financial statements are disclosed in Note 5.
(3) Foreign currency translation
Items included in the financial statements are measured using the currency of the primary economic
environment in which the Company operates (the “functional currency”). The parent company only
financial statements are presented in New Taiwan dollars (NTD), which is the Company’s functional
currency.
A. Foreign currency transactions and balances
(a) Foreign currency transactions are translated into the functional currency using the exchange
rates on the trade date or measurement date. Therefore, foreign exchange differences resulting
from the settlement of such transactions are recognized in profit or loss in the period in which
they arise.
(b) Monetary assets and liabilities denominated in foreign currencies at the period end are re-
translated at the exchange rates prevailing at the balance sheet date. Exchange differences
arising upon re-translation are recognized in profit or loss on the balance sheet date.
(c) Non-monetary assets and liabilities denominated in foreign currencies held at fair value
through profit or loss are re-translated at the exchange rates prevailing at the balance sheet
date; their exchange differences are recognized in profit or loss. Non-monetary assets and
liabilities denominated in foreign currencies held at fair value through other comprehensive
income are re-translated at the exchange rates prevailing at the balance sheet date; their
exchange differences are recognized in other comprehensive income. However, non-monetary
assets and liabilities denominated in foreign currencies that are not measured at fair value are
translated using the historical exchange rates at the initial dates of the transactions.
(d) All foreign exchange differences are presented in the statement of comprehensive income
under “Other gains and losses” by the nature of transactions.
B. Translation of foreign operations
The operating results and financial position of all the group entities, associates that have different
functional currency and presentation currency are translated into the presentation currency as
follows:
(a) Assets and liabilities for each balance sheet are translated at the exchange rates prevailing at
the balance sheet date;
(b) Income and expenses for each statement of comprehensive income are translated at average
exchange rates of that period; and
(c) All exchange differences are recognized in other comprehensive income.
195

(4) Classification of current and non-current assets and liabilities
A. Assets that meet one of the following criteria are classified as current assets:
(a) Assets arising from operating activities that are expected to be realized, or are intended to be
sold or consumed within the normal operating cycle;
(b) Assets held mainly for trading purposes;
(c) Assets that are expected to be realized within 12 months from the balance sheet date;
(d) Cash and cash equivalents, excluding restricted cash and cash equivalents and those that are
to be exchanged or used to pay off liabilities more than 12 months after the balance sheet date.
All assets that do not meet the above criteria are classified as non-current assets.
B. Liabilities that meet one of the following criteria are classified as current liabilities:
(a) Liabilities that are expected to be settled within the normal operating cycle;
(b) Liabilities arising mainly from trading activities;
(c) Liabilities that are to be settled within 12 months from the balance sheet date;
(d) Liabilities for which the repayment date cannot be unconditionally extended to more than 12
months after the balance sheet date. Liabilities bearing terms that could, at the option of the
counterparty, result in its settlement by the issue of equity instruments do not affect its
classification.
All liabilities that do not meet the above criteria are classified as non-current liabilities.
(5) Cash equivalents
Cash equivalents refer to short-term, highly liquid investments that are readily convertible to known
amounts of cash and are subject to an insignificant risk of changes in value (including time deposits
with less than three months contract period). Time deposits that meet the above definition and are
held for the purpose of meeting short-term cash commitments in operations are classified as cash
equivalents.
(6) Financial assets at fair value through profit or loss
A. Financial assets at fair value through profit or loss are financial assets that are not measured at
amortized cost or fair value through other comprehensive income.
B. On a regular way purchase or sale basis, financial assets at fair value through profit or loss are
recognized and derecognized using settlement date accounting.
C. At initial recognition, the Company measures the financial assets at fair value and recognizes the
transaction costs in profit or loss. The Company subsequently measures the financial assets at fair
value, and recognizes the gains or losses in profit or loss.
D. The Company recognizes the dividend income when the right to receive such payment is confirmed,
inflow of the future economic benefits associated with the dividend is probable to the Company
and the amount of the dividend can be measured reliably.
E. As of December 31, 2019 and 2018, there were no financial assets at fair value through profit or
loss.
(7) Financial assets at fair value through other comprehensive income
A. Financial assets at fair value through other comprehensive income comprise equity instruments
which are not held for trading, and for which the Company has made an irrevocable election at
initial recognition to recognize changes in fair value in other comprehensive income.
196
B. On a regular way purchase or sale basis, financial assets at fair value through other comprehensive
income are recognized and derecognized using settlement date accounting.
C. At initial recognition, the Company measures the financial assets at fair value plus transaction
costs. The Company subsequently measures the financial assets at fair value:
The changes in fair value of equity instruments that were recognized in other comprehensive
income are reclassified to retained earnings and are not reclassified to profit or loss following the
derecognition of the investment. Dividends are recognized as income when the right to receive
such payment is confirmed, inflow of the future economic benefits associated with the dividend is
probable to the Company and the amount of the dividend can be measured reliably.
(8) Financial assets at amortized cost
A. Financial assets at amortized cost are those that meet all of the following criteria:
(a) The objective of the Company’s business model is achieved by collecting contractual cash flows.
(b) The assets’ contractual cash flows represent solely payments of principal and interest.
B. The Company’s bank deposits which do not fall under cash equivalents are those with a short
maturity period and are measured at initial investment amount as the effect of discounting is
immaterial.
(9) Accounts and notes receivable
A. Accounts and notes receivable entitle the Company a legal right to receive consideration in
exchange for transferred goods or rendered services.
B. The short-term accounts and notes receivable without bearing interest are subsequently measured
at initial invoice amount as the effect of discounting is immaterial.
(10) Impairment of financial assets
For financial assets at amortized cost, at each reporting date, the Company recognizes the
impairment provision for 12 months expected credit losses if there has not been a significant
increase in credit risk since initial recognition or recognizes the impairment provision for the
lifetime expected credit losses if such credit risk has increased since initial recognition after taking
into consideration all reasonable and verifiable information that includes forecasts. On the other
hand, for accounts receivable or contract assets that do not contain a significant financing
component, the Company recognizes the impairment provision for lifetime expected credit losses.
(11) Derecognition of financial assets
The Company derecognizes a financial asset when the contractual rights to receive the cash flows
from the financial asset have expired.
(12) Inventories
Inventories are initially recorded at cost. Cost is determined on a weighted-average cost basis. At
the end of reporting period, the differences were allocated to inventories and cost of revenue based
on an appropriate rate. Allocation of fixed production overheads is based on the normal operating
capacity of the production facilities. Costs associated with underutilized capacity are expensed in
the period that the cost occurs.
Inventories are valued at the lower of cost and net realizable value. Net realizable value is the
estimated selling price in the ordinary course of business less the estimated costs of completion and
the estimated costs necessary to make the sale. The item by item approach is used in raw
materials. The amount of any write-down of inventories to net realizable value and all losses of
197

inventories are recognized as an expense in the period the write-down or loss occurs.
(13) Investments accounted for using equity method – subsidiaries and associates
A. Subsidiaries are all entities controlled by the Company. The Company controls an entity when
the Company is exposed, or has rights, to variable returns from its involvement with the entity
and has the ability to affect those returns through its power over the entity.
B. Unrealized gains or losses resulting from inter-company transactions with subsidiaries are
eliminated. Necessary adjustments are made to the accounting policies of subsidiaries, to be
consistent with the accounting policies of the Company.
C. The Company’s share of its subsidiaries’ post-acquisition profits or losses is recognized in profit
or loss, and its share of post-acquisition movements in other comprehensive income is
recognized in other comprehensive income. When the Company’s share of losses in a subsidiary
equals or exceeds its interest in the subsidiary, the Company continues to recognize its share in
the subsidiary’s loss proportionately.
D. Changes in a parent’s ownership interest in a subsidiary that do not result in the parent losing
control of the subsidiary (transactions with non-controlling interests) are accounted for as equity
transactions, i.e. transactions with owners in their capacity as owner. Any difference between the
amount by which the non-controlling interests are adjusted and the fair value of the consideration
paid or received is recognized directly in equity.
E. Associates are all entities over which the Company has significant influence but not control. In
general, it is presumed that the investor has significant influence, if an investor holds, directly
or indirectly 20 percent or more of the voting power of the investee. Investments in associates
are accounted for using the equity method and are initially recognized at cost.
F. The Company’s share of its associates’ post-acquisition profits or losses is recognized in profit
or loss, and its share of post-acquisition movements in other comprehensive income is
recognized in other comprehensive income. When the Company’s share of losses in an associate
equals or exceeds its interests in the associate, including any other unsecured receivables, the
Company does not recognize further losses, unless it has incurred legal or constructive
obligations or made payments on behalf of the associate.
G. When changes in an associate’s equity that are not recognized in profit or loss or other
comprehensive income of the associate and such changes not affecting the Company’s
ownership percentage of the associate, the Company recognizes the Company’s share of change
in equity of the associate in “Capital surplus” in proportion to its ownership.
H. Unrealized gains on transactions between the Company and its associates are eliminated to the
extent of the Company’s interests in the associates. Unrealized losses are also eliminated unless
the transaction provides evidence of an impairment of the asset transferred. Accounting policies
of associates have been adjusted where necessary to ensure consistency with the policies adopted
by the Company.
I. In the case where an associate issues new shares and the Company does not subscribe or
proportionately acquire the new shares, which results in a change in the Company’s ownership
percentage of the associate while maintaining significant influence on the associate, then
“Capital surplus” and “Investments accounted for using equity method” shall be adjusted for the
increase or decrease of its share of equity interests. If the above condition causes a decrease in
the Company’s ownership percentage of the associate, in addition to the above adjustment, the
198

amounts previously recognized in other comprehensive income in relation to the associate are
reclassified to profit or loss proportionately on the same basis as would be required if the relevant
assets or liabilities were disposed of.
J. When the Company disposes of its investment in an associate, if it loses significant influence
over this associate, the amounts previously recognized in other comprehensive income in
relation to the associate are reclassified to profit or loss, on the same basis as would be required
if the relevant assets or liabilities were disposed of. If it still retains significant influence over
this associate, then the amounts previously recognized in other comprehensive income in relation
to the associate are reclassified to profit or loss proportionately in accordance with the
aforementioned approach.
K. According to “Rules Governing the Preparation of Financial Statements by Securities Issuers”,
profit for the year and other comprehensive income for the year reported in the parent company
only financial statements, shall be equal to profit for the year and other comprehensive income
attributable to owners of the parent reported in the consolidated financial statements, equity
reported in the parent company only financial statements shall be equal to equity attributable to
owners of parent reported in the consolidated financial statements.
(14) Property, plant and equipment
A. Property, plant and equipment are initially recorded at cost. Borrowing costs incurred during the
construction period are capitalized.
B. Subsequent costs are included in the asset’s carrying amount or recognized as a separate asset,
as appropriate, only when it is probable that future economic benefits associated with the item
will flow to the Company and the cost of the item can be measured reliably. The carrying amount
of the replaced part is derecognized. All other repairs and maintenance are charged to profit or
loss during the financial period in which they are incurred.
C. Land is not depreciated. Other property, plant and equipment apply cost model and are
depreciated using the straight-line method to allocate their cost over their estimated useful lives.
Each part of an item of property, plant, and equipment with a cost that is significant in relation
to the total cost of the item must be depreciated separately.
D. The assets’ residual values, useful lives and depreciation methods are reviewed, and adjusted if
appropriate, at each financial year-end. If expectations for the assets’ residual values and useful
lives differ from previous estimates or the patterns of consumption of the assets’ future economic
benefits embodied in the assets have changed significantly, any change is accounted for as a
change in estimate under IAS 8 “Accounting Policies, Change in Accounting Estimates and
Errors”, from the date of the change. The estimated useful lives of property, plant and equipment
are as follows:
Buildings 5 to 51 years
Machinery and equipment 2 to 8 years
Tools 2 to 4 years
Others 2 to 6 years
(15) Leasing arrangements (lessee)-right-of-use assets / lease liabilities
Effective from 2019
A. Leases are recognized as a right-of-use asset and a corresponding lease liability at the date at
which the leased asset is available for use by the Company. For short-term leases or leases of low
199

value assets, lease payments are recognized as an expense on a straight-line basis over the lease
term.
B. Lease liabilities include the net present value of the remaining lease payments at the
commencement date, discounted using the incremental borrowing interest rate.
Lease payments are comprised of the following:
(a) Fixed payments, less any lease incentives receivable;
(b) The exercise price of a purchase option, if the lessee is reasonably certain to exercise that
option.
The Company subsequently measures the lease liability at amortized cost using the interest
method and recognizes interest expense over the lease term. The lease liability is remeasured and
the amount of remeasurement is recognized as an adjustment to the right-of-use asset when there
are changes in the lease term or lease payments and such changes do not arise from contract
modifications.
C. At the commencement date, the right-of-use asset is stated at the amount of the initial
measurement of lease liability. The right-of-use asset is measured subsequently using the cost
model and is depreciated from the commencement date to the earlier of the end of the asset’s
useful life or the end of the lease term. When the lease liability is remeasured, the amount of
remeasurement is recognized as an adjustment to the right-of-use asset.
(16) Leased assets / operating leases (lessee)
Prior to 2019
A. Based on the terms of a lease contract, a lease is classified as a finance lease if the Company
assumes substantially all the risks and rewards incidental to ownership of the leased asset.
(a) A finance lease is recognized as an asset and a liability at the lease’s commencement at the
lower of the fair value of the leased asset or the present value of the minimum lease payments.
(b) The minimum lease payments are apportioned between the finance charges and the reduction
of the outstanding liability. The finance charges are allocated to each period over the lease
term so as to produce a constant periodic rate of interest on the remaining balance of the
liability.
(c) Property, plant and equipment held under finance leases are depreciated over their estimated
useful lives. If there is no reasonable certainty that the Company will obtain ownership at the
end of the lease, the asset shall be depreciated over the shorter of the lease term and its useful
life.
B. Payments made under an operating lease (net of any incentives received from the lessor) are
recognized in profit or loss on a straight-line basis over the lease term.
(17) Impairment of non-financial assets
The Company assesses at each balance sheet date the recoverable amounts of those assets where
there is an indication that they are impaired. An impairment loss is recognized for the amount by
which the asset’s carrying amount exceeds its recoverable amount. The recoverable amount is the
higher of an asset’s fair value less costs to sell or value in use. When the circumstances or reasons
for recognizing impairment loss for an asset in prior years no longer exist or diminish, the
impairment loss is reversed. The increased carrying amount due to reversal should not be more than
200

what the depreciated or amortized historical cost would have been if the impairment had not been
recognized.
(18) Loans
Loans comprise long-term and short-term bank loans. Loans are recognized initially at fair value,
net of transaction costs incurred. Loans are subsequently stated at amortized cost; any difference
between the proceeds (net of transaction costs) and the redemption value is recognized as interest
expense in profit or loss over the period of the loans using the effective interest method.
(19) Accounts payable
Accounts payable are liabilities for purchases of raw materials, goods or services. The short-term
accounts payable without bearing interest are subsequently measured at initial invoice amount as
the effect of discounting is immaterial.
(20) Provisions for deficiency compensation
Provisions are recognized when the Company has a present legal or constructive obligation as a
result of past events, and it is probable that an outflow of economic resources will be required to
settle the obligation and the amount of the obligation can be reliably estimated. Provisions are
measured at the present value of the expenditures expected to be required to settle the obligation on
the balance sheet date, which is discounted using a pre-tax discount rate that reflects the current
market assessments of the time value of money and the risks specific to the obligation. When
discounting is used, the increase in the provision arising from the passage of time is recognized as
interest expense. Provisions are not recognized for future operating losses.
(21) Employee benefits
A. Short-term employee benefits
Short-term employee benefits are measured at the undiscounted amount of the benefits expected
to be paid in respect of service rendered by employees and should be recognized as expenses
when the employees render service.
B. Pensions
(a) Defined contribution plans
For defined contribution plans, the contributions are recognized as pension expenses when
they are due on an accrual basis. Prepaid contributions are recognized as an asset to the extent
of a cash refund or a reduction in future payments.
(b) Defined benefit plans
i. Net obligation under a defined benefit plan is defined as the present value of an amount of
pension benefits that employees will receive on retirement for their services with the
Company in the current period or prior periods. The liability recognized in the balance
sheet in respect of defined benefit pension plans is the present value of the defined benefit
obligation at the balance sheet date less the fair value of plan assets. The net defined benefit
obligation is calculated annually by independent actuaries using the projected unit credit
method. The discount rate is determined by using the interest rates of government bonds
that are denominated in the currency in which the benefits will be paid, and that have terms
to maturity approximating to the terms of the related pension liability.
ii. Remeasurements arising on defined benefit plans are recognized in other comprehensive
income in the period in which they arise and are recorded as retained earnings.
iii. Past service costs are recognized immediately in profit or loss.
201
C. Termination benefits
Termination benefits are employee benefits provided in exchange for the termination of
employment as a result from either the Company’s decision to terminate an employee’s
employment before the normal retirement date, or an employee’s decision to accept an offer of
redundancy benefits in exchange for the termination of employment. The Company recognizes
an expense as it can no longer withdraw an offer of termination benefits, or it recognizes related
restructuring costs, whichever is earlier. Benefits that are expected to be due more than 12 months
after balance sheet date shall be discounted to their present value.
D. Employees’ compensation and directors’ remuneration
Employees’ compensation and directors’ remuneration are recognized as expenses and liabilities,
provided that such recognition is required under legal obligation or constructive obligation and
those amounts can be reliably estimated. Any difference between the resolved amounts and the
subsequently actual distributed amounts is accounted for as changes in estimates.
(22) Employee share-based payments
Restricted shares
(a) Restricted shares issued to employees are measured at the fair value of the equity instruments
granted at the grant date, and are recognized as compensation cost over the vesting period.
(b) For restricted shares where those shares do not restrict distribution of dividends to employees
and employees are not required to return the dividends received if they resign during the vesting
period, the Company recognizes the fair value of the dividends received by employees who are
expected to resign during the vesting period as a compensation cost at the date the dividends
were declared.
(c) For restricted shares where employees do not need to pay to acquire those shares, if an employee
resigns during the vesting period, the Company will recover and retire those shares at no cost.
(23) Income tax
A. The income tax expense for the period comprises current and deferred tax. Income tax is
recognized in profit or loss, except to the extent that it relates to items recognized in other
comprehensive income or items recognized directly in equity, in which cases the income tax is
recognized in other comprehensive income or equity.
B. The current income tax expense is calculated on the basis of the tax laws enacted or substantively
enacted at the balance sheet date in the countries where the Company and its subsidiaries operate
and generate taxable income. Management periodically evaluates positions taken in tax returns
with respect to situations in accordance with applicable tax regulations. It establishes provisions
where appropriate based on the amounts expected to be paid to the tax authorities. An additional
income tax is levied on the unappropriated retained earnings and is recorded as income tax
expense in the year the stockholders resolve to retain the earnings.
C. Deferred tax is recognized, using the balance sheet liability method, on temporary differences
arising between the tax bases of assets and liabilities and their carrying amounts in the parent
company only balance sheet. However, the deferred tax is not accounted for if it arises from
initial recognition of an asset or liability in a transaction other than a business combination that
at the time of the transaction affects neither accounting nor taxable profit or loss. Deferred tax is
provided on temporary differences arising on investments in subsidiaries and associates, except
where the timing of the reversal of the temporary difference is controlled by the Company and it
202

is probable that the temporary difference will not reverse in the foreseeable future. Deferred tax
is determined using tax rates (and laws) that have been enacted or substantially enacted at the
balance sheet date and are expected to apply when the related deferred tax asset is realized or the
deferred tax liability is settled.
D. Deferred tax assets are recognized only to the extent that it is probable that future taxable profit
will be available against which the temporary differences can be utilized. At each balance sheet
date, unrecognized and recognized deferred tax assets are reassessed.
E. A deferred tax asset shall be recognized for the carryforward of unused tax credits resulting from
equity investments to the extent that it is possible that future taxable profit will be available
against which the unused tax credits can be utilized.
F. If a change in tax rate is enacted or substantively enacted, the Company recognizes the effect of
the change immediately in the period in which the change occurs. The effect of the change on
items recognized outside profit or loss is recognized in other comprehensive income or equity
while the effect of the change on items recognized in profit or loss is recognized in profit or loss.
(24) Capital stock
A. Ordinary shares are classified as equity. Incremental costs directly attributable to the issue of
new shares in net proceeds of tax are shown in equity as a deduction.
B. Where the Company repurchases the Company’s shares that have been issued, the consideration
paid, including any directly attributable incremental costs (net of income taxes) is deducted from
equity attributable to the Company’s equity holders. Where such shares are subsequently reissued,
the difference between their book value and any consideration received, net of any directly
attributable incremental transaction costs and the related income tax effects, is included in equity
attributable to the Company’s equity holders.
(25) Dividends
Dividends are recorded in the Company’s financial statements in the period in which they are
resolved by the Company’s shareholders. Cash dividends are recorded as liabilities; stock dividends
are recorded as stock dividends to be distributed and are reclassified to ordinary shares on the
effective date of new shares issuance.
(26) Revenue recognition
A. The Company is primarily engaged in the customized assembly and testing services of
high-integration and high-precision integrated circuits based on customer’s specification
demand to create or enhance the product. When providing assembly and testing services, the
Company considers:
(a) Customer controls the provided raw materials and the Company receives the instruction
from the customer on providing assembly and testing services and subsequent treatments.
(b) The Company provides assembly and testing services to create or enhance an asset which
solely provided and controlled by the customer. The Company has no right to transfer the
asset for another use.
As the asset ownership belongs to the customer, who bears the significant risk and rewards and
rights on the use of the asset, the Company recognizes assembly and testing service revenue
based on the progress towards completion of performance obligation during the service period.
B. The progress towards completion on assembly services, services for Liquid Crystal Display and
other Flat-Panel Display Driver Semiconductors (“LCDD”) and Bumping are measured by the
actual input costs relative to estimate total expected input costs. The progress towards
203

completion on testing services is measured by the actual incurred testing volume. The Company
believes that aforementioned methods are the most appropriate manner to measure the
satisfaction of performance obligation to customers because the input costs incurred to assembly
and testing volume completed in testing services are based on customer’s specification and not
linear over the duration of these services. Customer payment on assembly and testing services
is based on predetermined payment schedule. A contract asset is recognized when the Company
provides services in excess of customer’s payment.
5. CRITICAL ACCOUNTING JUDGMENTS, ESTIMATES AND KEY SOURCES OF ASSUMPTION
UNCERTAINTY
The preparation of the accompanying parent company only financial statements requires management to
make critical judgments in applying the Company’s accounting policies and make critical assumptions
and estimates concerning future events. Assumptions and estimates may differ from the actual results
and are continually evaluated and adjusted based on historical experience and other factors. Such
assumptions and estimates have a significant risk of causing a material adjustment to the carrying
amounts of assets and liabilities within the next financial year; and the related information is addressed
below:
(1) Critical judgments in applying the Company’s accounting policies
Provisions for deficiency compensation
The Company is primarily engaged in the research, development, manufacturing, sale, and assembly
and testing of high-integration and high-precision integrated circuits. In any cases where deficiencies
in the assembly and testing services arise, the Company has to clarify the reason for deficiencies and
attribute of responsibilities. The Company follows the guidance of IAS 37 “Provisions, Contingent
Liabilities and Contingent Assets” to determine warranty provisions. Since the timing and amount of
these warranties are based on assumptions and estimates it requires management to make critical
judgments.
(2) Critical accounting estimates and assumptions
Revenue recognition
A. The Company recognizes revenue from services for assembly, LCDD and Bumping based on the
progress towards completion of performance obligation during the service period. The Company
estimates total expected input costs based on historical experience and measures the progress
towards completion by the actual input costs relative to the total expected input costs.
B. The Company estimates sales refund liabilities for sales allowance based on historical results and
other known factors. Provisions for such liabilities are recorded as a deduction to revenues when
the sales are recognized. The Company reassesses the reasonableness of estimates of discounts and
returns periodically.
204

6. DETAILS OF SIGNIFICANT ACCOUNTS
(1) Cash and cash equivalents
December 31, 2019 December 31, 2018
Cash on hand and petty cash $ 470 $ 470
Checking accounts and demand deposits 830,415 1,343,060
Time deposits 3,788,480 3,245,750
$ 4,619,365 $ 4,589,280
A. The Company transacts with a variety of financial institutions all with high credit quality to
disperse credit risk, so it expects that the probability of counterparty default is remote.
B. No cash and cash equivalents of the Company were pledged to others.
(2) Accounts receivable
December 31, 2019 December 31, 2018
Accounts receivable $ 4,454,255 $ 4,747,834
Less: Loss allowance ( 1,351) ( 2,141)
$ 4,452,904 $ 4,745,693
A. The Company’s credit term granted to customers is 30~90 days. Receivables do not bear interest.
The loss allowance is determined based on the credit quality of customers. Information relating
to credit risk is provided in Note 12(2).
B. The aging analysis of accounts receivable based on past due date is as follows:
December 31, 2019 December 31, 2018
Current $ 4,440,081 $ 4,595,300
Within 1 month 13,733 18,807
1-2 months 441 131,787
2-3 months - 1,436
3-4 months - 180
Over 4 months - 324
$ 4,454,255 $ 4,747,834
C. As of December 31, 2019 and 2018, accounts receivable were all from contracts with customers.
And as of January 1, 2018, the balance of accounts receivable from contracts with customers was
$4,013,705.
D. Without taking into account of any collateral held or other credit enhancements, the amount that
best reflects the Company maximum exposure to credit risk in respect of the accounts receivable
is the carrying amount at the end of each reporting period.
E. No accounts receivable of the Company were pledged to others.
205

(3) Inventories
December 31, 2019
Cost
Allowance for
impairment losses Carrying amount
Raw materials $ 1,831,140 ($ 63,498) $ 1,767,642
December 31, 2018
Cost
Allowance for
impairment losses Carrying amount
Raw materials $ 1,814,992 ($ 36,157 ) $ 1,778,835
The cost of inventories recognized as an expense for the year:
2019 2018
Cost of revenue $ 16,372,032 $ 15,057,605
Loss on abandonment 12,369 5,497
Allowance for (reversal of) inventory valuation and
obsolescence loss 27,341 ( 13,070 )
$ 16,411,742 $ 15,050,032
A. Reversal of allowance for inventory valuation and obsolescence loss was recognized due to the
change in net realizable market value.
B. No inventories of the Company were pledged to others.
(4) Non-current financial assets at fair value through other comprehensive income
December 31, 2019 December 31, 2018
Designation of equity instruments
Foreign unlisted stocks $ 38,534 $ 38,534
Valuation adjustment 83,274 135,823
$ 121,808 $ 174,357
A. Based on the Company’s business model, the foreign unlisted stocks held for strategic
investments were elected to classify as “Financial assets at fair value through other
comprehensive income”. As of December 31, 2019 and 2018, the fair value of aforementioned
investments is the carrying amount at the end of each reporting period.
B. Amounts recognized in other comprehensive income in relation to the financial assets at fair
value through other comprehensive income are listed below:
2019 2018
Financial assets at fair value through other
comprehensive income
Foreign unlisted stocks ($ 52,549) $ 85,022
C. No financial assets at fair value through other comprehensive income were pledged to others.
206

(5) Financial assets at amortized cost
December 31, 2019 December 31, 2018
Non-current:
Restricted bank deposits $ 68,450 $ 68,388
A. Amounts recognized in profit or loss in relation to financial assets at amortized cost are listed
below:
2019 2018
Interest income $ 93 $ 80
B. Without taking into account any collateral held or other credit enhancements, the maximum
exposure to credit risk in respect of the amount that best represents the financial assets at
amortized cost held by the Company was the carrying amount at the end of each reporting period.
C. Details of the financial assets at amortized cost pledged to others as collateral are provided in
Note 8.
D. Information relating to credit risk of financial assets at amortized cost is provided in Note 12(2).
(6) Investments accounted for using equity method
2019 2018
January 1 $ 4,133,873 $ 4,427,157
Acquisition - 89,280
Disposal ( 206,569 ) -
Share of profit or loss ( 151,587) ( 326,220)
Earnings distribution ( 20,000 ) ( 5,730 )
Elimination of intercompany transactions 3,324 2,657
Effects on initial application of IFRS 9 from
subsidiaries - 493
Change in other equity interest - exchange differences
from translation of foreign operations ( 104,198 ) ( 51,077 )
Share of other comprehensive income 5,732 ( 2,687 )
December 31 $ 3,660,575 $ 4,133,873
Subsidiaries December 31, 2019 December 31, 2018
ChipMOS TECHNOLOGIES (BVI) LTD.
(“ChipMOS BVI”) $ 3,175,040 $ 3,489,799
ChipMOS U.S.A., Inc. (“ChipMOS USA”) 235,742 237,282
3,410,782 3,727,081
Associate
JMC ELECTRONICS CO., LTD. (“JMC”) 249,793 406,792
$ 3,660,575 $ 4,133,873
207

A. Subsidiaries
(a) Information about the Company’s subsidiaries is provided in Note 4(3) of the consolidated
financial statements for the year ended December 31, 2019.
(b) In January 2018, the Company participated in ChipMOS BVI’s increase of paid-in capital
based on its shareholding amounted to $89,280.
(c) To reflect effects on initial application of IFRS 9 for 2018 from ChipMOS BVI, the Company
recognized investment through equity method and retained earnings of $493.
(d) In January 2018, ChipMOS BVI participated in Unimos Microelectronics (Shanghai) Co.,
Ltd.’s (“Unimos Shanghai”) increase of paid-in capital based on its shareholding amounted to
$794,694.
B. Associate
(a) JMC has quoted market prices. As of December 31, 2019 and 2018, the fair value was
$807,000 and $2,081,900, respectively.
(b) For the years ended December 31, 2019 and 2018, the Company recognized its share of profit
of investments accounted for using equity method amounted to $63,838 and $41,933,
respectively.
(c) To further strengthen financial structure, increase balance of working capital and reduce debt
ratio, the Company’s Board of Directors adopted a resolution on April 2, 2019 to dispose of
9,100,000 common shares of JMC, which reduced the shareholding of equity investment in
JMC to 10%. The disposal of shares was completed on April 8, 2019 for cash consideration of
$1,180,179, and the Company recognized gain on disposal of investment in associates
amounted to $981,675. JMC is still recognized as investment accounted for using equity
method given that the Company retains significant influence by holding two seats in JMC’s
Board of Directors.
C. The basic information and summarized financial information of JMC is as follows:
(a) Basic information
Company
name
Principal place
of business
Shareholding ratio Nature of
relationship
Method of
measurement December 31, 2019 December 31, 2018
JMC Kaohsiung, Taiwan 10.00% 19.10%
Strategic
Investee
Equity method
208

(b) Summarized financial information
Balance Sheet JMC
December 31, 2019 December 31, 2018
Current assets $ 1,347,546 $ 1,106,789
Non-current assets 2,457,975 1,699,498
Current liabilities ( 888,184 ) ( 817,697 )
Non-current liabilities ( 660,111 ) ( 103,922 )
Total net assets $ 2,257,226 $ 1,884,668
Share in associate's net assets $ 225,723 $ 359,972
Goodwill 24,070 46,820
Carrying amount of the associate $ 249,793 $ 406,792
Statements of comprehensive income
JMC
2019 2018
Revenue $ 3,017,155 $ 1,931,008
Profit for the year from continuing operations $ 524,347 $ 219,544
Other comprehensive income (loss), net of
income tax 48,211 ( 14,074)
Total comprehensive income $ 572,558 $ 205,470
Dividends received from the associate $ 20,000 $ 5,730
209
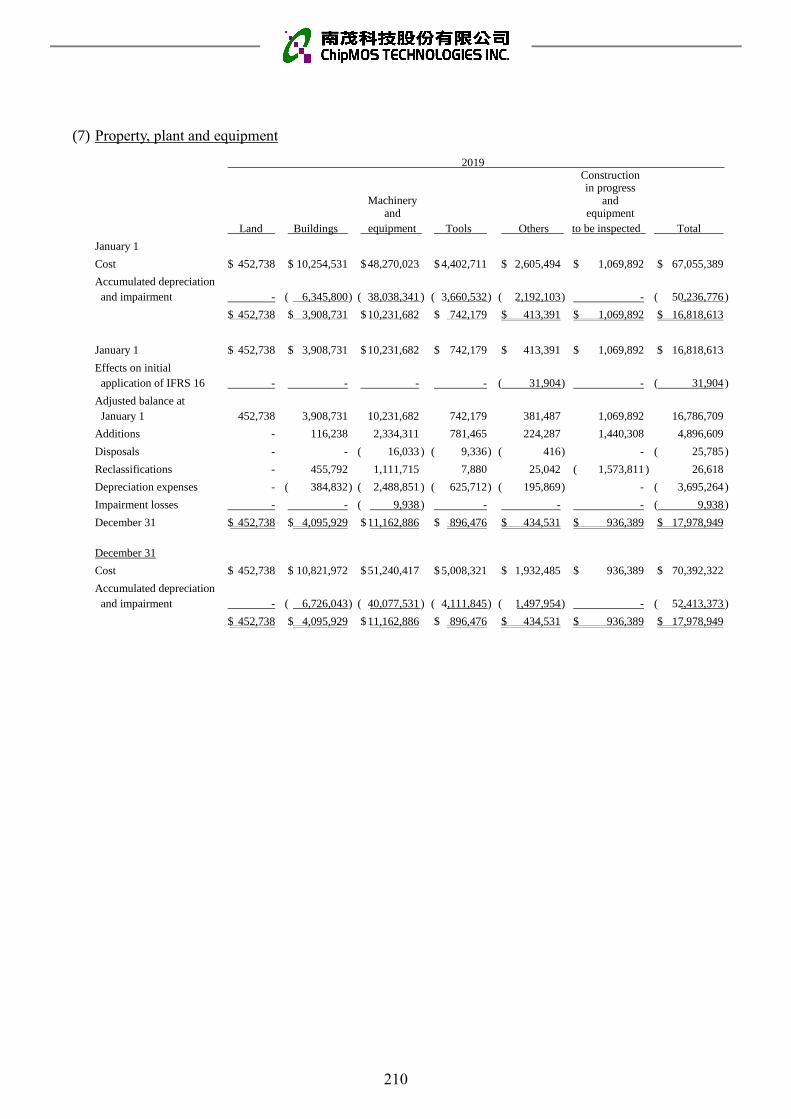
(7) Property, plant and equipment
2019
Machinery and
equipment
Construction in progress
and equipment
to be inspected Land Buildings Tools Others Total
January 1
Cost $ 452,738 $ 10,254,531 $ 48,270,023 $ 4,402,711 $ 2,605,494 $ 1,069,892 $ 67,055,389
Accumulated depreciation
and impairment - ( 6,345,800 ) ( 38,038,341 ) ( 3,660,532 ) ( 2,192,103 ) - ( 50,236,776 )
$ 452,738 $ 3,908,731 $ 10,231,682 $ 742,179 $ 413,391 $ 1,069,892 $ 16,818,613
January 1 $ 452,738 $ 3,908,731 $ 10,231,682 $ 742,179 $ 413,391 $ 1,069,892 $ 16,818,613
Effects on initial
application of IFRS 16 - - - - ( 31,904 ) - ( 31,904 )
Adjusted balance at
January 1 452,738 3,908,731 10,231,682 742,179 381,487 1,069,892 16,786,709
Additions - 116,238 2,334,311 781,465 224,287 1,440,308 4,896,609
Disposals - - ( 16,033 ) ( 9,336 ) ( 416 ) - ( 25,785 )
Reclassifications - 455,792 1,111,715 7,880 25,042 ( 1,573,811 ) 26,618
Depreciation expenses - ( 384,832 ) ( 2,488,851 ) ( 625,712 ) ( 195,869 ) - ( 3,695,264 )
Impairment losses - - ( 9,938 ) - - - ( 9,938 )
December 31 $ 452,738 $ 4,095,929 $ 11,162,886 $ 896,476 $ 434,531 $ 936,389 $ 17,978,949
December 31
Cost $ 452,738 $ 10,821,972 $ 51,240,417 $ 5,008,321 $ 1,932,485 $ 936,389 $ 70,392,322
Accumulated depreciation
and impairment - ( 6,726,043 ) ( 40,077,531 ) ( 4,111,845 ) ( 1,497,954 ) - ( 52,413,373 )
$ 452,738 $ 4,095,929 $ 11,162,886 $ 896,476 $ 434,531 $ 936,389 $ 17,978,949
210

Machinery and
equipment
Construction in progress
and equipment
to be inspected Land Buildings Tools Others Total
January 1
Cost $ 452,738 $ 9,809,970 $ 45,774,402 $ 4,004,703 $ 2,618,917 $ 968,719 $ 63,629,449
Accumulated depreciation
and impairment - ( 5,890,884 ) ( 36,961,056 ) ( 3,314,234 ) ( 2,199,172 ) - ( 48,365,346 )
$ 452,738 $ 3,919,086 $ 8,813,346 $ 690,469 $ 419,745 $ 968,719 $ 15,264,103
January 1 $ 452,738 $ 3,919,086 $ 8,813,346 $ 690,469 $ 419,745 $ 968,719 $ 15,264,103
Additions - 247,186 2,445,095 591,229 172,587 1,489,190 4,945,287
Disposals - - ( 904 ) ( 11,745 ) ( 2,067 ) - ( 14,716 )
Reclassifications - 199,724 1,154,663 7,604 26,026 ( 1,388,017 ) -
Depreciation expenses - ( 457,265 ) ( 2,180,518 ) ( 535,378 ) ( 202,900 ) - ( 3,376,061 )
December 31 $ 452,738 $ 3,908,731 $ 10,231,682 $ 742,179 $ 413,391 $ 1,069,892 $ 16,818,613
December 31
Cost $ 452,738 $ 10,254,531 $ 48,270,023 $ 4,402,711 $ 2,605,494 $ 1,069,892 $ 67,055,389
Accumulated depreciation
and impairment - ( 6,345,800 ) ( 38,038,341 ) ( 3,660,532 ) ( 2,192,103 ) - ( 50,236,776 )
$ 452,738 $ 3,908,731 $ 10,231,682 $ 742,179 $ 413,391 $ 1,069,892 $ 16,818,613
A. Amount of borrowing costs capitalized as part of property, plant and equipment and the range of
the interest rates for such capitalization are as follows:
2019 2018
Amount of interest capitalized $ 15,114 $ 18,542
Range of interest rates for capitalization 1.7822% 1.7582%
B. Information about the property, plant and equipment that were pledged to others as collaterals is
provided in Note 8.
(8) Leasing arrangements-lessee
Effective from 2019
A. The Company leases various assets, including land, buildings, machinery and equipment, and
others. Lease agreements are typically made for periods of 2 to 30 years. Lease terms are
negotiated on an individual basis and contain a wide range of different terms and conditions. The
lease agreements do not impose covenants, but leased assets may not be used as security for
borrowing purposes.
2018
211

B. The carrying amount of right-of-use assets and the depreciation expenses are as follows:
December 31, 2019 2019
Carrying amount Depreciation expenses
Land $ 669,967 ( $ 22,657 )
Buildings 9,879 ( 1,305 )
Machinery and equipment - ( 4,520 )
Others 2,058 ( 1,809 )
$ 681,904 ( $ 30,291 )
C. For the year ended December 31, 2019, additions to right-of-use assets was $11,183.
D. The information on profit and loss accounts relating to lease contracts is as follows:
2019
Items affecting profit or loss
Interest expense on lease liabilities $ 14,029
Expense on short-term lease contracts 230,385
E. For the year ended December 31, 2019, the Company’s total cash outflow for leases was $267,472.
(9) Accounts payable
December 31, 2019 December 31, 2018
Accounts payable $ 419,520 $ 267,368
Estimated accounts payable 400,028 369,903
$ 819,548 $ 637,271
(10) Current provisions
A. Movements in provisions are as follows:
Provisions for deficiency
compensation
2019
January 1 $ 29,352
Provision 5,204
Reversal ( 1,967 )
Payment ( 30,591 )
December 31 $ 1,998
B. By applying IFRS 15, the Company’s provision for sales allowance is presented as “Current
refund liabilities” from January 1, 2018, which was previously presented as “Current provisions”.
Information is provided in Note 6(11).
C. The detailed explanation of provisions for deficiency compensation is provided in Note 5(1).
212

(11) Current refund liabilities
A. Movements in refund liabilities are as follows:
Provisions for sales allowance
2019 2018
January 1 $ 32,627 $ 70,156
Provision 63,863 44,950
Reversal - ( 7,413 )
Payment ( 70,490) ( 75,066 )
December 31 $ 26,000 $ 32,627
B. The detailed explanation of provisions for sales allowance is provided in Note 5(2).
(12) Long-term bank loans
Type of loans Period and payment term
December 31,
2019
December 31,
2018
Syndicated bank loan Borrowing period is from May
30, 2018 to May 30, 2023;
interest is repayable monthly;
principal is repayable semi-
annually from November 30,
2018.
$ 9,066,000 $ 9,822,000
Less: Fee on syndicated bank loan ( 24,355 ) ( 32,482 )
Less: Current portion (fee included) ( 748,419 ) ( 747,422 )
$ 8,293,226 $ 9,042,096
Interest rate range 1.7895% 1.7895%
Unused credit lines of long-term bank loans
NT$ $ 1,800,000 $ 1,800,000
A. On May 15, 2018, the Company entered into a syndicated loan with eleven banks in Taiwan,
including Taiwan Cooperative Bank, in the amount of NT$12 billion with a term of five years.
Funding from this syndicated loan was used to repay the existing debt of financial institutions
and broaden the Company’s working capital. Pursuant to the syndicated loan agreement, the
Group is required to maintain certain financial ratios including current ratio, interest protection
multiples and debt to equity ratio during the loan periods.
B. On May 16, 2016, the Company entered into a syndicated loan with ten banks in Taiwan,
including Land Bank of Taiwan, in the amount of NT$13.2 billion with a term of five years.
Funding from this syndicated loan was used to repay the prior syndicated loan in 2014 and
broaden the Company’s working capital. Pursuant to the syndicated loan agreement, the Group
is required to maintain certain financial ratios including current ratio, interest protection
multiples and debt to equity ratio during the loan periods. The syndicated loan was fully repaid
in May 2018.
C. Information about the items related to the long-term bank loans that are pledged to others as
collaterals is provided in Note 8.
213
(13) Lease obligations payable
Prior to 2019
The Company leases equipment under finance lease and based on the terms of the lease contracts,
the Company has the option to purchase the equipment at a price which is expected to be sufficiently
lower than fair value at the date the option becomes exercisable when the leases expire.
Future minimum lease payables and their present values as of December 31, 2018 are as follows:
December 31, 2018
Total finance
lease liabilities
Future finance
charges
Present value of
finance lease
liabilities
Current $ 18,000 ($ 208) $ 17,792
(14) Pensions
A. Defined Benefit Plans
The Company has a defined benefit pension plan in accordance with the Labor Standards Act,
covering all regular employees’ service years prior to the enforcement of the Labor Pension Act
on July 1, 2005 and service years thereafter of employees who chose to continue to be subject to
the pension mechanism under the Labor Standards Act. Under the defined benefit pension plan,
two units are accrued for each year of service for the first 15 years and one unit for each additional
year thereafter, subject to a maximum of 45 units. Pension benefits are based on the number of
units accrued and the average monthly salaries and wages of the last 6 months prior to retirement.
The Company contributes monthly an amount equal to 2% of the employees’ monthly salaries
and wages to the pension fund deposited with the Bank of Taiwan, the trustee, under the name of
the independent pension fund committee. Also, the Company would assess the balance in the
aforementioned labor pension reserve account by the end of every year. If the account balance is
insufficient to pay the pension calculated by the aforementioned method, to the employees
expected to be qualified for retirement next year, the Company will make contributions to cover
the deficit by March of following year.
(a) The amounts recognized in the balance sheets are as follows: December 31, 2019 December 31, 2018
Present value of defined benefit obligations ($ 901,159) ($ 910,081)
Fair value of plan assets 421,052 389,316
Net defined benefit liability ($ 480,107) ($ 520,765)
214
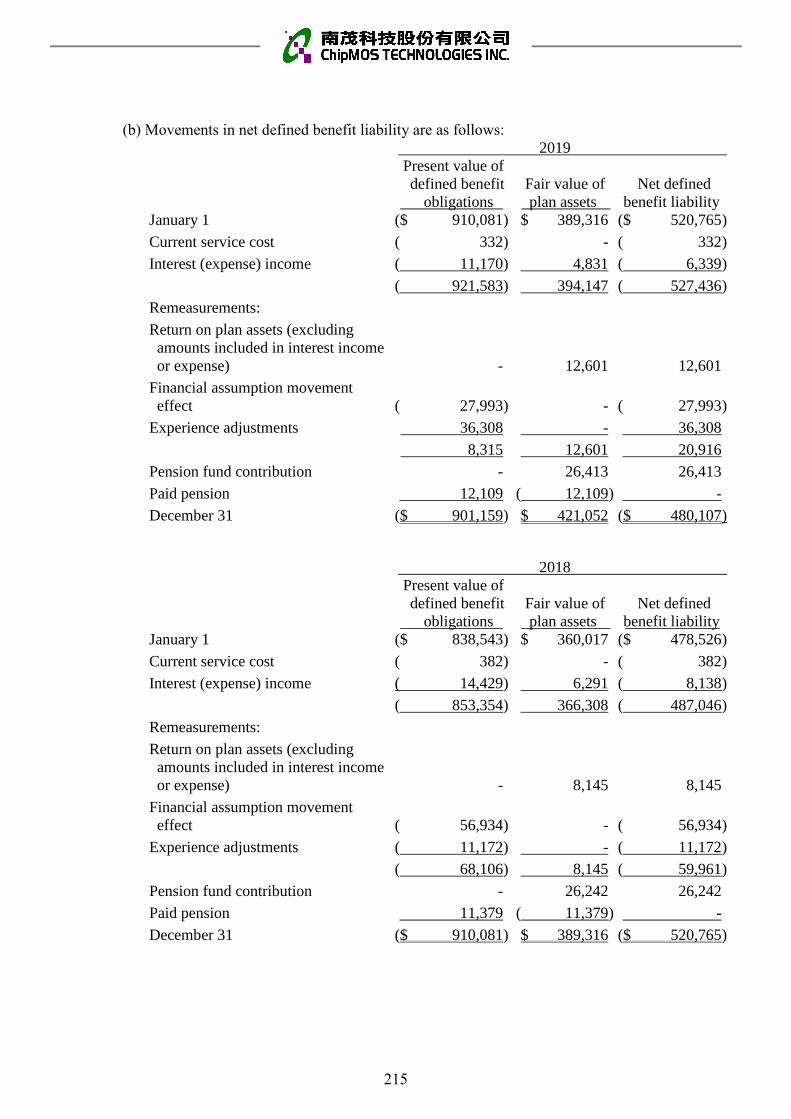
(b) Movements in net defined benefit liability are as follows: 2019
Present value of
defined benefit Fair value of Net defined
obligations plan assets benefit liability
January 1 ($ 910,081 ) $ 389,316 ($ 520,765 )
Current service cost ( 332 ) - ( 332 )
Interest (expense) income ( 11,170 ) 4,831 ( 6,339 )
( 921,583 ) 394,147 ( 527,436 )
Remeasurements:
Return on plan assets (excluding
amounts included in interest income
or expense) - 12,601 12,601
Financial assumption movement
effect ( 27,993 ) - ( 27,993 )
Experience adjustments 36,308 - 36,308
8,315 12,601 20,916
Pension fund contribution - 26,413 26,413
Paid pension 12,109 ( 12,109 ) -
December 31 ($ 901,159 ) $ 421,052 ($ 480,107 )
2018
Present value of
defined benefit Fair value of Net defined
obligations plan assets benefit liability
January 1 ($ 838,543 ) $ 360,017 ($ 478,526 )
Current service cost ( 382 ) - ( 382 )
Interest (expense) income ( 14,429 ) 6,291 ( 8,138 )
( 853,354 ) 366,308 ( 487,046 )
Remeasurements:
Return on plan assets (excluding
amounts included in interest income
or expense) - 8,145 8,145
Financial assumption movement
effect ( 56,934 ) - ( 56,934 )
Experience adjustments ( 11,172 ) - ( 11,172 )
( 68,106 ) 8,145 ( 59,961 )
Pension fund contribution - 26,242 26,242
Paid pension 11,379 ( 11,379 ) -
December 31 ($ 910,081 ) $ 389,316 ($ 520,765 )
215
(c) The Bank of Taiwan was commissioned to manage the fund of the Company’s defined
benefit pension plan in accordance with the fund’s annual investment and utilization plan
and the “Regulations for Revenues, Expenditures, Safeguard and Utilization of the Labor
Retirement Fund” (Article 6: The scope of utilization for the fund includes deposit in
domestic or foreign financial institutions, investment in domestic or foreign listed, over-the-
counter, or private placement equity securities, investment in domestic or foreign real estate
securitization products, etc.). With regard to the utilization of the fund, its minimum earnings
in the annual distributions on the final financial statements shall be no less than the earnings
attainable from the amounts accrued from two-year time deposits with the interest rates
offered by local banks. If the earnings is less than aforementioned rates, government shall
make payment for the deficit after being authorized by the authority. The Company has no
right to participate in managing and operating that fund and hence the Company is unable to
disclose the classification of the fair value of plan asset in accordance with IAS 19
“Employee Benefits” paragraph 142. The composition of fair value of plan assets as of
December 31, 2019 and 2018 is given in the Annual Labor Retirement Fund Utilization
Report announced by the government.
(d) The principal actuarial assumptions used were as follows:
2019 2018
Discount rate 1,00% 1.25%
Future salary increase 3.50% 3.50%
Assumptions regarding future mortality are set based on actuarial advice in accordance with
published statistics and experience in each territory.
Because the main actuarial assumption changed, the present value of defined benefit
obligations is affected. The analysis was as follows:
Discount rate Future salary increase
Increase Decrease Increase Decrease
0.25% 0.25% 0.25% 0.25%
December 31, 2019
Effect on present value of
defined benefit obligations ($ 27,993 ) $ 29,284 $ 28,501 ($ 27,407 )
December 31, 2018
Effect on present value of
defined benefit obligations ($ 29,052 ) $ 30,430 $ 29,692 ($ 28,513 )
The sensitivity analysis above is based on a change in an assumption while holding all other
assumptions constant. In practice, changes in some of the assumptions may be correlated.
The method of analysing sensitivity and the method of calculating net pension liability in the
balance sheet are the same.
The methods and types of assumptions used in preparing the sensitivity analysis remain
unchanged from previous period.
(e) Expected contributions to the defined benefit pension plans of the Company for the year
ending December 31, 2020 amounts to $27,337.
216
(f) As of December 31, 2019, the weighted average duration of that retirement plan is 12.8 years.
The analysis of timing of the future pension payment was as follows:
Within 1 year $ 35,272
1-2 years 34,647
2-5 years 122,670
5-10 years 167,707
$ 360,296
B. Define Contribution Plans
Effective from July 1, 2005, the Company established a defined contribution pension plan (“New
Plan”) under the Labor Pension Act, covering all regular employees with Republic of China
(“R.O.C.”) nationality. Under the New Plan, the Company contributes monthly an amount based
on 6% of the employees’ monthly salaries and wages to the employees’ individual pension
accounts at the Bureau of Labor Insurance. The benefits accrued are paid monthly or in lump
sum upon termination of employment. The pension costs under defined contribution pension
plans of the Company for the years ended December 31, 2019 and 2018 were $187,502 and
$193,047, respectively.
(15) Share-based payments
Restricted shares
A. On July 14, 2015, the Company’s Board of Directors approved the issuance of restricted shares.
The record dates for the shares issuance were July 21, 2015 and May 10, 2016. The relevant
information is as follows: Share price Number of Number of shares returned due to
Type of on grant date shares employee resignation (in thousands) Contract
arrangement Grant date (in dollars) (in thousands) 2019 2018 period Vesting condition
Restricted shares award agreement
July 21, 2015
36.1 15,752 - ( 256 ) 3 years Meet service and performance
conditions
Restricted shares award agreement
May 10, 2016
30.6 1,548 ( 25 ) ( 116 ) 3 years Meet service and performance
conditions
The restricted shares issued by the Company cannot be transferred during the vesting period, but
voting right and dividend right are not restricted. Employees are required to return the shares but
not required to return the dividends received if they resign during the vesting period. When the
employees accomplish the years of service and performance conditions, the received restricted
shares will be vested based on the vesting ratio.
B. The expenses incurred on share-based payment transactions for the years ended December 31,
2019 and 2018 were $822 and $41,043, respectively.
(16) Capital stock
A. As of December 31, 2019, the Company’s authorized capital was $9,700,000, consisting of
970,000 thousand ordinary shares, and the paid-in capital was $7,272,401 with a par value of
$10 (in dollars) per share, consisting of 727,240 thousand ordinary shares. All proceeds from
shares issued have been collected.
217

B. As of December 31, 2019, the outstanding ADSs were approximately 4,801,737 units
representing 96,035 thousand ordinary shares and each ADS represents 20 ordinary shares of the
Company. The major terms and conditions of the ADSs are summarized as follows:
(a) Voting rights:
ADS holders have no right to directly vote in shareholders’ meetings with respect to the
deposited shares. The depository bank shall vote on behalf of ADS holders or provide voting
instruction to the designated person of the Company. The depository bank shall vote in the
manner as instructed by ADS holders.
(b) Distribution of dividends:
ADS holders are deemed to have the same rights as holders of ordinary shares with respect
to the distribution of dividends.
C. Movements in the number of the Company’s ordinary shares outstanding are as follows:
Number of shares (in thousands)
2019 2018
January 1 727,265 856,059
Restricted shares − cancelled ( 25 ) ( 349 )
Restricted shares − uncancelled - ( 23 )
Capital reduction - ( 128,422 )
December 31 727,240 727,265
D. Treasury stock
(a) On March 7, 2019 and August 6, 2019, the Company’s Board of Directors approved the
cancellation of treasury stock 25,570 thousand shares amounted to $962,503. As of December
31, 2019, all of the Company's treasury stocks were cancelled. As of December 31, 2018, the
reasons for share repurchases are as follows:
December 31, 2018
Name of company Number of shares
holding the shares Reason for repurchase (in thousands) Carrying amount
The Company To be reissued to employees 30,000 $ 1,005,011
The Company Dissenting shareholders 85 2,643
The Company Capital reduction ( 4,515) ( 45,151 )
25,570 $ 962,503
(b) Pursuant to the R.O.C. Securities and Exchange Act, the number of shares repurchased as
treasury stock may not exceed 10% of the number of the Company’s issued shares and the
amount bought back may not exceed the sum of retained earnings, paid-in capital in excess
of par value and realized capital surplus.
218
(c) Pursuant to the R.O.C. Securities and Exchange Act, treasury stock may not be pledged as
collateral and is not entitled to dividends before it is reissued.
(d) Pursuant to the R.O.C. Securities and Exchange Act, treasury shares should be reissued to the
employees within five years from the reacquisition date and shares not reissued within the
five-year period are to be retired. Treasury stocks to enhance the Company’s credit rating and
the stockholders’ equity should be retired within six months from acquisition.
E. In order to adjust capital structure and increase return of equity, the Company’s shareholders
adopted a resolution on June 26, 2018 to reduce capital stock and return cash to shareholders.
Subsequently, the record date of the capital reduction was fixed on August 15, 2018, and capital
was reduced approximately 15% amounted to $1,329,446, consisting of 132,945 thousand
ordinary shares.
(17) Capital surplus
Pursuant to the R.O.C. Company Act, any capital surplus arising from paid-in capital in excess of
par value on issuance of ordinary shares and donations can be used to cover accumulated deficits or
to issue new shares or cash to shareholders in proportion to their share ownership, provided that the
Company has no accumulated deficits. Furthermore, the R.O.C. Securities and Exchange Act
requires that the amount of capital surplus to be capitalized mentioned above may not exceed 10%
of the paid-in capital each year. The capital surplus may not be used to cover accumulated deficits
unless the legal reserve is insufficient.
2019
Share
Employee
restricted Long-term
premium shares investment Total
January 1 $ 5,873,743 $ 382,506 $ 24,233 $ 6,280,482
Share-based payments - ( 412 ) - ( 412 )
Cancellation of treasury stock ( 199,501 ) ( 12,853 ) - ( 212,354 )
Disposal of investment accounted for using equity
method - - ( 8,065) ( 8,065 )
December 31 $ 5,674,242 $ 369,241 $ 16,168 $ 6,059,651
2018
Share
Employee
restricted Long-term
premium shares investment Total
January 1 $ 5,873,743 $ 390,401 $ 24,233 $ 6,288,377
Share-based payments - ( 7,967 ) - ( 7,967 )
Capital reduction - 72 - 72
December 31 $ 5,873,743 $ 382,506 $ 24,233 $ 6,280,482
219

(18) Retained earnings
A. Under the Company’s Articles of Incorporation, the current year’s earnings, if any, shall first be
used to pay all taxes and offset prior years’ operating losses and then 10% of the remaining
amount shall be set aside as a legal reserve. The Company may then appropriate or reverse a
certain amount as special reserve according to the relevant regulations. After the distribution of
earnings, the remaining earnings and prior years’ unappropriated retained earnings may be
appropriated according to a proposal by the Board of Directors and approved in the shareholders’
meeting.
B. The Company’s dividend policy is summarized here. As the Company operates in a volatile
business environment, the issuance of dividends to be distributed takes into consideration the
Company’s financial structure, operating results and future expansion plans. The earnings
distribution of the Company may be made by way of cash dividends or stock dividends, provided
that cash dividends account for at least 10% of the total dividends distributed. The earnings
distribution will be proposed by the Board of Directors and approved at the shareholders’ meeting.
C. Except for covering accumulated deficits or issuing new shares or cash to shareholders in
proportion to their share ownership, the legal reserve may not be used for any other purpose. The
use of the legal reserve for the issuance of shares or cash to shareholders in proportion to their
share ownership is permitted, provided that the distribution of the reserve is limited to the portion
in excess of 25% of the Company’s paid-in capital.
D. In accordance with the regulations, the Company must set aside a special reserve from the debit
balance on other equity items at the balance sheet date before distributing earnings. When the
debit balance on other equity items is reversed subsequently, the reversed amount may be
included in the distributable earnings.
E. The appropriations of 2018 and 2017 earnings were resolved in the shareholders’ meetings held
on June 10, 2019 and June 26, 2018, respectively. The appropriations and dividends per share
are as follows:
2018 2017
Cash
distribution
Cash
distribution
per share per share
Amount (in dollars) Amount (in dollars)
Legal reserve $ 110,308 $ 302,653
Cash dividend 872,718 $ 1.20 256,806 $ 0.30
F. The information relating to employees’ compensation and director’s remuneration is provided in
Note 6(26)
220

(19) Other equity interest 2019
Financial
statements
translation
differences of
foreign
Unrealized
gain (loss) on
valuation of
financial
assets at fair value
through other
comprehensive
Unearned
employee
operations income awards Total
January 1 $ 14,516 $ 106,898 ($ 1,701 ) $ 119,713
Currency translation differences
- The Company ( 104,198 ) - - ( 104,198)
Employee restricted shares
- The Company - - 1,701 1,701
Evaluation adjustment
- The Company - ( 52,549 ) - ( 52,549)
- Associates - 5,093 - 5,093
Evaluation adjustment related tax
- The Company - 10,510 - 10,510
Disposal of investment accounted for using equity
method - ( 72 ) - ( 72)
December 31 ($ 89,682 ) $ 69,880 $ - ($ 19,802)
2018
Financial
statements
translation
differences of
foreign
Unrealized
gain (loss) on
valuation of
financial
assets at fair value
through other
comprehensive
Unrealized gain
(loss) on
valuation
of available-
for-sale
Unearned
employee
operations income financial assets awards Total
January 1 $ 65,593 $ - $ 678 ($ 54,570 ) $ 11,701
Effects on initial application of
IFRS 9 - 42,843 ( 678 ) - 42,165
Adjusted beginning balance 65,593 42,843 - ( 54,570 ) 53,866
Currency translation differences
- The Company ( 51,077 ) - - - ( 51,077)
Employee restricted shares
- The Company - - - 52,869 52,869
Evaluation adjustment
- The Company - 85,022 - - 85,022
- Associates - ( 2,438 ) - - ( 2,438)
Evaluation adjustment related
tax
- The Company - ( 18,529 ) - - ( 18,529)
December 31 $ 14,516 $ 106,898 $ - ($ 1,701 ) $ 119,713
221

(20) Revenue
2019 2018
Testing $ 4,257,800 $ 4,790,097
Assembly 5,148,877 4,679,676
LCDD 6,922,205 5,694,720
Bumping 4,008,999 3,315,534
$ 20,337,881 $ 18,480,027
A. The Company is primarily engaged in the assembly and testing services on high-integration and
high-precision integrated circuits, and recognized revenue based on the progress towards
completion of performance obligation during the service period.
B. Contract assets and liabilities
The Company has recognized the following contract assets and liabilities in relation to revenue
from contracts with customers:
December 31, 2019 December 31, 2018 January 1, 2018
Contract assets $ 377,869 $ 299,835 $ 254,997
Contract liabilities
(Advance payments) $ 1,231 $ 1,432 $ 1,152
C. Contract assets have increased as the Company has completed more services in excess of
customers’ payments. The information relating to loss allowance for contract assets is provided
in Note 12(2).
D. Revenue recognized in the current reporting period amounted to $766 was related to carried
forward contract liabilities for performance obligations not satisfied in prior year.
E. All of the service contracts are for periods of one year or less. As permitted under IFRS 15, the
transaction price allocated to these unsatisfied contracts is not disclosed. As of December 31,
2019, the Company did not recognized an asset in relation to costs to acquire or fulfill a service
contract.
(21) Other income (expenses), net
2019 2018
Gain on disposal of scrapped materials $ 43,652 $ 59,380
Royalty income 12,336 43,224
Gain on disposal of items purchased on behalf of
others 15,080 31,268
Gain on disposal of property, plant and equipment 20,271 14,274
Insurance compensation income 10,435 147
Impairment loss on property, plant and equipment ( 9,938 ) -
Others 1,092 ( 779 )
$ 92,928 $ 147,514
222
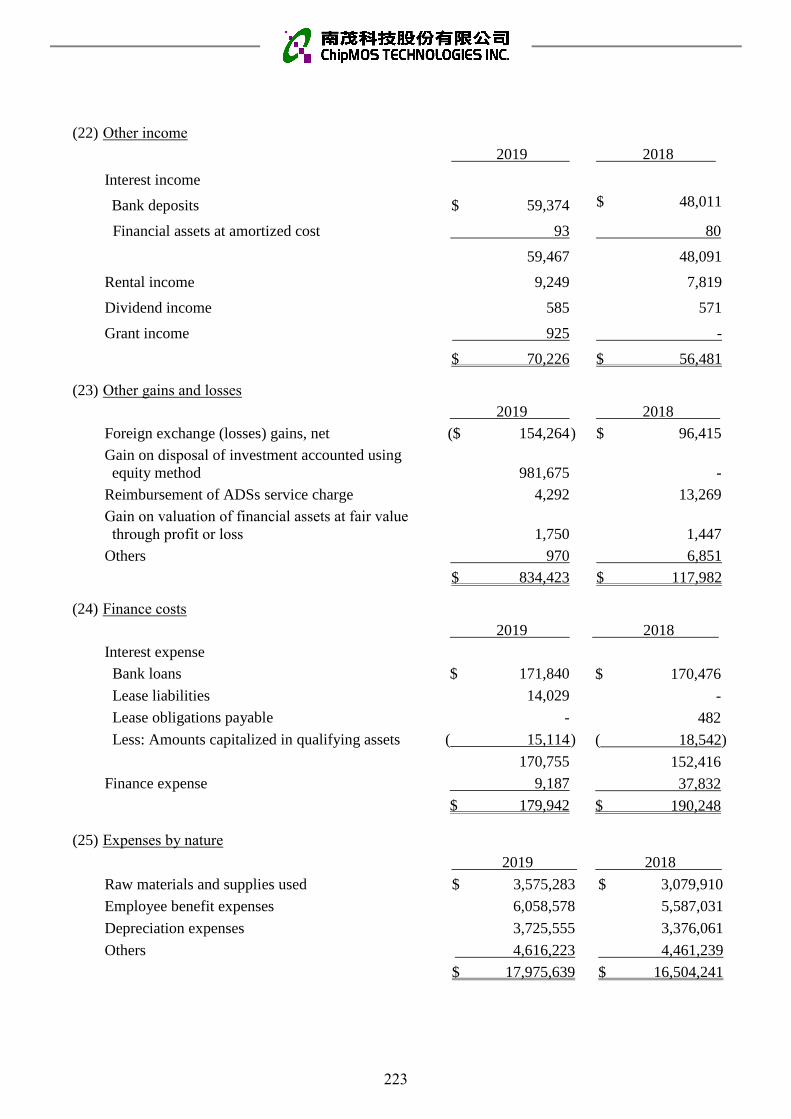
(22) Other income
2019 2018
Interest income
Bank deposits $ 59,374 $ 48,011
Financial assets at amortized cost 93 80
59,467 48,091
Rental income 9,249 7,819
Dividend income 585 571
Grant income 925 -
$ 70,226 $ 56,481
(23) Other gains and losses
2019 2018
Foreign exchange (losses) gains, net ($ 154,264 ) $ 96,415
Gain on disposal of investment accounted using
equity method 981,675 -
Reimbursement of ADSs service charge 4,292 13,269
Gain on valuation of financial assets at fair value
through profit or loss 1,750 1,447
Others 970 6,851
$ 834,423 $ 117,982
(24) Finance costs
2019 2018
Interest expense
Bank loans $ 171,840 $ 170,476
Lease liabilities 14,029 -
Lease obligations payable - 482
Less: Amounts capitalized in qualifying assets ( 15,114 ) ( 18,542)
170,755 152,416
Finance expense 9,187 37,832
$ 179,942 $ 190,248
(25) Expenses by nature
2019 2018
Raw materials and supplies used $ 3,575,283 $ 3,079,910
Employee benefit expenses 6,058,578 5,587,031
Depreciation expenses 3,725,555 3,376,061
Others 4,616,223 4,461,239
$ 17,975,639 $ 16,504,241
223

(26) Employee benefit expenses
2019 2018
Salaries $ 5,101,085 $ 4,611,770
Directors’ remuneration 26,266 18,456
Labor and health insurance 418,616 402,578
Pension 194,173 201,567
Share-based payments 822 41,043
Other personnel expenses 317,616 311,617
$ 6,058,578 $ 5,587,031
A. In accordance with the Company’s Articles of Incorporation, employees’ compensation is based
on the current year’s earnings, which should first be used to cover accumulated deficits, if any,
and then 10% of the remaining balance distributed as employees’ compensation, including
distributions to certain qualifying employees in affiliate companies, and no more than 0.5% as
directors’ remuneration. Subject to the Board of Directors’ approval, employees’ compensation
may be made by way of cash or share issuance. Distribution of employees’ compensation and
directors’ remuneration shall be presented and reported in the subsequent shareholders’ meeting.
B. Based on profit distributable as of the end of reporting period, for the years ended December 31,
2019 and 2018, the employees’ compensation were accrued at $338,356 and $199,027,
respectively; the directors’ remuneration were accrued at $16,918 and $9,951, respectively.
C. For the year of 2018, employees’ compensation and directors’ remuneration recognized were
consistent with the amounts resolved in the Board of Directors’ meetings.
Information about the appropriation of employees’ compensation and directors’ remuneration by
the Company as approved by the Board of Directors is posted in the “Market Observation Post
System”.
(27) Income tax expense
A. Income tax expense
(a) Components of income tax expense:
2019 2018
Current income tax:
Current income tax on profits for the period $ 406,759 $ 324,910
Income tax on unappropriated retained earnings 7,019 250,914
Prior year income tax (over) under estimation ( 5,016) 3,729
Total current income tax 408,762 579,553
Deferred income tax:
Relating to origination and reversal of
temporary differences 35,367 101,441
Impact of change in tax rate - ( 2,774)
Total deferred income tax 35,367 98,667
Income tax expense $ 444,129 $ 678,220
224

(b) The income tax (charge)/credit relating to components of other comprehensive income is as
follows:
2019 2018
Unrealized (loss)gain on valuation of financial assets
at fair value through other comprehensive income ($ 10,510) $ 17,005
Remeasurement of defined benefit obligations 4,183 ( 11,992 )
Impact of change in tax rate - ( 887 )
($ 6,327) $ 4,126
B. Reconciliation of income tax expense and the accounting profit:
2019 2018
Tax calculated based on profit before tax and statutory
tax rate $ 605,658 $ 356,260
Expenses disallowed by tax regulation 3,055 14,689
Tax exempted (income) expenses by tax regulation ( 165,979 ) 66,353
Temporary difference not recognized as deferred tax
assets ( 608 ) ( 10,951 )
Prior year income tax (over) under estimation ( 5,016) 3,729
Income tax on unappropriated retained earnings 7,019 250,914
Impact of change in tax rate - ( 2,774 )
Income tax expense $ 444,129 $ 678,220
C. The amounts of deferred tax assets or liabilities resulting from temporary differences and
investment tax credits are as follows: 2019
Recognized in
Recognized
in other
comprehensive
January 1 profit or loss income December 31 Deferred tax assets
Loss on inventories $ 7,232 $ 5,468 $ - $ 12,700
Property, plant and equipment 64,183 ( 25,515) - 38,668
Provisions 12,396 ( 6,796) - 5,600
Deferred revenue 34,156 ( 6,506) - 27,650
Net defined benefit liability 100,743 ( 3,948) ( 4,183 ) 92,612
Unrealized exchange losses 3,575 13,721 - 17,296
Investment tax credits 4,420 ( 4,420) - -
Others 11 15 - 26
Total $ 226,716 ($ 27,981) ($ 4,183 ) $ 194,552
Deferred tax liabilities
Property, plant and equipment ($ 281,594) ($ 7,386) $ - ($ 288,980)
Financial assets at fair value through other comprehensive income ( 27,165) - 10,510 ( 16,655)
Total ($ 308,759) ($ 7,386) $ 10,510 ($ 305,635)
Information presented on balance sheets:
Deferred tax assets $ 226,716 $ 194,552
Deferred tax liabilities ($ 308,759) ($ 305,635)
225

2018
Effects on
initial
application
of IFRS 9 Recognized in
Recognized
in other
comprehensive
January 1 and IFRS 15 profit or loss income December 31
Deferred tax assets
Loss on inventories $ 9,132 ($ 770 ) ($ 1,130) $ - $ 7,232
Property, plant and equipment 55,494 - 8,689 - 64,183
Provisions 21,643 - ( 9,247) - 12,396
Deferred revenue 39,485 - ( 5,329) - 34,156
Net defined benefit liability 78,451 - 7,889 14,403 100,743
Unrealized exchange losses 8,167 144 ( 4,736) - 3,575
Investment tax credits - - 4,420 - 4,420
Others - - 11 - 11
Total $ 212,372 ($ 626 ) $ 567 $ 14,403 $ 226,716
Deferred tax liabilities
Property, plant and equipment ($ 174,293) $ - ($ 107,301) $ - ($ 281,594)
Contract assets - ( 8,067 ) 8,067 - -
Financial assets at fair value
through other comprehensive
income - ( 8,636 ) - ( 18,529 ) ( 27,165)
Total ($ 174,293) ($ 16,703 ) ($ 99,234) ($ 18,529 ) ($ 308,759)
Information presented on balance
sheets:
Deferred tax assets $ 212,372 $ 226,716
Deferred tax liabilities ($ 174,293) ($ 308,759)
D. The Company has not recognized deductible and taxable temporary differences associated with
investments as deferred tax assets and liabilities. As of December 31, 2019 and 2018, the
amounts of deductible temporary differences not recognized as deferred tax liabilities were
$180,395 and $495,154, respectively.
E. The Company’s income tax returns through 2016 have been assessed and approved by the Tax
Authority.
F. The amendment to the Income Tax Act has been approved and promulgated in February 2018 to
raise the profit-seeking enterprise income tax rate from 17% to 20%, decrease the tax rate on
unappropriated retained earnings from 10% to 5%, and abandon the imputation tax credit
account effective from fiscal year starting January 1, 2018.
G. On October 31, 2016, the Company merged with its former parent company, ChipMOS
TECHNOLOGIES (Bermuda) LTD. and as a result, the Company recognized its own shares
originally held by former parent company as treasury stock. Subsequently, the Company
deducted unappropriated retained earnings by $5,052,343 to reflect the loss due from the
cancellation of treasury stock. In January 2017, the Company has filed an application to the
National Taxation Bureau of the Northern Area, Ministry of Finance to apply the accumulated
deficit amount, derived from subtracting the aforementioned amount from unappropriated
retained earnings generated prior to year 2015 (not including 2015 unappropriated retained
226

earnings), as a deduction in the calculation of years 2016 and 2015 additional 10% tax on
unappropriated retained earnings. On August 26, 2019, the Ministry of Finance issued
Interpretation No.10804006760 and agreed the aforementioned deduction of unappropriated
retained earnings to reflect the loss due from the cancellation of treasury stock as a result of the
merger. As of the issue date of this report, the Company has not received the Notice for
Assessment of Tax approved by the National Taxation Bureau of the Northern Area, Ministry of
Finance.
(28) Earnings per share 2019
Amount after
Weighted average
number of ordinary
shares outstanding
Earnings per
share
Basic earnings per share income tax (in thousands) (in dollars)
Profit attributable to common share of the Company $ 2,584,161 727,111 $ 3.55
Diluted earnings per share
Assumed conversion of all dilutive potential ordinary
shares:
Employees' compensation 9,879
Restricted shares 126
Profit attributable to common share of the Company $ 2,584,161 737,116 $ 3.51
2018
Amount after
Weighted average
number of ordinary
shares outstanding
Earnings per
share
Basic earnings per share income tax (in thousands) (in dollars)
Profit attributable to common share of the Company $ 1,103,075 802,725 $ 1.37
Diluted earnings per share
Assumed conversion of all dilutive potential ordinary
shares:
Employees' compensation 7,626
Restricted shares 3,356
Profit attributable to common share of the Company $ 1,103,075 813,707 $ 1.36
(29) Operating lease commitments
Prior to 2019
A. The Company has entered into several operating lease contracts for land with Hsinchu and
Southern Taiwan Science Park Bureaus. These renewable operating leases will expire by 2032
and 2034. In accordance with the lease contracts, Science Park Bureau reserves the right to adjust
annual rents and the annual rents for the year ended 2018 was $33,142.
227

B. Future aggregate minimum lease obligations payable under the aforementioned leases are as
follows:
December 31, 2018
Within 1 year $ 62,691
1 to 5 years 134,670
Over 5 years 111,446
$ 308,807
(30) Supplemental cash flow information
Partial cash paid for investing activities
Property, plant and equipment
2019 2018
Purchase of property, plant and equipment $ 4,896,609 $ 4,945,287
Add: Beginning balance of payable on equipment 1,516,735 713,313
Beginning balance of payable on lease - 29,842
Less: Ending balance of payable on equipment ( 972,770 ) ( 1,516,735 )
Ending balance of payable on lease - ( 17,792 )
Cash paid during the year $ 5,440,574 $ 4,153,915
(31) Changes in liabilities from financing activities
2019
Long-term
bank loans
(including
current Guarantee Lease
Total liabilities
from financing
portion) deposits liabilities activities
January 1 $ 9,789,518 $ 1,092 $ - $ 9,790,610
Effects on initial application
of IFRS 16 - - 873,213 873,213
Adjusted balance at January 1 9,789,518 1,092 873,213 10,663,823
Changes in cash flow from
financing activities ( 756,450 ) 3 ( 42,128) ( 798,575)
Adjustment to right-of-use
assets - - ( 148,512) ( 148,512)
Reclassification to payable on
equipment from lease
liabilities - - ( 9,000) ( 9,000)
Amortization of loan fees 8,577 - - 8,577
Amortization of interest
expenses - - 14,029 14,029
December 31 $ 9,041,645 $ 1,095 $ 687,602 $ 9,730,342
228

2018
Short-term
bank loans
Long-term
bank loans
(including
current portion)
Guarantee
deposits
Total liabilities
from financing
activities
January 1 $ 969,353 $ 9,642,021 $ 1,371 $ 10,612,745
Changes in cash flow from
financing activities ( 969,353) 110,250 ( 279 ) ( 859,382)
Amortization of loan fees - 37,247 - 37,247
December 31 $ - $ 9,789,518 $ 1,092 $ 9,790,610
7. RELATED PARTY TRANSACTIONS
(1) Names of related parties and relationship
Name Relationship
ChipMOS BVI Subsidiary
ChipMOS USA Subsidiary
JMC Associate
Unimos Shanghai Associate
(2) Significant related party transactions
A. Purchases of materials
2019 2018
JMC $ 9 $ 132,494
Purchases of materials from associates are based on normal commercial terms and conditions.
The payment terms of the purchase from associates have no significant differences with third
party suppliers.
B. Service expense
2019 2018
ChipMOS USA $ 32,826 $ 35,591
C. Acquisition of financial assets
(a) In January 2018, the Company participated in ChipMOS BVI’s increase of paid-in capital
amounted to $89,280, please refer to Note 6(6).
(b) In January 2018, ChipMOS BVI participated in Unimos Shanghai’s increase of paid-in
capital based on its shareholding amounted to $794,694, please refer to Note 6(6).
229
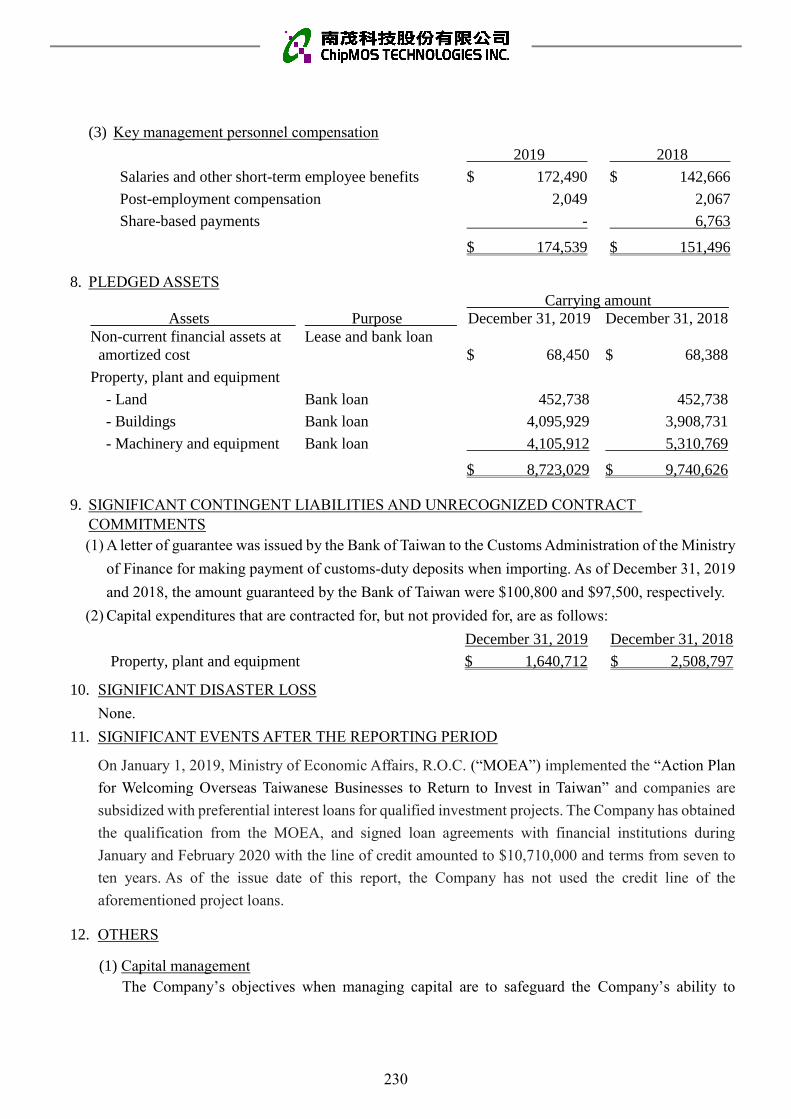
(3) Key management personnel compensation
2019 2018
Salaries and other short-term employee benefits $ 172,490 $ 142,666
Post-employment compensation 2,049 2,067
Share-based payments - 6,763
$ 174,539 $ 151,496
8. PLEDGED ASSETS
Carrying amount
Assets Purpose December 31, 2019 December 31, 2018
Non-current financial assets at
amortized cost
Lease and bank loan
$ 68,450 $ 68,388
Property, plant and equipment
- Land Bank loan 452,738 452,738
- Buildings Bank loan 4,095,929 3,908,731
- Machinery and equipment Bank loan 4,105,912 5,310,769
$ 8,723,029 $ 9,740,626
9. SIGNIFICANT CONTINGENT LIABILITIES AND UNRECOGNIZED CONTRACT
COMMITMENTS
(1) A letter of guarantee was issued by the Bank of Taiwan to the Customs Administration of the Ministry
of Finance for making payment of customs-duty deposits when importing. As of December 31, 2019
and 2018, the amount guaranteed by the Bank of Taiwan were $100,800 and $97,500, respectively.
(2) Capital expenditures that are contracted for, but not provided for, are as follows:
December 31, 2019 December 31, 2018
Property, plant and equipment $ 1,640,712 $ 2,508,797
10. SIGNIFICANT DISASTER LOSS
None.
11. SIGNIFICANT EVENTS AFTER THE REPORTING PERIOD
On January 1, 2019, Ministry of Economic Affairs, R.O.C. (“MOEA”) implemented the “Action Plan
for Welcoming Overseas Taiwanese Businesses to Return to Invest in Taiwan” and companies are
subsidized with preferential interest loans for qualified investment projects. The Company has obtained
the qualification from the MOEA, and signed loan agreements with financial institutions during
January and February 2020 with the line of credit amounted to $10,710,000 and terms from seven to
ten years. As of the issue date of this report, the Company has not used the credit line of the
aforementioned project loans.
12. OTHERS
(1) Capital management
The Company’s objectives when managing capital are to safeguard the Company’s ability to
230
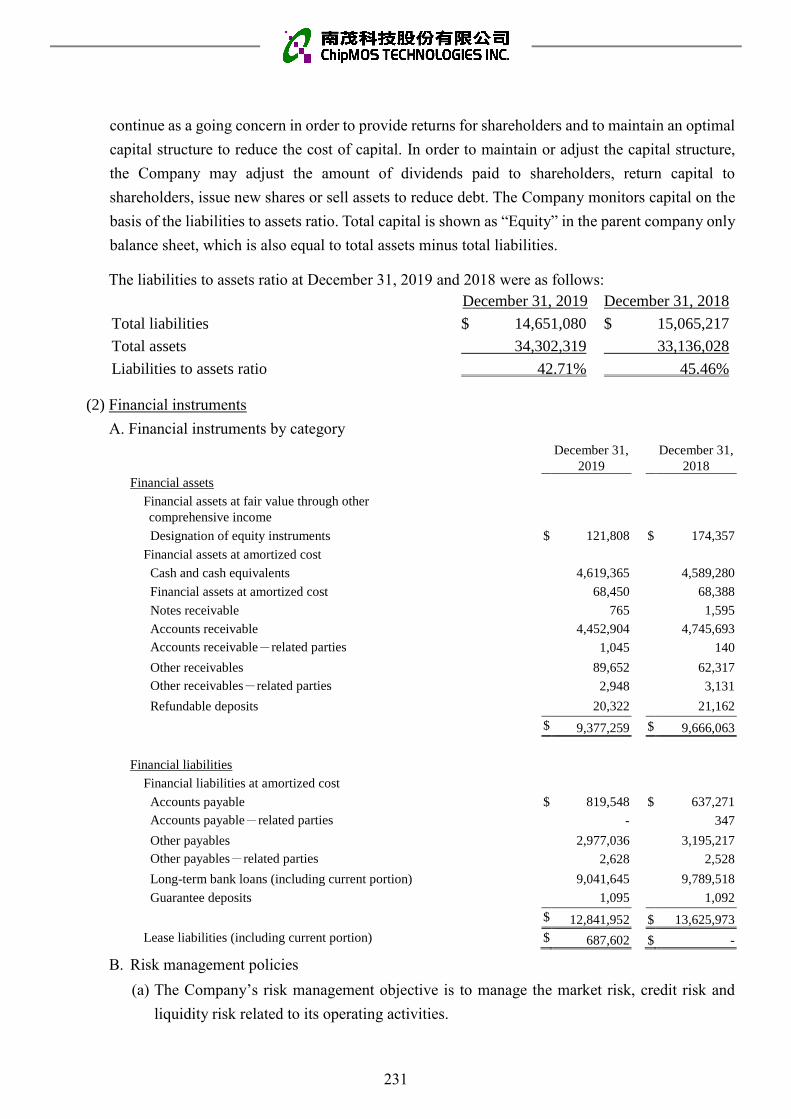
continue as a going concern in order to provide returns for shareholders and to maintain an optimal
capital structure to reduce the cost of capital. In order to maintain or adjust the capital structure,
the Company may adjust the amount of dividends paid to shareholders, return capital to
shareholders, issue new shares or sell assets to reduce debt. The Company monitors capital on the
basis of the liabilities to assets ratio. Total capital is shown as “Equity” in the parent company only
balance sheet, which is also equal to total assets minus total liabilities.
The liabilities to assets ratio at December 31, 2019 and 2018 were as follows:
December 31, 2019 December 31, 2018
Total liabilities $ 14,651,080 $ 15,065,217
Total assets 34,302,319 33,136,028
Liabilities to assets ratio 42.71% 45.46%
(2) Financial instruments
A. Financial instruments by category
December 31,
2019
December 31,
2018
Financial assets
Financial assets at fair value through other
comprehensive income
Designation of equity instruments $ 121,808 $ 174,357
Financial assets at amortized cost
Cash and cash equivalents 4,619,365 4,589,280
Financial assets at amortized cost 68,450 68,388
Notes receivable 765 1,595
Accounts receivable 4,452,904 4,745,693
Accounts receivable-related parties 1,045 140
Other receivables 89,652 62,317
Other receivables-related parties 2,948 3,131
Refundable deposits 20,322 21,162
$ 9,377,259 $ 9,666,063
Financial liabilities
Financial liabilities at amortized cost
Accounts payable $ 819,548 $ 637,271
Accounts payable-related parties - 347
Other payables 2,977,036 3,195,217
Other payables-related parties 2,628 2,528
Long-term bank loans (including current portion) 9,041,645 9,789,518
Guarantee deposits 1,095 1,092
$ 12,841,952 $ 13,625,973
Lease liabilities (including current portion) $ 687,602 $ -
B. Risk management policies
(a) The Company’s risk management objective is to manage the market risk, credit risk and
liquidity risk related to its operating activities.
231

(b) The Company has established appropriate policies, procedures and internal controls for
financial risk management. Before entering into significant financial transactions, a due
approval process must be carried out by the Board of Directors based on related protocols
and internal control procedures. The Company complies with its financial risk management
policies at all times.
(c) In order to minimize and manage financial risks, the Company’s overall risk management
program focuses on analyzing, identifying, and evaluating financial risk factors that may
potentially have adverse effects on the Company’s financial position, and provide feasible
solutions to avoid those factors.
C. Significant financial risks and degrees of financial risks
(a) Market risk
The Company’s market risk is the risk that the fair value or future cash flows of a financial
instrument will fluctuate because of changes in market prices. Market risks comprise foreign
currency risk, interest rate risk, and other price risks.
In practice, the risk variable rarely changes individually, and the change of each risk variable
is usually correlative. The following sensitivity analysis did not consider the interaction of
each risk variable.
Foreign exchange risk
i. The Company’s exposure to the risk of changes in foreign exchange rates relates
primarily to the Company’s operating activities (when revenue or expense is denominated
in a different currency from the Company’s functional currency) and the Company’s net
investments in foreign operations.
ii. The Company applies natural hedges by using accounts receivable and accounts payable
denominated in the same currency. However, this natural hedge does not concur with the
requirement for hedge accounting. Furthermore, as net investments in foreign operations
are for strategic purposes, they are not hedged by the Company.
iii. The Company’s foreign currency exposure gives rise to market risks associated with
exchange rate movements against the NT dollar for cash and cash equivalents, accounts
receivable, other receivables, bank loans, accounts payable and other payables.
iv. The Company’s businesses involve some non-functional currency operations. The
information on assets and liabilities denominated in foreign currencies whose values
would be materially affected by the exchange rate fluctuations is as follows:
232

December 31, 2019
Foreign currency Carrying amount
(in thousands) Exchange rate (NTD)
(Foreign currency: functional
currency)
Financial assets
Monetary items
USD:NTD $ 180,348 29.9800 $ 5,406,833
JPY:NTD 266,819 0.2760 73,642
RMB:NTD 2,937 4.3050 12,644
Financial liabilities
Monetary items
USD:NTD $ 7,925 29.9800 $ 237,592
JPY:NTD 1,033,394 0.2760 285,217
December 31, 2018
Foreign currency Carrying amount
(in thousands) Exchange rate (NTD)
(Foreign currency: functional
currency)
Financial assets
Monetary items
USD:NTD $ 162,426 30.7150 $ 4,988,915
JPY:NTD 177,557 0.2782 49,396
RMB:NTD 5,630 4.4720 25,177
Financial liabilities
Monetary items
USD:NTD $ 18,305 30.7150 $ 562,238
JPY:NTD 2,436,140 0.2782 677,734
v. The total exchange (loss) gain, including realized and unrealized (losses) gains arising
from significant foreign exchange variations on monetary items held by the Company for
the years ended December 31, 2019 and 2018, amounted to ($154,264) and $96,415,
respectively.
vi. Analysis of foreign currency market risk arising from significant foreign exchange
variations:
233

2019
Sensitivity analysis
Change in
exchange Effect on
Effect on other
comprehensive
rate profit (loss) income
Financial assets
Monetary items
USD:NTD 5% $ 270,342 $ -
JPY:NTD 5% 3,682 -
RMB:NTD 5% 632 -
Financial liabilities
Monetary items
USD:NTD 5% $ 11,880 $ -
JPY:NTD 5% 14,261 -
2018
Sensitivity analysis
Change in
exchange Effect on
Effect on other
comprehensive
rate profit (loss) income
Financial assets
Monetary items
USD:NTD 5% $ 249,446 $ -
JPY:NTD 5% 2,470 -
RMB:NTD 5% 1,259 -
Financial liabilities
Monetary items
USD:NTD 5% $ 28,112 $ -
JPY:NTD 5% 33,887 -
Price risk
i. The Company’s financial instruments, which are exposed to price risk, are the financial
assets at fair value through profit or loss and financial assets at fair value through other
comprehensive income. To manage its price risk arising from investments in financial
instruments, the Company diversifies its portfolio. Diversification of the portfolio is in
accordance with the limits set by the Company.
ii. The Company’s investments in financial instruments comprise foreign unlisted stocks.
The prices of financial instruments would change due to different valuation models and
assumptions used. Analysis related to the effect on profit or other comprehensive
income if these assumptions change is provided in Note 12(3)G.
234

Interest rate risk on cash flow and fair value
i. Interest rate risk is the risk that the fair value or future cash flows of a financial
instrument will fluctuate because of changes in market interest rates. The Company’s
exposure to the risk of changes in market interest rates relates primarily to the
Company’s bank loans with floating interest rates. The Company manages its interest
rate risk by having a balanced portfolio of fixed and variable rate bank loans. The
Company reassesses the hedge management periodically to make sure it complies with
the cost effectiveness.
ii. The sensitivity analysis depends on the exposure of interest rate risk at the end of the
reporting period.
iii. Analysis of debt with floating interest rates is based on the assumption that the
outstanding debt at the end of the reporting period is outstanding throughout the period.
The degree of variation the Company used to report to internal management is increase
or decrease of 1% in interest rates which is assessed as the reasonable degree of
variation by the management.
iv. For the years ended December 31, 2019 and 2018, it is estimated that a general increase
or decrease of 1% in interest rates, with all other variables held constant, would
decrease or increase the Company’s profit before tax approximately by $90,660 and
$98,220, respectively, mainly due to the Company’s floating rate on bank loans.
(b) Credit risk
i. Credit risk is the risk that a counterparty will not meet its obligations under a financial
instrument or customer contract, leading to a financial loss, mainly resulted from its
operating activities (primarily notes and accounts receivable) and from its financing
activities (primarily deposits with bank and financial instruments). The Company is
exposed to credit risk arising from the carrying amount of the financial assets recognized
in the parent company only balance sheet.
ii. Each business unit performs ongoing credit evaluations of its debtors’ financial conditions
according to the Company’s established policies, procedures and controls relating to
customer credit risk management. The Company maintains an account for loss allowance
based upon the available facts and circumstances, history of collection and write-off
experiences of all trade and other receivables which consequently minimize the
Company’s exposure to bad debts.
iii. Credit risk from balances with banks and financial institutions is managed by the
Company’s finance unit in accordance with the Company’s policies. Transaction
counterparty of the Company is determined through its internal controls policy. For banks
and financial institutions, only parties rated above BBB+ by Taiwan Ratings are accepted.
The probability of counterparty default is remote, so there is no significant credit risk.
iv. The Company adopts the assumptions under IFRS 9 “Financial Instruments” (“IFRS 9”)
and the default is deemed to have occurred when the contract payments are past due over
90 days.
235

v. The Company categorized contract assets, accounts receivable and other receivables by
characteristics of credit risk and applied the simplified approach using loss rate
methodology to estimate expected credit loss.
vi. The Company referred to the forecastability of business monitoring indicators published
by the National Development Council to adjust the loss rate which is based on historical
and current information when assessing the future default possibility of contract assets,
accounts receivable and other receivables. As of December 31, 2019 and 2018, the loss
rate methodologies are as follows:
December 31, 2019
Contract
assets
Accounts
receivable
(including
related parties)
Other
receivables
(including
related parties)
Expected loss rate 0.030% 0.030% 0.030%
Total carrying amount $ 377,983 $ 4,455,300 $ 92,618
Loss allowance ( $ 114 ) ( $ 1,351 ) ( $ 18 )
December 31, 2018
Contract
assets
Accounts
receivable
(including
related parties)
Other
receivables
(including
related parties)
Expected loss rate 0.045% 0.045% 0.045%
Total carrying amount $ 299,970 $ 4,747,974 $ 65,461
Loss allowance ( $ 135 ) ( $ 2,141 ) ( $ 13 )
vii. Under the simplified approach, movements in relation to loss allowance for contract
assets, accounts receivable, and other receivables are as follows:
2019
Contract
assets
Accounts
receivable
(including
related parties)
Other
receivables
(including
related parties)
January 1 ( $ 135 ) ( $ 2,141 ) ( $ 13 )
Provision for impairment loss - - ( 5 )
Reversal of impairment loss 21 790 -
December 31 ( $ 114 ) ( $ 1,351 ) ( $ 18 )
236

2018
Contract
assets
Accounts
receivable
(including
related parties)
Other
receivables
(including
related parties)
January 1_ IAS 39 $ - $ - $ -
Adjustments for applying new
standards ( 115 ) ( 1,819 ) ( 7 )
January 1_IFRS 9 ( 115 ) ( 1,819 ) ( 7 )
Provision for impairment loss ( 20 ) ( 322 ) ( 7 )
Reversal of impairment loss - - 1
December 31 ( $ 135 ) ( $ 2,141 ) ( $ 13 )
viii. For investments in debt instruments at amortized cost, the credit rating levels are
presented below:
December 31, 2019
By lifetime
12 months
Increase in
credit risk
Impairment
of credit Total
Financial assets at
amortized cost
Bank deposits (Note) $ 68,450 $ - $ - $ 68,450
December 31, 2018
By lifetime
12 months
Increase in
credit risk
Impairment
of credit Total
Financial assets at
amortized cost
Bank deposits (Note) $ 68,388 $ - $ - $ 68,388
Note: Restricted bank deposits.
(c) Liquidity risk
i. The Company manages and maintains adequate cash and cash equivalents to finance the
Company’s operations, and minimize the impact from cash flow fluctuations. The
Company also monitors its debt financing plans to ensure it is in compliance with the
financial covenants required under its loan agreements.
ii. The primary source of liquidity for the Company is from bank loans. See Note 6(12) for
details of the unused credit lines of the Company as of December 31, 2019 and 2018.
iii. The contractual undiscounted cash flows of accounts payable (including related parties)
and other payables (including related parties) are due within one year and are equivalent
to their carrying amounts. Except for the aforementioned, the table below summarizes the
maturity profile of the Company’s non-derivative financial liabilities based on the earliest
repayment dates and contractual undiscounted payments, including principal and interest.
The Company does not consider the probability of early repayments requested by the
banks.
237

December 31, 2019
Within Over
1 year 1 to 3 years 3 to 5 years 5 years Total
Non-derivative financial
liabilities
Long-term bank loans $ 914,159 $ 1,786,842 $ 6,848,327 $ - 9,549,328
Lease liabilities 31,370 60,111 57,836 762,699 912,016
Guarantee deposits - - - 1,095 1,095
$ 945,529 $ 1,846,953 $ 6,906,163 $ 763,794 $ 10,462,439
December 31, 2018
Within Over
1 year 1 to 3 years 3 to 5 years 5 years Total
Non-derivative financial
liabilities
Long-term bank loans $ 927,243 $ 1,814,344 $ 7,734,983 $ - $ 10,476,570
Lease obligations payable 18,000 - - - 18,000
Guarantee deposits - - - 1,092 1,092
$ 945,243 $ 1,814,344 $ 7,734,983 $ 1,092 $ 10,495,662
The difference between the floating interest rates and estimated interest rates will affect
the non-derivative financial liabilities stated above.
(3) Fair value information
A. The different levels of inputs used in valuation techniques to measure fair value of financial and
non-financial instruments are defined as follows:
Level 1: Quoted prices (unadjusted) in active markets for identical assets or liabilities that can
be accessed at the measurement date. An active market is a market in which trading for
the asset or liability take place with sufficient frequency and volume to provide pricing
information on an ongoing basis.
Level 2: Inputs other than quoted prices from Level 1 that are observable information for the
asset or liability, either directly or indirectly.
Level 3: Unobservable inputs for the asset or liability. The fair value of the Company’s
investment in equity investment without active market is included in Level 3.
B. The carrying amounts of cash and cash equivalents, contract assets, notes receivable, accounts
receivable, other receivables, other financial assets, refundable deposits, bank loans, contract
liabilities, accounts payable, other payables, lease liabilities and guarantee deposits are
approximate to their fair values.
C. The related information of financial and non-financial instruments measured at fair value by level
on the basis of the nature, characteristics and risks of the assets and liabilities are as follows:
(a) The related information of natures of the assets and liabilities is as follows:
238

December 31, 2019
Level 1 Level 2 Level 3 Total
Assets
Recurring fair value measurements
Financial assets at fair value through other comprehensive income
- Foreign unlisted stocks $ - $ - $ 121,808 $ 121,808
December 31, 2018
Level 1 Level 2 Level 3 Total
Assets
Recurring fair value measurements
Financial assets at fair value through other comprehensive income
- Foreign unlisted stocks $ - $ - $ 174,357 $ 174,357
(b) The methods and assumptions the Company used to measure fair value are as follows:
i. The fair value of the Company’s financial instruments is measured by using valuation
techniques or by reference to counterparty quotes. The fair value of financial instruments
measured by using valuation techniques can be referred to current fair value of instruments
with similar terms and characteristics in substance, discounted cash flow method or other
valuation methods, including calculated by applying model using market information
available at the consolidated balance sheet date.
ii. The Company’s financial assets at fair value through other comprehensive income is
measured by the comparable company valuation (EV/EBITDA ratio and P/B ratio).
iii. The Company takes into account adjustments for credit risks to measure the fair value of
financial and non-financial instruments to reflect credit risk of the counterparty and the
Company’s credit quality.
D. The following table shows the movements of Level 3 for the years ended December 31, 2019 and
2018:
Equity instruments
2019 2018
January 1 $ 174,357 $ -
Effects on initial application of IFRS 9 - 89,335
Gains or losses recognized in other comprehensive income
Recorded as unrealized (losses) gains on valuation of financial assets at fair value through other comprehensive income ( 52,549 ) 85,022
December 31 $ 121,808 $ 174,357
E. The Company engaged an external appraiser to perform the fair value measurements being
categorized within Level 3, and the accounting unit is in charge of valuation procedures to
independently verify the fair value of financial instruments. Such assessment is to ensure the
239

valuation results are reasonable by applying independent information to make results close to
current market conditions, confirming the resource of information is independent, reliable and in
line with other resources and represented as the exercisable price, and frequently calibrating
valuation model, performing back-testing, updating inputs used to the valuation model and
making any other necessary adjustments to the fair value.
F. The following is the qualitative information and sensitivity analysis of changes in significant
unobservable inputs under valuation model used in Level 3 fair value measurement:
Fair value as of
December 31,
2019
Valuation
technique
Significant
unobservable input
Range
(weighted
average method)
Relationship of
inputs to fair value
Non-derivative
equity instrument:
Foreign unlisted
stocks
$ 121,808 Comparable
companies
Price to book ratio
multiple
1.22 The higher the
multiple, the higher the
fair value
Enterprise value to
EBITDA multiple
10.51 The higher the
multiple, the higher the
fair value
Discount for lack of
marketability
15.80% The higher the
discount for lack of
marketability, the lower
the fair value
Fair value as of
December 31,
2018
Valuation
technique
Significant
unobservable input
Range
(weighted
average method)
Relationship of
inputs to fair value
Non-derivative
equity instrument:
Foreign unlisted
stocks
$ 174,357 Comparable
companies
Price to book ratio
multiple
1.19 The higher the
multiple, the higher the
fair value
Enterprise value to
EBITDA multiple
7.69 The higher the
multiple, the higher the
fair value
Discount for lack of
marketability
15.80% The higher the
discount for lack of
marketability, the lower
the fair value
G. The Company has carefully assessed the valuation models and assumptions used to measure fair
value. However, use of different valuation models or assumptions may result in different
measurement. The following is the effect of profit or loss or of other comprehensive income from
financial assets categorized within Level 3 if the inputs used to valuation models have changed:
240

December 31, 2019
Recognized in
profit or loss
Recognized in other
comprehensive income
Input Change
Favorable
change
Unfavorable
change
Favorable
change
Unfavorable
change
Financial assets
Foreign unlisted stocks Price to book ratio
multiple ± 1% $ - $ - $ 53 $ 53
Enterprise value to
EBITDA multiple ± 1% - - 850 900
Discount for lack of
marketability ± 1% - - 1,460 1,460
$ - $ - $ 2,363 $ 2,413
December 31, 2018
Recognized in
profit or loss
Recognized in other
comprehensive income
Input Change
Favorable
change
Unfavorable
change
Favorable
change
Unfavorable
change
Financial assets
Foreign unlisted stocks Price to book ratio
multiple ± 1% $ - $ - $ 69 $ 68
Enterprise value to
EBITDA multiple ± 1% - - 1,563 1,512
Discount for lack of
marketability ± 1% - - 2,093 2,050
$ - $ - $ 3,725 $ 3,630
241

13.
SU
PP
LE
ME
NT
AR
Y D
ISC
LO
SU
RE
S
(1)
Sig
nif
ican
t tr
ansa
ctio
ns
info
rmat
ion
A.
Fin
anci
ngs
pro
vid
ed:
No
ne.
B.
Endors
emen
ts a
nd
gu
aran
tees
pro
vid
ed:
Ther
e w
ere
no e
ndors
emen
ts a
nd g
uar
ante
es p
rovid
ed b
y t
he
Co
mp
any.
Fo
r in
form
atio
n r
elat
ed t
o t
he
Com
pan
y’s
let
ter
of
guar
ante
e fo
r duty
, ple
ase
refe
r to
No
te 9
(1).
C.
Mar
ket
able
sec
uri
ties
hel
d a
t th
e en
d o
f th
e p
erio
d (
excl
udin
g i
nves
tmen
ts i
n s
ubsi
dia
ries
, as
soci
ates
an
d j
oin
t v
entu
res)
:
As
of
Dec
emb
er 3
1, 2
01
9
Hel
d c
om
pan
y n
am
e
Mar
ket
able
sec
uri
ties
typ
e an
d n
am
e
Rel
atio
nsh
ip w
ith
the
com
pan
y
Gen
eral
led
ger
acc
ou
nt
Nu
mb
er o
f sh
ares
Car
ryin
g
am
ou
nt
Ow
ner
ship
(%)
Fai
r val
ue
No
te
The
Co
mp
an
y
RY
OW
A C
O.,
LT
D.
N/A
F
inanci
al a
sset
s at
fai
r valu
e
thro
ugh o
ther
co
mp
rehen
sive
inco
me
42
0
$1
16
,72
6
18
.12
$
11
6,7
26
The
Co
mp
an
y
CO
NN
EC
TE
C J
AP
AN
Co
rpo
rati
on
N/A
F
inanci
al a
sset
s at
fai
r valu
e
thro
ugh o
ther
co
mp
rehen
sive
inco
me
56
,497
5,0
82
2
.74
5,0
82
Chip
MO
S B
VI
Shang
hai
Zuzh
u B
usi
ness
Co
nsu
ltin
g P
artn
ersh
ip (
Lim
ited
Par
tner
ship
) (“
Zuzh
u”)
N/A
F
inanci
al a
sset
s at
fai
r valu
e
thro
ugh p
rofi
t o
r lo
ss
-
4
,49
2
5.1
0
4,4
92
Chip
MO
S B
VI
Shang
hai
Zuzh
an B
usi
ness
Co
nsu
ltin
g P
artn
ersh
ip (
Lim
ited
Par
tner
ship
) (“
Zuzhan”)
N/A
F
inanci
al a
sset
s at
fai
r valu
e
thro
ugh p
rofi
t o
r lo
ss
-
2
,21
9
13
.42
2,2
19
Chip
MO
S B
VI
Shang
hai
Zuch
en B
usi
ness
Co
nsu
ltin
g P
artn
ersh
ip (
Lim
ited
Par
tner
ship
) (“
Zuchen”)
N/A
F
inanci
al a
sset
s at
fai
r valu
e
thro
ugh p
rofi
t o
r lo
ss
-
2
,16
4
11
.34
2,1
64
Chip
MO
S B
VI
Shang
hai
Guiz
ao B
usi
nes
s
Co
nsu
ltin
g P
artn
ersh
ip (
Lim
ited
Par
tner
ship
) (“
Guiz
ao”)
N/A
F
inanci
al a
sset
s at
fai
r valu
e
thro
ugh p
rofi
t o
r lo
ss
-
2
,16
3
11
.85
2,1
63
242

D. M
arket
able
sec
uri
ties
acq
uir
ed o
r dis
pose
d o
f w
ith
acc
um
ula
ted a
mount
exce
edin
g t
he
low
er o
f $300
mil
lion o
r 20%
of
the
pai
d-i
n c
apit
al:
Bal
ance
as
of
Jan
uar
y 1
, 2
01
9
Acq
uis
itio
n
Dis
po
sal
Bal
ance
as
of
Dec
emb
er 3
1,
20
19
Inves
tor
Mar
ket
able
secu
riti
es
typ
e
and
nam
e
Gen
eral
led
ger
acco
un
t C
ou
nte
rpar
ty
Rel
atio
nsh
ip
wit
h
the
inves
tee
Nu
mb
er o
f
shar
es/u
nit
s
(in
th
ou
san
ds)
A
mo
un
t
Nu
mb
er o
f
shar
es/u
nit
s
(in
th
ou
san
ds)
A
mo
un
t
Nu
mb
er o
f
shar
es/u
nit
s
(in
th
ou
san
ds)
Sel
lin
g
pri
ce
Bo
ok
val
ue
Gai
n o
n
dis
po
sal
Nu
mb
er o
f
shar
es/u
nit
s
(in
th
ou
san
ds)
A
mo
un
t
Th
e
Co
mp
any
Tai
shin
169
9
Mo
ney
Mar
ket
Fu
nd
No
te
N/A
N
/A
- $
-
73
,891 $
1,0
00
,00
0
73
,891 $
1,0
00
,72
9 $
1,0
00
,00
0 $
7
29
- $
-
Th
e
Co
mp
any
Un
ion
Mo
ney
Mar
ket
Fu
nd
No
te
N/A
N
/A
- -
45
,417
60
0,0
00
45
,417
60
0,2
31
60
0,0
00
2
31
-
-
Th
e
Co
mp
any
UP
AM
C
Jam
es B
on
d
Mo
ney
Mar
ket
Fu
nd
No
te
N/A
N
/A
- -
17
,949
30
0,0
00
17
,949
30
0,1
83
30
0,0
00
18
3
- -
Th
e
Co
mp
any
JMC
Inves
tmen
ts
acco
un
ted
for
usi
ng
equ
ity
met
ho
d
N/A
N
/A
19
,100
40
6,7
92
- -
9
,10
0
1,1
80
,179
20
6,5
69
9
81,6
75
10
,000
24
9,7
93
Note
: A
ccounte
d f
or
as “
Fin
anci
al a
sset
s at
fai
r val
ue
thro
ugh p
rofi
t or
loss
”.
E. A
cquis
itio
n o
f re
al e
stat
e pro
per
ties
wit
h a
mount
exce
edin
g t
he
low
er o
f $3
00 m
illi
on o
r 20%
of
the
pai
d-i
n c
apit
al:
None.
F. D
isposa
l of
real
est
ate
pro
per
ties
wit
h a
mount
exce
edin
g t
he
low
er o
f $300
mil
lion o
r 20%
of
pai
d-i
n c
apit
al:
None.
G. P
urc
has
es f
rom
or
sale
s to
rel
ated
par
ties
wit
h a
mount
exce
edin
g t
he
low
er o
f $100 m
illi
on o
r 20%
of
pai
d-i
n c
apit
al o
r m
ore
: N
one.
H. R
ecei
vab
les
from
rel
ated
par
ties
wit
h a
mount
exce
edin
g t
he
low
er o
f $100
mil
lion o
r 20%
of
pai
d-i
n c
apit
al o
r m
ore
: N
on
e.
I. T
radin
g i
n d
eriv
ativ
e in
stru
men
ts u
nder
taken
du
ring t
he
report
ing p
erio
ds:
None.
243

J. S
ignif
ican
t in
ter-
com
pan
y t
ransa
ctio
ns
duri
ng t
he
report
ing p
erio
ds:
T
ransa
ctio
n
Num
ber
C
om
pan
y n
am
e
Counte
rpar
ty
Rel
atio
nsh
ip
Gen
eral
led
ger
acc
ount
Am
ount
Tra
nsa
ctio
n
term
s
Per
centa
ge
of
conso
lidat
ed t
ota
l
reven
ues
or
tota
l
asse
ts (
%)
0
T
he
Com
pan
y
C
hip
MO
S U
SA
Note
S
ervic
e ex
pen
se
$ 32,8
26
- 0.1
6
Note
: R
epre
sents
the
tran
sact
ions
from
par
ent
com
pan
y t
o s
ubsi
dia
ry.
(2)
Info
rmat
ion o
n i
nves
tees
Nam
es, lo
cati
ons
and r
elat
ed i
nfo
rmat
ion o
f in
ves
tees
(ex
cludin
g i
nfo
rmat
ion o
n i
nves
tmen
ts i
n t
he
P.R
.C.)
:
Ori
gin
al i
nves
tmen
t am
ou
nt
Sh
ares
hel
d a
s of
Dec
emb
er 3
1, 2
019
Net
pro
fit
(loss
) of
the
inves
tee
for
the
yea
r
end
ed D
ecem
ber
3
1, 2
019
Inves
tmen
t in
com
e
(loss
) re
cogn
ized
for
the
yea
r en
ded
D
ecem
ber
31
, 20
19
Note
In
ves
tor
Inves
tee
Loca
tion
Mai
n b
usi
nes
s ac
tivit
ies
End
ing
bal
ance
B
egin
nin
g
bal
ance
N
um
ber
of
shar
es
Ow
ner
ship
(%
) C
arry
ing
amoun
t
Th
e C
om
pan
y
Chip
MO
S U
SA
S
an J
ose
, U
SA
Res
earc
h, d
evel
op
men
t an
d m
ark
etin
g
of
sem
icon
du
ctors
, ci
rcu
its,
ele
ctro
nic
re
late
d p
rod
uct
s $
2
17
,91
8
$
217
,918
3,5
50
,00
0
100
$
235
,742
$
4
,26
7
$
4,2
67
Th
e C
om
pan
y
JMC
K
aoh
siu
ng,
Tai
wan
Man
ufa
ctu
rin
g, p
roce
ssin
g a
nd t
radin
g
of
hig
h-e
nd
fle
xib
le I
C s
ub
stra
tes
for
dis
pla
y d
river
IC
s 1
65
,00
7
315
,16
4
10,0
00
,000
10
249
,79
3
524
,34
7
63,8
38
Note
Th
e C
om
pan
y
Chip
MO
S B
VI
Bri
tish
Vir
gin
Isla
nd
s H
old
ing c
om
pan
y
3,0
72
,71
2
3,0
72
,71
2
2,4
07
,74
2,9
75
100
3,1
75
,04
0
( 2
19
,69
2)
( 2
19
,69
2)
Note
: C
om
pan
y’s
ass
oci
ate
acco
unte
d f
or
usi
ng e
qu
ity m
eth
od.
244

(3)
Info
rmat
ion o
n i
nves
tmen
ts i
n t
he
P.R
.C.
A. B
asic
info
rmat
ion:
Inves
tee
in
P.R
.C.
M
ain b
usi
nes
s
acti
vit
ies
Paid
-in c
apit
al
Inves
tment
met
ho
d
Acc
um
ula
ted
am
ou
nt
of
rem
itta
nce
fro
m
Taiw
an t
o
P.R
.C.a
s o
f
Jan
uar
y 1
, 2
01
9
Am
ou
nt
rem
itte
d f
rom
Taiw
an t
o
P.R
.C./
Am
ou
nt
rem
itte
d b
ack
to
Taiw
an f
or
the
yea
r end
ed
Dec
em
ber
31
, 2
01
9
Acc
um
ula
ted
am
ou
nt
of
rem
itta
nce
fro
m
Taiw
an t
o P
.R.C
. as
of
Dec
em
ber
31
,
20
19
Net
lo
ss o
f
inves
tee
for
the
yea
r end
ed
Dec
em
ber
31
,
20
19
Ow
ners
hip
(%)
held
by t
he
Co
mp
an
y
(dir
ectl
y
or
ind
irec
tly
)
Inves
tment
loss
rec
og
niz
ed
for
the
yea
r
end
ed D
ecem
ber
31
, 2
01
9
Car
ryin
g
am
ou
nt
of
inves
tments
in
P.R
.C. as
of
Dec
em
ber
31
, 2
01
9
Acc
um
ula
ted
am
ou
nt
of
invest
ment
inco
me
rem
itte
d b
ack
to
Taiw
an
thro
ug
h
Dec
em
ber
31,
20
19
N
ote
Rem
itte
d t
o
P.R
.C.
R
emit
ted
bac
k
to T
aiw
an
Un
imo
s
Shan
ghai
Sem
ico
nd
ucto
r
asse
mb
lin
g a
nd
tes
tin
g
serv
ices
$
1
0,8
17
,19
1
No
te 1
$
2
,88
5,5
86
$
- $
- $
2,8
85
,58
6
($
3
52
,00
8)
45
.02
($
21
8,7
64
) $
3,1
43
,11
7
$
-
No
te 2
Zuzh
u
Busi
nes
s co
nsu
ltin
g
serv
ices
8
7,1
39
N
ote
1
- -
- -
(
2)
5.1
0
- 4
,49
2
-
Zuzhan
B
usi
nes
s co
nsu
ltin
g
serv
ices
1
6,6
06
N
ote
1
- -
- -
( 1
) 1
3.4
2-
2,2
19
-
Zuchen
B
usi
nes
s co
nsu
ltin
g
serv
ices
1
9,6
73
N
ote
1
- -
- -
( 1
) 1
1.3
4-
2,1
64
-
Gu
izao
B
usi
nes
s co
nsu
ltin
g
serv
ices
1
8,8
10
N
ote
1
- -
- -
( 1
) 1
1.8
5-
2,1
63
-
No
te 1
: T
hro
ug
h i
nv
esti
ng i
n a
n e
xis
tin
g c
om
pan
y (
Ch
ipM
OS
BV
I) i
n t
he
thir
d a
rea,
wh
ich t
hen i
nves
ted
in t
he
inves
tee
in P
.R.C
..
No
te 2
: T
he
financia
l st
atem
ents
that
are
aud
ited
by
the
Co
mp
an
y’s
in
dep
end
ent
acco
unta
nts
.
Co
mp
an
y
nam
e
Acc
um
ula
ted
am
ou
nt
of
rem
itta
nce
fro
m
Taiw
an t
o P
.R.C
.
as o
f D
ecem
ber
31
,
20
19
Inves
tment
am
ou
nt
app
roved
by t
he
Inves
tment
Co
mm
issi
on o
f
MO
EA
Lim
it o
n i
nv
estm
ents
in P
.R.C
. im
po
sed
by
the
Inv
estm
ent
Co
mm
issi
on o
f
MO
EA
The
Co
mp
an
y
$
2
,88
5,5
86
$
2,8
85
,58
6
$
1
1,7
90
,74
3
B. S
ignif
ican
t tr
ansa
ctio
ns,
eit
her
dir
ectl
y o
r in
dir
ectl
y t
hro
ugh a
thir
d a
rea,
wit
h i
nves
tee
com
pan
ies
in t
he
P.R
.C.:
None.
245

ChipMOS TECHNOLOGIES INC.
STATEMENT OF CASH AND CASH EQUIVALENTS
DECEMBER 31, 2019
(In Thousands of New Taiwan Dollars)
Item Description Amount
Cash on hand and petty cash $ 470
Bank savings:
Checking accounts 920
Demand deposits 355,885
Demand deposits – foreign currencies USD 13,071 thousand, exchange rate 29.980 473,610
JPY 261,067 thousand, exchange rate 0.276
RMB 2,252 thousand, exchange rate 4.305
Time deposits Interest rates: 0.09%~2.35% 3,788,480
$ 4,619,365
246
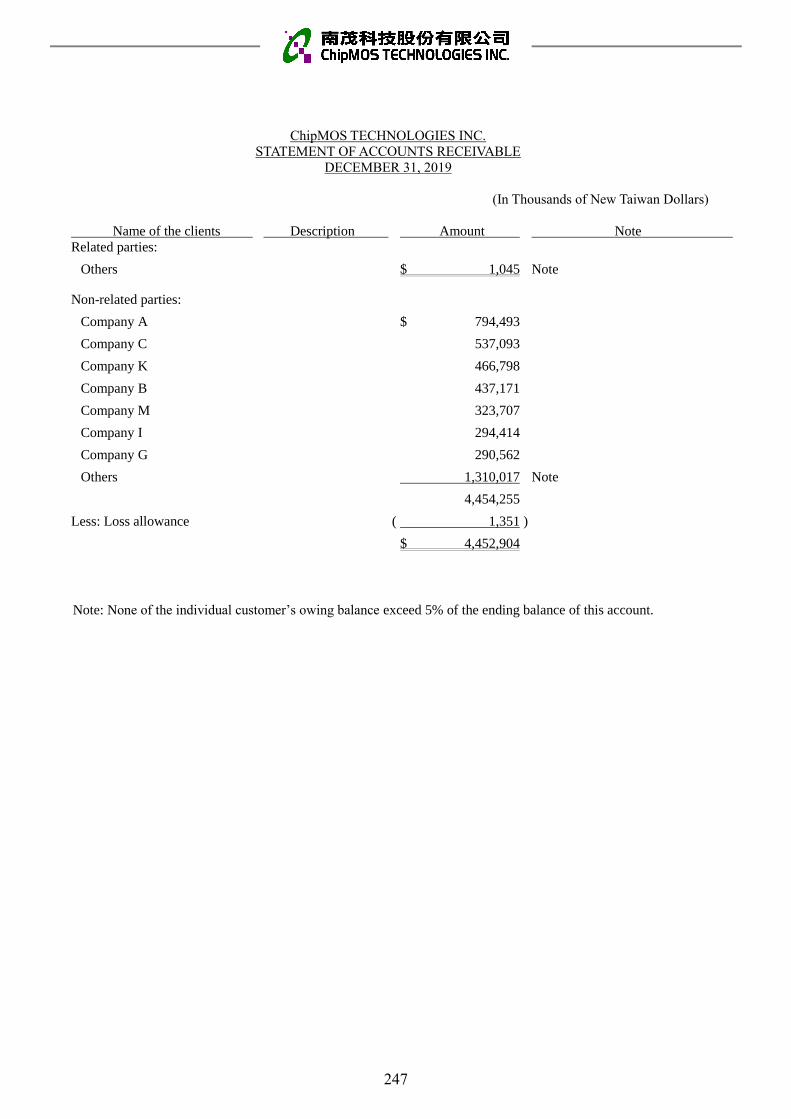
ChipMOS TECHNOLOGIES INC.
STATEMENT OF ACCOUNTS RECEIVABLE
DECEMBER 31, 2019
(In Thousands of New Taiwan Dollars)
Name of the clients Description Amount Note
Related parties:
Others $ 1,045 Note
Non-related parties:
Company A $ 794,493
Company C 537,093
Company K 466,798
Company B 437,171
Company M 323,707
Company I 294,414
Company G 290,562
Others 1,310,017 Note
4,454,255
Less: Loss allowance ( 1,351 )
$ 4,452,904
Note: None of the individual customer’s owing balance exceed 5% of the ending balance of this account.
247

ChipMOS TECHNOLOGIES INC.
STATEMENT OF INVENTORIES
DECEMBER 31, 2019
(In Thousands of New Taiwan Dollars)
Amount
Item Description Cost Net realizable value Note
Raw material $ 1,831,140 $ 1,807,100
Less: Allowance for
impairment losses ( 63,498 )
Inventories, net $ 1,767,642
248

Ch
ipM
OS
TE
CH
NO
LO
GIE
S I
NC
. S
TA
TE
ME
NT
OF
CH
AN
GE
S I
N I
NV
ES
TM
EN
TS
AC
CO
UN
TE
D F
OR
US
ING
EQ
UIT
Y M
ET
HO
D
YE
AR
EN
DE
D D
EC
EM
BE
R 3
1, 201
9
(In T
ho
usa
nd
s o
f N
ew T
aiw
an D
oll
ars)
Oth
er a
dju
stm
ents
B
alance
as
of
Jan
uary
1,
20
19
In
crea
ses
(Note
1)
Dec
reas
es (
Note
2)
(N
ote
3)
B
alance
as
of
Dec
em
ber
31
, 2
01
9
Mar
ket
pri
ce o
r eq
uit
y
N
am
e
Shar
es
(in t
ho
usa
nd
s)
Am
ou
nt
Shar
es
(i
n t
ho
usa
nds)
A
mo
unt
Shar
es
(i
n t
ho
usa
nds)
A
mo
unt
A
mo
unt
Shar
es
(i
n t
ho
usa
nd
s)
Per
centa
ge
of
ow
ner
ship
A
mo
un
t U
nit
Pri
ce
T
ota
l p
rice
Co
llate
ral
o
r p
led
ge
N
ote
JMC
1
9,1
00
$
4
06
,79
2
- $
63,8
38
(
9,1
00
) ($
226,5
69
) $
5,7
32
1
0,0
00
1
0%
$
2
49
,79
3
$
80
.70
$
8
07
,00
0
No
ne
Ch
ipM
OS
BV
I 2
,40
7,7
43
3
,48
9,7
99
-
3,3
24
-
( 219,6
92
) (
98,3
91
) 2
,40
7,7
43
1
00
%
3,1
75
,04
0
1.3
2
3,1
75
,04
0
No
ne
Ch
ipM
OS
US
A
3,5
50
2
37
,28
2
- 4,2
67
-
- (
5,8
07
) 3
,55
0
10
0%
2
35
,74
2
66
.41
2
35
,74
2
No
ne
$
4,1
33
,87
3
$
71,4
29
($
446,2
61
) ($
98,4
66
) $
3
,66
0,5
75
No
te 1
: In
clu
des
incre
ase
in s
har
e o
f p
rofi
t o
f su
bsi
dia
ries
and
ass
oci
ate
s o
f $
68,1
05
and a
mo
rtiz
atio
n o
f dow
nst
ream
tra
nsa
ctio
ns
of
$3,3
24.
No
te 2
: In
clu
des
dec
reas
e in
share
of
loss
of
sub
sid
iari
es a
nd
ass
oci
ates
of
$219,6
92
, ca
sh d
ivid
end p
aid
by J
MC
of
$2
0,0
00,
and t
he
dis
po
sal
of
JMC
$206,5
69
.
No
te 3
: In
clu
des
un
reali
zed
gain
s o
n f
inancia
l as
sets
at
fair
valu
e th
rou
gh o
ther
co
mp
rehensi
ve i
nco
me o
f $5,5
40
, ad
just
ments
of
exchange
dif
fere
nce
s fr
om
tra
nsl
atio
n o
f fo
reig
n o
per
atio
ns
of
($1
04
,19
8),
and
rec
og
nit
ion o
f re
mea
sure
ments
of
defi
ned
benefi
t p
lans
of
$1
92
.
249

Chip
MO
S T
EC
HN
OL
OG
IES
IN
C.
ST
AT
EM
EN
T O
F C
HA
NG
ES
IN
PR
OP
ER
TY
, P
LA
NT
AN
D E
QU
IPM
EN
T
YE
AR
EN
DE
D D
EC
EM
BE
R 3
1, 201
9
(In
Th
ou
san
ds
of
New
Tai
wan
Do
llar
s)
Bal
ance
as
of
Eff
ects
on i
nit
ial
app
lica
tio
n
Ad
just
ed
bal
ance
B
alan
ce a
s o
f
Item
Ja
nuar
y 1
, 2
01
9
of
IFR
S 1
6
at J
anuar
y 1
A
dd
itio
ns
Dis
po
sals
R
ecla
ssif
icat
ion
s D
ecem
ber
31
, 2
01
9
Co
llat
eral
Co
st
Land
$
4
52
,73
8
$
- $
4
52
,73
8
$
- $
-
$
- $
4
52
,73
8
See
No
te 8
Buil
din
gs
10
,254
,53
1
- 1
0,2
54
,53
1
11
6,2
38
(
4,5
89 )
45
5,7
92
10
,821
,97
2
See
No
te 8
Mac
hin
ery a
nd
eq
uip
ment
48
,270
,02
3
- 4
8,2
70
,02
3
2,3
34,3
11
(
83
1,3
18 )
1,4
67,4
01
5
1,2
40
,41
7
See
No
te 8
Too
ls
4,4
02,7
11
-
4,4
02,7
11
7
81
,46
5
( 2
05
,93
2 )
30
,077
5,0
08,3
21
N
one
Oth
ers
2,6
05,4
94
( 4
4,4
52 )
2,5
61,0
42
2
24
,28
7
( 5
01
,06
5 )
( 3
51
,77
9 )
1,9
32,4
85
N
one
Co
nst
ruct
ion i
n p
rogre
ss
and
eq
uip
ment
to b
e
insp
ecte
d
1,0
69,8
92
-
1,0
69,8
92
1
,44
0,3
08
-
( 1
,57
3,8
11
) 9
36
,38
9
No
ne
67
,055
,38
9
( $
44
,45
2 )
67
,010
,93
7
$
4,8
96,6
09
( $
1
,542
,90
4 )
$
27
,680
7
0,3
92
,32
2
Acc
um
ula
ted
dep
reci
atio
n
Buil
din
gs
(
6,3
45,8
00
) $
-
( 6
,34
5,8
00
) (
38
4,8
32
) $
4
,58
9
$
- (
6,7
26,0
43
)
Mac
hin
ery a
nd
eq
uip
ment
( 3
7,9
28
,95
6 )
- (
37
,928
,95
6 )
( 2
,48
8,8
51
) 8
15
,28
5
( 2
81
,66
9 )
( 3
9,8
84
,19
1 )
Too
ls
( 3
,66
0,5
32
) -
( 3
,66
0,5
32
) (
62
5,7
12
) 1
96
,59
6
( 2
2,1
97 )
( 4
,11
1,8
45
)
Oth
ers
( 1
,98
3,8
95
) 1
2,5
48
( 1
,97
1,3
47
) (
19
5,8
69 )
3
66
,45
8
30
2,8
04
(
1,4
97,9
54
)
( 4
9,9
19
,18
3 )
$
12
,548
( 4
9,9
06
,63
5 )
( $
3,6
95
,26
4 )
$
1,3
82,9
28
( $
1
,062 )
( 5
2,2
20
,03
3 )
Acc
um
ula
ted
im
pai
rment
Mac
hin
ery a
nd
eq
uip
ment
( 1
09
,38
5 )
$
- (
10
9,3
85 )
( $
9,9
38 )
$
- ( $
7
4,0
17 )
19
3,3
40
Oth
ers
( 2
08
,20
8 )
- (
20
8,2
08 )
- 1
34
,19
1
74
,017
-
( 3
17
,59
3 )
$
- (
31
7,5
93 )
( $
9,9
38 )
$
13
4,1
91
$
- 1
93
,34
0
Car
ryin
g a
mo
unt
$
16
,818
,61
3
$
$1
6,7
86
,70
9
$
$1
7,9
78
,94
9
250

Chip
MO
S T
EC
HN
OL
OG
IES
IN
C.
LO
NG
-TE
RM
BA
NK
LO
AN
S
DE
CE
MB
ER
31, 201
9
(In T
ho
usa
nd
s o
f N
ew
Tai
wan
Do
llar
s)
Cre
dit
or
Des
crip
tio
n
A
mount
Per
iod
Ran
ge
of
inte
rest
rat
e
C
oll
ater
al
Note
Tai
wan
Cooper
ativ
e
Ban
k a
nd
oth
ers
Syndic
ated
ban
k l
oan
s $
9,0
66,0
00
May
30, 2018 ~
May
30, 2023
1.7
895%
S
ee N
ote
8
Les
s: F
ee o
n s
yndic
ated
ban
k l
oan
(
24,3
55)
Curr
ent
port
ion (
fee
incl
uded
) (
748,4
19)
$
8,2
93,2
26
251

ChipMOS TECHNOLOGIES INC.
STATEMENT OF REVENUE
YEAR ENDED DECEMBER 31, 2019
(In Thousands of New Taiwan Dollars)
Item
Quantity
(in thousands) Amount Note
Testing
Memory 2,067,591 $ 3,321,894
Logic/mixed-signal 369,330 969,743
Total testing $ 4,291,637
Assembly
Memory 1,177,469 4,178,709
Logic/mixed-signal 1,569,330 997,375
Total assembly $ 5,176,084
LCDD
Total LCDD 1,867,681 $ 6,940,923
Bumping
Total bumping 1,313 $ 4,018,976
Less: Sales allowance ( 89,739)
Net revenue $ 20,337,881
252
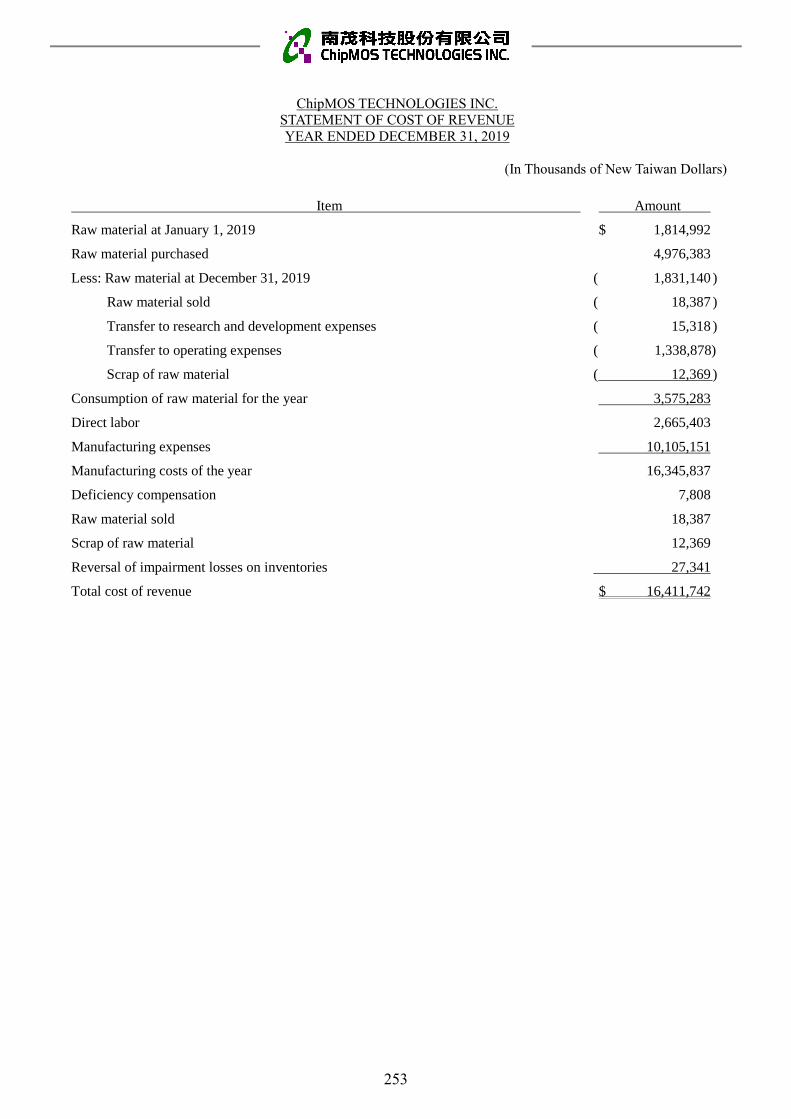
ChipMOS TECHNOLOGIES INC.
STATEMENT OF COST OF REVENUE
YEAR ENDED DECEMBER 31, 2019
(In Thousands of New Taiwan Dollars)
Item Amount
Raw material at January 1, 2019 $ 1,814,992
Raw material purchased 4,976,383
Less: Raw material at December 31, 2019 ( 1,831,140 )
Raw material sold ( 18,387 )
Transfer to research and development expenses ( 15,318 )
Transfer to operating expenses ( 1,338,878)
Scrap of raw material ( 12,369 )
Consumption of raw material for the year 3,575,283
Direct labor 2,665,403
Manufacturing expenses 10,105,151
Manufacturing costs of the year 16,345,837
Deficiency compensation 7,808
Raw material sold 18,387
Scrap of raw material 12,369
Reversal of impairment losses on inventories 27,341
Total cost of revenue $ 16,411,742
253

ChipMOS TECHNOLOGIES INC.
STATEMENT OF OPERATING EXPENSES
YEAR ENDED DECEMBER 31, 2019
(In Thousands of New Taiwan Dollars)
Item Amount Note
Sales and marketing expenses
Salaries and wages $ 33,338
Services fees 32,826
Others 22,738
None of the individual item
exceeds 5% of this account
$ 88,902
General and administrative expenses
Salaries and wages $ 282,853
Professional service expenses 52,262
Insurance fees 26,720
Others 105,529
None of the individual item
exceeds 5% of this account
$ 467,364
Research and development expenses
Salaries and wages $ 750,370
Insurance fees 61,050
Others 196,211
None of the individual item
exceeds 5% of this account
$ 1,007,631
254
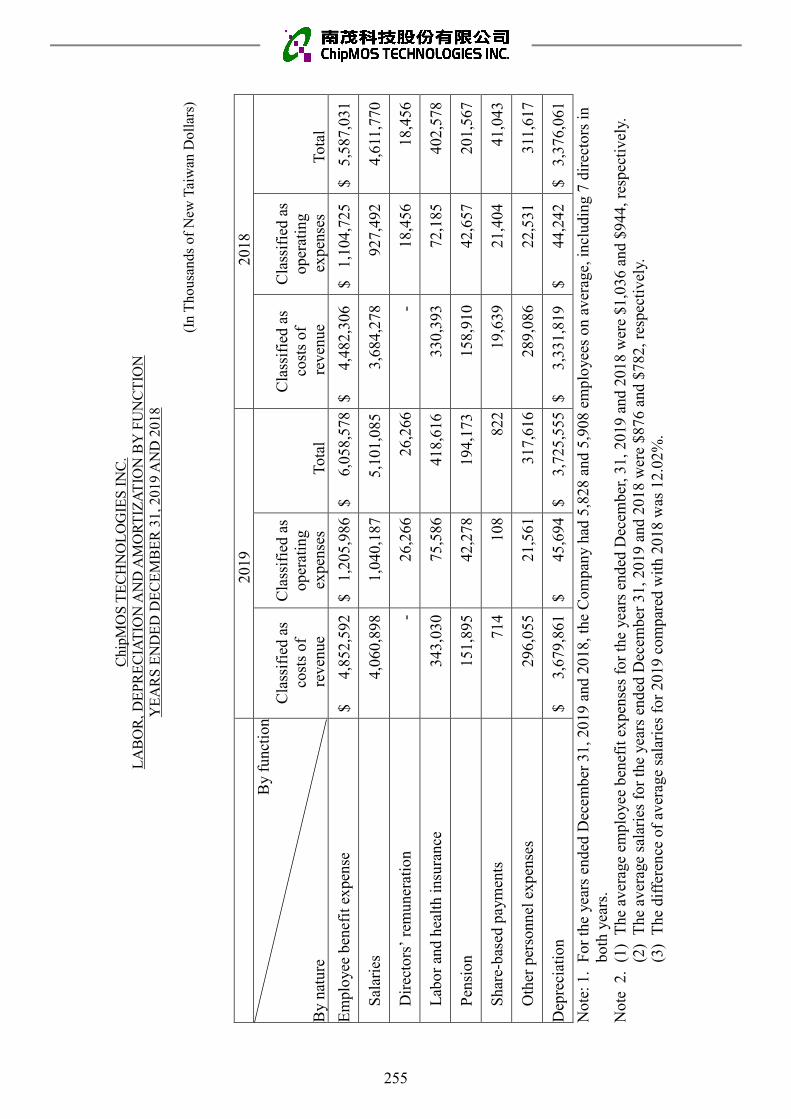
Ch
ipM
OS
TE
CH
NO
LO
GIE
S I
NC
.
LA
BO
R,
DE
PR
EC
IAT
ION
AN
D A
MO
RT
IZA
TIO
N B
Y F
UN
CT
ION
YE
AR
S E
ND
ED
DE
CE
MB
ER
31
, 2
01
9 A
ND
20
18
(In
Th
ou
san
ds
of
New
Tai
wan
Do
llar
s)
2019
201
8
By f
unct
ion
By n
ature
Cla
ssif
ied a
s
cost
s of
re
ven
ue
Cla
ssif
ied a
s
oper
atin
g
ex
pen
ses
Tota
l
Cla
ssif
ied a
s
cost
s of
re
ven
ue
Cla
ssif
ied a
s
oper
atin
g
ex
pen
ses
T
ota
l
Em
plo
yee
ben
efit
ex
pen
se
$
4,8
52,5
92
$
1,2
05,9
86
$
6,0
58,5
78
$
4,4
82,3
06
$ 1
,104,7
25
$ 5
,587,0
31
S
alar
ies
4,0
60,8
98
1,0
40,1
87
5,1
01,0
85
3,6
84,2
78
927,4
92
4,6
11,7
70
D
irec
tors
’ re
muner
atio
n
- 26,2
66
26,2
66
- 18,4
56
18,4
56
Lab
or
and h
ealt
h i
nsu
rance
343,0
30
75,5
86
418,6
16
330,3
93
72,1
85
402,5
78
P
ensi
on
151,8
95
42,2
78
194,1
73
158,9
10
42,6
57
201,5
67
S
har
e-bas
ed p
aym
ents
714
108
822
19,6
39
21,4
04
41,0
43
O
ther
per
sonn
el e
xpen
ses
296,0
55
21,5
61
317,6
16
289,0
86
22,5
31
311,6
17
Dep
reci
atio
n
$
3,6
79,8
61
$
45,6
94
$
3,7
25,5
55
$
3,3
31,8
19
$
44,2
42
$
3,3
76,0
61
Note
: 1.
For
the
yea
rs e
nded
Dec
ember
31,
2019 a
nd 2
018,
the
Com
pan
y h
ad 5
,828
and 5
,908 e
mplo
yee
s on a
ver
age,
incl
udin
g 7
dir
ecto
rs i
n
both
yea
rs.
Note
2.
(1)
The
aver
age
emplo
yee
ben
efit
ex
pen
ses
for
the
year
s en
ded
Dec
ember
, 31,
2019 a
nd 2
018 w
ere
$1,0
36 a
nd $
94
4, re
spec
tivel
y.
(2)
The
aver
age
sala
ries
for
the
yea
rs e
nded
Dec
ember
31, 2019 a
nd 2
018 w
ere
$876 a
nd $
782, re
spec
tivel
y.
(3)
The
dif
fere
nce
of
aver
age
sala
ries
for
2019 c
om
par
ed w
ith
2018 w
as 1
2.0
2%
.
255

VI. Explanations Regarding Impacts on Company's Financial Status in the Event that the Company
or its Affiliates Have Financial Difficulties: None.
256
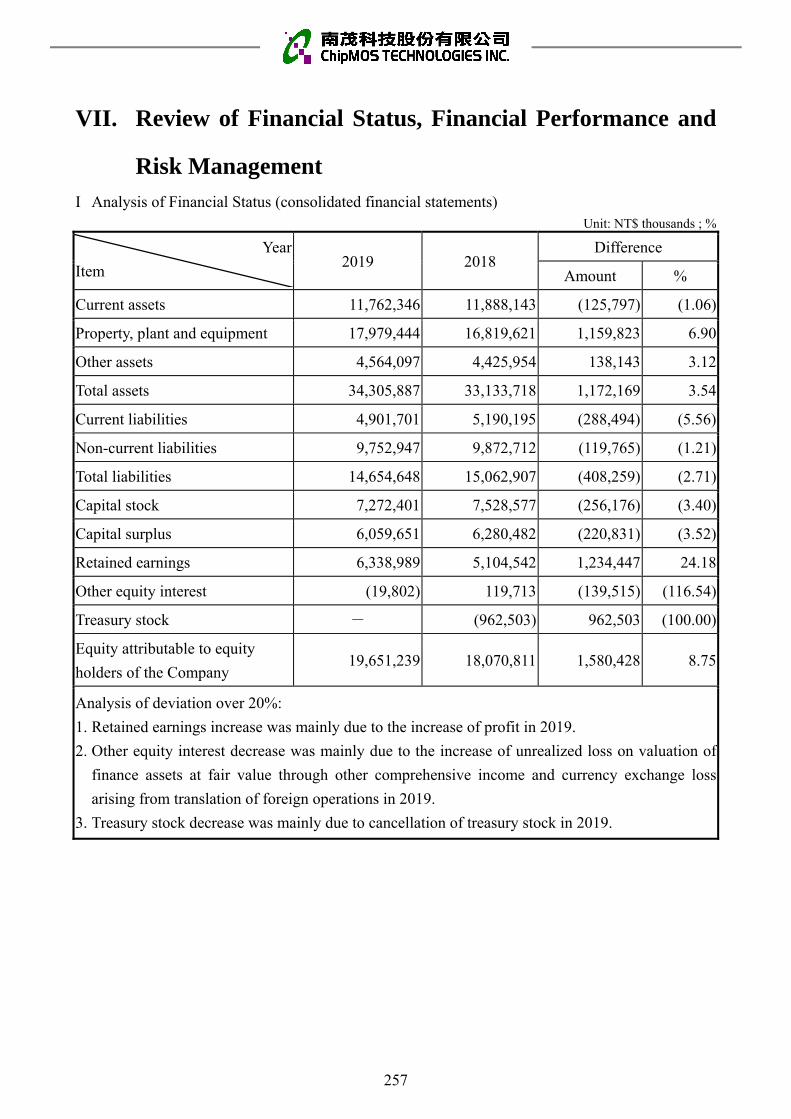
VII. Review of Financial Status, Financial Performance and
Risk Management I Analysis of Financial Status (consolidated financial statements)
Unit: NT$ thousands ; %
Year
Item 2019 2018
Difference
Amount %
Current assets 11,762,346 11,888,143 (125,797) (1.06)
Property, plant and equipment 17,979,444 16,819,621 1,159,823 6.90
Other assets 4,564,097 4,425,954 138,143 3.12
Total assets 34,305,887 33,133,718 1,172,169 3.54
Current liabilities 4,901,701 5,190,195 (288,494) (5.56)
Non-current liabilities 9,752,947 9,872,712 (119,765) (1.21)
Total liabilities 14,654,648 15,062,907 (408,259) (2.71)
Capital stock 7,272,401 7,528,577 (256,176) (3.40)
Capital surplus 6,059,651 6,280,482 (220,831) (3.52)
Retained earnings 6,338,989 5,104,542 1,234,447 24.18
Other equity interest (19,802) 119,713 (139,515) (116.54)
Treasury stock - (962,503) 962,503 (100.00)
Equity attributable to equity
holders of the Company 19,651,239 18,070,811 1,580,428 8.75
Analysis of deviation over 20%:
1. Retained earnings increase was mainly due to the increase of profit in 2019.
2. Other equity interest decrease was mainly due to the increase of unrealized loss on valuation of
finance assets at fair value through other comprehensive income and currency exchange loss
arising from translation of foreign operations in 2019.
3. Treasury stock decrease was mainly due to cancellation of treasury stock in 2019.
257

II Analysis of Financial Performance: (consolidated financial statements)
(I) Operating Results Comparative Analysis Unit: NT$ thousands ; %
Year
Item
2019 2018
Difference
Amount %
Revenue 20,337,881 18,480,027 1,857,854 10.05
Cost of revenue (16,411,742) (15,050,032) (1,361,710) 9.05
Gross profit 3,926,139 3,429,995 496,144 14.46
Operating expenses (1,561,948) (1,477,788) (84,160) 5.69
Other income (expenses), net 92,928 147,514 (54,586) (37.00)
Operating profit 2,457,119 2,099,721 357,398 17.02
Non-operating income (expenses) 573,200 (317,279) 890,479 (280.66)
Profit before income tax 3,030,319 1,782,442 1,247,877 70.01
Income tax expense (446,158) (679,367) 233,209 (34.33)
Profit for the year 2,584,161 1,103,075 1,481,086 134.27
Other comprehensive loss, net of
income tax (123,772) (32,829) (90,943) 277.02
Total comprehensive income for
the year 2,460,389 1,070,246 1,390,143 129.89
Analysis of deviation over 20%:
1. Other income (expenses), net decrease was mainly due to the decrease of gain on disposal of
scrapped materials and royalty income in 2019.
2. Non-operating income, net, increase was mainly due to the recognized of gain on disposal of
investment accounted for using equity method in 2019.
3. Profit before income tax and profit for the year increase were mainly due to the recognized of
gain on disposal of investment accounted for using equity method and the increase of profit in
2019.
4. Income tax expense decrease was mainly due to higher income tax expense on upappropriated
retained earnings of 2018.
5. Other comprehensive loss, net of income tax increase was mainly due to the increase of
unrealized loss on valuation of finance assets at fair value through other comprehensive income
and currency exchange loss arising from translation of foreign operations in 2019.
(II) Sales Volume Forecast and Effect of Changes on the Company’s Future Business and
Future Response Actions : Please refer to “I. Letter to Shareholders”.
258

III Analysis of Cash Flow
(I) Cash Flow Analysis for the Current Year
Year
Item 2019 2018
Increase (decrease)
ratio
Cash flow ratio (%) 122.26% 76.30% 60.24%
Cash flow adequacy ratio (%) 85.76% 91.84% (6.62%)
Cash reinvestment ratio (%) 6.27% 4.75% 32.00%
Analysis and explanation for changes exceeding 20%:
Cash flow ratio and cash reinvestment ratio: Mainly due to increase of profit in 2019.
(II) Remedial Plan for Liquidity Shortage: None
(III) Company's Cash Liquidity Analysis for the Coming Year Unit: NT$ thousands
Opening cash
balance
Net cash flow
provided by
operating activities
Annual cash
outflow
Cash balance
amount
Remedial actions for cash
deficit
Investment
plan
Financial
plan
4,704,084 6,057,470 6,263,723 4,497,831 - -
1. Analysis on the cash flow changes for the coming year :
(1) Operating activities $6,057,470: Mainly due to operating profit estimated.
(2) Investing activities ($5,382,904): Mainly due to the acquisition of operating equipment.
(3) Financing activities ($880,819): Mainly due to the proceeds from bank loans and payment of
cash dividend.
2. Remedial action for cash deficit and liquidity analysis: Not applicable.
IV Major Capital Expenditure Items
Major Capital Expenditure Items and Source of Capital Unit:NT$ thousands
Project Actual or expected source
of funds
Total actual
funding need
Actual or expected status of use
2019 2020
Plant and
equipment Own funds or bank loan 10,171,464 4,896,609 5,274,855
V Investment Policy in the Last Year, Main Causes for Profits or Losses, Improvement Plans and
Investment Plans for the Coming Year
The Company and its subsidiaries’ investments in the most recent year, accounted for using
equity method, were all made for long-term strategic purposes and to enhance our international
market competitiveness. Each investment was made with prudent evaluation. The Company and
its subsidiaries recognized its share of loss of investments accounted for using equity method
259

amount to NT$154,926 thousand for the year of 2019 which decreased NT$145,175 thousand
from the last year. The loss from the investments mainly due to part of them are still under the
initial stage of development and expansion but the capacity utilization has gradually increased.
The Company and its subsidiaries will continue to give guidance in accelerating investees to
reach the profit goal
VI Analysis of Risk Management as in Most Recent Year and Up to the Date of Publication Date of
the Annual Report
I. Effects of Changes in Interest Rates, Foreign Exchange Rates and Inflation on Corporate
Finance, and Future Response Measures
1. Variations of Interest rate
The borrowings of the Company and its subsidiaries are mainly generated for the
purposes of operating activities. However, as the Company acquired better rates at the time
of such borrowings, and thus rate changes are not expected to produce much impact on the
Company's operations. The Company will keep an eye on the interest rate fluctuation,
maintain good rapport with correspondent banks, and assess loan interest rate and average
market interest rate periodically to lower the impact of interest rate changes on the
Company's profit.
2. Variations of foreign currency exchange rate
(1) Impact of exchange rate on the Company's revenue and profit
The major foreign currency-denominated sales of the Company and its
subsidiaries are denominated in US dollars, while the major raw material and
machinery equipment are partial denominated in US dollars or Japanese yen.
Therefore, accounts receivable charge against accounts payable for foreign
currency-denominated will bring part of nature hedge effect. However, exchange gain
or loss may arise when exchanging such funds to New Taiwan Dollars. Thus, exchange
rate changes may have impacts on the Company's revenue and profit.
(2) Countermeasures
The exchange rate fluctuation of foreign currency assets and liabilities of the
Company and its subsidiaries is based in nature hedge, supplemented with the related
hedge management measures as follows to serve as short-term response:
A. The finance department will monitor international exchange rate changes from time
to time, and gather the related information of exchange rate changes at all times to
grasp the trend of international exchange rate changes. The finance department will
also conduct timely exchange pursuant to the Company's needs of funds to lower the
risk exposure of exchange rate changes.
B. With the characteristic of nature hedge, the Company will use foreign currency
liabilities to balance foreign currency assets. Further, the Company will also use
bank loan and other methods to adjust the ratio of foreign currency assets and
260
liabilities. Such actions may help the Company to lower the impact of exchange rate
changes.
3. Inflation
The impact of inflation is enormous, and the Company will gather information of
international economic situation and the factors might trigger an unusually heated inflation
to keep constant watch of market price fluctuation of raw material and keep looking for
substitutive materials. Also, the Company and its subsidiaries will provide relevant
information to Company's management team as a basis for review and decision making.
The Company and its subsidiaries will also keep good interactive relationship with
suppliers and customers to enhance the response to cost changes, and proceed with further
negotiate regarding purchases and prices in order to avoid adverse impact of inflation on
the Company. The company demand for precious metals accounted for a certain proportion
of the production, to establish a precious metal processing and supply chain to improve the
establishment of a more flexible response to the risk of loss caused by precious metal price
fluctuations.
(II) Policies, Main Causes of Gain or Loss and Future Response Measures with Respect to
High-risk, High-leveraged Investments, Lending or Endorsement Guarantees, and
Derivatives Transactions
The Company and its subsidiaries do not engage in any high-risk, high-leverage
investment. The Company's derivatives transactions are strictly for hedging the risk of
exchange rate changes of the Company's assets and liabilities denominated in foreign
currency and are all under the Company's control. Every banking transaction is handled in
accordance with the operation process of derivatives transactions provided in our
"Operational Procedures for the Acquisition or Disposal of Assets" and "Authority Table of
Finance Operation Authorization and Approval."
As of the date of publication of this annual report, the Company and its subsidiaries have
not lent loans nor made endorsement/guarantee to others. Only for the company’s operation
activities for customs tariff endorsement guarantee amounted to NT$100,800 thousand.
(III) Future Research & Development Projects and Corresponding Budget:
R&D projects in the future
The Company and its subsidiaries have been established in line with "R&D-based"
objective, focusing on advanced R&D and production problem solving of assembly and
testing business. Every year we will devote in R&D regarding various issues in mechanics,
material, electrical and other related domain in order to provide customers with all round
information. 3C products have to be possessed of the characters of light, thin, short and
small for mobile platform and prevalence stretching over different applicable electronic
products, such as touch panel controller IC, power management IC, biometrics
261

authentication (such as fingerprint sensor) etc. Therefore, further advanced multi-chip
assembly technologies have become a basic equipment to achieve full-scale integration.
The assembly and testing houses need build up the state of the art capabilities and
develop the R&D technologies to provide customers with effective solutions and to
maintain the market competitiveness. Thus, the Company and its subsidiaries keep
enhancing investments in core technologies and working toward R&D in advanced
technologies regarding assembly and testing. The Company and its subsidiaries have put a
lot of effort on R&D over decades, and the achievement should be attributed to the
professional skills of the engineers and their accumulated experiences. Their appropriate
control of materials and improvement in equipment also helped in reducing production
costs. In addition, the Company and its subsidiaries conducted an industry, research
institution and university co-development project to jointly research and develop in next
generation advanced assembly and testing technologies. The Company and its subsidiaries
will align customer’s product development schedule and technology development roadmap
by more aggressive R&D development resource. Meanwhile, the involved R&D resource
also could enhance the core technology capability and expand the new business
opportunity. Based on the foregoing, the Company and its subsidiaries have the
self-confidence to be the pioneer in the assembly and testing industry.
New products (services) planned to be developed
The Group not only plans to keep increasing capacity of assembly and testing services
for high-end memory, but also plans to expand regarding the assembly and testing services
for the following products:
A. Developing 3P/3M Cu pillar and WLCSP for high pin count product.
B. Continually develop fine pitch RDL line width and space (4um/4um) for copper RDL
application.
C. Developing fine pitch inner lead width and space for COF ILB assembly.
D. Evaluate thinner PI film of COF tape to increase the tape flexible property for full
screen of FDP device development.
E. Developing COF FT test condition in low temperature condition -40℃ for automotive
device specification.
F. Implement DBG/ SDBG for thin wafer capability.
G. 16DP BGA/SiP product developmentEstimated R&D expenditure
The estimated R&D expenditure of the Company and its subsidiaries are gradually
recognized in accordance with the developing progress of new products and technologies,
and will maintain a certain rate of growth based on future operating conditions to ensure
the competitiveness of the Company and its subsidiaries.
262

(IV) Effects of and Response to Changes in Policies and Regulations Relating to Corporate
Finance and Sales
The Company and its subsidiaries' financial status are not affected by major changes
in domestic and foreign government policies and laws in recent years. Nevertheless, since
the rules and regulations of the Company and its subsidiaries are stipulated and enforced
with the relative laws and regulations, if there is any amendment, the Company and its
subsidiaries will amend and renew their rules and regulations in accordance with such
amendment.
(V) Effects of and Response to Changes in Technology and the Industry Relating to Corporate
Finance and Sales
The industry, products and technologies which the Company and its subsidiaries now
engaged are changing rapidly, requiring the Company to not only introduce advanced
process technologies but also enhance the partnership of the strategic alliance with
upstream and downstream vendors of the supply chain. The Company and its subsidiaries
shall devote to acquiring and developing advanced process technologies, obtain strategic
cooperative alliance with major material suppliers and customers, and enhance marketing
channel to make a diverse development in products and customers. As for financial
operation, the Company and its subsidiaries shall aim at the characteristic of business to
strengthen the management of cash flow and to maintain adequate financial structure to
disperse operating risks.
(VI) The Impact of Changes in Corporate Image on Corporate Risk Management, and the
Company’s Response Measures
The Company and its subsidiaries maintained an excellent corporate image by
operating with integrity and complying with the relevant laws and regulations. Up to date,
there has been no event that adversely impact in the corporate image of the Company and
its subsidiaries..
(VII) Expected Benefits from, Risks Relating to and Response to Merger and Acquisition Plans
None.
(VIII) Expected Benefits from, Risks Relating to and Response to Factory Expansion Plans
The layout of plant of the Company and its subsidiaries is according to fill up current
capacity first and consider the necessary to satisfy the future needs of customers and
market development trend. Expansion of the plant of the Company and its subsidiaries
has been completely and prudently evaluated by responsible departments. Investment
recovery and possible risks have also been taken into consideration.
263

(IX) Risks Relating to and Response to Excessive Concentration of Purchasing Sources and
Excessive Customer Concentration
(1) Purchases
The Company duly evaluates the financial and operating status of our major
suppliers. Purchases of major raw materials are generally purchased from two or more
suppliers except in the event that such materials shall be purchased from suppliers
certified or designated by customers. Our suppliers are all well-known manufacturers
from home or abroad. We keep long-term partnership with all the suppliers in order to
assure a steady purchase. We also develop substitute materials and suppliers to
increase the flexibility of supply sources. In view of the impact of the serious
earthquake in northeast Japan on the material supply, we take the location of suppliers'
manufacturing facilities into account in order to disperse risks of purchase
concentration and to enhance the integrity and reliability of supply chain.
(2) Sales
The Company is the second largest assembly and testing house for LCD display
driver IC in Taiwan and have deeply ploughed the assembly and testing services in
semiconductor back-end processes industry. The major business lies in providing
assembly and testing services for MF/HF memory, high density memory, LCD display
driver IC, communication IC, and logic/mixed-signal IC etc. The major customers
include semiconductor design companies, integrated device manufacturers and
semiconductor IC Fabs at home and abroad. Sales made to the top 10 customers of the
Company respectively accounted for 85.2%, 84.7% and 84.2% of the net revenue
for each year from 2017 to 2019. Sales made to the top 10 customers in each season
were very stable and no sales made to any singular customer or group accounted for
over 30% of all sales. Therefore, the Company does not run the risk of
over-concentration in sales. Further, the Company will not only keep providing fine
services for solutions and technical support to customers, but will also maintain a well
and long-term relationship with existing customers. We will also further devote to win
new customers that engage in logic/mixed-signal IC and consumer IC products in
order to reduce risks associated with sales concentration.
(X) Hazardous Risks and Utility Supply Interruption or Shortage Risks
The frequency and severity of catastrophic events, including natural disasters and
severe weather has been increasing, in part due to climate change or systemic regional
geological changes that manifest in damaging earthquakes. ChipMOS has manufacturing
and other operations in locations subject to natural disasters, such as flooding,
earthquakes, tsunamis, typhoons, and droughts that may cause interruptions or shortages
in the supply of utilities, such as water and electricity, that could disrupt operations. In
addition, ChipMOS’s suppliers and customers also have operations in such locations. For
264

example, most of ChipMOS’s production facilities, as well as those of many of its
material suppliers and equipment vendors, are located in Taiwan and Japan, which are
susceptible to earthquakes, tsunamis, flooding, typhoons, and droughts from time to time
that may cause shortages in electricity and water or interruptions to our operations.
Thus, if one or more natural disasters that result in a prolonged disruption to ChipMOS’s
operations or those of its customers or suppliers, or if any of its or vendor facilities were
to be damaged or cease operations as a result of an explosion or fire, it could reduce the
Company’s manufacturing capacity and may cause us to lose important customers,
thereby having a potentially adverse and material impact on our operational and financial
performance. ChipMOS has occasionally suffered power outages or surges in Taiwan
caused by difficulties encountered by its electricity supplier, the Taiwan Power Company,
or other power consumers on the same power grid, which have resulted in interruptions to
our operations.
ChipMOS maintains a comprehensive risk management system dedicated to the
safety of people, the conservation of natural resources, and the protection of property. In
order to effectively handle emergencies and natural disasters, at each facility management
has developed comprehensive plans and procedures that focus on risk prevention,
emergency response, crisis management and business continuity. All ChipMOS
manufacturing factories have been ISO 14001 certified (environmental management
system) and OHSAS 18001 certified (occupational health and safety management
system).
The Company pays special attention to preparedness of emergency response to
disasters, such as typhoons, floods and droughts caused by climate change, earthquakes,
pandemics (such as H1N1 influenza, new coronavirus), and disruptions to water,
electricity and other public utilities. ChipMOS has established a company-wide taskforce
dedicated to managing the risk of a water or electricity shortage that might arise due to
climate change.
In response to the impact of the earthquake that occurred in Taiwan, ChipMOS
conducted a continuous improvements including enhancing earthquake emergency
response, enhancing tool anchorage and seismic isolation facilities, preparedness for
speeding up tool salvage and production recovery. Although the Company maintains
many overlapping risk prevention and protection systems, as well as fire and casualty
insurance, ChipMOS’s risk management and insurance coverage may not always be
sufficient to cover all of the Company’s potential losses. If any of ChipMOS’s or vendor
facilities were to be damaged or cease operations as a result of an explosion, fire or
environmental causes, it could reduce the Company’s manufacturing capacity and may
lead to the loss of important sales and customers, and impact on ChipMOS’s financial
performance. In addition to periodic fire-protection inspections and firefighting drills, the
265

Company has also carried out a corporate-wide fire risk mitigation project focused on
managerial and hardware improvements.
In addition, beginning in late 2019, the media has reported a public health epidemic,
new coronavirus, COVID-19, originating in China, prompting precautionary
government-imposed closures of certain travel and business. It is unknown whether and
how global supply chains may be affected if such an epidemic persists for an extended
period of time. We may incur expenses or delays relating to such events outside of our
control, which could have a material adverse impact on our business, operating results
and financial condition.
(XI) Effects of, Risks Relating to and Response to Large Share Transfers or Changes in
Shareholdings by Directors, Supervisors, or Shareholders with Shareholdings of over
10%: None.
(XII) Effects of, Risks Relating to and Response to the Changes in Management Rights:
In the most recent year and as of the publication date of this annual report, there was
no such situation. This section is thus not applicable.
(XIII) Litigation or Non-litigation Matters
1. Major ongoing lawsuits, non-lawsuits or administrative lawsuit: None.
2. Major ongoing lawsuits, non-lawsuits or administrative lawsuits caused by directors,
supervisors or shareholders with over 10% shareholdings:
Broadcom Corporation, Broadcom Singapore PTE, Ltd., and Broadcom Limited
(collectively, "Broadcom") previously filed a request to the American Arbitration
Association ("AAA") for arbitration against Siliconware Precision Industries Co., Ltd.
("SPIL"), the major shareholder holding more than 10% of ChipMOS
TECHNOLOGIES INC.'s shares, regarding the dispute related to the performance of
the Semiconductor Packaging Agreement (the "Agreement") executed by and between
SPIL and Broadcom in September, 2012. According to the Agreement, in the event that
the assembling and testing services provided by SPIL infringes the patents of any third
party and, as a result of such infringement, causes any losses for Broadcom, SPIL shall
indemnify and hold harmless Broadcom from such losses. In the aforementioned
arbitration proceeding, Broadcom and SPIL ultimately reached an agreement in
December, 2019 for the patent infringement dispute between Broadcom and Tessera
Technologies, Inc., under which SPIL shall pay USD 5 million for settlement.
Therefore, SPIL has earmarked funds totaling NTD 149.9 million as provision for
liabilities (recorded as other current liabilities) and executed the settlement agreement
with Broadcom in February, 2020. Aside from the abovementioned dispute, no other
lawsuits have been filed against SPIL
266

(XIV) Other Major Risks and Countermeasures
1. Risks Associated with Cyber Attacks
The Company has announced an Information Security Policy since 2014. Setting
up an Information Security Management Committee and communication email in
organization. Implementing an ISMS (information security management system) based
on ISO/IEC 27001:2013 information security standard. The Company has established
ISO 27001 framework contains 14 domains. These domains cover a wide variety of
control objectives, policies to protect the Confidentiality, Integrity and Availability of
the Company information assets security.
Formulate operational standards for information security related management
procedures, plan internal management related activities of the security, and assist in the
internal information security related risk assessment and needs. Each year, information
technology center's related control objectives and control measures are reviewed
through internal audit activities and external third-party verification. Currently, in 2017,
ISO/IEC 27001 certifications have been obtained. The annual review was also
completed in December 2019.
The Company continuously develop disaster recovery architecture for important
information assets and conduct disaster recovery plan & implement disaster recovery
rehearsal (DR rehearsal). The rehearsal information system recovery time objective
(RTO) can be completed within the maximum tolerable period of disruption (MTPD) to
reduce the production interruption time or property loss caused by disasters. The
Information Technology Center has completed 30 items DR rehearsal for important
information systems and services in last year. It includes databases, production system
hosts, networking, core switches, firewall and other types of information assets. DR
rehearsal adopts standardized disaster recovery plan to make the same expected disaster
recovery effect can be obtained in the different factory area and different system
administrator.
In order to obtain the cyber security threats and vulnerability risk assessments.
The Company join the Science Park Information Sharing and Analysis Center
(SP-ISAC) external security organization. SP-ISAC provide information security
analysis services and provide information alerts about current security issues,
vulnerabilities, and exploits. Using submit security incident support form can help
ISMS security team analysis and response to the security incident. To reduce cyber
security risk by setting up network security equipment, in addition using intrusion
detection system to real time analyze & block abnormal network behaviors. Maintain
and identifying information assets value (confidentiality, integrity and availability)
through information assets inventory every year. The information assets value
267

corresponds to determines the assets protection level plan needs. In response to the
increasing trend of phishing email cybercrime by social engineering email attacks,
implement phishing simulations test and educate employees on how to spot phishing
and avoid attacks, increase employee awareness for reduce risk.
VII Special Disclosure: None.
268
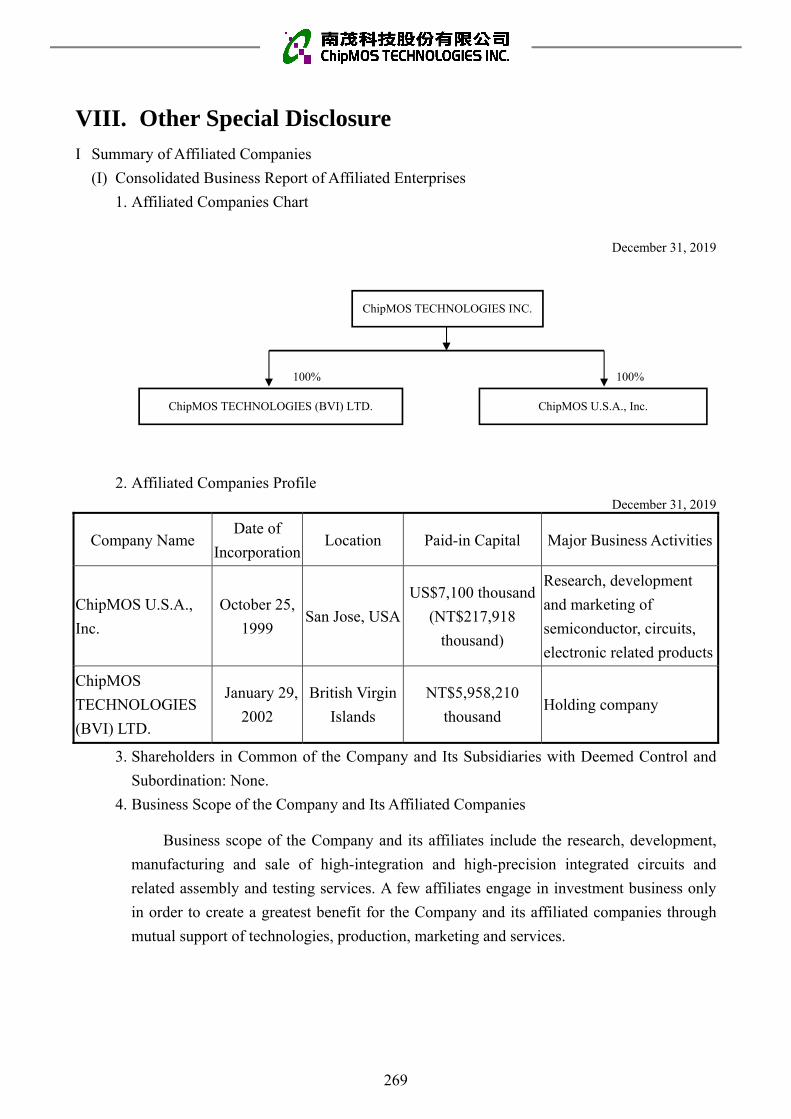
VIII. Other Special Disclosure I Summary of Affiliated Companies
(I) Consolidated Business Report of Affiliated Enterprises
1. Affiliated Companies Chart
December 31, 2019
2. Affiliated Companies Profile December 31, 2019
Company Name Date of
Incorporation Location Paid-in Capital Major Business Activities
ChipMOS U.S.A.,
Inc.
October 25,
1999 San Jose, USA
US$7,100 thousand
(NT$217,918
thousand)
Research, development
and marketing of
semiconductor, circuits,
electronic related products
ChipMOS
TECHNOLOGIES
(BVI) LTD.
January 29,
2002
British Virgin
Islands
NT$5,958,210
thousand Holding company
3. Shareholders in Common of the Company and Its Subsidiaries with Deemed Control and
Subordination: None.
4. Business Scope of the Company and Its Affiliated Companies
Business scope of the Company and its affiliates include the research, development,
manufacturing and sale of high-integration and high-precision integrated circuits and
related assembly and testing services. A few affiliates engage in investment business only
in order to create a greatest benefit for the Company and its affiliated companies through
mutual support of technologies, production, marketing and services.
100% 100%
ChipMOS TECHNOLOGIES (BVI) LTD. ChipMOS U.S.A., Inc.
ChipMOS TECHNOLOGIES INC.
269

5. Roster of Directors, Supervisors and Presidents of Affiliated Enterprises December 31, 2019 (Unit: shares / %)
Company Name Title Name or Representative Shareholding
Shares %
ChipMOS U.S.A., Inc.
Chairman/Director Representative of ChipMOS TECHNOLOGIES INC.: Lafair Cho
3,550,000 100%
President/Director Representative of ChipMOS TECHNOLOGIES INC.: Shih-Fan Cheng
Director Representative of ChipMOS TECHNOLOGIES INC.: Shih-Jye Cheng
Director Representative of ChipMOS TECHNOLOGIES INC.: Yung-Wen Li
Director Representative of ChipMOS TECHNOLOGIES INC.: Silvia Su
ChipMOS TECHNOLOGIES (BVI) LTD.
Chairman/Director Representative of ChipMOS TECHNOLOGIES INC.: Lafair Cho
2,407,742,975 100%Director
Representative of ChipMOS TECHNOLOGIES INC.: Silvia Su
6. Business Overview of Affiliated Companies December 31, 2019 (Unit: NT$ thousands)
Company Name Paid-in Capital
Total Assets Total
LiabilitiesNet worth Revenue
Operating profit (loss)
Profit for the year
Earnings per share
(NT$)
ChipMOS U.S.A., Inc.
217,918 241,938 6,196 235,742 32,808 1,986 4,267 1.20
ChipMOS TECHNOLOGIES (BVI) LTD.
5,958,210 3,175,040 - 3,175,040 Note1 (55) (219,692) (0.09)
Note 1: No operating activities as a holding company.
(II) Consolidated Financial Statements of Affiliated Companies
For the year ended December 31, 2019, pursuant to “Criteria Governing Preparation of
Affiliation Reports, Consolidated Business Reports and Consolidated Financial Statements of
Affiliated Enterprises”, the company that is required to be included in the consolidated
financial statements of affiliates, is the same as the company required to be included in the
consolidated financial statements under International Financial Reporting Standards No.10.
And if relevant information that should be disclosed in the consolidated financial statements
of affiliated enterprises has all been disclosed in the consolidated financial statements of
parent and subsidiary companies, it shall not be required to prepare consolidated financial
statements of affiliated enterprises.
(III) Affiliation Report: Not applicable.
II Status of Company's Private Placement in the Most Recent Year and Up to the Date of
Publication of the Annual Report: None.
III Holding or Disposal of Shares of the Company by Subsidiaries in the Most Recent Year and
Up to the Date of Publication of the Annual Report: None.
IV Other Necessary Supplement: None.
270

IX. Any Event that Have Significant Impacts on Shareholders’
Rights or Security Prices as Stated in Item 2 of Paragraph
3 of Article 36 of Securities and Exchange Law in the Most
Recent Year and Up to the Date of Publication of the
Annual Report: None.
271

ChipMOS TECHNOLOGIES INC.
Chairman: Shih-Jye Cheng