Embed Size (px)
Citation preview

1
2008 Budget Review Presentation
Le Meridien Kathmandu
27/09/2007

2
Executive Summary - Overview
Hotel positioning statement
Gokarna Forest Resorot Kathmandu is considered to be one of the premium property existing in Nepal. Its spacious rooms, one of the best golf courses in Asia, the best spa in Nepal, 470 acres of serene forest and being the only Certified property of the World Eco Hotels and also recommended by the Lonely Planet Guide book and are also the Member of IAGTO. However, being located outskirts of the city, difficulty in the approach roads, lack of shopping opportunities in and around the property often deters suppliers to select the property for corporate guests and tourists.
Economic indicators- GDP growth – 2.7%, Inflation – 5.4%
- NRS appreciated by 10% in comparison to US$ in 2007.
- Key feeder market is India. As the Indian economy continues to grow, the inflow of Indian tourists and business people are likely to increase as well.
Tourism indicators- 35.6% increase in International tourists in
the first half of 2007 compared to first half of 2006.
- Increase of International carriers as a result of relative stable political scenario.
DemandDemand SupplySupply
Compset update - Shangri La and Malla hotels have been
upgraded as five stars. Around 200 rooms increase in Five Star category.
New entrants- Possible reopening of Kathmandu Hotel
and probable introduction of Surya Hotels in 2008 which is a brand of ITC India. Approx. 300 rooms supply to existing market.
Overview of market conditions

3
Executive Summary - Key Performance IndicatorsIn Local Currency (000s)
Highlight key strategies (including S&M and Operations) to achieve 2008 Budget
- Add another 9 Deluxe rooms to the inventory.
- Increase two Spa rooms.
- Add another large banquet hall to the property.
- Procure at least one more vehicle for the fleet.
Use latest available data for non-financial indicators and state period (eg TeamHot @ Aug 07)
Key Performance Indicators 2006 2007 2008Actual FYF Budget 07 vs 06 08 vs 07
Occupancy % 22% 33% 51% 11.11 51.31 ADR 3,259.2 3,855.5 4,179.8 18% 8%RevPAR 702.3 1,259.3 2,144.5 79% 70%RPIRPI Ranking
GOP $ (in 000s) (4,609) 6,428 16,718 -239% 160%GOP % -10% 9% 16% -193% 73%
Starwood's EBITDA (in 000s) 711 1,208 1,603 70% 33%
LRA
GSI
StarVoice
TeamHot ($000s)SPG EnrolmentSPG Redemptions ($000s)
Growth

4
Competitive Set Update
Dwarikas have the highest ADR with the luxury of high occupancy.
Current target for LM Kathmandu is to increase occupancy and build RevPar on it.
Occ ADR RevPar Ranking Occ ADR RevPar Ranking Occ ADR RevParLM Kathmandu 22% 3,291.6 721.1 5.0 33% 3,844.8 1,254.5 5.0 51% 4,179.8 2,144.5 % Var YOY 50% 17% 74% 55% 9% 71%
Dwarikas 65% 4,875.0 3,168.8 1.0 67% 4,975.0 3,333.3 1.0 68% 4,985.0 3,389.8 % Var YOY 3% 2% 5% 1% 0% 2%
Hyatt Regency 65% 3,900.0 2,535.0 2.0 50% 4,350.0 2,175.0 4.0 55% 4,550.0 2,184.0 % Var YOY -23% 12% -14% 10% 5% 0%
Radisson 62% 3,250.0 2,015.0 4.0 65% 3,575.0 2,323.8 3.0 67% 3,595.0 2,409.0 % Var YOY 5% 10% 15% 3% 1% 4%
Soaltee Crowne Plaza 70% 3,250.0 2,275.0 3.0 73% 3,500.0 2,555.0 2.0 75% 3,550.0 2,662.5 % Var YOY 4% 8% 12% 3% 1% 4%
Comp 5% Var YOY #DIV/0! #DIV/0! #DIV/0! #DIV/0! #DIV/0! #DIV/0!
OI ARI RPI Ranking OI ARI RPI Ranking OI ARI RPI
LM Kathmandu 0% 0.9 0.3 5.0 1% 1.0 0.5 5.0 1% 1.0 0.6
Dwarikas 1% 1.4 1.4 1.0 1% 1.3 1.4 1.0 1% 1.3 1.4
Hyatt Regency 1% 1.1 1.1 2.0 1% 1.1 0.9 4.0 1% 1.2 0.9
Radisson 98% 0.9 0.9 4.0 1% 0.9 1.0 3.0 1% 0.9 1.0
Soaltee Crowne Plaza 1% 0.9 1.0 3.0 1% 0.9 1.1 2.0 1% 0.9 1.1
Comp 5 - -
2006 Actual 2007 FYF 2008 Budget

5
SWOT Analysis (of your hotel)
S - Strengths One of the best Golf Courses in the world.
470 acres of serene forest within the boundary of the property in the proximity of the city.
Largest guest rooms in Kathmandu after Dwarikas.
The Brand
Warm and hospitable service personnel.
W - Weaknesses Difficulty in road communication from the city.
Lack of Air Conditioning in all rooms and conference halls.
Lack of good conference hall and break out rooms.
Lack of entertainment options and nearby shopping opportunities.
Lack of development trainings.
O - Opportunities Increase in foreign airlines operating directly to
Kathmandu ( Etihad Airways, Silk Air, Korean Air, China Southern Airlines etc ).
New exploration of Middle East as a supply market for Nepal.
Declaration of more tourist destination in Nepal including virgin mountains.
Exploration of new market in Bangladesh.
Growing number of International Conferences in Nepal.
Extensive use of Starwood marketing channels.
T- Threats Breakdown in the peace process.
Election being deferred or even worse cancelled.
Continuation and increase of political agitation specially in plain lands bordering India in South which is the main route to the regular supply for Nepal.
Deteriorating law and order situation.
Excessive negative exposure in the International Media and travel advisory being imposed by foreign governments on Nepal.

6
2008 Budget – Financials OverviewIn Local Currency (000s)
Rooms Profit ($) 10,716.5 20,686.8 41,977.3 93% 103%Rooms Profit Margin (%) 77% 82% 84% 4.90 1.91 Rooms Profit Flowthrough vs LY 88% 87% -1%
F&B Payroll & Benefits 3,475 3,604 4,248 F&B Other Expenses 7,665 14,215 16,318 F&B Profit ($) 5,187.7 6,013.2 9,689.8 16% 61%F&B Profit Margin (%) 32% 25% 32% (6.54) 6.80 F&B Profit Flowthrough vs LY 11% 44% 303%
Deductions 27,883.4 32,768.0 39,109.0 18% 19%Deductions % of GOR 59% 46% 36% (12.93) (9.75)
Total Payroll & Benefits 17,926.9 17,978.9 22,794.8 0% 27%Total Payroll & Benefits % of GOR 37.8% 25.2% 21.1% (12.64) (4.11) Total FTE 216.0 221.0 223.0 2% 1%
GOP (4,609.1) 6,427.7 21,464.2 -239% 234%GOP % -9.7% 9.0% 20.1% 18.72 11.08 GOP Flowthrough 46.0% 42.4% -8%
Starwood's EBITDAEquity EarningsBase/License Fees 711.1 1,071.2 1,603.3 51% 50%Incentive Fees - 136.8 - -100%Non-Bills - - - Starwood's EBITDA 711.1 1,208.0 1,603.3 70% 33%
Can be dow nloaded from Cognos

7
By Market Segment (Your hotel’s four main segments)
Compset Update – Drill Down by Segment (Occ)
2007FYF
Annual Occupied
Retail MixMarket Share Penetration Mix
Market Share
Penetration Mix
Market Share
Penetration Mix
LM Kathmandu 393 6% 1% 15% 14% 2% 29% 7% 0% 6% 19%Dwarikas 1,779 10% 5% 17% 30% 13% 42% 60% 12% 38% 0%Hyatt Regency 10,320 15% 30% 280% 20% 33% 313% 55% 41% 388% 10%Radisson 4,345 12% 12% 45% 40% 35% 125% 40% 16% 56% 8%Soaltee Crowne Plaza 18,077 25% 52% 219% 10% 17% 73% 40% 31% 132% 25%TOTAL 34,915 5% 100% 100% 6% 100% 100% 13% 100% 100% 4%
Corporate - Occupancy Group - OccupancyWholesale - OccupancyRetail - Occupancy
Available Total AnnualRooms Retail Corporate Wholesale Group Others Occupied
LM Kathmandu 55 6% 14% 7% 19% 0% 6,550 Dwarikas 75 10% 30% 60% 0% 0% 17,794 Hyatt Regency 290 15% 20% 55% 10% 0% 68,803 Radisson 160 12% 40% 40% 8% 0% 36,208 Soaltee Crowne Plaza283 25% 10% 40% 25% 0% 72,307
Available Total AnnualRooms Retail Corporate Wholesale Group Others Occupied
LM Kathmandu 55 393 917 459 1,245 - 6,550 Dwarikas 75 1,779 5,338 10,676 - - 17,794 Hyatt Regency 290 10,320 13,761 37,842 6,880 - 68,803 Radisson 160 4,345 14,483 14,483 2,897 - 36,208 Soaltee Crowne Plaza283 18,077 7,231 28,923 18,077 - 72,307
Annual Room Nights by Segments - 2007FYF
Annual Room Nights by Segments - 2007FYF
Being a resort outside of the city penetration in corporate will always be minimum.
Could not penetrate wholesale business the way it was supposed to be but efforts are on.

8
Rooms – RevPAR TrendIn Local Currency
CommentsOccupancy
Jan Feb Mar Apr May Jun Jul Aug Sep Oct Nov Dec FY2006 21% 11% 24% 9% 8% 18% 23% 32% 10% 28% 43% 29% 22%2007 31% 32% 24% 34% 24% 28% 32% 24% 32% 54% 39% 38% 33%2008 48% 54% 47% 53% 37% 45% 52% 42% 53% 65% 63% 52% 51%
ADR - Local Currency
Jan Feb Mar Apr May Jun Jul Aug Sep Oct Nov Dec FY2006 3,142 3,033 3,759 3,083 2,951 2,598 2,768 3,241 3,948 3,269 3,109 3,930 3,292 2007 3,523 3,382 3,752 4,279 3,817 3,634 3,879 3,721 3,918 3,918 4,044 4,109 3,844 2008 4,220 4,349 3,828 3,819 4,006 4,158 4,144 4,968 3,811 3,979 3,979 3,890 4,084
RevPAR - Local Currency
Jan Feb Mar Apr May Jun Jul Aug Sep Oct Nov Dec FY2006 660 334 902 277 236 468 637 1,037 395 915 1,337 1,140 724 2007 1,092 1,082 900 1,455 916 1,018 1,241 893 1,254 2,116 1,577 1,561 1,269 2008 2,042 2,343 1,814 2,029 1,484 1,884 2,164 2,066 2,015 2,597 2,518 2,029 2,083
450
650
850
1050
1250
1450RevPAR
50
550
1,050
1,550
2,050
2,550
3,050 RevPAR

9
Rooms – Market Mix and Pricing Strategy
Market Mix and Pricing Strategy (use more than 1 slide if necessary)- Please see next slides.
No. % No. % No. % No. % No. %Retail 2,120 51% 3748 4,809 58% 3640 2,064 61% 3820 3,969 61% 3881 1,792 15% 4972.97Corporate - 0% - 0%Wholesale 357 8% 3224 0% 268 8% 3058 469 7% 3448 5,417 45% 3509.57Group 1,755 41% 2754 3,090 37% 3640 1,032 31% 3992 2,112 32% 3866 2,887 24% 3746.38Crew - 0% - 0% - - - 0%Discount & Award - 0% - 0% 1,828 15% 2084.42Other - 0% 359 5% 3850 - - 0%Total 4,232 100% 3292 8,258 100% 3649.12 3,364 100% 3812 6,550 100% 3845 11,924 100% 4179.79
2008 BudgetRooms
ADRRooms
ADRRooms
ADR
2007 YTDRooms
ADR
2006 Actual 2007 Budget 2007 FYF Rooms
ADR

10
10
-(2006)
Market MixProper segmentation not being followed till march.52% of business from leisure and commercial retail.37% from Groups Initiatives to Achieve the same.Leisure retail-pitching for existing and new series and FIT business from Local agents.Commercial Group-Resident sales team actively combing market for local groups.Sales Blitzes with GSO in India for MICE businessSales team of One SM, Two ASM and Sales coordinator in place for Nepal from April 06.DSM and GM handling international S&M.
Market Mix Strategy

11
11
200758% i.e. 4809 rms from leisure series and FITSThis include Business from international Tour operators and local Handlers37% i.e. 3090 rms from M.I.C.E.
Initiatives to achieve the sameLeisure Groups – IBT Series-position as a upgrade from the regular city chain hotels, being used by running series ,at comparable rates.Commercial Groups - Corporate MICE from local Mkt–position as the ideal location for upper vertical meetings.Transient FIT-Position resort as the premium FIT hotel in Kathmandu
This includes business from India & Nepal.
Sales team would have been in place for more than months. This will drive more local business to the hotel.
Market Mix Strategy

12
Rooms – Market Mix and Pricing Strategy
2008- Retail to remain number one in the market mix even in 2008.
Production of Wholesale is expected to grow in 2008. With the new initiative to enhance relationship with wholesales suppliers locally and with main feeder market-India, production from this segment is likely to increase substantially. The post election positive changes in sociopolitical arena should contribute to this effort. Bangladesh is another target market in this effort.
- The basic initiative to be conducted by the DOSM in conjunction with the GM in this respect. The GSOs around the world and the RSOs in India to be utilized in wider manner.
- One commission based marketing partner has already been appointed in Bangladesh for the purpose.

13
Please outline the % mix of total room nights of your distribution channels and their avg. rate per the below
Rooms – Distribution Channel Analysis
2006 FY 2007 YTD 2006 FY 2007 YTDGDSCCC 1.42 1.74 5573.85 6766.5Brand WebThird Party Web (ctrip, wotif, ikkyu etc.)
Hotel Direct 16.94 25.94 3595.98 4062.5
CHANNEL% of Total Room Nights Avg rate

14
Rooms - Top 10 Accounts (Wholesale)
Tradewinds have been appointed as the exclusive agent in Singapore.
Airspan has been appointed as the marketing partner in Bangladesh.
Kapico is leading the travel agents in Dubai.
Working on new surface with Kuoni to generate new tour groups.
Malla Travels to promote new packages in WTM for LMK.
TOP 10 ACCOUNTS2007 FYF
2007FYF RNs
2007 Net
RateContracted
2007 YTD Rate
% of Total Wholesal
e RNs
% of Total RNs
TOP 10 ACCOUNTS2008 Budget
2008 RNs
2008 Net
RateContracted
% of Total Wholesal
e RNs% of Total
RNs
Worldw ays Tours & Travels 95 2,210 2,210 20% 2% Worldw ays Travels 650 3,250.00 21% 7%
Raika Tours & Travels 75 3,250 3,250 16% 2% Tradew inds 250 3,958.00 8% 3%
Nataraj Tours & travels 40 5,850 5,850 9% 1% Kapico Travels 300 5,850.00 10% 3%
Skybridge Tours & Travels 20 5,200 5,200 4% 1% Kuoni Travels 275 4,225.00 9% 3%
Malla Travels & Tours 20 3,900 3,900 4% 1% Malla Travels 250 3,900.00 8% 3%
Explore Nepal 20 3,250 3,250 4% 1% Airspan Ltd. 200 4,225.00 6% 2%
My Holidays Tours & Travels 20 3,900 3,900 4% 1% Nataraj Tours & Travels 200 3,900.00 6% 2%
Tzell Travel LLC. 20 3,250 3,250 4% 1% Raaika Tours & Travels 200 3,575.00 6% 2%
Sea & Sky Travels 20 3,575 3,575 4% 1% Skybridge Tours & Travels 175 3,900.00 6% 2%
Yeti Travels 20 3,900 3,900 4% 1% Yeti Travels 175 4,225.00 6% 2%
TOTAL 350 75% 9% TOTAL 2675 85% 28%
* Pls use base room types for Net Rate w hich refers to net corporate contracted rate and does not include service and tax and other inclusions eg breakfast

15
Rooms – Key Sales & Marketing Strategies to Achieve the Budget
Key Strategies/Initiatives to Leverage the Brand
-Increase partnership with other renowned brand name e.g Standard Chartered Bank, Life Style Magazines, Famous liquor companies etc.
-Introduction of a in house news magazine which will emphasize the brand and will be distributed to all the major stakeholders.
- Have increased joint ventures with electronic media e.g private TV channels and FM Radios.
Identify your emerging markets and describe your strategy to tap on these emerging markets- Bangladesh, China, Middle East and Singapore are emerging market for Kathmandu.
- Efforts are on for joint exercise in different avenues with the airlines that operates directly to Kathmandu or will operate soon shortly ( e.g Silk Air, Etihad etc. ).
- One marketing partner in Bangladesh has already been appointed on commission basis.
- One travel agent has been appointed in Dubai for Middle Eastern market.
- Working with two travel agents in Malaysia and Singapore to promote business.
- Planning to tap into Chinese market specially in Chengdu from where China Southern Airlines operates directly to Kathmandu.
- Use the Starwood Marketing channels more aggressively to procure business directly from overseas. Special emphasis to Internet & CRS reservations.
16
Rooms – Key Sales & Marketing Strategies to Achieve the Budget
Key Sales Strategies/Initiatives
-Maintain rate integrity at US$ 60 and parity of rate in all channels.
-Pursue local and overseas incentive groups. Use Starwood GSOs around the world for the purpose.
-Enhance relationship with local and international tour operators.
Key Marketing Strategies/Initiatives
-Use marketing outlets of Starwood with greater vigour.
- Appoint one marketing agent in Bangladesh.
-Increase partnership program with local corporate houses and other stakeholders.

17
F&B Budget
Include explanations on key variances and other comments
In Local Currency Total Labour Costs 3,474.7 3,604.4 4,248.2 4% 18%% of F&B Revenue 21% 15% 14% (6.16) (1.08)
Other Expenses 7,665.0 14,214.8 16,317.6 85% 15%% of F&B Revenue 47% 60% 54% 12.70 (5.71)
Total Expenses 11,139.7 17,819.2 20,565.8 60% 15%
F&B Profit 5,187.7 6,013.2 9,689.4 16% 61%F&B Profit Margin (%) 32% 25% 32% (6.54) 6.79
F&B Profit Flowthrough 11% 44%
Total F&B FTE 36 36 34 0 -0.05556
No. of Outlet Covers 45,595 41,052 46,059 -10% 12%No. of Banquet Covers - - 1,724 No. of Wedding Covers (for Hotels with large weddings only) - - - Total No. of Covers 45,595 41,052 47,783 -10% 16%
Ave Check per Outlet Cover 358.1 580.5 626.0 62% 8%Ave Check per Banquet Cover - - 823.7 Ave Check per Wedding Cover (for Hotels with large weddings only) - - - Ave Check per Cover - - -
Can be downloaded from Cognos
Food Safety Hygiene Audit Score - Overall (%)

18
F&B – Key Strategies To Achieve Budget Key S&M strategies/initiatives, including restaurant, banquet and catering
- Restaurant: Tie up with various Corporate sponsored promotions: eg: October fest with a Beer company or Kids special menu with a soft drink or juice companies
- TV campaign ; to showcase our Chefs and our cuisines in cook shows with various TV companies- Poster Campaign in the market at key points- Online campaign to database; have online F & B calendar for events & promos.- Catering: Sales calls to various corporate houses for conferencing business .- Special packages for diverse corporate business; For corporate retreats or team building.- Launch tailor-made menus as per the market requirement.- Sales calls for meeting/conferencing incentives.- Corporate dinners/Cocktails/lunches, for specific sectors {eg; Travel, Exporters, etc} hosted by the management.
Key F&B operating strategies/initiatives, including initiatives to enhance F&B service delivery- Enhanced training for BWCB.- Launch incentive/reward plan for MICE drivers ,eg; Event management companies.- Enhance SOE/FFNE inventory, to keep in line with Brand standards.- Continue with Special promotions in Beverages & food- Improved breakfast service to insure enhanced satisfaction.- Improve in house capture ratio.- Guest Feed back tools to be enhanced to get a more realistic responses.- Operational strategy to reduce systems costs in delivery, to maximize profitability.- Regular rotation of menus to ensure interest for regular visitors.

19
F&B – Key Strategies To Achieve Budget New innovations/changes to enhance and refresh F&B concepts, including any proposed
refurbishment/changes to F&B concepts- Have specialty food promotions once a month in restaurants & bars- Introduce Lunch specials for Golfers on weekends- Branding of the Bars by corporate identity.- BBQ weekend packages to be reworked & also re-priced to make it more attractive to locals & expatriates.- Rudra nite to be promoted more aggressively with corporate sponsorship.
Describe initiatives to extend revenue management to F&B Re-pricing of all menu items to be done. Sales % hike to the tune of 12-18% Increase the F & B component for the packages making it more cost effective Reduce Costs by Vendor identification & negotiating for more comprehensive pricing structures, with contracts ,etc Increase revenue by maximization of available space for POS.
Key best practice:
Aggressively promote MICE and Banquets to corporates, NGOs through telecalling, personal sales calls by F & B executives and associates.
Update and maintain guest profile regularly using F & B outlets and services.
Promote BBQ & Rudra nite packages to Corporates & Expatriate community for bulk reservations.

20
07 vs 06 08 vs 07MOD RevenueTelecommunications 392100 635741 1103000 62% 73%Laundry 192562 336561 380000 75% 13%Health club 7149000 9064286 12377000 27% 37%Garage 118450 232009 191000 96% -18%Golf 7782750 10579723 12077000 36% 14%Rental Income 1514582 1512492 1664400 0% 10%Total MOD Revenue 17149444 22360812 27792400 30% 24%
MOD ExpensesTelecommunications 176445 286083.45 496350 62% 73%Laundry 116848 264240 374100 126% 42%Health club 2789478 2626416 3735785GarageGolf 6791290 6815683 10233557 0% 50%Rental Income 0 0 0Total MOD Expenses 9874061 9992422.5 14839792 1% 49%
MOD GOPTelecommunications 215655 349657.55 606650 62% 73%% of Revenue 55% 55% 55% 0% 0%FTE 0 0 0
Laundry 75714 72321 5900 -4% -92%% of Revenue 39% 21% 2% -45% -93%FTE 84 72 72 0%
Health club 4359522 7953307 1843443.1 82% -77%% of Revenue 56% 75% 15% 34% -80%FTE 96 108 108 0%Garage 118450 232009 191000 96% -18%% of Revenue 100% 100% 100% 0% 0%FTE
Golf 991460 3764040 1843443.1 280% -51%% of Revenue 13% 36% 15% 179% -57%FTE 882 864 876 1%
Rental Income 1514582 1512492 1664400 0% 10%
2006 Actual
2007 Forecast
2008 Budget
Growth
MOD Budget

21
Overheads and FTE
Include explanations on key variances and other comments
Key best practice:
Multi Skilling
Reviewing the qualification, capabilities & productivity of all associates and removing the deadwoods.
Proper evaluation of associates to be practiced by HODs by purely based on performance.
07 vs 06 08 vs 07A&G Labour Costs 3848.78 3918.325 4499.4 2% 15%% of GOR 8% 5% 0%
A&G Others 5068.12693 7386.40133 9787.02893 46% 33%% of GOR 11% 10% 9%
S&M Labour Costs 1649.987 1336.089 2433.975 -19% 82%% of GOR 3% 2% 2%
S&M Others 2187.578 2854.331 5946.19162 30% 108%% of GOR 5% 4% 6%
Property Ops Labour Costs 1332.536 1359.442 1322.19 2% -3%% of GOR 3% 2% 1%
Property Ops Others 3566.8525 3355.6166 4922.65 -6% 47%% of GOR 8% 5% 5%
Utilities 10229.513 12557.7468 14697 23% 17%% of GOR 22% 18% 14%
Others% of GOR
Total overheads 27883.3734 32767.9517 43608.4356 18% 33%
% of GOR 59% 46% 41%
FTERooms 27.0 28.0 31.0 4% 11%F&B 36.0 36.0 34.0 0% -6%MODs 93.0 96.0 102.0 3% 6%A&G 27.0 27.0 33.0 0% 22%S&M 7.0 7.0 8.0 0% 14%Prop Ops 21.0 21.0 15.0 0% -29%Other departments 5.0 6.0 - 20% -100%Total Hotel FTE 216.0 221.0 223.0 2% 1%Contract labor (FTE)Outsouced (if applicable)Total FTE 216.0 221.0 223.0
2006 Actual
2007 Forecast
2008 Budget
Growth

22
Overheads – Energy Efficiency Initiatives
Highlight initiatives and actions plans to reduce energy costs
Describe key best practice/Six Sigma project ideas focusing on reducing energy costs
07 vs 06 08 vs 07
Utilities 10229.51 12557.7468 14697 23% 17%% of GOR 22% 18% 14%
% of Total Overheads 37% 38% 38%
2006 Actual
2007 Forecast
2008 Budget
Growth

23
Capital Plan
Increase of 9 new Deluxe Rooms.
Increase of three spa treatment rooms.
Procurement of vehicles.
Fire and Safety compliance as per Starwood audit.
Extension of Kitchen.
2006 Opening Balance -
Add Contribution -
Less Expenditure -
2006 Closing Balance -
2006 Opening Balance - Add Contribution - Less Expenditure - 2006 Closing Balance -
2007 Opening Balance 36,916,450.0 Add Contribution 16,500,000.0 Less Expenditure (21,000,000.0) 2007 Closing Balance 32,416,450.0
2008 Opening Balance 32,416,450.0 Add Budgeted Contribution 71,662,325.0 Less Budgeted Expenditure (71,662,325.0) 2008 Closing Balance 32,416,450.0
In 000s (Local Currency) 2008 BudgetProject Description Priority Q1 Q2 Q3 Q4Fire and Safety 1 5671390 2671390 1000000 1000000 1000000Laptop, Computers & Printers 800000 300000 200000 200000 100000
Vehicles for GM, Sales Asso & Guests 1 6500000 3500000 1000000 1000000 1000000Addition of Guest Rooms as per Brand Standard1 2130750 1000000 500000 330000 300750Increase in Spa Facility 1 1323000 523000 300000 300000 200000Banquet Hall 1 9000000 3000000 2000000 2000000 2000000
Total Project Cost

24
SPG Objectives and Strategies
2008 Key Objectives and Initiatives to Drive Enrolment, Redemption and Recognition
- Annual cash incentive to be given to the employee who achieves highest enrollment of SPG members.
- Appointment of one Guest Relation Manager for SPG.
- Front Office to take initiative to find out whether a guest is SPG member or not.
- Non resident guests to be encouraged by F & B and Spa to become SPG member.
Room Nights
Qualifed Enrolments
Free Nights Redemption
US$
In Hotel Redemption
US$2006 Actual 325 - - -
2007 YTD 280 - - - 2007 Budget - - - YTD Achievement over Budget
2008 Budget 400 N/A N/A

25
Human Resources – Objectives and Initiatives
General HR Overview:
- Two HODs have left the property in last one year.
- Employee turnover - 220 in 2007.
Major HR Challenges:
- - Absence of qualified HRM.
- - Emergence of new workers union in the property ( Maoist )
- - Lack of participation in the Starwood training programs.
- - Lack of participation in the HR tools.
Plans to address Challenges
- - Appointment of a Qualified HR & Training Manager
- - Ensure participation in Starwood programs.
List new initiatives to address building organization bench strength:
- - Review the qualification & abilities of existing HODs & to strengthen their skills by providing proper training and exposure to Starwood tools.
- - Hiring of new HODs to be approved by Starwood.
List department heads and above positions which are vacant at the moment:
- HR/Training Manager
- Director F & B
- Revenue Manager
- Spa Manager

26
Projects Completed or in Progress
Project # Project Title Depts Affected
Process Impacted
Project Classification
Category
Benefit Type
Phase Total Financial Benefit Impact
NRS’000
Addition of a new and larger banquet hall F & B and Rooms Division
MICE Construction 1 Revenue Generation
5832
2007 Year End Projects, Resources and Forecasted Financials
Director of Six Sigma, Black Belt Name :
Green Belts Name Job Title *Active / Inactive
Inactive
*(Active is defined as completing at least 1 project in 2007)
27
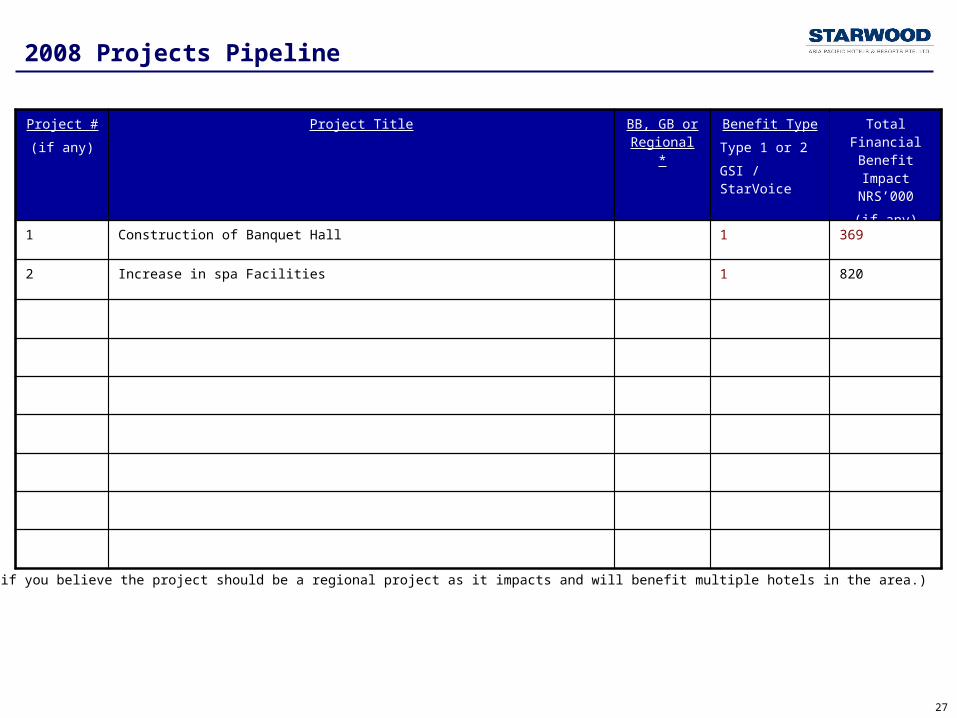
2008 Projects Pipeline
Project #
(if any)
Project Title BB, GB or Regional *
Benefit Type
Type 1 or 2
GSI / StarVoice
Total Financial Benefit Impact
NRS’000
(if any)
1 Construction of Banquet Hall 1 369
2 Increase in spa Facilities 1 820
*(Enter Regional if you believe the project should be a regional project as it impacts and will benefit multiple hotels in the area.)

28
2008 Six Sigma Budget Cost Summary
Training Type Training Information & Budget Requirements # of Participants
Total Cost in NRS
GB Training High Potential GMs Candidates must be GB trained. Goal is to have minimum 3 Active Green Belts.
1 3,20,000
Individual EXCOM Required SSC Training
New Executive Committee Members with no previous SSC Training

29
Financial Risks and Opportunities (not included in Budget)Highlight any risks (ie downsides or negative impact) and opportunities (ie upsides or positive impact) in the Budget.
Quantify the impact of these risks and opportunities on GOP and Starwood EBITDA
Note that the financial impact of these risks and opportunities are NOT included in the Budget (upsides or downsides to the Budget)
R Delay in construction of Spa Rooms High -820
R Constitutional Assembly Election not held in time High -8,000
Sub-total - Risks -9,189
O Increase in operation of International Airlines High 4,000
Sub-total - Opportunities 4,000
TOTAL RISKS & OPPORTUNITIES -5,189
Net Risks & Opportunities - Impact on GOP Low 0Medium 0
High -5,189Total -5,189
Net Risks & Opportunities - Impact on Starwood EBITDA -460