Embed Size (px)
Citation preview

Q1. Tissue fluid is formed when water and small molecules pass out of capillaries at their arterial end. The diagram shows some pressures involved in tissue fluid formation. The relative lengths of the arrows indicate the size of the pressures.
(a) What causes the pressure represented by the arrow labelled A?
......................................................................................................................
...................................................................................................................... (1)
(b) Explain why there is a net loss of water from a capillary at the arterial end.
......................................................................................................................
......................................................................................................................
......................................................................................................................
...................................................................................................................... (2)
(c) The total volume of fluid that passes from the capillaries to the surrounding tissue fluid is normally greater than the volume that is reabsorbed into them. Describe what happens to this extra fluid.
......................................................................................................................
......................................................................................................................
......................................................................................................................
...................................................................................................................... (2)
Page 1 of 28

(d) Tissue fluid accumulates in the tissues of people who do not eat enough protein. Explain why.
......................................................................................................................
......................................................................................................................
......................................................................................................................
...................................................................................................................... (2)
(Total 7 marks)
Q2. (a) When first hatched, the young of some species of fish are less than 2 mm long. Explain how these young fish get enough oxygen to their cells without having gills.
......................................................................................................................
......................................................................................................................
......................................................................................................................
...................................................................................................................... (2)
(b) Mackerel are fast swimming fish whereas toadfish only swim slowly. The table shows some features of the gills of these fish.
Use evidence from the table to explain how mackerel are able to swim faster than toadfish.
......................................................................................................................
......................................................................................................................
......................................................................................................................
......................................................................................................................
...................................................................................................................... (3)
(Total 5 marks)
Thickness of lamellae / µm
Number of lamellae per mm of gill length
Mackerel 5 32
Toadfish 35 8
Page 2 of 28

Q3. The diagram shows some blood vessels in muscle tissue.
(a) (i) Which type of blood vessel is X?
............................................................................................................. (1)
(ii) Name two substances which are at a higher concentration in the blood at A than in the blood at B.
1 ..........................................................................................................
2 .......................................................................................................... (1)
(b) The table shows the mean diameter of the lumen and the rate of blood flow in some types of human blood vessel.
Using information in the table, explain what causes the rate of blood flow to be slower in capillaries than in other vessels.
......................................................................................................................
......................................................................................................................
......................................................................................................................
...................................................................................................................... (2)
Type of blood vessel Mean diameter of lumen / μm
Rate of blood flow / cm s–1
Artery 400 10 – 40
Arteriole 30 0.1 – 10
Capillary 8 less than 0.1
Page 3 of 28

(c) (i) Which type of blood vessel has most elastic tissue in its wall?
............................................................................................................. (1)
(ii) How does this elastic tissue help to smooth out the flow of blood in the blood vessel?
.............................................................................................................
.............................................................................................................
.............................................................................................................
............................................................................................................. (2)
(Total 7 marks)
Q4. (a) Students measured the rate of transpiration of a plant growing in a pot under different environmental conditions. Their results are shown in the table.
During transpiration, water diffuses from cells to the air surrounding a leaf.
Conditions Transpiration rate / g h–1
A Still air 15° 1.2
B Moving air 15° 1.7
C Still air 25° 2.3
(i) Suggest an explanation for the difference in transpiration rate between conditions A and B.
.............................................................................................................
.............................................................................................................
.............................................................................................................
.............................................................................................................
............................................................................................................. (2)
Page 4 of 28

(ii) Suggest an explanation for the difference in transpiration rate between conditions A and C.
.............................................................................................................
.............................................................................................................
.............................................................................................................
.............................................................................................................
............................................................................................................. (2)
(b) Scientists investigated the rate of water movement through the xylem of a twig from a tree over 24 hours. The graph shows their results. It also shows the light intensity for the same period of time.
(i) Describe the relationship between the rate of water movement through the xylem and the light intensity.
.............................................................................................................
.............................................................................................................
............................................................................................................. (1)
Page 5 of 28
(ii) Explain the change in the rate of water movement through the xylem between 06.00 and 12.00 hours.
.............................................................................................................
.............................................................................................................
.............................................................................................................
.............................................................................................................
............................................................................................................. (2)
(iii) The scientists also measured the diameter of the trunk of the tree on which the twig had been growing. The diameter was less at 12.00 than it was at 03.00 hours.
Explain why the diameter was less at 12.00 hours.
.............................................................................................................
.............................................................................................................
.............................................................................................................
.............................................................................................................
............................................................................................................. (2)
Page 6 of 28

(c) Arteries and arterioles take blood away from the heart.
Explain how the structures of the walls of arteries and arterioles are related to their functions.
......................................................................................................................
......................................................................................................................
......................................................................................................................
......................................................................................................................
......................................................................................................................
......................................................................................................................
......................................................................................................................
......................................................................................................................
......................................................................................................................
......................................................................................................................
......................................................................................................................
...................................................................................................................... (6)
(Total 15 marks)
Q5. (a) The diagram represents the flow of water and blood through the gills of a fish. The figures give relative oxygen concentrations.
Use the information in diagram to explain the advantage of the countercurrent flow.
......................................................................................................................
......................................................................................................................
......................................................................................................................
......................................................................................................................
...................................................................................................................... (2)
Page 7 of 28

(b) In the ventilation cycle of a fish, water enters the mouth cavity and then passes through the gills into the opercular cavity. The graph shows the difference in pressure between the mouth cavity and the opercular cavity.
(i) Calculate the number of ventilation cycles per minute of the fish. Show your working.
Answer ...................................... (2)
(ii) Between 0 and 0.35 s the pressure in the mouth cavity is higher than the pressure in the opercular cavity. What causes this pressure difference?
.............................................................................................................
.............................................................................................................
............................................................................................................. (2)
(iii) What causes the pressure difference to fall below zero?
.............................................................................................................
.............................................................................................................
............................................................................................................. (2)
(Total 8 marks)
Page 8 of 28

Q6. The pressure of the blood in an artery was measured during a cardiac cycle. The minimum pressure was 9.6 kPa and the maximum pressure was 13.4 kPa.
(a) Describe how the increase in pressure of the blood in the artery results from the events in the cardiac cycle.
......................................................................................................................
......................................................................................................................
......................................................................................................................
...................................................................................................................... (2)
(b) The elastin fibres in the wall of the artery help to smooth out the flow of blood. What happens to these fibres as the pressure of the blood in the artery changes?
......................................................................................................................
......................................................................................................................
......................................................................................................................
...................................................................................................................... (2)
(c) Give one way in which the structure of the wall of an artery is similar to the structure of the wall of a capillary.
......................................................................................................................
...................................................................................................................... (1)
(Total 5 marks)
Q7. (a) Describe the features of fish gills that give them a large surface area.
......................................................................................................................
......................................................................................................................
......................................................................................................................
...................................................................................................................... (2)
Page 9 of 28

The graph shows the relationship between gill surface area and body mass for three species of fish.
(b) (i) Describe the relationships between gill surface area, mass and swimming speed shown in the diagram.
.............................................................................................................
............................................................................................................. (1)
(ii) Explain the relationship between gill surface area and swimming speed.
.............................................................................................................
.............................................................................................................
.............................................................................................................
............................................................................................................. (2)
(Total 5 marks)
Page 10 of 28

Q8. The diagram shows a cross-section of a blood vessel.
(a) Name layer C.
...................................................................................................................... (1)
(b) Calculate the actual diameter of the lumen of this blood vessel in millimetres. Show your working.
Answer ............................................. mm (2)
(c) The aorta has many elastic fibres in its wall. An arteriole has many muscle fibres in its wall.
(i) Explain the importance of elastic fibres in the wall of the aorta.
.............................................................................................................
.............................................................................................................
.............................................................................................................
............................................................................................................. (2)
(ii) Explain the importance of muscle fibres in the wall of an arteriole.
.............................................................................................................
.............................................................................................................
.............................................................................................................
............................................................................................................. (2)
Page 11 of 28

(d) The graph shows the rate of blood flow in different blood vessels. It also shows the total cross-sectional area of these blood vessels.
(i) The rate of blood flow decreases from the aorta to the capillaries. Use information from the graph to explain why.
.............................................................................................................
.............................................................................................................
............................................................................................................. (1)
(ii) Efficient exchange of substances in the capillaries is linked to the rate of blood flow. Explain how.
.............................................................................................................
.............................................................................................................
............................................................................................................. (1)
(Total 9 marks)
Page 12 of 28
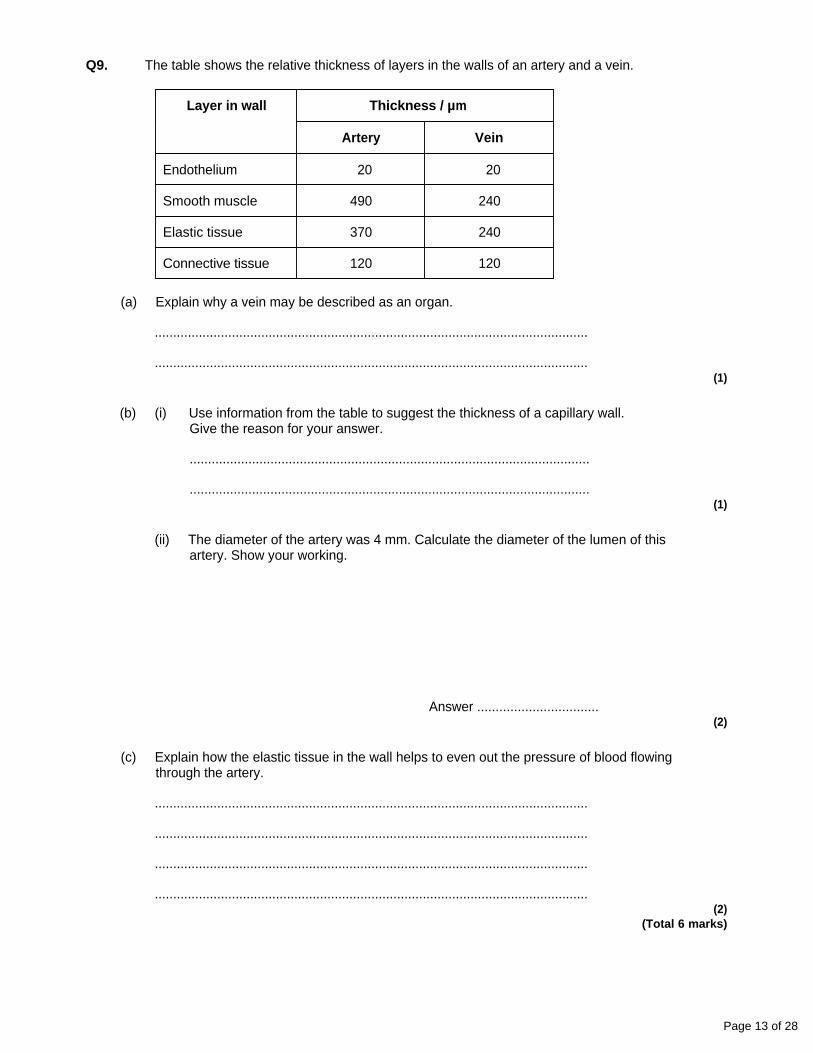
Q9. The table shows the relative thickness of layers in the walls of an artery and a vein.
(a) Explain why a vein may be described as an organ.
......................................................................................................................
...................................................................................................................... (1)
Layer in wall Thickness / µm
Artery Vein
Endothelium 20 20
Smooth muscle 490 240
Elastic tissue 370 240
Connective tissue 120 120
(b) (i) Use information from the table to suggest the thickness of a capillary wall. Give the reason for your answer.
.............................................................................................................
............................................................................................................. (1)
(ii) The diameter of the artery was 4 mm. Calculate the diameter of the lumen of this artery. Show your working.
Answer ................................. (2)
(c) Explain how the elastic tissue in the wall helps to even out the pressure of blood flowing through the artery.
......................................................................................................................
......................................................................................................................
......................................................................................................................
...................................................................................................................... (2)
(Total 6 marks)
Page 13 of 28

Q10. The diagram shows vessels in a small piece of tissue from a mammal. The chart shows the hydrostatic pressure of the blood as it flows through the capillary.
(a) Name the fluid contained in vessel X. ........................................................................ (1)
(b) Draw an arrow on the capillary to show the direction of the flow of blood. Describe the evidence from the chart to support your answer.
......................................................................................................................
...................................................................................................................... (1)
(c) Describe and explain how water is exchanged between the blood and tissue fluid as blood flows along the capillary.
......................................................................................................................
......................................................................................................................
......................................................................................................................
......................................................................................................................
......................................................................................................................
......................................................................................................................
......................................................................................................................
...................................................................................................................... (4)
Page 14 of 28

(d) Shrews are small mammals. Their tissues have a much higher respiration rate than human tissues. The graph shows the position of the oxygen haemoglobin dissociation curves for a shrew and a human.
Explain the advantage to the shrew of the position of the curve being different from that of a human.
......................................................................................................................
......................................................................................................................
......................................................................................................................
......................................................................................................................
......................................................................................................................
...................................................................................................................... (3)
(Total 9 marks)
Page 15 of 28

Q11. This question should be written in continuous prose, where appropriate. Quality of Written Communication will be assessed in the answer.
(a) Explain how the ventilation mechanism of a fish and the structure of its gills result in the efficient uptake of oxygen from water.
......................................................................................................................
......................................................................................................................
......................................................................................................................
......................................................................................................................
......................................................................................................................
......................................................................................................................
......................................................................................................................
......................................................................................................................
......................................................................................................................
......................................................................................................................
......................................................................................................................
......................................................................................................................
......................................................................................................................
......................................................................................................................
...................................................................................................................... (6)
Table 1 compares some features of water and air.
Table 1
Feature Water Air
Relative density 1000 1
Maximum concentration of oxygen / cm3 dm–3 9 130
Page 16 of 28
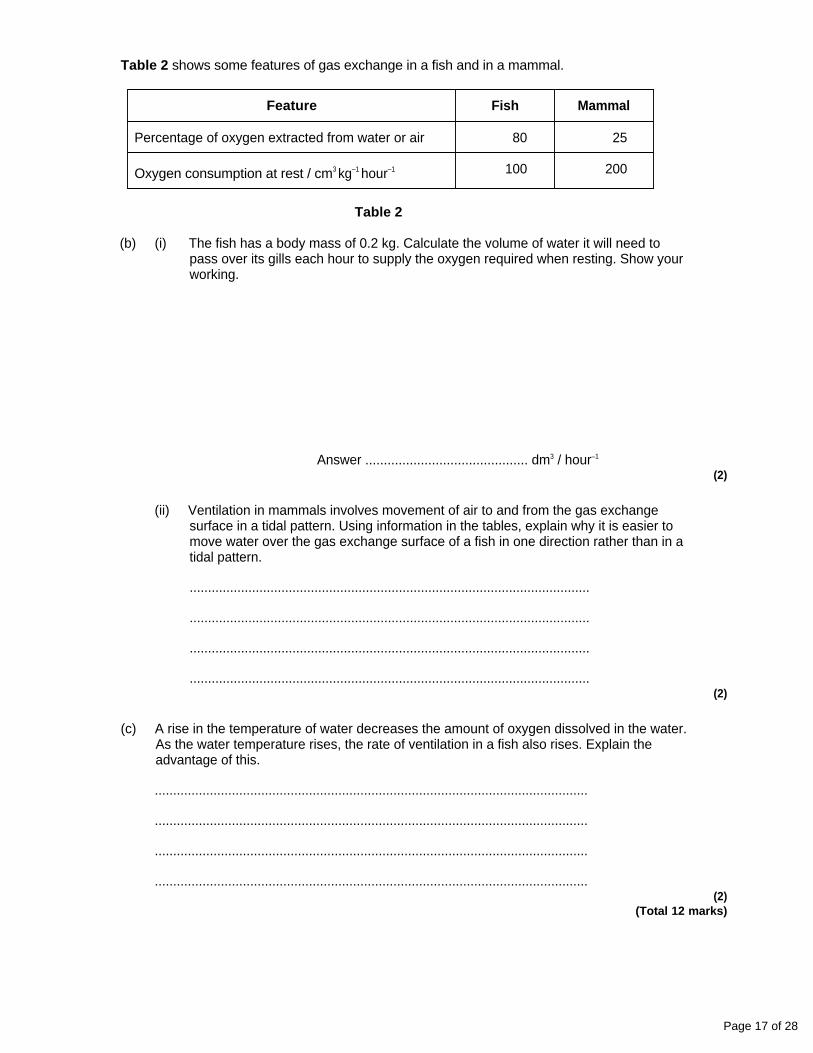
Table 2 shows some features of gas exchange in a fish and in a mammal.
Table 2
(b) (i) The fish has a body mass of 0.2 kg. Calculate the volume of water it will need to pass over its gills each hour to supply the oxygen required when resting. Show your working.
Answer ............................................ dm3 / hour–1
(2)
Feature Fish Mammal
Percentage of oxygen extracted from water or air 80 25
Oxygen consumption at rest / cm3 kg–1 hour–1 100 200
(ii) Ventilation in mammals involves movement of air to and from the gas exchange surface in a tidal pattern. Using information in the tables, explain why it is easier to move water over the gas exchange surface of a fish in one direction rather than in a tidal pattern.
.............................................................................................................
.............................................................................................................
.............................................................................................................
............................................................................................................. (2)
(c) A rise in the temperature of water decreases the amount of oxygen dissolved in the water. As the water temperature rises, the rate of ventilation in a fish also rises. Explain the advantage of this.
......................................................................................................................
......................................................................................................................
......................................................................................................................
...................................................................................................................... (2)
(Total 12 marks)
Page 17 of 28
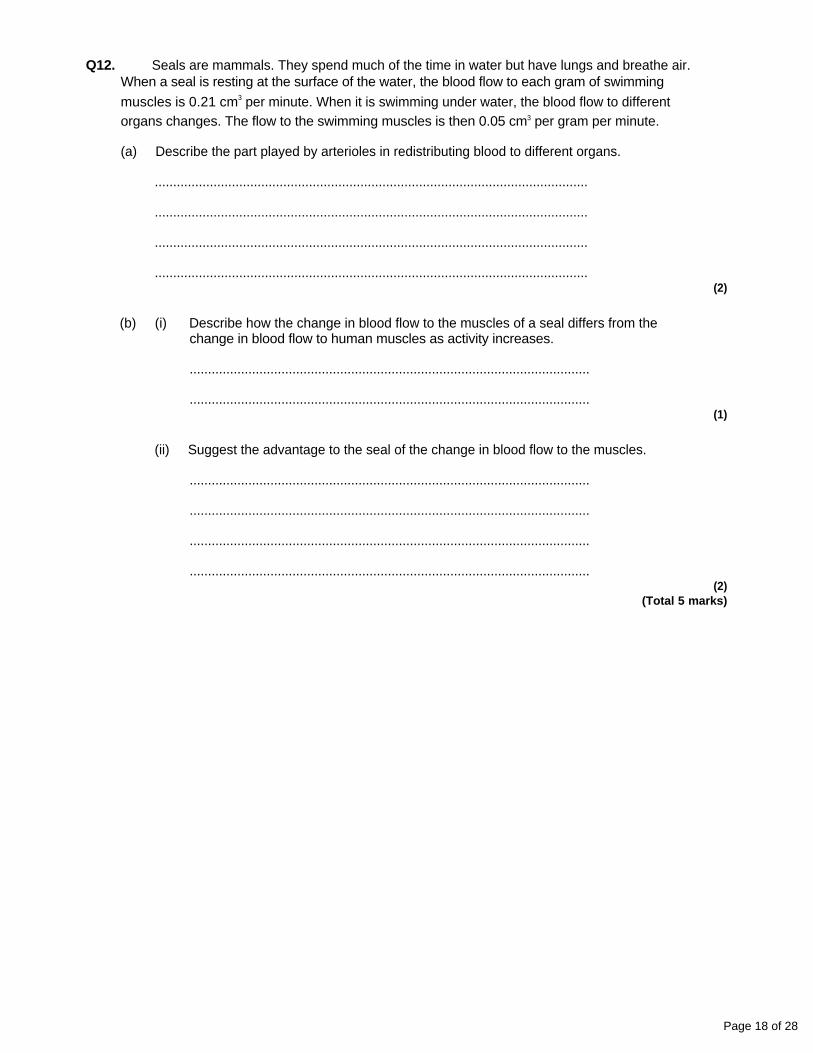
Q12. Seals are mammals. They spend much of the time in water but have lungs and breathe air. When a seal is resting at the surface of the water, the blood flow to each gram of swimming
muscles is 0.21 cm3 per minute. When it is swimming under water, the blood flow to different organs changes. The flow to the swimming muscles is then 0.05 cm3 per gram per minute.
(a) Describe the part played by arterioles in redistributing blood to different organs.
......................................................................................................................
......................................................................................................................
......................................................................................................................
...................................................................................................................... (2)
(b) (i) Describe how the change in blood flow to the muscles of a seal differs from the change in blood flow to human muscles as activity increases.
.............................................................................................................
............................................................................................................. (1)
(ii) Suggest the advantage to the seal of the change in blood flow to the muscles.
.............................................................................................................
.............................................................................................................
.............................................................................................................
............................................................................................................. (2)
(Total 5 marks)
Page 18 of 28

Q13. (a) The photograph shows part of the gill of a fish as seen through a light microscope. It is magnified × 400.
(i) Explain how the structure of the gill makes oxygen uptake efficient.
.............................................................................................................
.............................................................................................................
.............................................................................................................
............................................................................................................. (2)
(ii) Water containing dissolved oxygen flows over the gill in the opposite direction to the blood flow inside. Explain why this arrangement is important for efficient oxygen uptake.
.............................................................................................................
.............................................................................................................
.............................................................................................................
............................................................................................................. (2)
(b) Describe how the gills of a fish are ventilated after water has entered through its mouth.
......................................................................................................................
......................................................................................................................
......................................................................................................................
......................................................................................................................
......................................................................................................................
...................................................................................................................... (3)
Page 19 of 28

(c) There is a one-way flow of water over the gills of a fish whereas there is a two-way flow of air in the lungs of a mammal. Suggest one advantage to a fish of this one-way flow of water over its gills.
......................................................................................................................
...................................................................................................................... (1)
(Total 8 marks)
Q14. The graph shows the surface area to volume ratio of cubes of different size.
(a) Elephant seals are mammals that live in water that has a temperature of between 0 °C and 4 °C. Elephant seals are very large. Use the graph to explain the advantage of a large size to elephant seals.
......................................................................................................................
......................................................................................................................
......................................................................................................................
...................................................................................................................... (2)
(b) (i) Describe how single-celled organisms exchange respiratory gases.
.............................................................................................................
............................................................................................................. (1)
Page 20 of 28
(ii) This method of gas exchange is only possible in very small organisms. Explain why.
.............................................................................................................
.............................................................................................................
.............................................................................................................
............................................................................................................. (2)
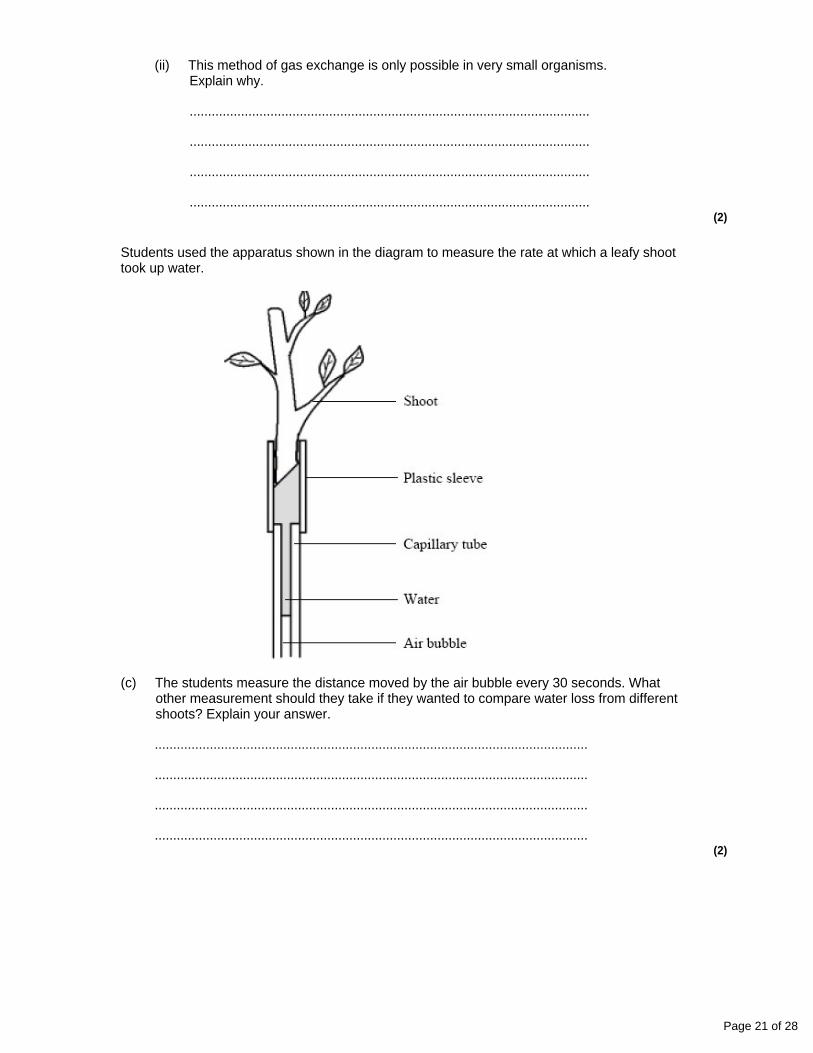
Students used the apparatus shown in the diagram to measure the rate at which a leafy shoot took up water.
(c) The students measure the distance moved by the air bubble every 30 seconds. What other measurement should they take if they wanted to compare water loss from different shoots? Explain your answer.
......................................................................................................................
......................................................................................................................
......................................................................................................................
...................................................................................................................... (2)
Page 21 of 28
(d) The students plotted the distance moved by the air bubble against time on a graph. Describe how they could use the graph to calculate the mean rate of water uptake.
......................................................................................................................
......................................................................................................................
......................................................................................................................
...................................................................................................................... (2)
(e) An insect lives in air. Describe how the insect is able to obtain oxygen and limit water loss.
......................................................................................................................
......................................................................................................................
......................................................................................................................
......................................................................................................................
......................................................................................................................
......................................................................................................................
......................................................................................................................
......................................................................................................................
......................................................................................................................
......................................................................................................................
......................................................................................................................
...................................................................................................................... (6)
(Total 15 marks)
Q15. (a) The pulmonary artery and aorta are described as organs. Explain why.
......................................................................................................................
...................................................................................................................... (1)
(b) Give one way in which blood in the pulmonary artery is different from blood in the aorta.
......................................................................................................................
...................................................................................................................... (1)
Page 22 of 28
(c) Give two ways in which the structure of a artery is different from the structure of a vein.
1 ...................................................................................................................
......................................................................................................................
2 ...................................................................................................................
...................................................................................................................... (2)
(d) The maximum blood pressure in the aorta changes as the distance from the heart increases.
(i) Describe how the blood pressure changes.
.............................................................................................................
............................................................................................................. (1)
(ii) What causes this change in maximum blood pressure?
.............................................................................................................
............................................................................................................. (1)
(Total 6 marks)
Q16. The diagram shows tissue fluid and cells surrounding a capillary.
(a) Name fluid F.
...................................................................................................................... (1)
(b) Give one way in which fluid F is different from tissue fluid.
...................................................................................................................... (1)
Page 23 of 28
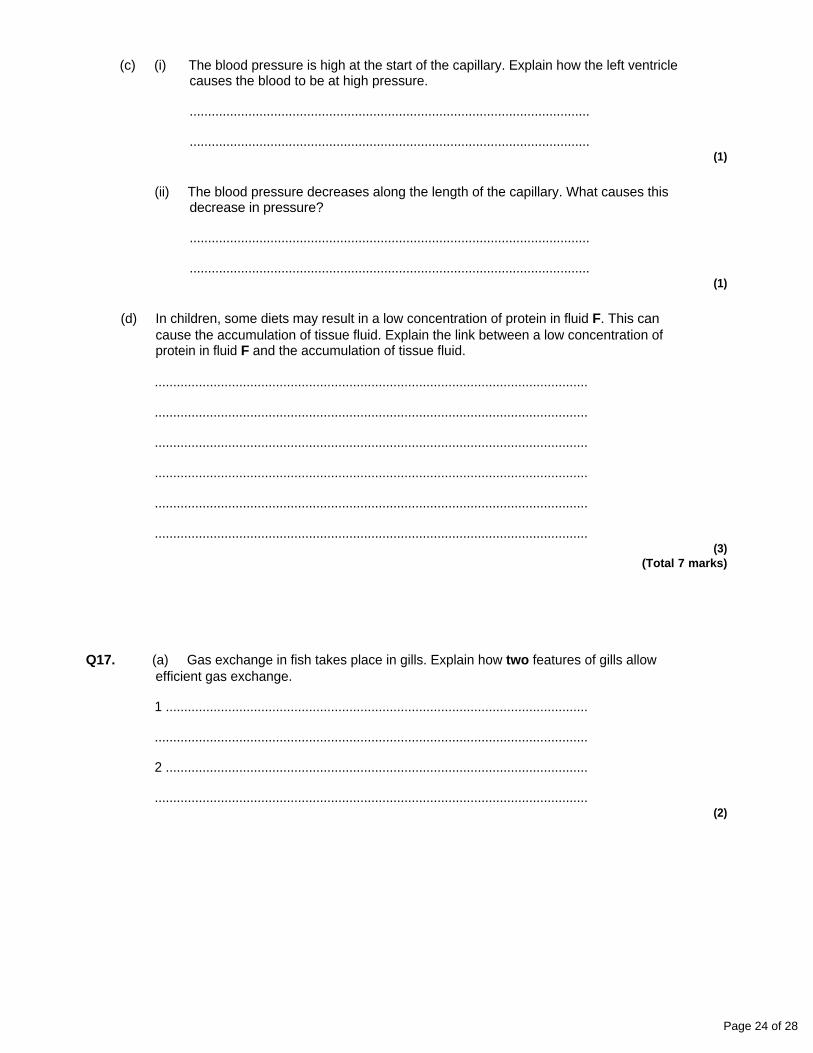
(c) (i) The blood pressure is high at the start of the capillary. Explain how the left ventricle causes the blood to be at high pressure.
.............................................................................................................
............................................................................................................. (1)
(ii) The blood pressure decreases along the length of the capillary. What causes this decrease in pressure?
.............................................................................................................
............................................................................................................. (1)
(d) In children, some diets may result in a low concentration of protein in fluid F. This can cause the accumulation of tissue fluid. Explain the link between a low concentration of protein in fluid F and the accumulation of tissue fluid.
......................................................................................................................
......................................................................................................................
......................................................................................................................
......................................................................................................................
......................................................................................................................
...................................................................................................................... (3)
(Total 7 marks)
Q17. (a) Gas exchange in fish takes place in gills. Explain how two features of gills allow efficient gas exchange.
1 ...................................................................................................................
......................................................................................................................
2 ...................................................................................................................
...................................................................................................................... (2)
Page 24 of 28
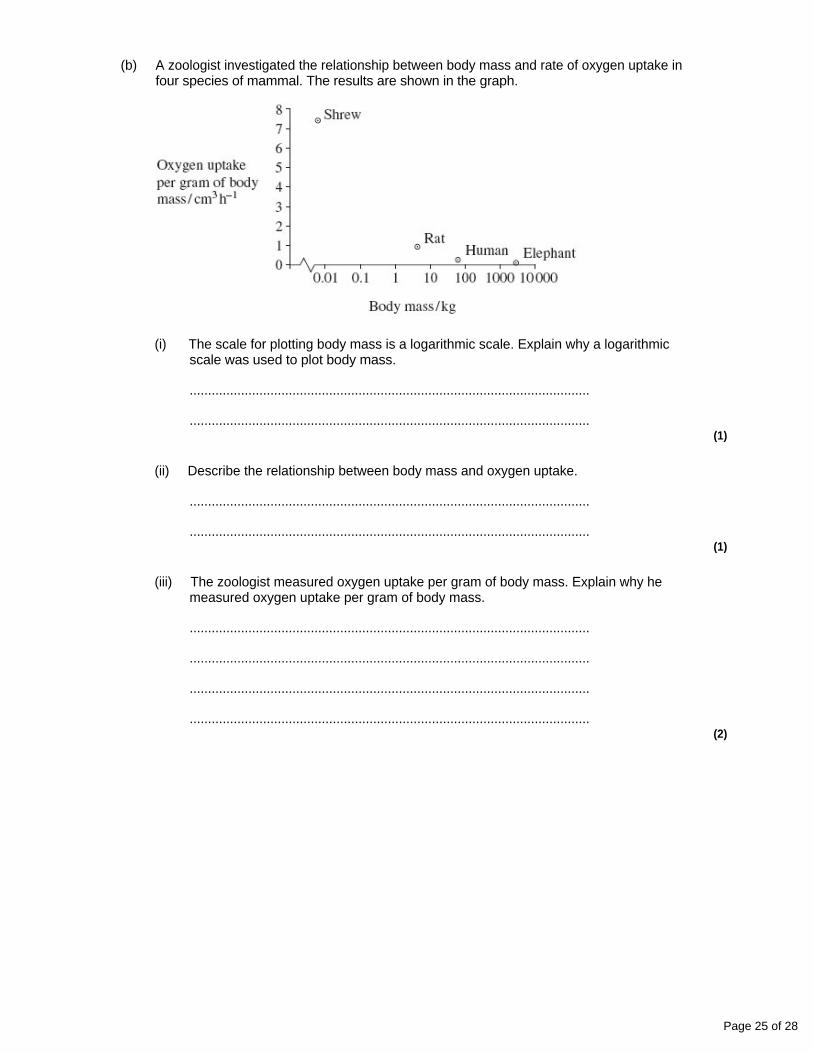
(b) A zoologist investigated the relationship between body mass and rate of oxygen uptake in four species of mammal. The results are shown in the graph.
(i) The scale for plotting body mass is a logarithmic scale. Explain why a logarithmic scale was used to plot body mass.
.............................................................................................................
............................................................................................................. (1)
(ii) Describe the relationship between body mass and oxygen uptake.
.............................................................................................................
............................................................................................................. (1)
(iii) The zoologist measured oxygen uptake per gram of body mass. Explain why he measured oxygen uptake per gram of body mass.
.............................................................................................................
.............................................................................................................
.............................................................................................................
............................................................................................................. (2)
Page 25 of 28

(iv) Heat from respiration helps mammals to maintain a constant body temperature.
Use this information to explain the relationship between body mass and oxygen uptake shown in the graph.
.............................................................................................................
.............................................................................................................
.............................................................................................................
.............................................................................................................
.............................................................................................................
............................................................................................................. (3)
(Total 9 marks)
Q18. The diagram shows some of the large blood vessels in a mammal.
(a) Add arrows to the diagram to show the direction of blood flow in each of the blood vessels A to E.
(1)
(b) (i) Which of blood vessels A to E is the hepatic portal vein?
(1)
Page 26 of 28
(ii) Which of blood vessels A to E contains blood at the lowest pressure?
(1)
(c) Complete the table to show two differences between the structure of vessel C and the structure of vessel E.
(2)
Structural feature Vessel C Vessel E
(d) Blood vessel B contains smooth muscle in its walls. Explain how this muscle may reduce the blood flow to the small intestine.
......................................................................................................................
......................................................................................................................
......................................................................................................................
...................................................................................................................... (2)
(e) Elastic tissue in the walls of blood vessel A helps to even out the pressure of blood through this vessel. Explain how.
......................................................................................................................
......................................................................................................................
......................................................................................................................
...................................................................................................................... (2)
(Total 9 marks)
Page 27 of 28

Page 28 of 28