Embed Size (px)
Citation preview

1 زعــد. هالة زع

2
Instrumental Analysis
3 hours lecture
spectrophotomtery
potentiometry
fluorimetry
conductometry
2 hour practical
Flam spectroscopy
polarography

3
Total Marks 100
Semester work 10
Fifth week
5
Mid term15
Practical25+5
Oral10
Final Exam
30
PHC 224Instrumental Analysis
Love Chemistry

4
Molecular Absorption Spectrophotometry
Light and radiationElectromagnetic spectrumLight as energyTypes of electromagnetic transitionsInteraction of Photons with matterAbsorption spectrumChromophores, and auxochromesFactors affecting absorption spectrum (pH, solvent)Beer’s law and quantitative analysisDeviation from Beer’s lawInstrumentation (Basic component of spectrophotometer)Analysis of some pharmaceutical drugs

5
Spectroscopy is the study of interaction of spectrum of
light with a substance to be analyzed, for its:
- Identification (qualitative analysis)
- Determination of its amount (quantitative analysis).
It is one of the different forms of radiant
energy called electromagnetic radiations
(EMR) due presence of both electric and
magnetic components.
Spectrophotometry
What’s spectrophotometry

6
Light exhibits wave property during its propagation and energy particle during its interaction with matter.
The double nature of light (Waves and particles) is known as
dualism.
Dual nature of
light
Light energy is transmitted in the form of waves
Wave length (λ)
It is the distance between two identical points in successive waves.
Its unit is nm = 10-9m=10 Ao
1. Wave property

2- Frequency ()
• It is the number of waves per second
• Its unit is sec-1 or (CPS) or Hertz (Hz)
= C/ λ
3-Velocity of light (C)
Light propagates at the highest
known velocity= 300,000Km/sec.

2. par t ic les proper ty (light as energy)
Light consist of energy packets, known as photons.
The atom or molecule can emit or absorb a discrete quantity of energy i.e fixed amount of energy called “Quanta”.The energy of a single quantum is proportional to the frequency i.e.
E α E = h
h : is Plank’s constant = 6.63 x 10⁻³⁴ J.s
= C/ λ
E = h C/ λ
C: 3 x 10⁸ m/s

- What is the energy emitted at 450 nm by CuCl2 ?
E = h = h C/ Solution
It is so
simple
=(6.63 x 10⁻³⁴ J.s) (3 x 10⁸ m/s) / 450 x 10-9 m = 4.4 x 10⁻¹⁹ J
•If the energy difference between the ground state of an atom and its excited state is 4.4 x 10 -7J, what is the wavelength of the photon required to produce this transition? (h= 6.63 x 10⁻³⁴ J.s, C= 3 x 10⁸ m/s)

10
Microwave
Radio wave
IR-radiation
X-ray
Gamma-radiation
11
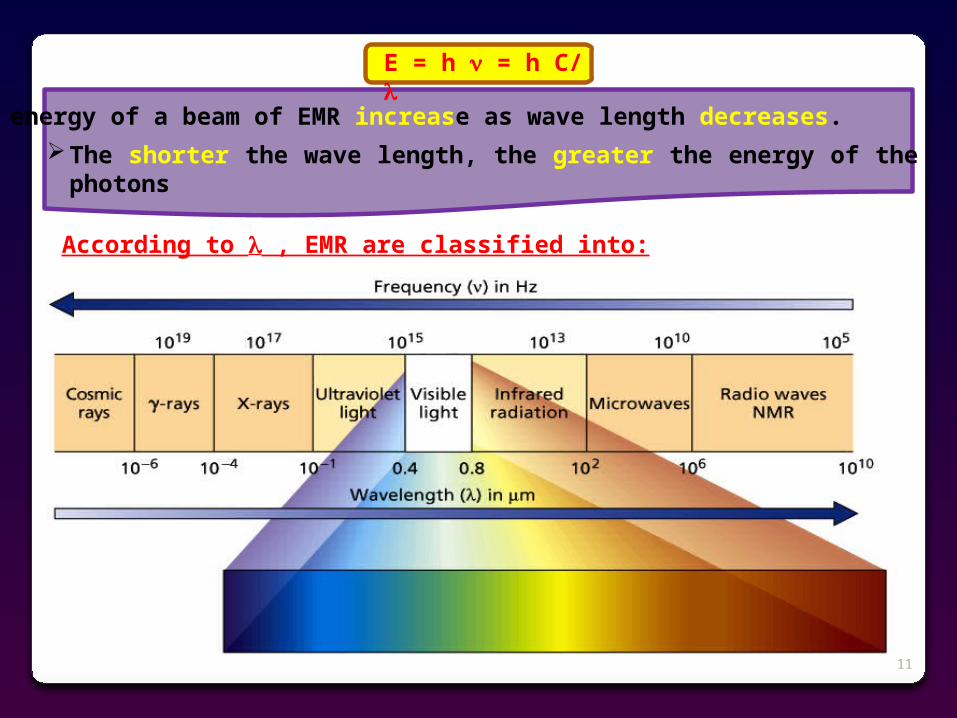
energy of a beam of EMR increase as wave length decreases.
The shorter the wave length, the greater the energy of the photons
According to , EMR are classified into:
E = h = h C/

12
For analytical purposes we use the region of I.R, visible and U.V radiations
x-rays U.V VIS I.R Microwaves Radio waves
Visible radiation part (day light) consist of some colored radiations, which are, red, orange, yellow, green, blue, indigo and violet
If we observe the visible radiations of all wavelengths, we see white light
A beam containing several wavelengths is called polychromatic light.
U.V range (200-400 nm) which contain shorter carrying more energy photon more than a beam of visible range(400-800 nm), and visible range more than I.R range (>800nm).
A beam of light carrying radiation of only one discrete is said to be
monochromatic
UV violet indigo blue green yellow Orange Red IR

13
Interaction of a substance with EMR
Absorption of radiant energy by a substance molecule may occurs in three ways:
1- Raising electrons to a higher energy level (transitional energy), when molecule absorb visible and U.V region.
2- Raising the Vibration of the nuclei (Vibrational energy), when the molecule absorb I.R region.
3- Increasing rotation of the molecule around the axis (rotational energy), when the molecule absorb in F.I.R region.
The relative energies of transitional, vibrational and rotational are roughly in the order of 10000:100:1

14
The energy of transition is given by the following:
E = Es - Eg = h = h C/
Excited state Es
Ground state Eg
Emission of radiant energy
Absorbed energy doesn’t accumulate in electronic system of a molecule. If an excited electron returns to the
ground state, it may lose absorbed energy in the form of heat, light or molecular collision.
When excited electron returns to the ground state via second excited state, light is emitted as fluorescence or phosphorescence.
Excited state Es
Ground state Eg

15
TYPES OF ELECTRONIC TRANSITION
The outer electrons in an organic molecule may occupy one of three different energy levels:
1- Sigma () electrons :They are bonding electrons posses the lowest energy level ( it is the most stable).
2- Pi () electrons: They are bonding electrons of higher energy than sigma electrons.
3- Non-bonding (n) electrons: They are of atomic orbital of hetero atoms (N,O, halogen or S) which don’t participate in bonding, they usually occupy the highest level of ground state.
In excited state electrons occupy an antibonding energy level denoted as * and the transition is termed -* transition. -electrons occupy the antibonding * level, while n electrons occupy either * or *.

16
Electronic Transitions and UV-visible Spectra in
Molecules
CH2 CH OH
ground state
excited state

17
Spectra-structure correlation
The absorbance of EMR in the UV-VIS regions depends on the structure of organic molecule
Absorbance of EMR by organic molecule is achieved by chromophoric groups(chromophores) assisted by auxochromes, where the electrons of absorbing molecule is excited, i.e it undergo transition from the ground state to the excited state.
Chromophore
C C C O
,
N O,
it is unsaturated group which is responsible for electronic absorption e.g
Auxochrome
It is a saturated group which, when attached to a chromophore, alters both the and intensity of absorption maximum e.g
-OH, - NH2, - ClAll auxochromes have one or more non-bonding pair of electrons.

18
Absorption spectrum is obtained by plotting Absorbance (A) as a function of wavelength ().
Absorption spectrum may show a shoulder or even no absorption characteristics.
It is characteristic for each molecule, therefore it is used for identification of a chemical substance (qualitative analysis).
It has characteristic shape which show the of maximum absorbance (max).

19
UV spectra of different Organic
compound

20
max is used for quantitative measurement
in order to :
1-increase sensitivity
. 2-minimize error of the analytical method

21
Compounds containing only -electrons are the saturated hydrocarbons which absorbs <170nm (i.e.) in the far UV. They are transparent in the near UV (200-300nm) making them ideal solvents for other compounds to be studied in this region.
Saturated compounds containing heteroatoms(
Saturated compounds containing heteroatoms(
However, their intense absorption usually extends to the edge of the near UV producing end absorption (Cut off
wavelength) in the 200-220nm region.
Cut off l
l220200
lmax of solvent
Far UVnear UV
Abs
orba
nce
Wavelength, , generally in nanometers (nm)
0.400 800200
UV Visible
Solvent Cut off
What’s meant??

22
Solvents for UV (showing high energy cutoffs)
Solvent Cut-off Solvent Cut-off
Water 205nm CCl4 265 nm
Ethanol 210 nm Chloroform 245 nm
Methanol 210 nm THF 220 nm
Ether 210 nm CH2Cl2 235 nm
Acetone 300 nm Dioxane 220 nm
Benzene 280 nm

23
1- Bathochromic shift (or red shift)
It is the shift of max to a longer wavelength due to substitution with certain functional groups (e.g. –OH and –NH2) and conjugation
2- Hypsochromic shift (or blue shift)It is the shift of max to a shorter wavelength due to removal of conjugation
3- Hyperchromic effect (or shift)
This effect involves an increase in the intensity of absorption. It is usually brought about by introduction of an auxochrome.
4- Hypochromic effect (or shift)
It involves a decrease in the intensity of absorption
Shifting of max
Wavelength, nm
Ab
sorb
an
ce
Hypsochromic
Hyp
erc
hro
mi c
Bathochromic
Hyp
orc
hro
mi c

OH O
O
..:
..:
OH-
H++ H
+
-
-
24
The spectra of compounds containing acidic (phenolic-OH) or basic (-NH2) groups are dependent on the pH of the medium.
1- Phenol
The U.V spectrum of phenol in acid medium where benzenoid form is the predominant species, which is completely different from its spectrum in alkaline medium; where the predominant species is the corresponding phenate anion. The spectrum in alkaline medium exhibits bathochromic shift (red shift) due to delocalization of electrons that required lower energy for excitation so appear at longer wavelength
1- Effect of pH on absorption spectrum
Factors affecting absorption spectrum
benzenoid
phenate anion

2- Aniline
Aniline behaves like phenol, i.e. its spectrum exhibits bathochromic shift and hyperchromic effect in alkaline medium due to its conversion to the quinonoid species, while in acid medium its spectrum exhibit hypsochromic shift and hypochromic effect due to its conversion to the benzenoid species.
NH3NH2
NH2
:
OH-
H+
+
+
-
Give reason??

26
Isosbestic point
At isosbestic point, the same absorbance is given for the same concentration at different pH (i.e absorbance is not pH dependent but concentration dependent).
On running U.V spectrum of known concentration of phenol as a function of pH (at different pH). The spectrum will be shifted to different max by changing the pH, but all spectra intersect at certain which is known as isosbestic point.
Analytical measurements of pH- sensitive compounds are done at isosbestic point

27
Isosbestic points
Single clear point, can exclude intermediate state, exclude light scattering and Beer’s law applies
28
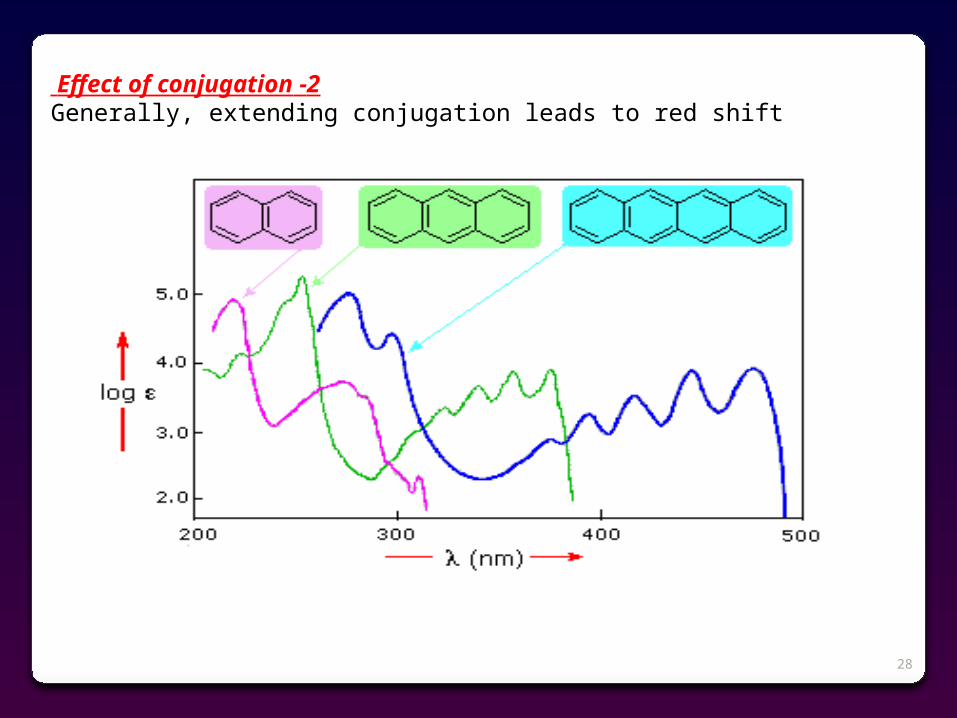
2 -Effect of conjugation Generally, extending conjugation leads to red shift

29
3- Effect of redox reaction on absorption spectrum.
Oxidation of diphenylamine will convert the benzenoid spectrum of diphenylamine to the quinonoid spectrum of the oxidised form, as represented by the following equation.
NH
2 ox.
red.
NH
NH
+ 2H + 2e+
red. ox.
N N + 2H + 2e+
Increase in conjugation, increases absorbance of light by a compound which appears colored and exhibits hyperchromic effect .

30
I0 (radiant intensity)
It (transmitted
intensity)
Reflection, Refraction and scattering losses
Scattering losses
in solutionReflection
losses at interfaces
When a monochromatic light having intensity (Io) is allowed to pass through absorbing medium, some is absorbed (Ia), reflected (Ir), transmitted (It), refracted (If) and scattered (Is).
Io = Ia + It + Ir + If + Is
Refraction losses
31
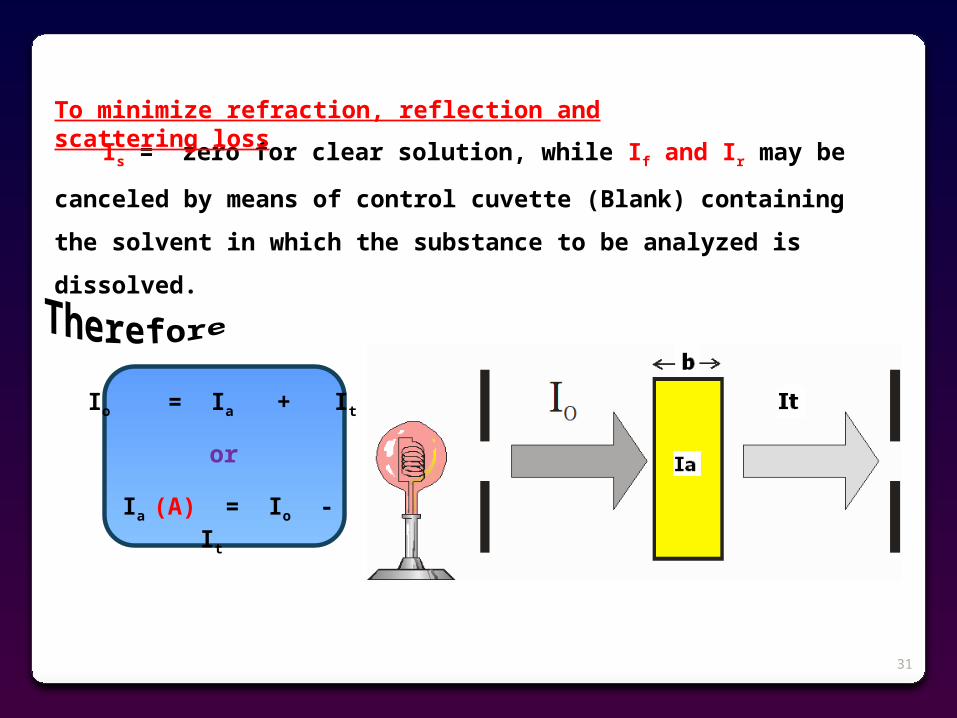
Is = zero for clear solution, while If and Ir may be
canceled by means of control cuvette (Blank) containing
the solvent in which the substance to be analyzed is
dissolved.
Io = Ia + It
Ia (A) = Io - It
or
To minimize refraction, reflection and scattering loss

32
When a monochromatic light enter absorbing medium, its intensity is decreased exponentially with the increase of thickness of the absorbing medium (i.e solution) (b) at constant concentration (C)
log Io / It b or
log Io / It = K bwhere K is proportionality
constant.
Cb
Log Io/It
When a monochromatic light enters an absorbing medium, its intensity is decreased exponentially with the increase of the concentration of the absorbing medium, when (b) is constant.
log Io / It C or
log Io / It = K C
t
o
II
bC
Log

33
log Io/It b (thickness or path length) log Io/It c (Concentration)
log Io/It bc or log Io/It = abc or
A = abc
where: A = log Io/It = absorbance
a: is a constant, known as absorptivity which is: The absorbance, when thickness of solution is unity ( 1cm) and concentration is unity.
- Molar absorptivity or epsilon ()
-If the unit of concentration is 1M, (a) is known as molar absortivity or epsilon () or molar extinction coefficient. (Unit of is L mol-1 cm-1)
- If unity of concentration is 1%, (a) is known as A (1%, 1cm).
A (1% - 1cm) :

34
- Both and A (1%, 1cm) are characteristic for each substance and are used for qualitative purpose.
Absorptivity (a), can be calculated from the slope of the curve produced on plotting (A) as a function of (C) at fixed (b). When (b) is 1 cm
bC
A xA
CA = aC or a = A/C
A/C =a=slope of the curve
A/C =a= slope of the curve
Or From the curve

35
In colorimetry we are measuring A of visible radiation by colored sample.
Requirements for substances to be measured colorimetrically:
1.Substance must be colored e.g CuSO4, organic dyes,…etc.
2- If the substance to be analysed is colorless, it must react with certain reagent (known as chromogen) to produce equivalent colored product. e.g orthophenanthrolene which reacts with ferrous (Fe2+) in buffered medium(acidic pH) to produce intense red color.
3- If the substance to be analyzed is colorless and there is no suitable chromogen, it must be converted to a certain derivative which has a suitable chromogen. e.g esters, which is first converted to hydroxamic acid derivative through the reaction with hydroxylamine. Hydroxamic acid derivative gives purple color on addition of ferric (Fe3+) due to the formation of iron chelate.
R –C– OEt + H2N – OH R –C– NH – OH + EtOH
Hydroxamic acid derivative

36
*Requirements for ideal chromogen
1- Should be colorless or easily separated.2- Should be selective.3- The full development of color must be rapid. 4- Produce only one color of specified max. 5- Its reaction to produce colored product, should be of known mechanism and proceed stoichiometrically.
*Requirements for colored product
1- Should be of intense color, to increase the sensitivity.2- Should be unaffected by pH or the pH must be specified and maintained by suitable buffer or the measurement is carried out at of isosbestic.3- Should be stable with time.4- The reaction of its formation, must be rapid and quantitative. 5- The colored product, should obey Beer-lambert’s law, i.e on plotting A versus C at fixed b, we obtain straight line passing through the origin.

37

38
A- Visual methods: which are applied only in case of colored samples. B- Photo-electric methods: which are applied in both colored and Colourless samples.
This method, based on the comparison of the colored sample with standard series of colors.
Standard colors may be freshly prepared or a permanent colored system.
For freshly prepared standards, matched Nessler tubes are used.
For permanent colored system e.g colored disc, lovibond comparator or sealed ampoules are used.
A. Visual methods
1-Standard series method. (using polychromatic light)
using polychromatic light

39
b) variable depth or balancing method
According to Beer-lambert’s Law:
Log I0/It = A = a b1 C1 = a b2C2 or
b1 C1 = b2 C2 or C1/C2 = b2/b1
Comparing a sample with a solution of known concentration of the
same sample (standard solution) till the intensity of It emerging from
sample and standard solution are the same, we can calculate the
concentration of the unknown sample.

40
B- Photo-electric methods
Using monochromatic light
These methods depend on photoelectric phenomenon, where, the intensity of EMR is measured through the intensity of electric current produced by electrons liberated from a photosensitive metal under the influence of incident EMR.
The instrument used, usually consists of 5 basic components
1- Radiant energy source. 2- Dispersing system (or monochromator). 3- Sample compartment (cuvette). 4- Detector.5- Recorder (meter).
Light source
Monochromator SampleCompartment
Detector Recorder

41
It must be of sufficient intensity and must cover the desired spectral range. In visible range, we must use tungesten lamp, in U.V range we must use deutrium lamp (D2) (or hydrogen lamp.)
1. Radiant energy source (source of light)
2 .Dispersing system (monochromator)
It convert polychromatic light to monochromatic light, i.e of definite range or .
Monochromatic light may be obtained by the use of:
a) Filters
b) Prisms
C) Grating
act by selective absorption of unwanted and transmit the complementary color
Act by refraction of light
Act by diffraction and interference

42
a) Filters
Filters act by selective absorption of unwanted and transmit the complementary color, which is needed to be absorbed by the sample to be
analyzed .
If a substance absorbs all visible light it will appear black.If a substance doesn’t absorb visible light, it will appear colorless.
N.B
* Filters may be
2-interfering filters
It consist of multiple layers. Interference result in a narrow band of 10-17 nm.
1-gelatin and tinted glass:These types of filter transmit a wide band of 35-50 nm. which is not
exactly monochromatic.

43
b) PrismsAct by refraction of light.
In visible range we use glass prism. In U.V range we use prism made of
quartz or fused silica.
ROYGBIV
C) Grating
Act by diffraction and interference
Grating consists of a large number of parallel lines ruled very close to each other on a highly polished surface e.g aluminum or aluminized glass (600 line/mm).
Each ruled groove functions as a scattering center for light rays falling on its edge. Through diffraction and interference, the grating make the light beam into almost single .

44

45
It is made of glass for visible range and quartz or fused silica for U.V range.
Its standard path length is 1cm (10mm) some times it is ½ cm.
Transparent surface
Obaque surface
3.Sample compartment (Cuvette)
4. Detector :There are two types of detectors
a) photocell (Photovoltaic cell) e.g Barrier layer cell Light falling on cell
Transparent metal layer of Ago (Collecting electrode)
Photosenitive semiconductor of selenium
Metal base Plate of iron
-
+
EMR falling upon a semiconductor surface, where electrons are excited and produce EMF (current) proportional to the intensity of incident light.
This type requires no external source of power.

46
: b) Phototube (photomultiplier or photoemissive tube)
In order to obtain greater sensitivity (through magnification of EMF produced) multiplication of the initial photoelectrons by secondary emission, using several anodes arranged in gradually increasing potential (i.e this type requires external source of power).
5. Recorder (meter)
Electric signal produced in detector is fed to a sensitive galvanometer, its scale is graduated in absorbance or/and transmittance units.

47
Commercial instruments 1. Filter photo-electric
colorimeter

48
2. Compensating two-photocell colorimeter

49
1 (Real deviations
Solute molecule in concentrated solution doesn’t absorb radiant energy in the same manner as does the same molecule in dilute solution, due to: molecular interaction, leading to non-linear response when A is plotted against C. This deviation decreases or disappear in very dilute solution.
A
C
2 (Instrumental deviations
It may be irregular or regular:
may result from: 1- The use of unmatched cuvette (due to industrial defect)2- Unclean handling (e.g finger print on the cuvette)3- Unclean optics (lenses, mirrors or lamp)
a. Irregular deviations

50
1- Error in scale. 2- Error in potentiometric reading of absorbance3- Stray light, which is any radiations or other than that absorbed by
the sample or any light reaches the detector without passing through the sample. It may result from incorrect choice of filters, the presence of fluorescent impurities and light source.
3 (Chemical deviations
These include; effect of pH (which leads to shifting of max.), temperature effect and time factor of colored solution (color may fade by time due to
deterioration of organic dye by oxidation, reduction, hydrolysis, etc….) .
b. Regular deviations
Regular deviations may result from:

51

52
1- Qualitative analysis. 2- Quantitative analysis. 3- Determination of some physical constants.
Absorptivity ( or A (1% - 1cm), max, U.V and visible absorption spectrum usually give finger print of the sample to be analyzed.
1 -Qualitative analysis
2 -Quantitative analysis
a. Quantitative analysis of a single component
The substance to be analyzed is dissolved in a suitable solvent, e.g methanol, ether, water, etc….
The solvent is used as blank. Absorbance readings are taken in the expected range (200-400 nm for
colorless sample or 400-800 nm for colored sample). To get absorption spectrum of the substance to be analyzed, absorbance
readings are taken at suitable intervals, usually 5 nm or less.

53
For quantitative determination of a single component we have to:
1- Detect max of the substance to be analyzed after dissolving in a suitable solvent.
2- Construct a calibration curve by plotting A against C at fixed b using standard series of the same chemical present in the sample, at the characteristic max..
3- The Absorbance of the sample to be analyzed is determined under the conditions adopted during construction of the calibration curve.
4- The concentration of the sample can be determined from the calibration curve.
A
C
or
A = abc
i.e c = A /
(a b)

54
b. Quantitative analysis of multicomponent mixture
Consider a binary mixture of X and Y. For quantitative analysis of this mixture, the following requirements must be fulfilled:
1-The absorption spectrum of X and Y should not show sever overlap.
2-Beer-Lambert’s law must be obeyed for X and Y at their
characteristic max.
3-X and Y must be chemically inert to each other.
xyyx
yy
x aaaa
AaAaC
2221
1221
xyyx
xx
y aaaa
AaAaC
2221
1221

55
3 -Determination of some physical constants
Determination of pKa of weak acid or pkindConsider the weak acid HB during its
dissociation
OH-
H+
HB H+ + B-
Ka = [H+][B-] / [HB]
-log Ka = - log [H+] – log [B-] / [HB]
pKa = pH – log [B-] / [HB]
To determine pKa, the absorption spectra of a fixed concentration of HB as function of pH is constructed (figure A), then absorbance is measured as a function of pH at 1,(max of HB) and 2 (max of B-) (figure B). The pH at which the two curves are intersected represents pKa of weak acid.
)figure A(
)figure B (

56
During study of complexation reaction and its stoichiometry, we have to prepare aserial dilutions of Metal ion (Mn+) ranging from 0 to 10 (i.e. 0, 1, 2, ….., 10) and ranging from 10 to 0 (i.e. 10, 9, 8,…….0) for complexing agent (L).
Depending on additive property of absorbance, we prepare complementary mixtures of Mn+ and by measuring A of these mixtures.
if there is no change in A, this indicates that, there is no complexation reaction.
If A of mixtures are varied, this indicates that complexation reaction takes place.
The ratio of Mn+: L can be detected by their ratio at the point of maximum or minimum absorbance.
4.Determination of complexation ratio (Job’s method) .

57
Absorbing impurities, cause distortion of the absorption curve of the mother substance,leading to over estimation (i.e higher absorbance), also it may lead to
shifting of max .
a) Impurity index (I.I.)
The absorption spectra of tested sample and reference standard of the same substance contained in
the tested sample are constructed .
it must be equal to zero if thesample is 100% pure as the reference.
b) Spectrophotometric purity index (S.P.I)
this value equals 1 in case of pure sample.
I.I. = A`1 /A`2 – A1/A2
S.P.I. = (A`1 / A`2) / (A1 / A2) Ā and A refer to the
absorbance of the sample and reference standard respectively.
5-Detection of impurities