Embed Size (px)
Citation preview

solar thermal and concentrated solar power barometer – EUROBSERV’ER – may 2014
1
sola
r t
her
ma
l a
nd
co
nc
entr
ated
so
lar
po
wer
ba
ro
met
er 2 311,5 MWeThe CSP plant generation capacity
in the EU at the end of 2013
Solar therMal and concentrated Solar poWer baroMeter
A study carred out by EurObserv’ER.
the european concentrated solar plant market is set to mark time for a year following efforts to complete construction on 350 MW
of cSp capacity in Spain in 2013. the spotlight has switched to Italy which could re-launch the european market within a couple of years. the european solar thermal market for heat and hot water production and space heating, is shrinking all the time. eurobserv’er reports that the market is in its fifth successive year of contraction in the european Union. It now posts a 10.5% decline on its 2012 performance having struggled to install just over 3 million m2 of collectors in 2013.
3 million m2
The solar thermal panel surface area
installed during 2013
2 MtoeThe heat production from solar
thermal industry in the European
Union during 2013brig
hts
ou
rc
e so
ur
ce
Ivanpah SeGS, the most powerful concentrated solar plant with central receiver, 377 MW, in primm, california.

solar thermal and concentrated solar power barometer – EUROBSERV’ER – may 2014
2
sola
r t
her
ma
l a
nd
co
nc
entr
ated
so
lar
po
wer
ba
ro
met
erThis b a r om e t e r r e v iew s t h e
concentrated solar power tech-
nology developments basically
geared to generating electricity as
well as developments in solar thermal
technologies… primarily those that
use glazed (flat-plate and vacuum tube
collectors) and unglazed collectors.
ConCentrated solar power
Concentrated solar power covers all
the technologies harnessed to trans-
form the energy radiated by the sun
into very high temperature heat. This
thermal energy can be used to produce
electricity, by thermodynamic cycles
or to supply industrial processes that
require high temperature levels (up
to 250°C). Concentrated solar power
systems implement optical concen-
tration devices that convert the sun’s
direct radiation.
The four main technologies are tower
plants and Dish-Stirling engines,
concentrating the radiation on a given
spot, and parabolic trough collectors
and Compact Linear Fresnel Reflector
(CLFR) technology concentrating the
radiation on a linear receptor (a tube
containing heat transfer fluid).
One of the particular advantages of
concentrated solar power is that it
passes through a heat production
stage prior to being converted into
electricity, which means it can be com-
bined with other renewable energies
such as biomass and waste, and also
with conventional sources such as
natural gas and coal. The other advan-
tage is that the energy can be stored
as heat using various processes such
as molten salts – hence the plants can
operate outside of sunshine periods
and during peak consumption periods
at the end of the day.
More than 3 700 MW of capacity installed WorldWide
The technology’s main limitation is
that it requires optimum sunshine
c o n d i t i o n s ( i d e a l l y w i t h d i r e c t
sunshine in excess of 1 900 kWh per
m2 per annum) – which restricts its
potential deployment in Europe to
Mediterranean areas (Spain, Sou-
thern Italy, the South of France, Sar-
dinia, Sicily, Corsica, Greece, Cyprus
and Malta). As a result, its highest
growth potential is outside Europe,
in the United States, India, the MENA
region (Middle-East and North Africa)
countries, South Africa, China, Austra-
lia, and South America. The sector’s
information website, www.csp-world.
com, has published data claiming that
3.7 GW of CSP plant capacity is cur-
rently in service across the world, and
that roughly 2 GW is under construc-
tion, 4.8 GW at development stage and
another 3.3 GW planned.
The sector is already a commercial reality in 19 countriesWhile Spain (2 303.9 MW) and the
United States (765.3 MW) currently
hold most of the installed power,
more countries have decide d to
develop this electricity-generating
technology, which should soon roll
out at a faster pace (see insert on the
International Energy Agency’s fore-
casts). At the end of 2013, 19 countries
had commercial-size plants in ser-
vice or under construction (Spain,
the United States, India, Morocco,
Algeria, Egypt, the United Arab Emi-
rates, Oman, Iran, Thailand, Japan,
Australia, Chile, Mexico, France, Italy,
China, Canada and Papua New Gui-
nea), not to mention the countries
running research and demonstration
plants.
Saudi Arabia has by far the highest
potential and intends to install 25 GW
of concentrated solar power plant
capacity by 2032, which is enough
to generate 75–110 TWh. In February
2 0 1 3 , t h e a g e n c y r e s p o n s i b l e
for imple m e nt ing t h e count r y ’s
r e n e w a b l e e n e r g y p r o g r a m m e
(K.A.CARE – King Abdullah City for
A t o m i c a n d R e n e w a b l e E n e r g y )
announced it was launching its first
call for tender for 900 MW. At the end
of the day, it decided to postpone
it while it conducts a major measu-
ring campaign (Renewable Resource
Monitoring and Mapping Program)
to produce a renewable energy atlas.
Under the terms of the programme,
75 solar radiation measuring stations
have been set up across the kingdom
to identify the best possible instal-
lation sites and give future develo-
pers the maximum number of details
before making their bids. A possible
reason for taking this precaution may
be that it wants to avoid a repeat of
its neighbour’s solar energy esti-
mating problems for the Shams 1
(100 MW) plant 120 km south west
of Abu Dhabi (capital of the United
Arab Emirates), and the first plant
to be inaugurated in a Persian Gulf
state. When construction of the plant
was completed, the output delivered
was about 20% less than estimated
(primarily because of the presence
of sand in the atmosphere), which
therefore had to be made up by resor-
ting to gas.
The situation for the concentrated
solar power sector in India is a little
less promising since the government
diverted some of the planned fun-
ding to the photovoltaic sector by
Solar irradiation world map
UnsuitableViableGoodExcellent
Suitability forCSP plants :
Source: from Schott Solar

solar thermal and concentrated solar power barometer – EUROBSERV’ER – may 2014
3
sola
r t
her
ma
l a
nd
co
nc
entr
ated
so
lar
po
wer
ba
ro
met
er
implementing the JNNSM (Jawahar-
lal Nehru National Solar Mission)
that aims to deploy 20 GW of solar
power by 2022 (CSP and PV). Only
two of the seven concentrated solar
power projects approved in 2010 in
the programme’s first phase met the
construction deadlines (Godawari,
50-MW parabolic trough plant com-
missioned in June 2013, and the 100-
MW Fresnel-type Rajasthan Sun Tech-
nique plant commissioned in March
2014, see next paragraph). Construc-
tion on a third project, Megha Engi-
neering, is currently underway. The
four other projects developed by
Lanko Solar (100 MW), KVK Energy
(100 MW), Corporat Ispat (50 MW)
and Aurum Renewables (20 MW) have
been delayed and may even risk being
cancelled.
The situation is slightly better in
South Africa, where four plants are
under construction (Bokpoort, Kaxu
Solar One, Khi Solar One and Xina
Solar One) that have an aggregate
capacity of 300 MW of capacity. China
is also constructing 4 commercial-
size plants (CPI Golmud Solar Thermal
Power Plant, Delingha Supcon Tower
Plant, HelioFocus China Orion Pro-
ject, and Ningxia ISCC) with 302 MW
of capacity in all.
Plant capacity keeps on rising continuouslyOne of the main sector trends across
all the major CSP technologies is
the significant increase in project
size to reduce production cost s.
The biggest tower plant complex is
Ivanpah SEGS (377 MW) at Primm in
California, owned by BrightSource
Energy. The project has been fully
operational since September 2013,
and comprises three tower plants,
two 123-MW plants and one 130-MW
plant with 1 079 GWh of combined
output. The Solana parabolic trough
plant in Arizona (280 MW), owned by
Abengoa Solar, entered its testing
phase in September 2013. It has two
140-MW turbines that can generate
944 GWh electricity during a year
and is also equipped with a “molten
salt” storage system that provides
it with six hours of reserve electri-
city generating capacity. Areva has
developed the biggest plant so far
using (CLFR) technology and it was
commissioned in March 201 4 , in
India in Rajasthan State. The Rajas-
than Sun Technique project, as it is
called, owned by Reliance Power,
has 100 MW of capacity, and higher-
capacity projects are currently being
developed. BrightSource Energy is
already working on two new 500-MW
tower plant complexes (the Palen
SEGS and Hidden Hills SEGS pro -
jects), while Ibereolica is developing
a 360-MW parabolic trough plant in
Chile (Planta Termosolar Pedro de
Valdivia project).
There is a growing trend for the
concentrated solar power projects
under construction to include sto-
rage systems, which will be the norm
for this type of project in the future.
Examples are the American Crescent
Dunes pla nt (1 1 0 MW, owne d by
SolarReserve), a tower plant equip-
ped with a molten salt storage sys-
tem to drive the turbines at night
or during peak demand times for 10
hours, the South African Bokpoort
parabolic trough plant (50 MW) that
will have 9 hours’ storage capacity
and Noor 1 in Morocco (1 6 0 MW,
owned by ACWA , Aries and TSK), a
1 6 0 - MW p a r a b o li c t r o ug h p l a nt
whose storage system will give it 3
hours’ reserve capacity.
2 311.5 MW in the european union
Spain loses its leadFor the time being, Spain is the only
Europea n countr y to have deve -
A scenario of 250 GW in 2050
Cédric Philibert, the solar power expert at the International Energy Agency
(IEA), reports that the short-term outlook for growth in the CSP sector is a
far cry from what he predicted several years ago, but is still very promising
in the long term. The IEA’s Renewable Energy Medium Term Market Report
2013 forecasts that global installed capacity will be around 12.4 GW in 2018,
giving 34 TWh of generating capacity. By the 2030 timeline, there will be
new scenarios to tackle climate change defined by the Agency that range
from 150 to 250 GW and from 650 to 950 GW in for 2050, which would equate
to a 7–11% share of global electricity production. IEA Energy Technology
Perspectives 2014, report published in May 2014, presents more detailed
growth scenarios. They point to strong development of the concentrated
solar power sector based on the technologies offering major opportunities
to store energy, primarily to make up for saturation of electricity demand
during the day, mainly due to the wide-scale development of photovoltaic
power. The scenarios also show that in the future, the two solar sectors will
complement each other well.
ben
jam
in i
ha
s/n
rel
a small-scale commercial helicopter, holding a specialized
camera which allows researchers to find flaws in parabolic trough
mirrors, in nevada Solar one concentrating Solar power plant,
outside of las Vegas.
solar thermal and concentrated solar power barometer – EUROBSERV’ER – may 2014
4
sola
r t
her
ma
l a
nd
co
nc
entr
ated
so
lar
po
wer
ba
ro
met
er
Table n° 1Concentrated solar power plants in operation at the end of 2013 (Source: EurObserv’ER 2014)
Project Technology CapacityCommisionning
date
Spain
Planta Solar 10 Central receiver 10 2006
Andasol-1 Parabolic trough 50 2008
Planta Solar 20 Central receiver 20 2009
Ibersol Ciudad Real (Puertollano) Parabolic trough 50 2009
Puerto Errado 1 (prototype) Linear Fresnel 1.4 2009
Alvarado I La Risca Parabolic trough 50 2009
Andasol-2 Parabolic trough 50 2009
Extresol-1 Parabolic trough 50 2009
Extresol-2 Parabolic trough 50 2010
Solnova 1 Parabolic trough 50 2010
Solnova 3 Parabolic trough 50 2010
Solnova 4 Parabolic trough 50 2010
La Florida Parabolic trough 50 2010
Majadas Parabolic trough 50 2010
La Dehesa Parabolic trough 50 2010
Palma del Río II Parabolic trough 50 2010
Manchasol 1 Parabolic trough 50 2010
Manchasol 2 Parabolic trough 50 2011
Gemasolar Central receiver 20 2011
Palma del Río I Parabolic trough 50 2011
Lebrija 1 Parabolic trough 50 2011
Andasol-3 Parabolic trough 50 2011
Helioenergy 1 Parabolic trough 50 2011
Astexol II Parabolic trough 50 2011
Arcosol-50 Parabolic trough 50 2011
Termesol-50 Parabolic trough 50 2011
Aste 1A Parabolic trough 50 2012
Aste 1B Parabolic trough 50 2012
Helioenergy 2 Parabolic trough 50 2012
Puerto Errado II Linear Fresnel 30 2012
Solacor 1 Parabolic trough 50 2012
Solacor 2 Parabolic trough 50 2012
Helios 1 Parabolic trough 50 2012
Moron Parabolic trough 50 2012
Solaben 3 Parabolic trough 50 2012
Guzman Parabolic trough 50 2012
La Africana Parabolic trough 50 2012
Olivenza 1 Parabolic trough 50 2012
Helios 2 Parabolic trough 50 2012
Orellana Parabolic trough 50 2012
Extresol-3 Parabolic trough 50 2012
Solaben 2 Parabolic trough 50 2012
Termosolar BorgesParabolic trough + Hybrid biomass
22.5 2012
Termosol 1 Parabolic trough 50 2013
Termosol 2 Parabolic trough 50 2013
Solaben 1 Parabolic trough 50 2013
Casablanca Parabolic trough 50 2013
Enerstar Parabolic trough 50 2013
Solaben 6 Parabolic trough 50 2013
Arenales Parabolic trough 50 2013
Total Spain 2 303.9
Italy
Archimede (prototype) Parabolic trough 5 2010
Archimede-Chiyoda Molten Salt Test Loop
Parabolic trough 0.35 2013
Total Italy 5.35
Germany
Jülich Central receiver 1.5 2010
Total Germany 1.5
France
La Seyne-sur-Mer (prototype) Linear Fresnel 0.5 2010
Augustin Fresnel 1 (prototype) Linear Fresnel 0.25 2011
Total France 0.75Total European Union 2 311.5
loped a commercial concentrated
solar power generating sector, but
unfortunately it has no other pro-
ject under construction or at an
advanced stage of development at
this point of time. Spain’s last seven
scheduled plants, (Termosol 1, Ter-
mosol 2 , Solaben 1 , C a s ablanc a ,
Enerstar, Solaben 6 and Arenales
a ll e a ch 5 0 MW ) a ll 5 0 MW e a ch
were completed and commissioned
in 2013. They take total installed
Spa nish C SP c a pa cit y to date to
2 303.9 MW (table 1) , i .e. 99.7% of
the total installed capacity in the
European Union (graph 1). It will be
years before this figure moves up,
according to Luis Crespo, the Secre-
tary General of Protermosolar, the
Spanish concentrated solar power
industry association, and Chairman
of Estela, the European Solar Ther-
mal Electricity Association.

solar thermal and concentrated solar power barometer – EUROBSERV’ER – may 2014
5
sola
r t
her
ma
l a
nd
co
nc
entr
ated
so
lar
po
wer
ba
ro
met
er
Luis Crespo explains that the new
law enacted by the Spanish govern-
ment will radically change the pay-
ment system for the existing CSP
plants. The FiT and market price plus
premium systems have effectively
been abolished retroactively and
replaced by a sum to be allocated
based on the plant’s installed capa-
city to compensate for investment-
related financial outlay. Luis Crespo
points out that the government will
calculate this compensation directly
to arrive at a theoretical 7.4% return
on project investment. The incen-
tive will be bound to a minimum
plant operating period. The final
legislation is due to be published
imminently. Luis Crespo doubts that
it will undermine plant operation.
H owe ve r a numb e r of inve s t or s
may have difficulty repaying their
bank loans, because the new, less
generous system is likely to endan-
ger the financing package of some
CSP plants. They may be subject to
negotiations with the banks with the
result that some plants may change
hands.
The CSP plant s are now par t and
parcel of the Spanish electricity mix
and generated 4.4 TWh (4 422 GWh)
in 2013 . From 201 4 onwards, out-
put should rise to around 5 TWh as
the last seven plants have come on
stream.
The spotlight has switched to ItalyThe creation of an Italian concentra-
ted solar power sector with commer-
cially operational plants is firming up
now that the introduction of an incen-
tive framework has enabled many
projects to take off the ground. The
Feed-in Tariff system in place since
31 December 2012, involves banding
by total receiver surface, around the
2 500-m2 threshold and the amount
of electricity from non-solar sources
required to integrate the solar output.
The FiT for large plants (>2 500 m2) is
€ 0.32/kWh where the solar fraction is
over 85%, € 0.30/kWh from 50 to 85%,
and € 0.27€/kWh where is it less than
50%. The Feed-in Tariff will be paid
for 25 years and drop by 5% from 2016
onwards and by a further 5% from 2017
onwards. The Feed-in Tariffs for small
plants (<2 500 m2) adopt the same solar
fraction rules and are € 0.36/kWh, €
0.32/kWh and € 0.30/kWh respectively
and apply the same sliding scale rules.
Plants with more than 10 000 m2 of
receivers will be required to have an
energy storage system.
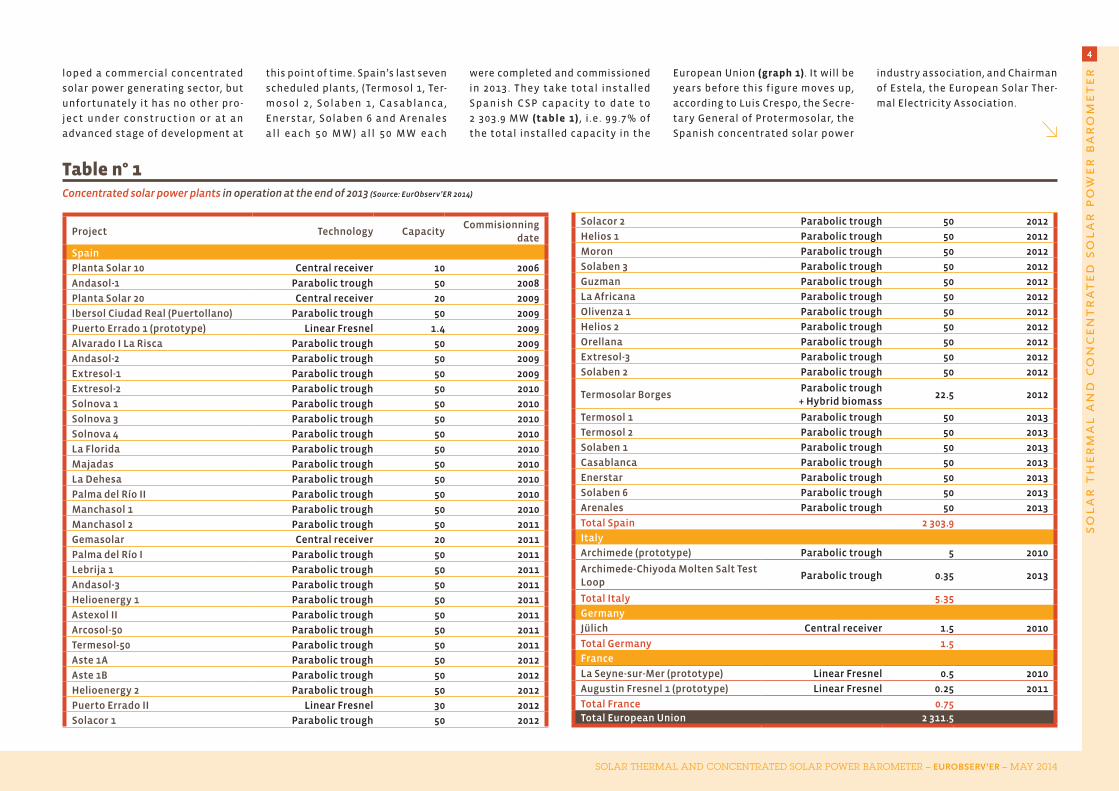
Paolo Pasini, the Secretary General
of ANEST (the Italian Association for
Solar Thermal Energy), reckons that
392 MW of projects are now at deve-
lopment stage (table 2), mainly for
sites in Sardinia and Sicily. At least five
Fresnel technology projects could be
on stream by 2015, including Calliope,
Zeronovantuno 2, Jacomelli, Porthos
and Stromboli Solar, all sited at Tra-
pani in Sicily. Larger-scale parabolic
trough and tower plant projects will
be up and running in 2016 and 2017
including Flumini Mannu (50 MW, Vil-
lasor-Decimoputzu, Sardinia) Gonnos-
fanadiga – Guspini (50 MW, Gonnosfa-
nadiga, Sardinia), and Mazara Solar
(50 MW, Trapani, Sicily). According to
ANEST, total installed concentrated
Graph n° 1European Union concentrated solar power capacity trend (MWe)
10,0 60,0
281,4
738,4
1 158,7
1 961,2
2 311,5
2007 2008 2009 2010 2011 2012 2013
Source: EurObserv’ER 2014
ar
eva
areva started operations of its molten salt energy storage demonstration
plant at Sandia national laboratories’ national Solar thermal test Facility in
albuquerque, new Mexico.
solar thermal and concentrated solar power barometer – EUROBSERV’ER – may 2014
6
sola
r t
her
ma
l a
nd
co
nc
entr
ated
so
lar
po
wer
ba
ro
met
er
solar power capacity could be 600 MW
by 2020 in Italy.
The French sector on hold pending the next tenderThe only two plants being developed
in France that successfully bid for the
first CRE (Energy Regulatory Autho-
rity) solar tender were mentioned in
the last two editions of this barome-
ter. SolarEuromed says that work on
the Fresnel-type 12-MW Alba Nova
plant at Ghisonaccia in Corsica should
finally kick off this month. As for the
Llo plant project (the 9 -MW eLLo
project in the Pyrénées-Orientales),
which has also obtained a guaranteed
Feed-in Tariff (€ 0.34.9/kWh during
20 years) under the terms of the same
tender, it is still at the administrative
licensing stage. The licences should
come through by the end of the year
and permit construction work to start
at the beginning of 2015.
The sector’s immediate future on
French soil will largely depend on the
CRE’s third solar tender that is due to
be launched shortly. SolarEuromed
and CNIM hope that it will include a
specific CSP section to broaden the
technology showcase, which is essen-
tial if France is to gain market shares
abroad.
restructuring of europe’s industry continues
Towards the end of the 2000s, the
concentrated solar power industry
entered a new phase when the pionee-
ring firms were bought out by players
with more financial clout or were
consolidated with the arrival of new
shareholders. Here we mention just
a few of them. Abengoa bought out
Solúcar Energía in 2007 and became
Abengoa Solar; Areva Solar was crea-
ted by the acquisition of Ausra in
2010. BrightSource Energy, created in
2004, managed to gather more than
615 million dollars (449 million euros)
of business funding from financial and
strategic investors including Alstom
which holds 20% of the capital, but
also Google and the VantagePoint
Venture Partners investment fund.
However for two years the incen-
tive systems have been called into
Table n° 2Concentrated solar power plants under developement at the beginning of the year 2014
Project Location Capacity (MW) TechnologyCommercial date
of operation
Italy
Archetype SW550 Passo Martino, Catania, Sicily 30 Parabolic trough n.a.
Campu Giavesu Cossoine, Sassari, Sardinia 30 Parabolic trough n.a.
Flumini Mannu Villasor-Decimoputzu, Cagliari, Sardinia 50 Parabolic trough 2016
Gonnosfanadiga – Guspini Gonnosfanadiga, Medio Campidano, Sardinia 50 Parabolic trough 2017
Bonorva Giave and Bonorva, Sassari, Sardinia 50 Parabolic trough n.a.
Repower Reflex Gela, Sicily 12 Parabolic trough n.a.
Banzi Banzi, Basilicate 50 Parabolic trough n.a.
Lentini Lentini, Siracusa, Sicily 50 Parabolic trough n.a.
Calliope Trapani, Sicily 4 Linear Fresnel 2015
Zeronovantuno 2 Trapani, Sicily 4 Linear Fresnel 2015
Jacomelli Trapani, Sicily 4 Linear Fresnel 2015
Porthos Trapani, Sicily 4 Linear Fresnel 2015
Sromboli Solar Trapani, Sicily 4 Linear Fresnel 2015
Mazara Solar Trapani, Sicily 50 Central receiver 2017
Total Italy 392
France
Alba Nova 1 Ghisonaccia, Corsica 12 Linear Fresnel 2015
eLLo LIo, Pyrénées-Orientales 9 Linear Fresnel 2015
Total France 21
Cyprus
Helios Power Larnaca 50.8 Dish Stirling 2016
Total Cyprus 50.8
Greece
Maximus Dish project Flórina 75 Dish Stirling n.a.
MINOS CSP tower Crete 50 Central receiver (power tower) n.a.
Total Greece 125
Spain
PTC50 Alvarado Alvarado, Badajoz 50 Central receiver (power tower) - Biomass n.a.
Total Spain 50
Total European Union 638.8
Source: EurObserv’ER 2014

solar thermal and concentrated solar power barometer – EUROBSERV’ER – may 2014
7
sola
r t
her
ma
l a
nd
co
nc
entr
ated
so
lar
po
wer
ba
ro
met
er
question because of the recession.
Moreover the extra time taken setting
up a number of concentrated solar
power programmes has curbed the
sector’s immediate growth prospects.
Consequently, some of the players
have changed strategy or restruc-
tured. The high-profile failure of the
German developer Solar Millenium
announced at the end of 2011 and Sie-
mens’ October 2012 decision to pull
out of this energy sector, three years
after acquiring the Israeli firm Solel
Solar Systems, signalled the starting
point for restructuring Solel.
In September 2013 Siemens’ C SP
assets were acquired by Abengoa (the
parent company of Abengoa Solar) the
CSP sector’s global leader, via its Rio-
glass Solar subsidiary that specialises
in manufacturing parabolic mirrors.
According to Rioglass Solar CEO, Jose
Villanueva, “The acquisition provided
Rioglass Solar with a one-off opportu-
nity for to diversify its portfolio and
consolidate its presence in the CSP
market.”
Due to the la st Spanish govern -
ment’s policy, Abengoa Solar has a
head start on the rest of the world for
completed projects, with plants on
all continents. The company works
actively in the tower plant, parabo-
lic trough plant, thermal storage and
photovoltaic concentrator segments.
In its home country, Abengoa Solar
has developed five large solar com-
plexes, Solucar (183 MW), the biggest
in Spain that comprises the PS10, PS20
tower plants and the Solnova para-
bolic trough plant, as well as Ecija
Solar (comprising Helioenergy 1 and
2, 50 MW each), El Carpio Solar (com-
prising Solacor 1 and 2, 50 MW each),
Castilla-La Mancha Solar (comprising
Helios 1 and 2, 50 MW each) and Extre-
madura Solar (comprising Solaben 1,
2, 3 and 6, 50 MW each). Abengoa Solar
has also commissioned projects in the
United States with Solana, currently
the world’s highest-capacity parabo-
lic trough plant, in the United Arab
Emirates with Shams 1 (100 MW), the
Middle-East’s first CSP plant, and also
in Algeria with the Hassi R’Mel hybrid
solar-gas plant (150 MW including
20 MW of solar). Abengoa is currently
constructing two plants in South
Africa (Khi Solar One, 50 MW and Kaxu
Solar One, 100 MW) and has announced
the development of a third plant, Xina
Solar One (100 MW). It is constructing
another plant in the United States (the
280-MW Mojave project in California)
and is co-contractor on a 14-MW pro-
ject in Mexico.
Source: EurObserv’ER 2014
Current Trend
NREAP roadmaps
1 158.7
1 961.22 311.5 2 352.5
3 500
20202015 2016 2017 2018 20192012 2013 2014
3 526
6 765
2011
Graph n° 2Comparison of the current trend against the NREAP (National Renewable Energy Action Plans) roadmaps (en MW)
Table n° 3Main european CSP project developpers in 2013
Company Country ActivityMW developed or
under constructionTurnover Employees
Ibereolica Spain Engineering - EPC - O&M - Project developer 960 n.a. n.a.
Abengoa Spain Promoter - Project developer - EPC - Engineering - O&M - Components 631 7 089 22 261
Magtel Renewables Spain Promoter - Project developer - EPC - O&M - Engineering - Consulting 600 n.a. n.a.
ARIES ingenieria y sistemas Spain Promoter - Project developer - EPC - O&M - Engineering - Consulting 500 n.a. n.a.
Cobra Spain Promoter - Project developer - EPC - Engineering - O&M 500 4 000 28 000
Acciona Energy Spain EPC - Project developer - Promoter 314 2 107 2 500
Torresol Energy Spain Promoter - Project developer - O&M - Engineering 119 n.a. n.a.
FCC Energia /Enerstar Spain Promoter - Project developer 100 n.a. n.a.
Hyperion Spain Promoter - Project developer - O&M 100 n.a. n.a.
Samca Spain Promoter - Project developer - O&M 100 850 3 500
Sener Spain Components - Engineering - Project developer 100 n.a. n.a.
Source: EurObserv’ER 2014 (based on company information and CSP-World)
solar thermal and concentrated solar power barometer – EUROBSERV’ER – may 2014
8
sola
r t
her
ma
l a
nd
co
nc
entr
ated
so
lar
po
wer
ba
ro
met
er
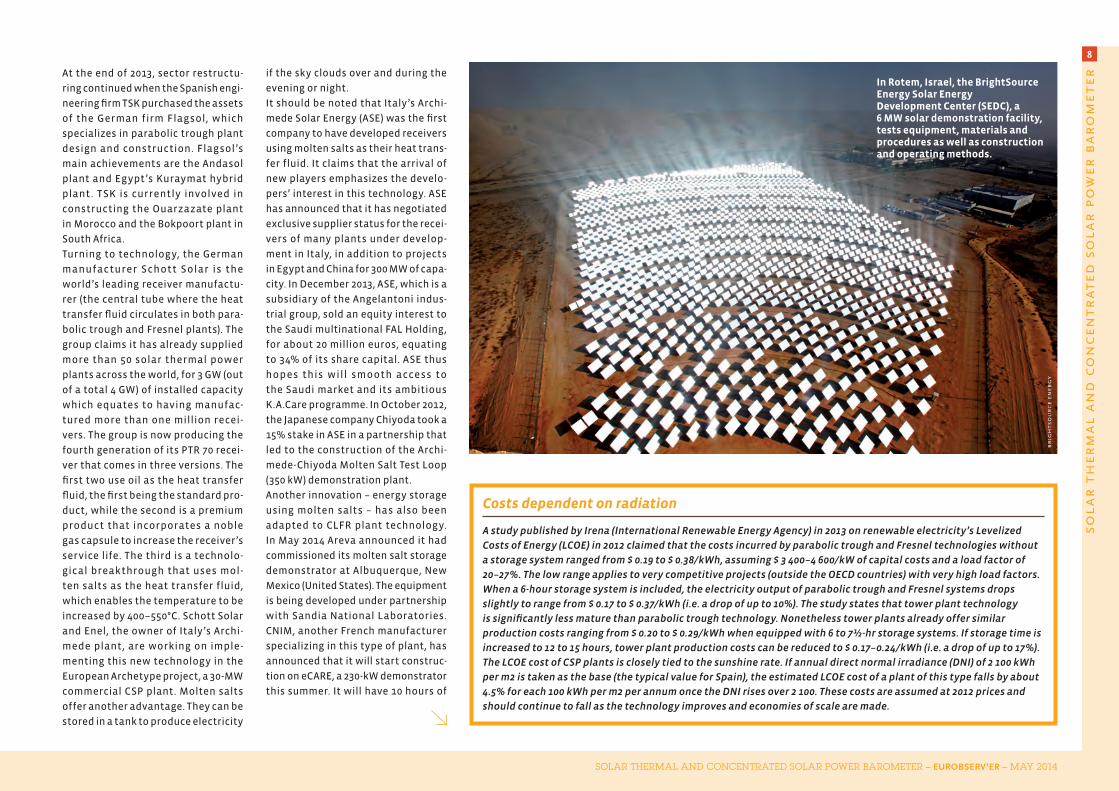
Costs dependent on radiation
A study published by Irena (International Renewable Energy Agency) in 2013 on renewable electricity’s Levelized
Costs of Energy (LCOE) in 2012 claimed that the costs incurred by parabolic trough and Fresnel technologies without
a storage system ranged from $ 0.19 to $ 0.38/kWh, assuming $ 3 400–4 600/kW of capital costs and a load factor of
20–27%. The low range applies to very competitive projects (outside the OECD countries) with very high load factors.
When a 6-hour storage system is included, the electricity output of parabolic trough and Fresnel systems drops
slightly to range from $ 0.17 to $ 0.37/kWh (i.e. a drop of up to 10%). The study states that tower plant technology
is significantly less mature than parabolic trough technology. Nonetheless tower plants already offer similar
production costs ranging from $ 0.20 to $ 0.29/kWh when equipped with 6 to 7½-hr storage systems. If storage time is
increased to 12 to 15 hours, tower plant production costs can be reduced to $ 0.17–0.24/kWh (i.e. a drop of up to 17%).
The LCOE cost of CSP plants is closely tied to the sunshine rate. If annual direct normal irradiance (DNI) of 2 100 kWh
per m2 is taken as the base (the typical value for Spain), the estimated LCOE cost of a plant of this type falls by about
4.5% for each 100 kWh per m2 per annum once the DNI rises over 2 100. These costs are assumed at 2012 prices and
should continue to fall as the technology improves and economies of scale are made.
At the end of 2013, sector restructu-
ring continued when the Spanish engi-
neering firm TSK purchased the assets
of the German firm Flagsol, which
specializes in parabolic trough plant
design and construction. Flagsol’s
main achievements are the Andasol
plant and Egypt’s Kuraymat hybrid
plant. TSK is currently involved in
constructing the Ouarzazate plant
in Morocco and the Bokpoort plant in
South Africa.
Turning to technology, the German
manufacturer Schott Solar is the
world’s leading receiver manufactu-
rer (the central tube where the heat
transfer fluid circulates in both para-
bolic trough and Fresnel plants). The
group claims it has already supplied
more than 50 solar thermal power
plants across the world, for 3 GW (out
of a total 4 GW) of installed capacity
which equates to having manufac-
tured more than one million recei-
vers. The group is now producing the
fourth generation of its PTR 70 recei-
ver that comes in three versions. The
first two use oil as the heat transfer
fluid, the first being the standard pro-
duct, while the second is a premium
product that incorporates a noble
gas capsule to increase the receiver’s
service life. The third is a technolo-
gical breakthrough that uses mol-
ten salts as the heat transfer fluid,
which enables the temperature to be
increased by 400–550°C. Schott Solar
and Enel, the owner of Italy’s Archi-
mede plant, are working on imple-
menting this new technology in the
European Archetype project, a 30-MW
commercial CSP plant. Molten salts
offer another advantage. They can be
stored in a tank to produce electricity
if the sky clouds over and during the
evening or night.
It should be noted that Italy’s Archi-
mede Solar Energy (ASE) was the first
company to have developed receivers
using molten salts as their heat trans-
fer fluid. It claims that the arrival of
new players emphasizes the develo-
pers’ interest in this technology. ASE
has announced that it has negotiated
exclusive supplier status for the recei-
vers of many plants under develop-
ment in Italy, in addition to projects
in Egypt and China for 300 MW of capa-
city. In December 2013, ASE, which is a
subsidiary of the Angelantoni indus-
trial group, sold an equity interest to
the Saudi multinational FAL Holding,
for about 20 million euros, equating
to 34% of its share capital. ASE thus
hopes this will smooth access to
the Saudi market and its ambitious
K.A.Care programme. In October 2012,
the Japanese company Chiyoda took a
15% stake in ASE in a partnership that
led to the construction of the Archi-
mede-Chiyoda Molten Salt Test Loop
(350 kW) demonstration plant.
Another innovation – energy storage
using molten salts – has also been
adapted to CLFR plant technology.
In May 2014 Areva announced it had
commissioned its molten salt storage
demonstrator at Albuquerque, New
Mexico (United States). The equipment
is being developed under partnership
with Sandia National Laboratories.
CNIM, another French manufacturer
specializing in this type of plant, has
announced that it will start construc-
tion on eCARE, a 230-kW demonstrator
this summer. It will have 10 hours of
brig
hts
ou
rc
e en
erg
y
In rotem, Israel, the brightSource energy Solar energy development center (Sedc), a 6 MW solar demonstration facility, tests equipment, materials and procedures as well as construction and operating methods.
solar thermal and concentrated solar power barometer – EUROBSERV’ER – may 2014
9
sola
r t
her
ma
l a
nd
co
nc
entr
ated
so
lar
po
wer
ba
ro
met
er
storage capacity using steam accu-
mulator technology for storage. The
demonstrator, which was Ademe’s win-
ning AMI project (Investments for the
future programme of calls for expres-
sions of interest) will be constructed
at Llo, in the Pyrénées-Orientales, on
the same site as the forthcoming 9-MW
commercial plant (eLLo project).
Which technologies Will europe be shoWcasing in 2020?
Many countries on all continents
are very interested in concentrated
solar power energy storing techno-
logy possibilities. They have already
expressed their interest by construc-
ting the first commercial-size plants
on their territory. However develop-
ment on a very large-scale, as expe-
rienced by the PV and wind energy
sectors has yet to commence. The
sector is still commercially validating
the various solar thermal processes.
The technologies are still competing
with one another and it is very hard to
predict which technology will come
out on top, especially as the sector
needs financial suppor t through
the implementation of ambitious
installation capacity and research
and development programmes. The
installation of new plant s in the
European Union market is only a pre-
liminary stage and will enable the
European players to demonstrate
their capacity to export their tech-
nology to secure their share in the
global market’s growth. This is where
the NREAP roadmap for concentrated
solar power makes perfect sense as
it forecasts that installed capacity in
the European Union by the 2020 time-
line will stand at 6 765 MW (4 800 MW
in Spain, 600 MW in Italy, 540 MW in
France, 500 MW in Portugal, 250 MW
in Greece and 75 MW in Cyprus), equa-
ting to 20 TWh of output.
Today the economic and political
environment has cast doubt on this
roadmap. Most of the countries that
set objectives are way off target, and
if no significant political change is
announced within the next two to
three years, the sector will have dif-
ficulty passing the 3 500 MW mark in
2020. Furthermore this scenario pres-
umes the return to a new installation
programme in Spain at the very least,
which is not yet on the agenda. In
the interim, to test their technology,
European manufacturers will have
to rely increasingly on international
programmes.
solar thermal
The European Union solar thermal sec-
tor for hot water and heat production
has been suffering from development
problems for several years. In 2013, the
market slipped for the fifth time in a
row, with installed collector surface
down to just 3 027 532 m2 (equating to
2 119.3 MWth of capacity), i.e. 13.2%
less than in 2012 (tables 4 and 5). The
EurObserv’ER survey finds that in
ra
nd
y m
on
toya
/sa
nd
ia l
ab
s
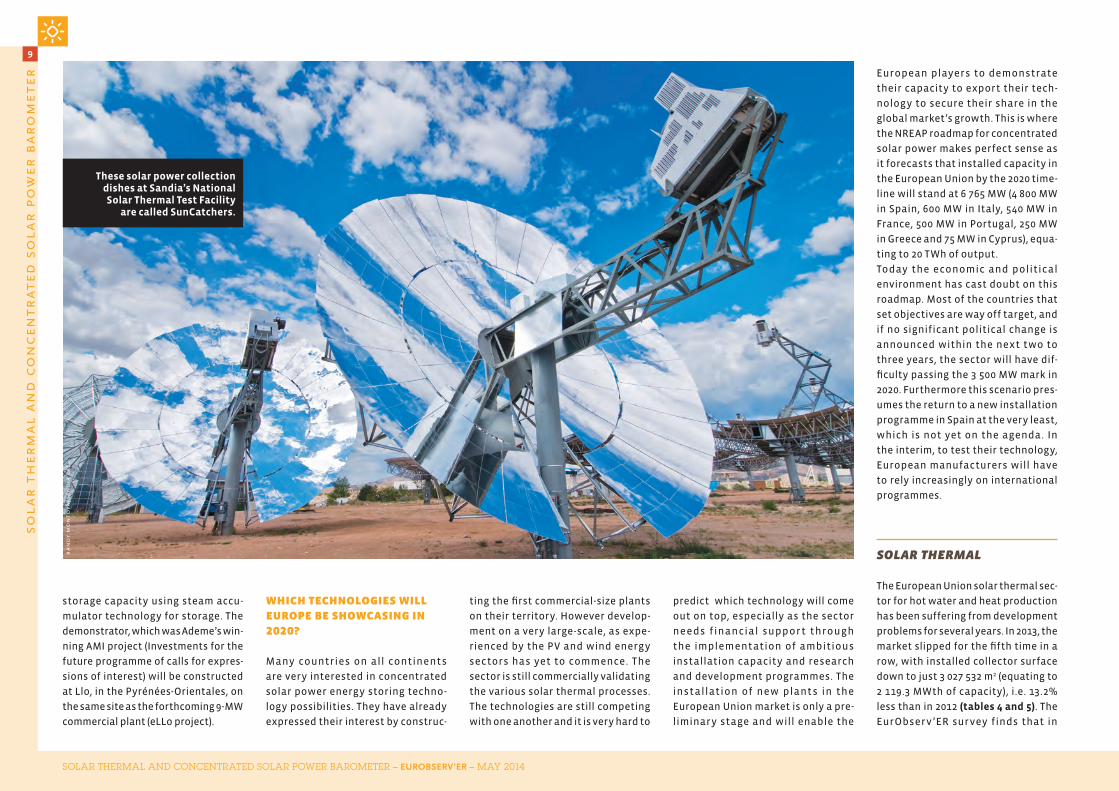
these solar power collection dishes at Sandia’s national Solar thermal test Facility
are called Suncatchers.
solar thermal and concentrated solar power barometer – EUROBSERV’ER – may 2014
10
sola
r t
her
ma
l a
nd
co
nc
entr
ated
so
lar
po
wer
ba
ro
met
er
2013 flat-plate collectors accounted
for almost 90% of the glazed collec-
tors (89.3% to be precise), completely
outstripping vacuum tube collectors.
The flexible collector (unglazed) mar-
ket is basically geared to heating
local authority and private swim-
ming pools, but is under-represented
because the market is not so closely
monitored.
The 2013 installation figures for solar
thermal collectors now resemble
those of 2007 (graph 3), and are drif-
ting further away from the annual
installation record set in 2008 when
more than 4.6 million m2 were instal-
led. However these figures are not
strictly comparable, as improved effi-
ciency has brought down the mean
collector surface area. In France for
example, the mean surface area of
an individual hot-water heater for
a family of four has dropped from
4.6 m2 in 2007 to 4 m2 in 2013, which
is 13% less.
Despite this mitigating detail, the
solar thermal market contraction in
2013 was worse than in 2012, and 2013
the sector will look back on it as an
abysmal year. The slowdowns were
particularly serious in the key Euro-
pean markets – France, Germany, Aus-
tria, Italy, Portugal and for the first
time Greece, which is unprecedented.
The reason for the sharp contraction
in the UK is the delay in implementing
the RHI (Renewable Heat Incentive)
for homeowners.
While this trend has been observed
across all the heat production sec-
tors, solar thermal is particularly
hard hit; it needs to be viewed against
the underlying conte x t of wea k
economic growth and a moribund
construction market, compounded
by other, more policy-related factors.
The solar thermal industry complains
that the sector ’s image has been
shrouded in controversy and media
hype about the costs of renewable
energy incentives and their impact
on national budgets. The general
public’s view of renewable energies
has also been tarnished by the miscal-
culation of incentives awarded to the
photovoltaic sector, which in some
countries hit consumers’ electricity
bills much more than expected. Some
solar thermal players feel that com-
petition from solar PV has also tur-
ned a section of private householders
away from investing in solar thermal,
because the sales pitch for photovol-
taic panels has tended to highlight
their investment potential only. Fur-
thermore solar thermal technology
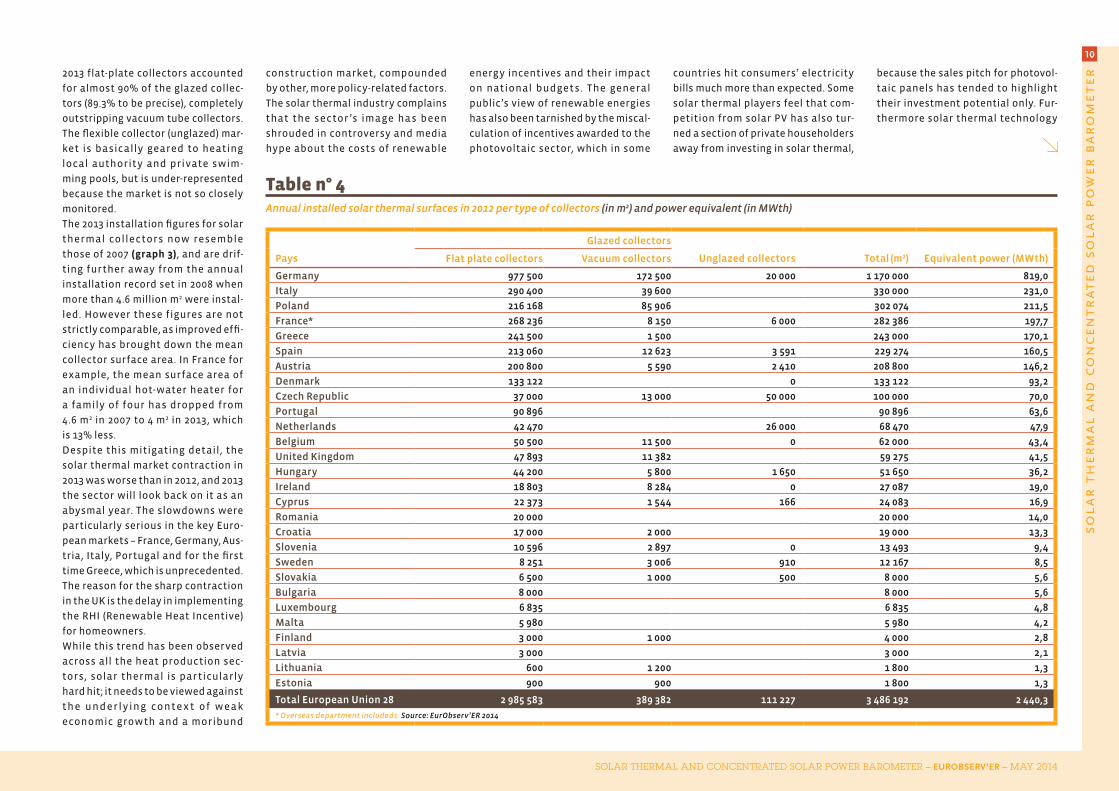
Table n° 4Annual installed solar thermal surfaces in 2012 per type of collectors (in m2) and power equivalent (in MWth)
Glazed collectors
Pays Flat plate collectors Vacuum collectors Unglazed collectors Total (m2) Equivalent power (MWth)
Germany 977 500 172 500 20 000 1 170 000 819,0
Italy 290 400 39 600 330 000 231,0
Poland 216 168 85 906 302 074 211,5
France* 268 236 8 150 6 000 282 386 197,7
Greece 241 500 1 500 243 000 170,1
Spain 213 060 12 623 3 591 229 274 160,5
Austria 200 800 5 590 2 410 208 800 146,2
Denmark 133 122 0 133 122 93,2
Czech Republic 37 000 13 000 50 000 100 000 70,0
Portugal 90 896 90 896 63,6
Netherlands 42 470 26 000 68 470 47,9
Belgium 50 500 11 500 0 62 000 43,4
United Kingdom 47 893 11 382 59 275 41,5
Hungary 44 200 5 800 1 650 51 650 36,2
Ireland 18 803 8 284 0 27 087 19,0
Cyprus 22 373 1 544 166 24 083 16,9
Romania 20 000 20 000 14,0
Croatia 17 000 2 000 19 000 13,3
Slovenia 10 596 2 897 0 13 493 9,4
Sweden 8 251 3 006 910 12 167 8,5
Slovakia 6 500 1 000 500 8 000 5,6
Bulgaria 8 000 8 000 5,6
Luxembourg 6 835 6 835 4,8
Malta 5 980 5 980 4,2
Finland 3 000 1 000 4 000 2,8
Latvia 3 000 3 000 2,1
Lithuania 600 1 200 1 800 1,3
Estonia 900 900 1 800 1,3
Total European Union 28 2 985 583 389 382 111 227 3 486 192 2 440,3
* Overseas department includeds. Source: EurObserv’ER 2014

solar thermal and concentrated solar power barometer – EUROBSERV’ER – may 2014
11
sola
r t
her
ma
l a
nd
co
nc
entr
ated
so
lar
po
wer
ba
ro
met
er
has become less fashionable because
its return on investment time is seen
to compare very unfavourably with
that of photovoltaic. The sector does
not blame the Feed-in Tariff system,
because it has turned out to be really
recently introduced UK Feed-in Tariff
system for heat production will be
one of the main sector development
drivers.
Another grumble is that the public
information and recommendation
campaigns on renewable heating and
hot water production systems are not
high on the public agenda. The public
authorities’ role has always been vital
in guiding consumer choice, so consu-
mers have clearly interpreted the lack
of visibility as reflecting the authori-
ties’ lukewarm endorsement of solar
thermal.
focus on soMe Key european union countries
The German market sliding except in new buildDespite a slight surge in 2011, the
German solar thermal market is still
sliding. According to AGEE-Stat it
managed to stay above the one million
square-metre mark (at 1 040 000 m2) in
2013, which is 130 000 m2 less than in
2012. BSW Solar (the German solar
industry association) feels the situa-
tion is not alarming, as it is shifting.
The proportion of new builds equip-
ped with solar systems is tending to
rise, as the new build market picks up
thanks to low interest rates. The BSW
explains that solar thermal’s poorer
performance in hybrid appliances
used in the heating appliance repla-
cement market is responsible for this
drop.
In May 2014 Germany enacted new
legislation on energy savings (the
EnEV law), which stipulates that
from 2015 onwards, oil- and gas-fired
heating systems over 30 years old
must be replaced by new systems.
The law is likely to increase solar sys-
tem sales, because the new fossil-
fuel heating systems tend to be sold
coupled to solar thermal collectors,
to improve system performance and
efficiency.
UK… the domestic RHI is now in placeThe Renewable Heat Incentives pro-
gramme for homeowners (Domestic
efficient at developing industrial sec-
tors. The fatal flaw is the abuse of the
mechanism, which has created specu-
lative movements and incurred avoi-
dable surcharges through mishan-
dling. According to the industry, the
Table n° 5Annual installed solar thermal surfaces in 2013* per type of collectors (in m2) and power equivalent (in MWth)
Glazed collectors
Pays Flat plate collectors Vacuum collectors Unglazed collectors Total (m2) Equivalent power (MWth)
Germany 907 800 112 200 20 000 1 040 000 728,0
Italy 267 000 30 000 297 000 207,9
Poland 199 100 75 000 274 100 191,9
Spain 222 552 6 169 3 794 232 515 162,8
France** 216 185 6 300 6 000 228 485 159,9
Greece 210 000 1 000 211 000 147,7
Austria 175 140 4 040 1 460 180 640 126,4
Denmark 104 000 104 000 72,8
Czech Republic 32 306 12 225 35 000 79 531 55,7
Netherlands 30 054 2 694 27 396 60 144 42,1
Belgium 48 500 10 500 59 000 41,3
Portugal 57 234 57 234 40,1
United Kingdom 36 000 9 000 45 000 31,5
Ireland 17 022 10 679 27 701 19,4
Romania 9 000 14 850 180 24 030 16,8
Croatia 21 000 2 500 23 500 16,5
Hungary 10 580 7 170 250 18 000 12,6
Cyprus 16 652 472 34 17 158 12,0
Slovenia 7 089 1 949 9 038 6,3
Sweden 6 124 2 487 351 8 962 6,3
Slovakia 5 200 1 000 500 6 700 4,7
Luxembourg 6 179 6 179 4,3
Bulgaria 5 600 5 600 3,9
Finland 3 000 1 000 4 000 2,8
Latvia 2 700 2 700 1,9
Lithuania 600 1 200 1 800 1,3
Estonia 900 900 1 800 1,3
Malta 1 223 493 1 715 1,2
Total European Union 28 2 618 740 313 828 94 965 3 027 532 2 119,3
*Estimate. ** Overseas department includeds. Source: EurObserv’ER 2014
solar thermal and concentrated solar power barometer – EUROBSERV’ER – may 2014
12
sola
r t
her
ma
l a
nd
co
nc
entr
ated
so
lar
po
wer
ba
ro
met
er
N400 km
N 400 km
Estonia n° 285,51,3
Slovakia n° 19112,74,7
Romania n° 20110,216,8
Hungary n° 18137,312,6
Croatia n° 2198,416,5
Finland n° 2432,5
2,8
Sweden n° 14341,6
6,3
Bulgaria n° 2258,53,9
Greece n° 32 914,8
147,7
Italy n° 42 590,0
207,9
France** n° 61 802,5
159,9
United-Kingdom n° 13475,2
31,5
Spain n° 52 238,2
162,8
Austria n° 23 538,3
126,4
Luxembourg n° 2527,4
4,3
374,241,3
Belgium n° 15 TOTAL EU31 379,3
2 119,3
Latvia n° 2612,11,9
Germany n° 112 055,4
728,0
476,812,0
Cyprus n° 12
148,16,3
Slovenia n° 17Portugal n° 8716,840,1
Netherland n° 10615,642,1
Denmark n° 11550,2
72,8
Malta n° 2335,01,2
Lithuania n° 277,71,3
Poland n° 71 039,5191,9
Czech Rep. n° 9680,655,7
Ireland n° 16196,3
19,4
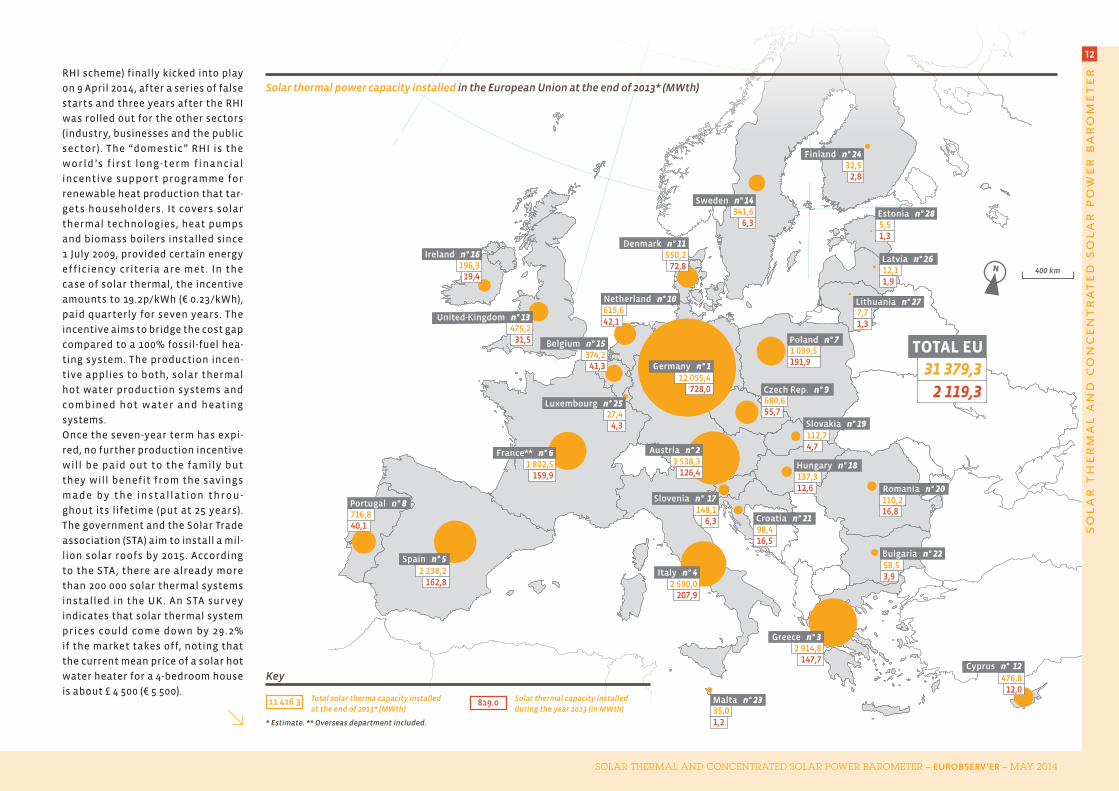
Solar thermal power capacity installed in the European Union at the end of 2013* (MWth)
Key
11 416.3 Total solar therma capacity installed
at the end of 2013* (MWth)819.0 Solar thermal capacity installed
during the year 2013 (in MWth)
* Estimate. ** Overseas department included.
RHI scheme) finally kicked into play
on 9 April 2014, after a series of false
starts and three years after the RHI
was rolled out for the other sectors
(industry, businesses and the public
sector). The “domestic” RHI is the
world’s f irst long-term financial
incentive support programme for
renewable heat production that tar-
gets householders. It covers solar
thermal technologies, heat pumps
and biomass boilers installed since
1 July 2009, provided certain energy
efficiency criteria are met . In the
case of solar thermal, the incentive
amounts to 19.2p/kWh (€ 0.23/kWh),
paid quarterly for seven years. The
incentive aims to bridge the cost gap
compared to a 100% fossil-fuel hea-
ting system. The production incen-
tive applies to both, solar thermal
hot water production systems and
combined hot water and heating
systems.
Once the seven-year term has expi-
red, no further production incentive
will be paid out to the family but
they will benefit from the savings
ma de by the inst a llat ion t hrou -
ghout its lifetime (put at 25 years).
The government and the Solar Trade
association (STA) aim to install a mil-
lion solar roofs by 2015. According
to the STA, there are already more
than 200 000 solar thermal systems
installed in the UK. An STA survey
indicates that solar thermal system
prices could come down by 29.2%
if the market takes off, noting that
the current mean price of a solar hot
water heater for a 4-bedroom house
is about £ 4 500 (€ 5 500).

solar thermal and concentrated solar power barometer – EUROBSERV’ER – may 2014
13
sola
r t
her
ma
l a
nd
co
nc
entr
ated
so
lar
po
wer
ba
ro
met
er
The Italian Feed-in Tariff is a smokescreenIt a ly is one of Europ e ’s lea ding
solar thermal technology markets,
although the recession has taken
some of the steam out of it. The solar
thermal association, Assolterm, puts
market volume at around 297 000 m2
in 2013 (330 000 m2 in 2012), taking
Italy’s total solar thermal installed
base to about 3.7 million m2.
The legal framework setting a Feed-in
Tariff for heat production has been
in place since the law of 2 January
2013 (law no. 28, art. 28). However it
has yet to materialize because the
Italians have failed to reach consen-
sus on how to measure solar yield.
In the meantime, the law has led to
the implementation of the Conto Ter-
mico, which is simply a dressed-up
installation subsidy system. Solar
thermal installations (hot water-
only or combined systems) of less
than 50 m2 are eligible for € 170/m2 of
aid per annum for two years. When
combined with a cooling system, the
incentive rises to € 255/m2 for two
years. Systems with more than 50 m2
of collectors are eligible for € 55/
m2 of aid per annum for 5 years and
when combined with a solar-powered
cooling system € 83/m2 is payable.
Every installation has to go through
an authorization procedure with GSE
(Gestore dei Servizi Energetici).
Italy has two other solar thermal
installation financing possibilities
(that cannot be piggy-backed to the
Conto Termico) – a 65% tax deduction
for energy efficiency investments in
buildings or a 50% tax deduction for
renovating buildings and installation
subsidies that can both be used over
a ten-year period. Assolterm claims
that the Conto Termico system is best
for the consumer, but that “excessive
bureaucracy” is still limiting the num-
ber of projects. During the mecha-
nism’s first year it applied to only 3
000 of the systems installed. Thus it
follows that the Italian market will
return to growth when the efficiency
of this incentive system improves.
The Polish market’s coffers run dryAfter two years of high growth in 2011
and 2012, the Polish market lost impe-
tus in 2013. The Polish Institute for
Renewable Energy (IEO) reports that
274 100 m2 of collectors were instal-
led in 2013 compared to 302 074 m2
in 2012. There are several reasons
for this reversal. Firstly, the rules for
obtaining funding from the subsidy
programme, the National Fund for
Environmental Protection and Water
Management (NFOSiGW), changed
in September 2013, which penalized
the vacuum tube manufacturers and
importers. The introduction of new
provisions also coincided with the
financial resources allotted to the
programme running out. As it hap-
Graph n° 3Evolution of annually installed surfaces of solar thermal collectors in the European Union since 1994 (in m2)
1994 1995 1996 1997 1998 1999 2000 2001 2002 2003 2004 2005 2006 2007 2008 2009 2010 2011 2012 2013
664 209
725 815849 538 944 277 981 776
1 007 0391 271 591
1 596 792
1 199 069
1 461 040
1 731 104
2 142 220
3 125 302
3 054 867
4 609 764
4 172 553
3 765 254
3 591 580
3 486 192
3 027 532*
Member states included at the date of their accession. * Estimate Source: EurObserv’ER 2014
vel
ux/
esti
f
Velux, a roof windows specialist, announced end
of 2013 its exit from the solar thermal market.

solar thermal and concentrated solar power barometer – EUROBSERV’ER – may 2014
14
sola
r t
her
ma
l a
nd
co
nc
entr
ated
so
lar
po
wer
ba
ro
met
er
pens, many banks involved in it s
funding stopped approving subsidy
demands once their budget targets
were met. The programme managers
confirm these hitches, but claim that
new budgets have been allocated
to the banks which should enable
them to meet subsidy demands until
at least the end of the first six months
of 2014. In the second half of the year
a new programme, called Prosument,
should take over, which is considered
less advantageous for the solar ther-
mal market, because lower amounts
of subsidies are allocated per year
(150 million EUR in total for small ins-
tallations for the 2014-2020 period)
and other RES technologies compete
with solar thermal.
The French market in a very bad way French solar thermal market took a
nose dive in 2013. First EurObserv’ER
estimates put the solar thermal col-
lector market at 228 485 m² in 2013
(including 41 687 m2 in its overseas
territories) down from 282 386 m² (and
43 686 m2 respectively) in 2012, i.e.
19.1%. The institutional market also
plummeted (by 21.7%, with 98 676 m2
in 2013 down from 126 036 m2 in 2012).
Uniclima (the union for the heating,
cooling and ventilation industr y)
says that steady growth in the multi-
occupancy market since 2006 has
gone into reverse because the RT 2012
thermal regulation for new build has
been implemented, which penalizes
the multi-occupancy solar thermal
segment.
To head off this situation, the solar
thermal industry joined forces with
their heat pump and biomass coun-
terpar t s la st year and appealed
to the authorities. They call them-
selves Alliance chaleur renouvelable
[Renewable heat alliance] to give
formal expression to the specific
issues affecting renewable heat in
the national debate on energy transi-
tion. One of the special measures the
Alliance would like to see rolled out
is the establishment of a renewable
energ y obligation in the Energ y
Refurbishment Plan for Housing
(PREH) that has set an annual renova-
esti
ff
2012 2013
m2 MWth m2 MWth
Germany 16 309 000 11 416,3 17 222 000 12055,4
Austria 4 926 348 3 448,4 5 054 698 3538,3
Greece 4 121 025 2 884,7 4 164 025 2914,8
Italy 3 400 000 2 380,0 3 700 000 2590,0
Spain 2 964 864 2 075,4 3 197 379 2238,2
France*** 2 415 000 1 690,5 2 575 000 1802,5
Poland 1 211 500 848,1 1 485 000 1039,5
Portugal 966 770 676,7 1 024 004 716,8
Czech Republic 892 768 624,9 972 299 680,6
Netherlands 864 641 605,2 879 423 615,6
Danemark 712 823 499,0 786 000 550,2
Cyprus 693 999 485,8 681 157 476,8
United Kingdom 650 497 455,3 678 897 475,2
Sweden 482 000 337,4 488 000 341,6
Belgium 477 115 334,0 534 628 374,2
Ireland 252 677 176,9 280 379 196,3
Slovenia 202 537 141,8 211 574 148,1
Hungary 178 974 125,3 196 109 137,3
Slovakia 154 350 108,0 161 050 112,7
Romania 133 355 93,3 157 385 110,2
Croatia 119 600 83,7 140 600 98,4
Bulgaria 83 000 58,1 83 600 58,5
Malta 48 293 33,8 50 008 35,0
Finland 42 713 29,9 46 413 32,5
Luxembourg 32 952 23,1 39 131 27,4
Latvia 14 650 10,3 17 350 12,1
Lithuania 9 150 6,4 10 950 7,7
Estonia 6 120 4,3 7 920 5,5
Total European Union 28 42 366 721 29 657 44 844 979 31 391,5
* All technologies included unglazed collectors. ** Estimate. *** Overseas department included. Source: EurObserv’ER 2014
Table n° 6Cumulated capacity of thermal solar collectors* installed in the European Union in 2012 and 2013** (in m2 and in MWth)

solar thermal and concentrated solar power barometer – EUROBSERV’ER – may 2014
15
sola
r t
her
ma
l a
nd
co
nc
entr
ated
so
lar
po
wer
ba
ro
met
er
lector connection figure for 201 4
could rise to 242 000 m2. PlanEnergi
also gives installation figures for the
other types of system (individual hot
water heaters etc.) of 8 000 m2 in 2013
and 10 000 m2 in 2014.
a collector base of 44.8 Million sQuare Metres in 2013
According to EurObserv’ER, the solar
thermal collector surface area in ser-
vice in the European Union was about
44.8 million square metres at the end
of 2013, equating to 31.4 GWth of capa-
city (table 6). The top three countries
remain unchanged, namely Germany,
Austria and Greece. If we look at the
per capita surface indicator, Cyprus
is still the European pack leader
with 0.787 m2/p.c. (table 7) ahead of
Austria (0.598 m2/ p.c.) and Greece
(0.376 m2/p.c.).
the industry tries to Weather the recession
T h e in du s t r y wa s p e r su a d e d t o
invest heavily in production capa-
city and automated facilities on the
basis of the solar thermal market’s
steady, regular growth until 2008
and repeated European ambitions to
promote renewable heat as outlined
in the NREAP roadmaps published
in 2010. For the reasons explained
above, installation levels have been
much lower than predicted for a
number of years, which has forced
the European industry to consoli-
date and restructure.
L o o k i n g a t t h e m a j o r c o m p a n y
cha nge s , in S eptemb er 2 013 the
Methodology note
As every year part of the installation base is decommissioned or replaced
by new systems, estimating the total installed solar thermal collector
surface area in the European Union poses a quandary, and therefore
EurObserv’ER relies on the decommissioning assumptions of the national
experts contacted during its survey to assess the collector surface area. In
the absence of national statistics it applies a 20-year service life to glazed
collectors and 12 years to unglazed collectors.
tion rate target 500 000 dwellings per
annum through to 2017. The plan has
been up and running since September
2013 and grants householders means-
tested subsidies. For the lowest ear-
ners, an enhanced subsidy is awarded
(covering up to 50% of the cost of the
work, compared to the previous 35%)
along with a 3 000-euro bonus. Accor-
ding to the French government, 46%
of the population are eligible for this
aid. Middle-class households could
be awarded a new premium worth
1 350 euros. The Sustainable Deve-
lopment Tax Credit (CIDD, see www.
energies-renouvelables.org) and the
zero-rated green loan (éco-PTZ) are
now the two main incentive mecha-
nisms for undertaking energy refur-
bishment work in private housing. In
2014, the CIDD mechanism put solar
thermal at a significant disadvantage
as it is now 15% for expenses incur-
red in a single operation (as against
32% in 2013) and 25% for expenses
incurred as part of a work package
(as against 40% in 2013). A website
has also been set up to inform private
householders: www.renovation-info-
service.gouv.fr.
Delays getting solar district heating networks up and running in DenmarkThe growth of the Danish market is
carried by the government’s policy
to develop district heating networks
supplied by the solar thermal collec-
tor fields. By way of illustration, the
33 000 m2 of solar thermal collectors
supply the urban heating network
of Marstal, on the Danish island of
Ærø, that covers 55% of the heating
requirements of its 1 500 customers.
A 75 000 m3 storage tank ensures that
100% of the heating requirements
are covered 6–7 months of the year.
PlanEnergi, the Danish solar ther-
mal consultancy says that delays in
completing a number of installations
resulted in much weaker growth than
expected in 2013 (namely 93 000 m2
connected to heating networks in
2013), but it forecasts that the col-
wa
gn
er s
ola
r
Solar thermal roof plant in Frankfurt, Germany.

solar thermal and concentrated solar power barometer – EUROBSERV’ER – may 2014
16
sola
r t
her
ma
l a
nd
co
nc
entr
ated
so
lar
po
wer
ba
ro
met
er
Velux Group, the roof window spe-
cialist, announced its withdrawal
from the solar thermal market and
the end of production at its Hunga-
rian plant. The difficult solar ther-
mal market conditions are to blame
for Velux’ decision, as its sales were
much lower than expected. Astrid
Unger, the Group’s spokesperson
was categorical when she explai-
ned that solar thermal had become
a niche product for the roof mar-
ket and that installers dominated
most of the business. Another major
departure came from the Austrian
group, Greiner, which in the middle
of June 2013 announced that it was
closing the solar thermal business of
its Greiner Renewable Energy subsi-
diary that had acquired Sun Master’s
collector manufacturing plant early
in 2011. The group blames the tough
economic climate, the unpredictabi-
lity of support policies and market
slowdown for dashing its expecta-
tions.
The smallest players such as the Spa-
nish manufacturers Soliker, 9REN,
Energia Eólica y Solar and Geotec,
the Austria n collec tor ma nufa c-
turer are being pushed out by the
price war currently being waged
by the manufacturers because of
low demand, and competition from
imports of Chinese -made vacuum
tube collectors. Other solar system
manufacturers, such as the Czech
Solar Plus and TZB Svoboda, have
had to abandon in-situ flat collector
manufacturing and have resorted
to purchasing vacuum tubes from
China.
Company buyouts are another sign
of consolidation. For example, in
October 2013 Viessmann bought out
the French vacuum tube manufactu-
rer, SAED that went out of business
in April. Austrian manufacturer, Öko-
tech also filed for bankruptcy in the
spring of 2013 and was bought out
and rebranded as Asgard Solarkol-
lektoren by a private investor that
manufactures collectors.
At the start of 2014, one of the main
European solar thermal system sup-
pliers, General Solar Systems (GSS),
owner of the S onnenkraf t tra de
name, changed hands (the dispo -
sal came into force on 1 January).
The Solar Cap Group, that has full
or part holding of some of the main
“s ola r ” comp a ny na me s such a s
the Austrian GreenOneTec (50%),
the Danish Arcon Solar (100%), the
A m e r ic a n H e lio dy n e (1 0 0 %) a n d
the Indian Emmvee Solar Systems
(50%), decided to dispose of GSS for
an undisclosed amount to a group
of Austrian investors, headed up
by the GSS Group’s former Finance
Director, Primus Spitzer. GSS, which
Europe’s dependence on Russian gas
In an open letter dated 19 March 2014 to the Member States and governments, on the occasion of the European
Council meeting held on 20 and 21 March 2014 that was convened to discuss the European Commission’s proposals
for the second climate-energy package, the European representatives of the solar thermal (Estif), geothermal (EGEC)
and biomass (AEBIOM) sectors, noted that investing in renewable heat and cooling technologies would contribute
to securing energy supplies. They emphasized that if the member states adhered to the roadmaps set out in their
National Renewable Energy Action Plans (NREAP), imports of natural gas from third-party countries could be reduced
by about 35 million tonnes oil equivalent (toe) from 2020 onwards.
The Ukrainian crisis has shifted the European Council discussions’ centre of gravity to drawing up a common strategy
to reduce the EU’s dependence on energy supplies. The meeting provided an opportunity to highlight the heavy
dependency of a number of EU countries on Russian gas. According to the Europaforum website, “thirteen Member
States depend on Russia for more than 50% of their gas supplies, including six that are 100% dependent (Finland,
Slovakia, Bulgaria and the three Baltic States). Germany imports 34% of its gas from Russia. If EU leaders didn’t act now,
by 2035 the Union would be dependent on foreign exports for up to 80% of its oil and gas.”
Naturally the European Council has recommended the development of renewable energy sources and energy
efficiency as a way to reduce this dependence. The Council invited the European Commission “to conduct an in-depth
study of EU energy security and present its proposals by June 2014”. Referring to the recommendation, the European
Council President, Herman Van Rompuy declared: “Today we sent a clear signal that Europe is stepping up a gear to
reduce energy dependency, especially with Russia”.
Country m2/inhab. kWth/inhab.
Cyprus 0,787 0,551
Austria 0,598 0,419
Greece 0,376 0,263
Germany 0,214 0,150
Denmark 0,154 0,108
Malta 0,119 0,083
Slovenia 0,103 0,072
Portugal 0,098 0,068
Czech Republic 0,092 0,065
Luxembourg 0,073 0,051
Spain 0,068 0,048
Italy 0,062 0,043
Ireland 0,061 0,043
Netherlands 0,052 0,037
Sweden 0,051 0,036
Belgium 0,048 0,034
Poland 0,039 0,027
France*** 0,038 0,027
Croatia 0,033 0,023
Slovakia 0,030 0,021
Hungary 0,020 0,014
Bulgaria 0,011 0,008
United Kingdom 0,011 0,007
Latvia 0,009 0,006
Finland 0,009 0,006
Romania 0,008 0,006
Estonia 0,006 0,004
Lithuania 0,004 0,003
Total European Union 28 0,089 0,062
* All technologies included unglazed collectors. ** Estimate. *** Overseas departments included.
Source: EurObserv’ER 2014
Table n° 7Solar thermal capacities* in operation per capita (m2/inhab. and kWh/inhab.) in 2013**

solar thermal and concentrated solar power barometer – EUROBSERV’ER – may 2014
17
sola
r t
her
ma
l a
nd
co
nc
entr
ated
so
lar
po
wer
ba
ro
met
er
employs 150 people and had a sales
turnover of 45 million euros in 2013,
is now owned by PS Helios, an Aus-
trian company whose head office is
at Saint Veit.
Some companies are holding up well
despite the overall slump, such as
Austria’s GreenOneTec (held in equal
parts by Solar Cap and Kioto Group)
that announced it had picked up
market share in 2013 as some of its
competitors left the running. The
company says that its manufactu-
ring level is slightly down on 2012 (it
produced 651 000 m2 of collectors in
2013), and that its share of the Euro-
pean market is over 25%. The com-
pany posted sales of 90 million euros
in 2013 (100 million euros in 2012)
and is still investing. According to its
website, its investment volume rose
to 2 million euros in 2013 and should
reach 2.5 million euros in 2014. One
of the company’s main research prio-
rities is the development of a new
type of high-temperature collector
combined with a seasonal storage
system, capable of storing 6–8 times
more heat than a conventional solar
thermal system. This system under
development requires a collector
surface of 25 to 30 m2 combined with
a seasonal storage system 6–8 m3 to
be used during the year for space
heating.
a Question of political choice for 2020 and 2030
The solar thermal sector seems to be
in the throes of another crisis and
it is hard to imagine the sector fin-
ding the path to strong, sustainable
growth if it has to rely solely on its
ar
co
n s
ola
rthe 3.5 MW ground mounted solar thermal plant in Ulsted, denmark, distributes heat through a heating network to 1,000 people.
Table n° 8Representative European solar thermal collector manufacturers
Company Country Activity
Production 2012/2013
(collector area in m2)
Turnover 2013 (in M€)
Employees 2013
GreenOneTEC Austria Flat plate and vacuum tube collector 651 000 90 310
Bosch Thermotechnik * Germany Flat plate collector manufacturer 430 000 3 120 13 500
Viessmann * Germany Heating equipment / solar thermal 300 000 2 100 11 400
Vaillant Group * Germany Heating equipment supplier / solar thermal 200 000 2 330 12 100
BDR Thermea Group * Netherlands Heating equipment supplier / solar thermal 175 000 1 800 6 400
Wolf * Germany Heating equipment supplier 160 000 322 1 300
Riposol Austria Flat plate collector manufacturer 125 000 n.a. n.a.
Dimas Greece Flat plate collector manufacturer 120 000 n.a. n.a.
Nobel Xilinakis Greece Flat plate collector manufacturer 100 000 n.a. n.a.
Wagner & Co * Germany Flat plate collector manufacturer 90 000 n.a. 150
* Estimation based on Sun and Wind Energy 11+12/2013 (Solrico Study Solar Thermal World Map 2013). Source: EurObserv’ER 2014

solar thermal and concentrated solar power barometer – EUROBSERV’ER – may 2014
18
sola
r t
her
ma
l a
nd
co
nc
entr
ated
so
lar
po
wer
ba
ro
met
er
EurObserv’ER is posting an interactive database of the barometer indicators
on the www.energies-renouvelables.org (French-language) and www.
eurobserv-er.org (English-language) sites. Click the “Interactive EurObserv’ER
Database” banner to download the barometer data in Excel format.
Download
This barometer was prepared by Observ’ER in the scope of the “EurObserv’ER” Project which groups together Observ’ER (FR), ECN (NL), Institute for Renewable Energy (EC BREC I.E.O, PL), Jozef Stefan Institute (SL), Renac (DE) and Frankfurt School of Finance & Management (DE). Sole responsibility for the publication’s content lies with its authors. It does not represent the opinion of the European Communities nor that of Ademe or Caisse des dépôts. The European Commission, Ademe and Caisse des dépôts may not be held responsible for any use that may be made of the information published. This action benefits from the financial support of Ademe, the Intelligent Energy – Europe programme and Caisse des dépôts.
Co-funded by the Intelligent Energy EuropeProgramme of the European Union
The topic of the next barometer will be biofuels.
own financial resources. The blood-
letting should end this year. The sec-
tor’s new-year forecasts indicated
that it expected the 2014 market to
stabilize or show a slight upswing.
But it is clear that full-blown solar
thermal market recover y will be
contingent on an all-out renewable
heat development policy that com-
bines incentives to produce with pro-
motional campaigning. The Ukrainian
crisis, that has alerted the public and
politicians of how dependent the
European Union is on energy supplies
from outside, could help shift policy
lines (see box p. 16). At the same time,
11 European associations that repre-
sent renewable heat have joined
forces in a Heat Coalition to urge the
European institutions to apply reme-
dial measures to put heat production
back at the top of the agenda and
revive the negotiation framework
surrounding the adoption of the
second climate and energy package.
The message has already struck a
chord with the European Parliament,
which reminded the Commission of
the importance of heat and cooling
in a report on the 2030 framework
o n e n e r g y a n d c l im a t e p o li c i e s
published on 5 February 2014 that
reasserts the importance of setting
binding renewable energy targets.
It would be unfair to claim that the
European Commission has been inac-
tive. On 6 September 2013, the regula-
tion on the eco-design requirements
of boilers and hot water heaters was
published in the Official Journal of
the European Union. From September
2015 onwards these appliances will
be allocated energy labels to enable
consumers to gauge the energy effi-
ciency and consumption differences
between the various systems. The
label will indicate an energy cate-
gory ranging from A+++ to F, where
the best score will be awarded to…
solar thermal systems that benefit
from the only technology eligible
for category A+++! Category G will
be abolished to withdraw the worst-
performing appliances from the mar-
ket. The system will naturally benefit
sales of renewable energy-fuelled
appliances.
While the implementation of spe-
cific, bold measures reaffirmed by
the national and European decision-
makers is awaited, EurObserv’ER rec-
kons that the European Union will
achieve half of its combined NREAP
targets (graph 4). According to EurOb-
serv’ER, heat production from the
solar thermal sector reached 2 Mtoe
in 2013, i.e. 30.8% of the NREAP 2020
target.
Source: EurObserv’ER 2014
Current Trend
NREAP roadmaps
1 707
1 8391 959
2 245
3 164
20202015 2016 2017 2018 20192012 2013 2014
3 019
6 348
2011
Graph n° 4Comparison of the current trend against the NREAP (National Renewable Energy Action Plans) roadmaps (in ktoe)
Source table 4 et 5 : AGEE-Stat (Germany), The Institute for Renewable Energy (Poland), Assolterm (Italy), ASIT (Spain), Observ’ER (France), AEE Intec (Austria), Planenergi (Denmark), Ministry of Industry and Trade (Czech Republic), Apisolar (Portugal), CBS (Netherlands), ATTB (Belgium), University of Miskolc (Hungary), Cyprus Institute of Energy, SEAI (Ireland Republic), Econet Romania, Jozef Stefan Institut (Slovenia), Svensk solenergi (Sweden), Energy Center Bratislava (Slovakia), APEE (Bulgaria), Statec (Luxembourg), Malta Ressource Authority, University of Zagreb FER (Croatia), ESTIF.