Embed Size (px)
Citation preview
1
Powerpoint slides copied from or based upon:
Connally,
Hughes-Hallett,
Gleason, Et Al.
Copyright 2007 John Wiley & Sons, Inc.
Functions Modeling Change
A Preparation for Calculus
Third Edition
1.5
GEOMETRIC PROPERTIES OF LINEAR FUNCTIONS
2
Interpreting the Parameters of a Linear Function
The slope-intercept form for a linear function is y = b + mx, where b is the y-intercept and m is the slope.
The parameters b and m can be used to compare linear functions.
3Page 35
With time, t, in years, the populations of four towns, PA, PB, PC and PD, are given by the following formulas:
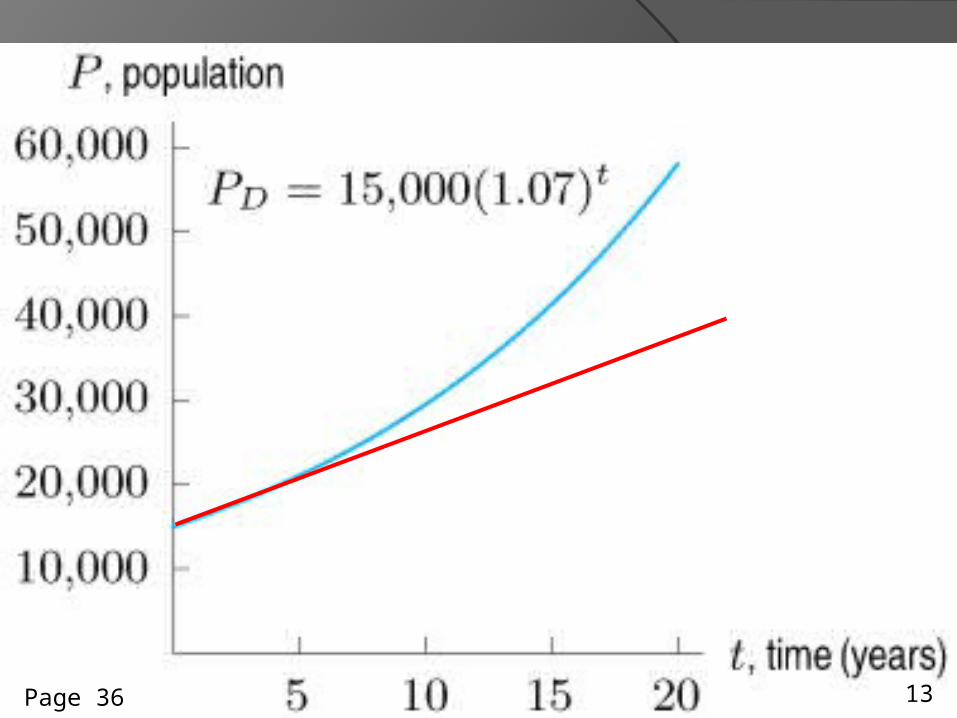
PA=20,000+1,600t, PB=50,000-300t, PC=650t+45,000, PD=15,000(1.07)t
(a) Which populations are represented by linear functions?
(b) Describe in words what each linear model tells you about that town's population. Which town starts out with the most people? Which town is growing fastest?
4Page 35 Example 1
PA=20,000+1,600t, PB=50,000-300t, PC=650t+45,000, PD=15,000(1.07)t
(a) Which populations are represented by linear functions?
5Page 35
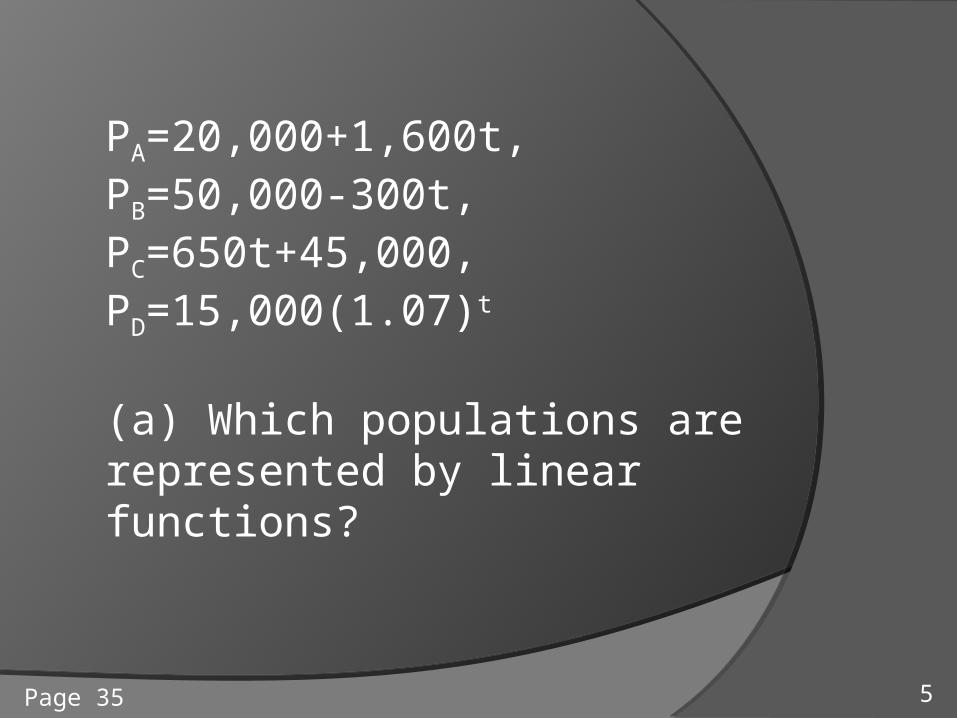
PA=20,000+1,600t, PB=50,000-300t, PC=650t+45,000, PD=15,000(1.07)t
(a) Which populations are represented by linear functions?
Which of the above are of the form:
y = b + mx (or here, P = b + mt)?
6Page 35

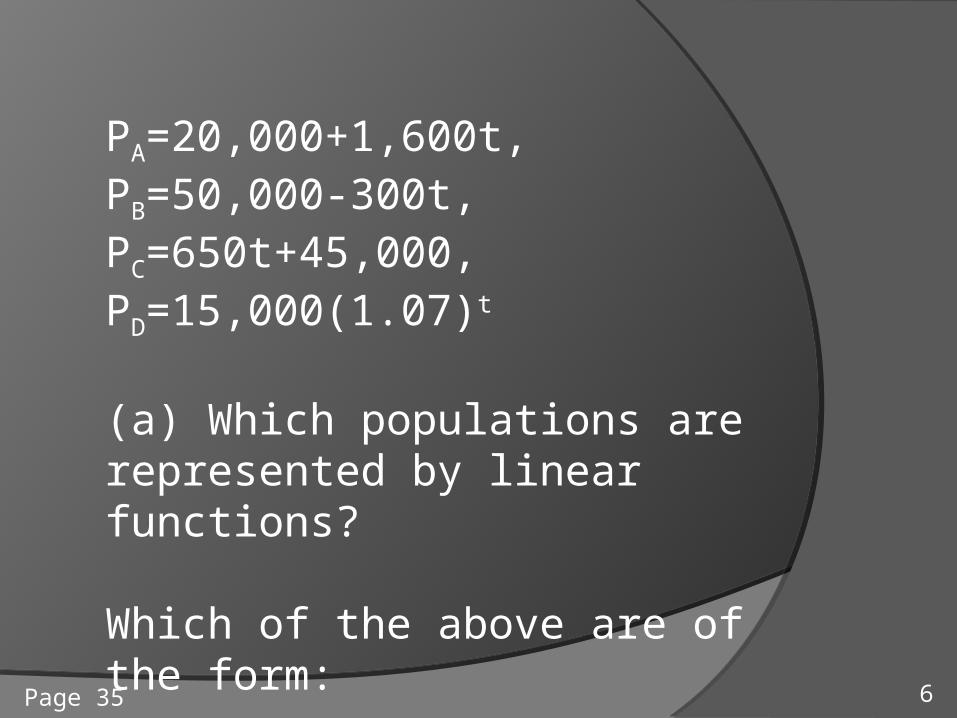
PA=20,000+1,600t, PB=50,000-300t, PC=650t+45,000, PD=15,000(1.07)t
(a) Which populations are represented by linear functions?
Which of the above are of the form:
y = b + mx (or here, P = b + mt)?
A, B and C7Page 35
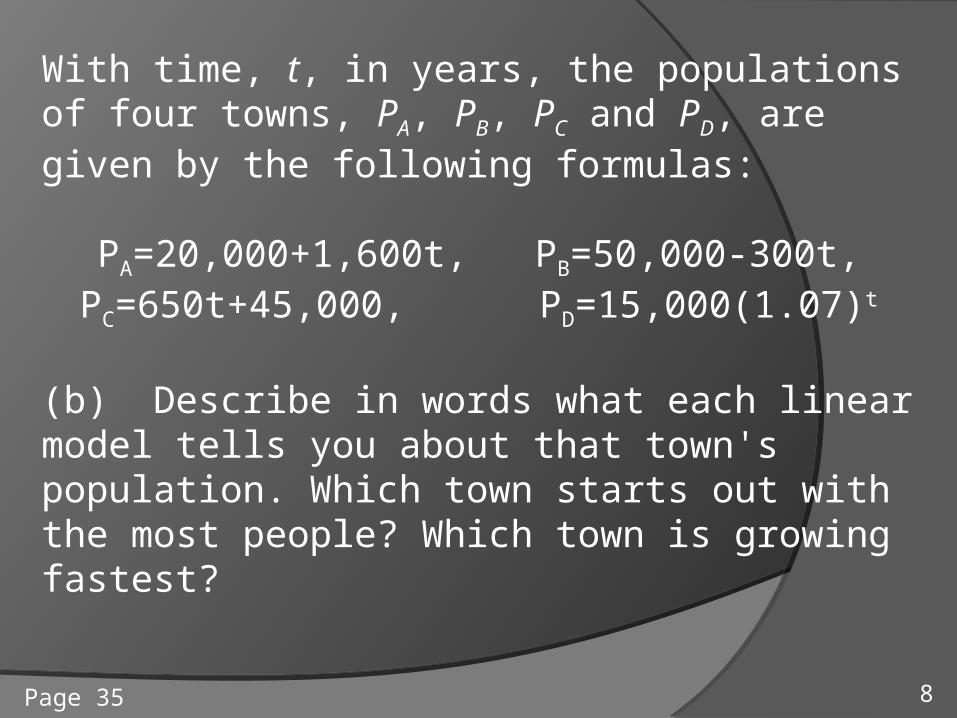
With time, t, in years, the populations of four towns, PA, PB, PC and PD, are given by the following formulas:
PA=20,000+1,600t, PB=50,000-300t, PC=650t+45,000, PD=15,000(1.07)t
(b) Describe in words what each linear model tells you about that town's population. Which town starts out with the most people? Which town is growing fastest?
8Page 35
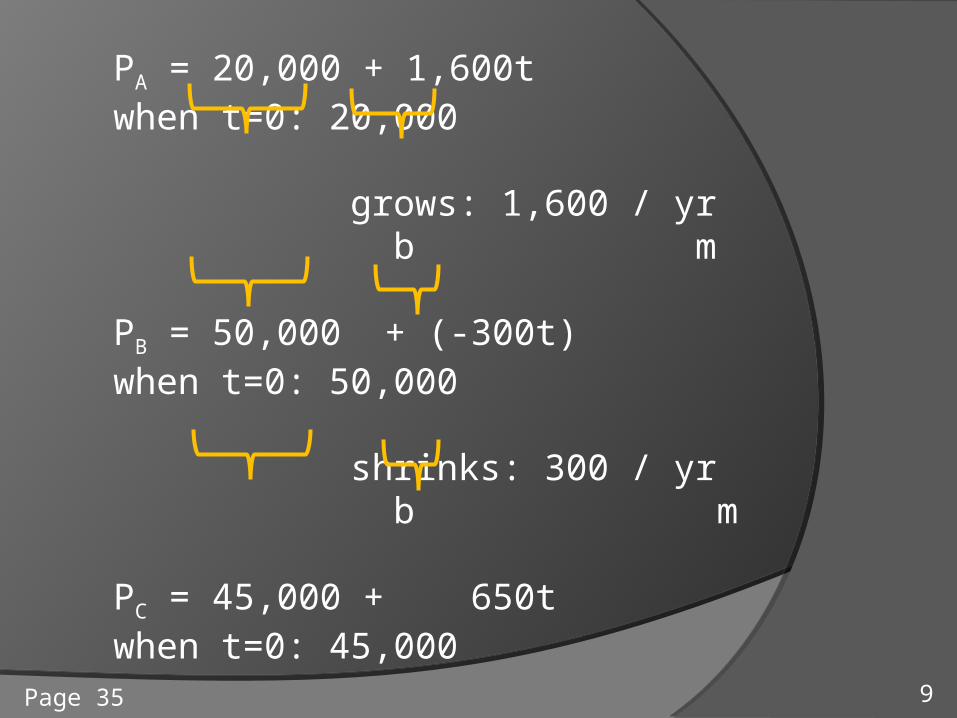
PA = 20,000 + 1,600t when t=0: 20,000 grows: 1,600 / yr b m
PB = 50,000 + (-300t) when t=0: 50,000 shrinks: 300 / yr b m
PC = 45,000 + 650t when t=0: 45,000 grows: 650 / yr b m
PD = 15,000(1.07)t when t=0: 15,000 grows: 7% / yr
9Page 35
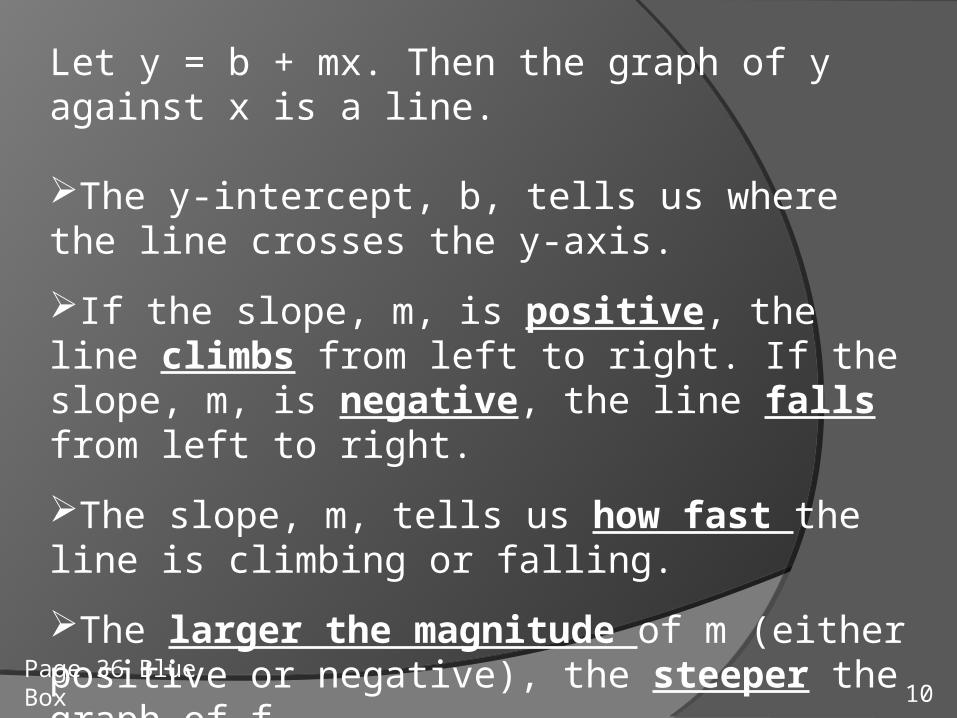
Let y = b + mx. Then the graph of y against x is a line. The y-intercept, b, tells us where the line crosses the y-axis.
If the slope, m, is positive, the line climbs from left to right. If the slope, m, is negative, the line falls from left to right.
The slope, m, tells us how fast the line is climbing or falling.
The larger the magnitude of m (either positive or negative), the steeper the graph of f.
10Page 36 Blue Box
(a) Graph the three linear functions PA, PB, PC from Example 1 and show how to identify the values of b and m from the graph.
(b) Graph PD from Example 1 and explain how the graph shows PD is not a linear function.
11Page 36 Example 2
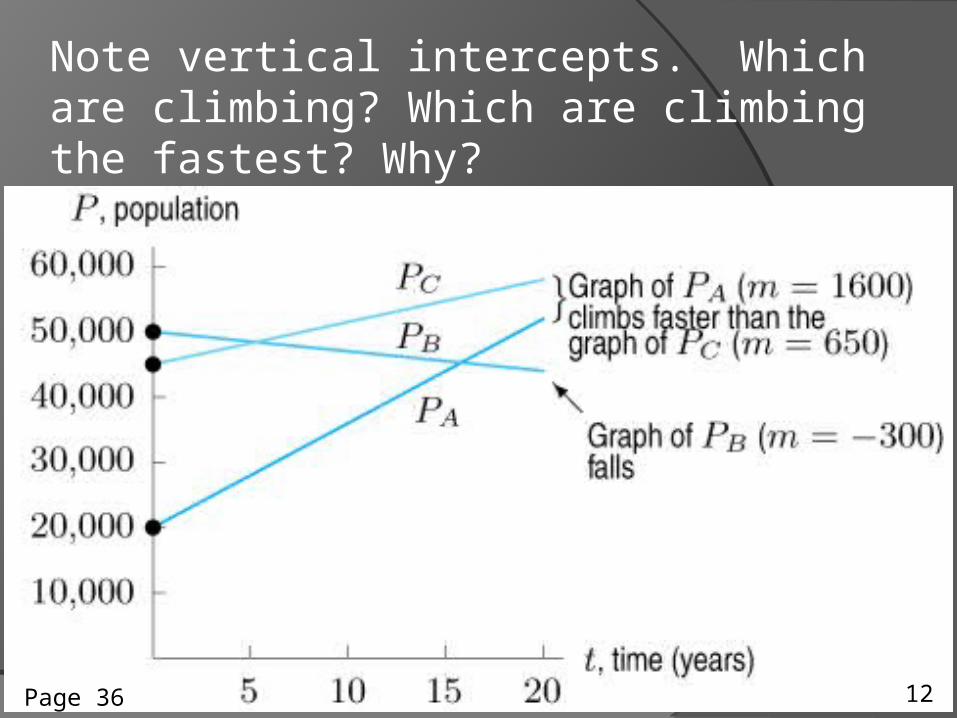
Note vertical intercepts. Which are climbing? Which are climbing the fastest? Why?
12Page 36
A
13Page 36
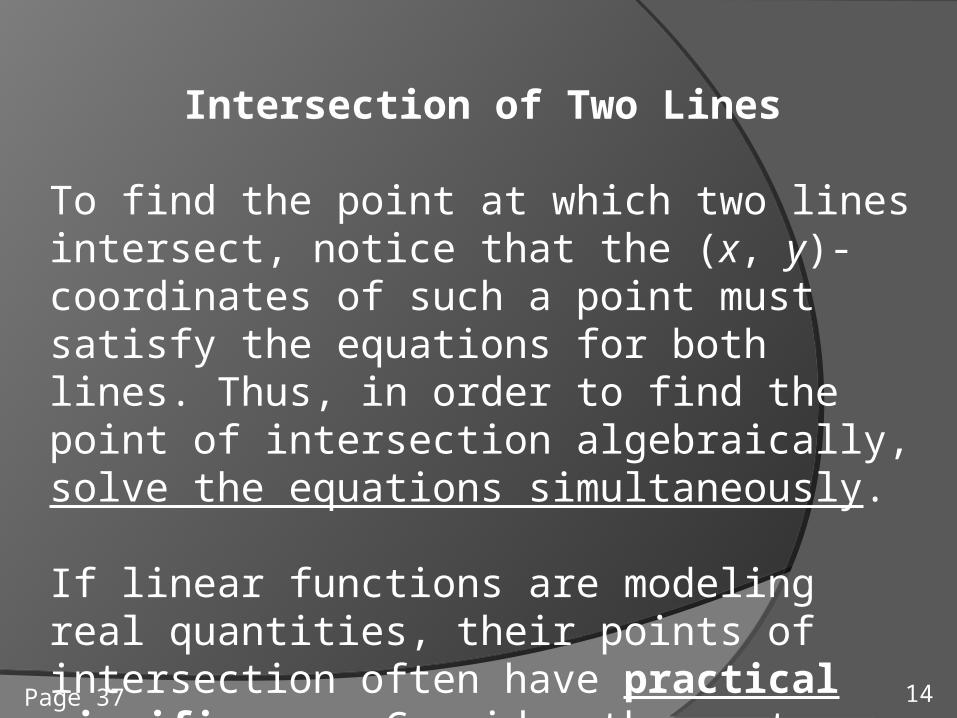
Intersection of Two Lines
To find the point at which two lines intersect, notice that the (x, y)-coordinates of such a point must satisfy the equations for both lines. Thus, in order to find the point of intersection algebraically, solve the equations simultaneously. If linear functions are modeling real quantities, their points of intersection often have practical significance. Consider the next example.
14Page 37
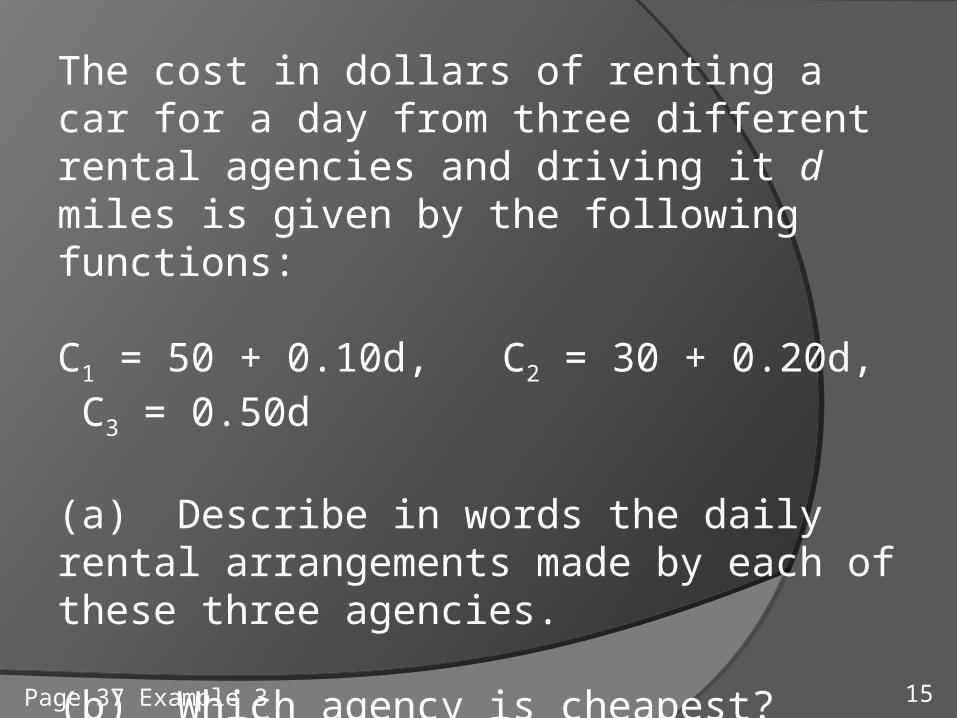
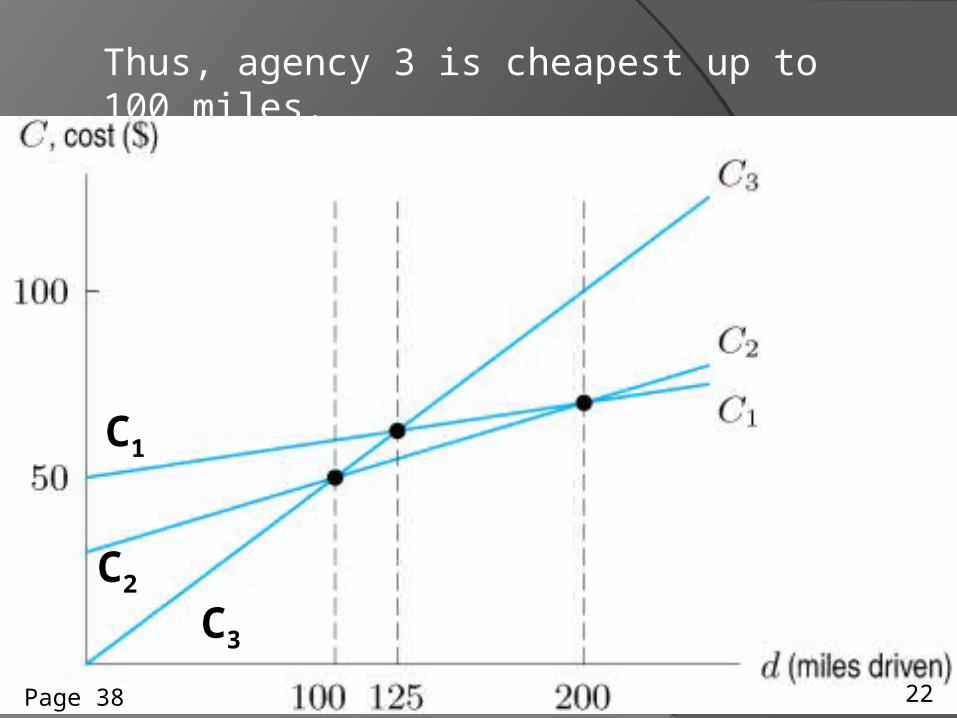
The cost in dollars of renting a car for a day from three different rental agencies and driving it d miles is given by the following functions:
C1 = 50 + 0.10d, C2 = 30 + 0.20d, C3 = 0.50d (a) Describe in words the daily rental arrangements made by each of these three agencies.
(b) Which agency is cheapest?
15Page 37 Example 3
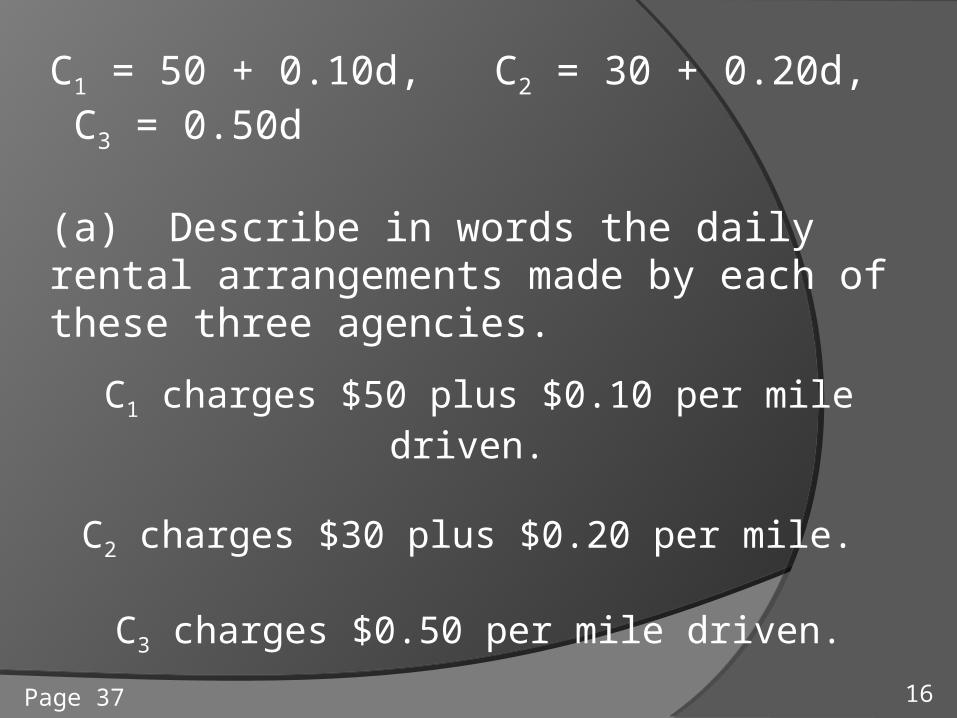
C1 = 50 + 0.10d, C2 = 30 + 0.20d, C3 = 0.50d (a) Describe in words the daily rental arrangements made by each of these three agencies.
C1 charges $50 plus $0.10 per mile driven.
C2 charges $30 plus $0.20 per mile.
C3 charges $0.50 per mile driven.
16Page 37
A
C1
C2
C3
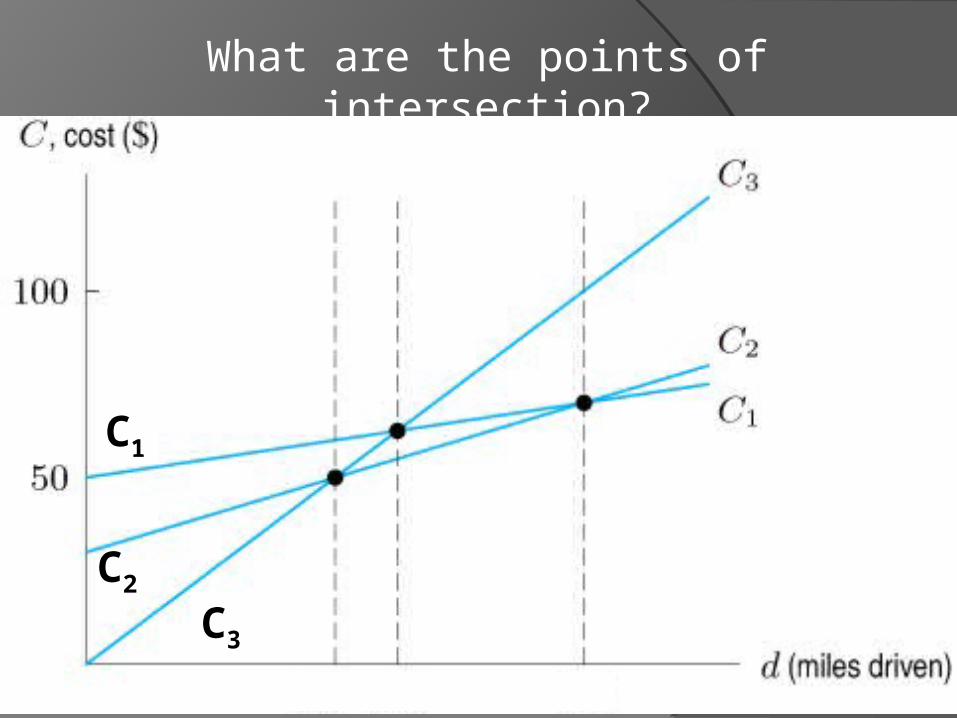
What are the points of intersection?
17Page
C1 = 50 + 0.10d, C2 = 30 + 0.20d, C3 = 0.50d
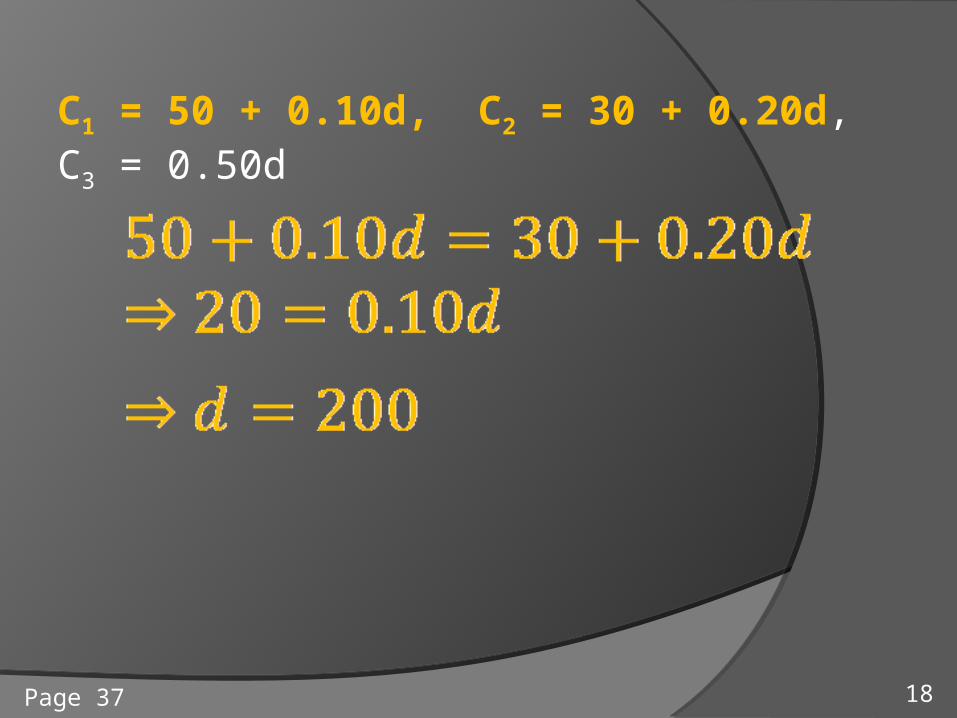
18Page 37
C1 = 50 + 0.10d, C2 = 30 + 0.20d, C3 = 0.50d
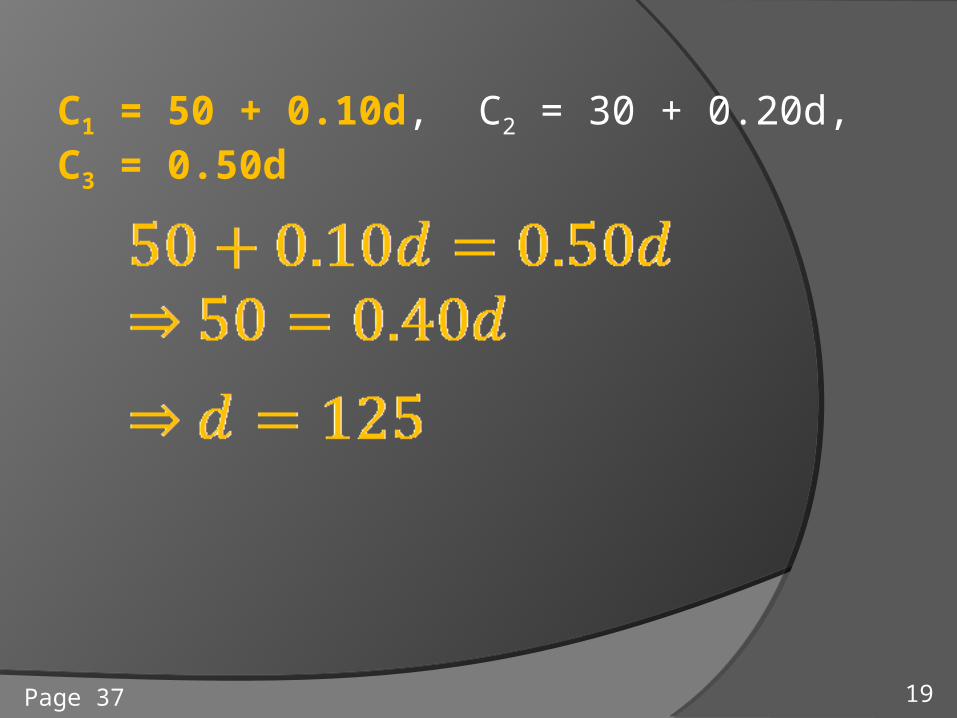
19Page 37
C1 = 50 + 0.10d, C2 = 30 + 0.20d, C3 = 0.50d
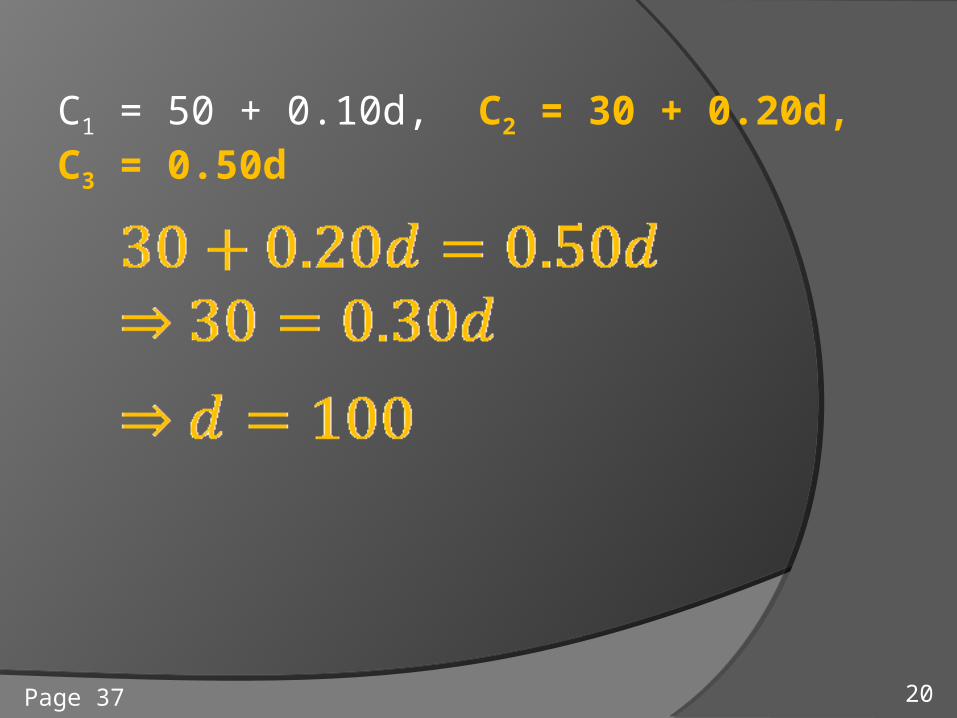
20Page 37
A
C1
C2
C3 21Page 38
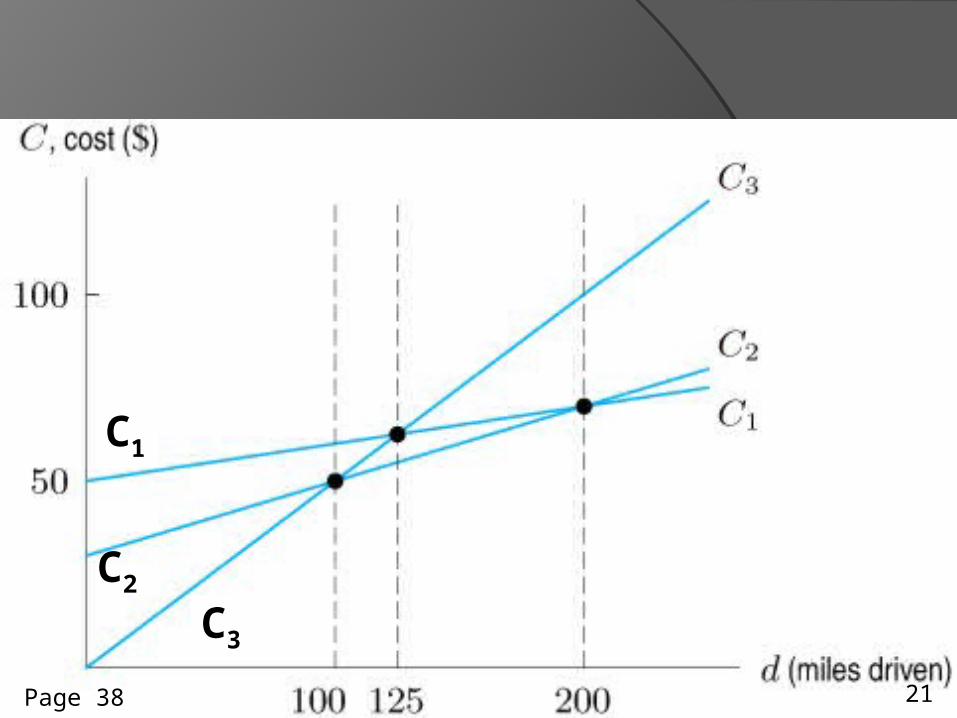
A
C1
C2
C3
Thus, agency 3 is cheapest up to 100 miles.
22Page 38
A
C1
C2
C3
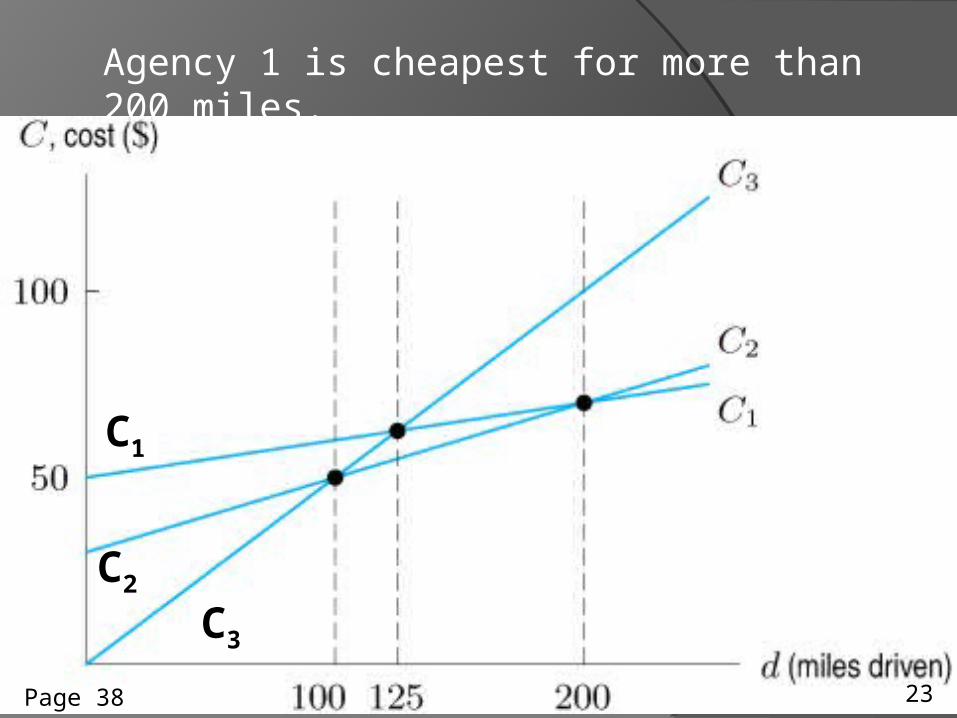
Agency 1 is cheapest for more than 200 miles.
23Page 38
A
C1
C2
C3
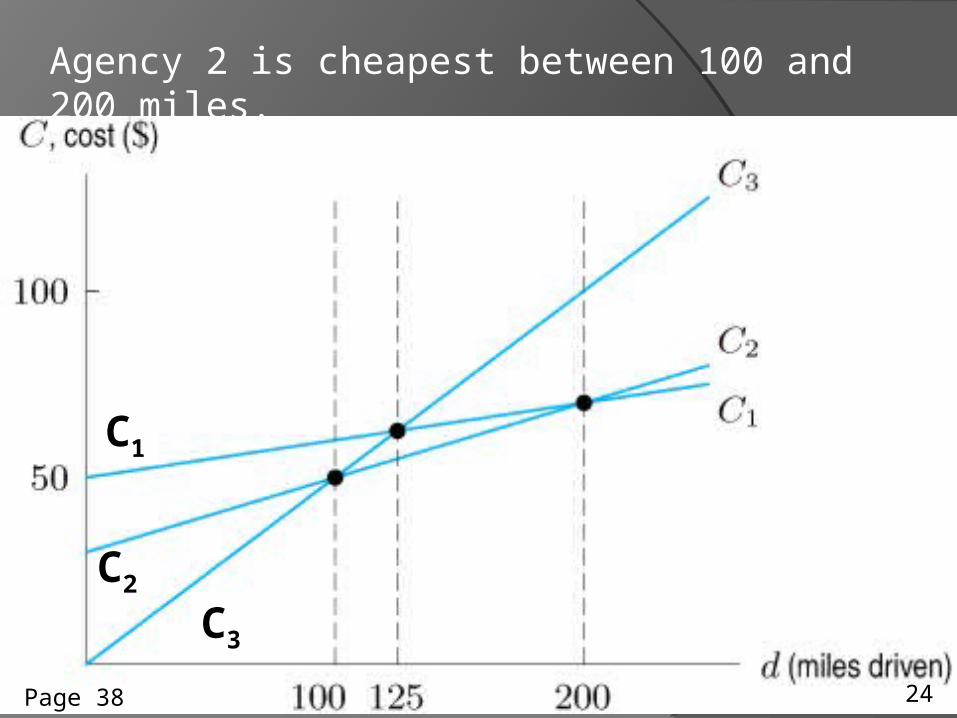
Agency 2 is cheapest between 100 and 200 miles.
24Page 38
Equations of Horizontal and Vertical Lines
An increasing linear function has positive slope and a decreasing linear function has negative slope.
What about a line with slope m = 0?
25Page 38
Equations of Horizontal and Vertical Lines
An increasing linear function has positive slope and a decreasing linear function has negative slope.
What about a line with slope m = 0? If the rate of change of a quantity is zero, then the quantity does not change.
Thus, if the slope of a line is zero, the value of y must be constant. Such a line is horizontal.
26Page 38
Plot the points:(-2, 4) (-1,4)(1,4) (2,4)
27Page 38
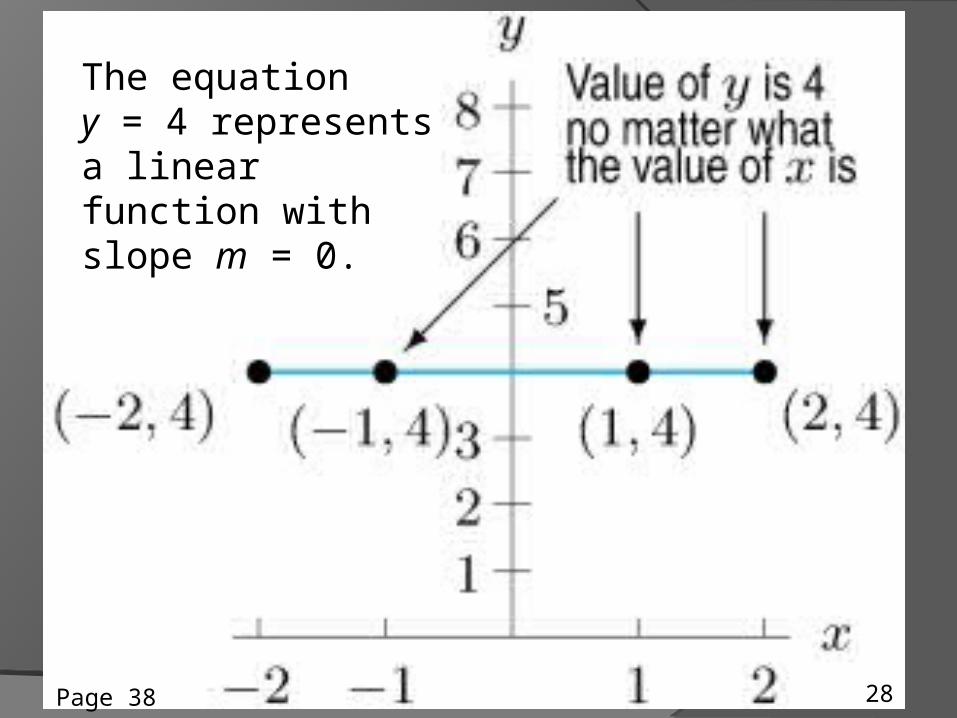
AThe equation y = 4 represents a linear function with slope m = 0.
28Page 38
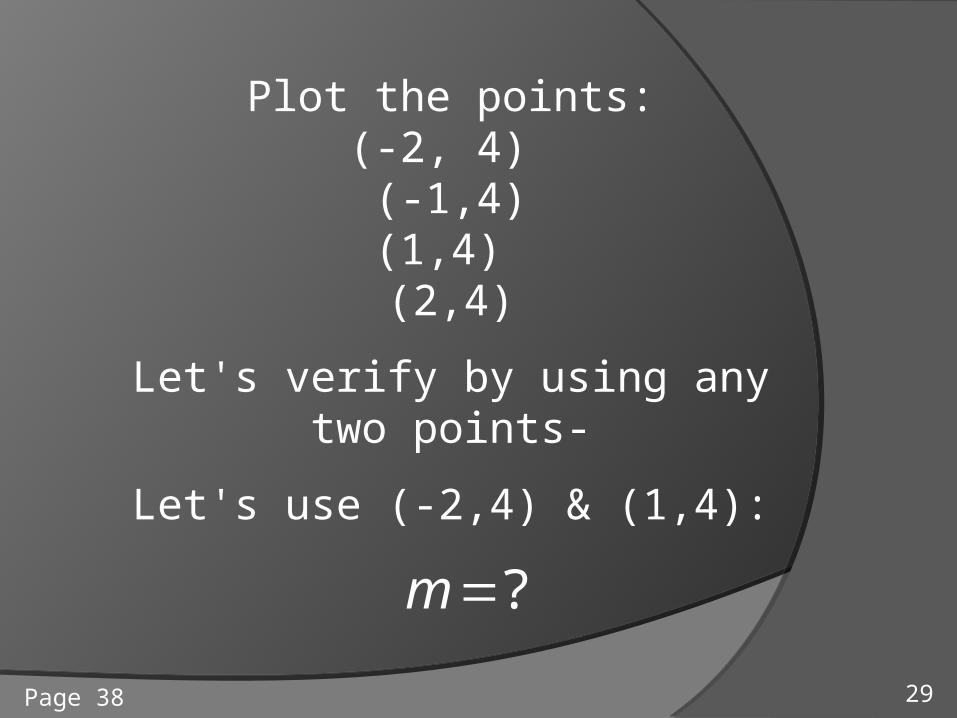
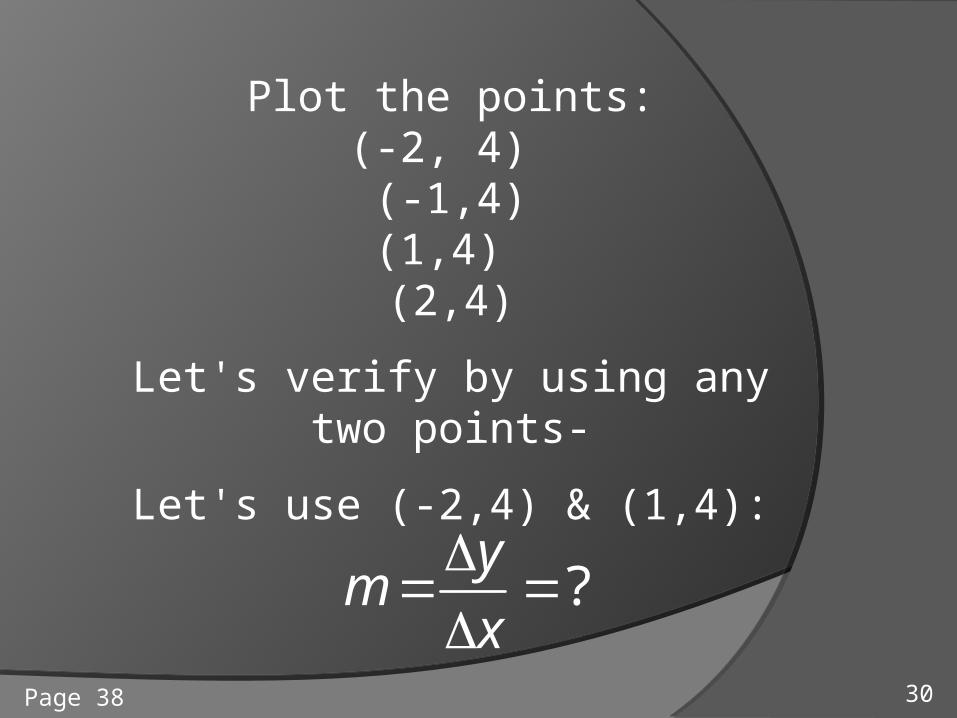
Plot the points:(-2, 4) (-1,4)(1,4) (2,4)
Let's verify by using any two points-
Let's use (-2,4) & (1,4):
?m
29Page 38
Plot the points:(-2, 4) (-1,4)(1,4) (2,4)
Let's verify by using any two points-
Let's use (-2,4) & (1,4):
?
y
mx
30Page 38
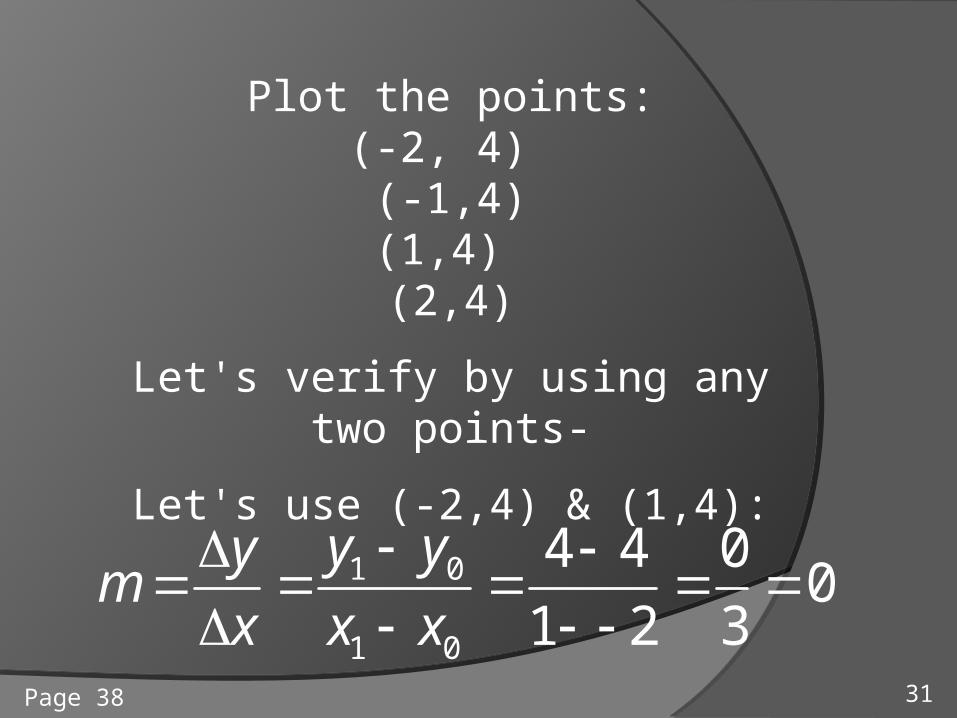
Plot the points:(-2, 4) (-1,4)(1,4) (2,4)
Let's verify by using any two points-
Let's use (-2,4) & (1,4):
1 0
1 0
4 4 00
1 2 3
y yy
mx x x
31Page 38
Now plot the points:(4,-2) (4,-1)(4,1) (4,2)
32Page 38
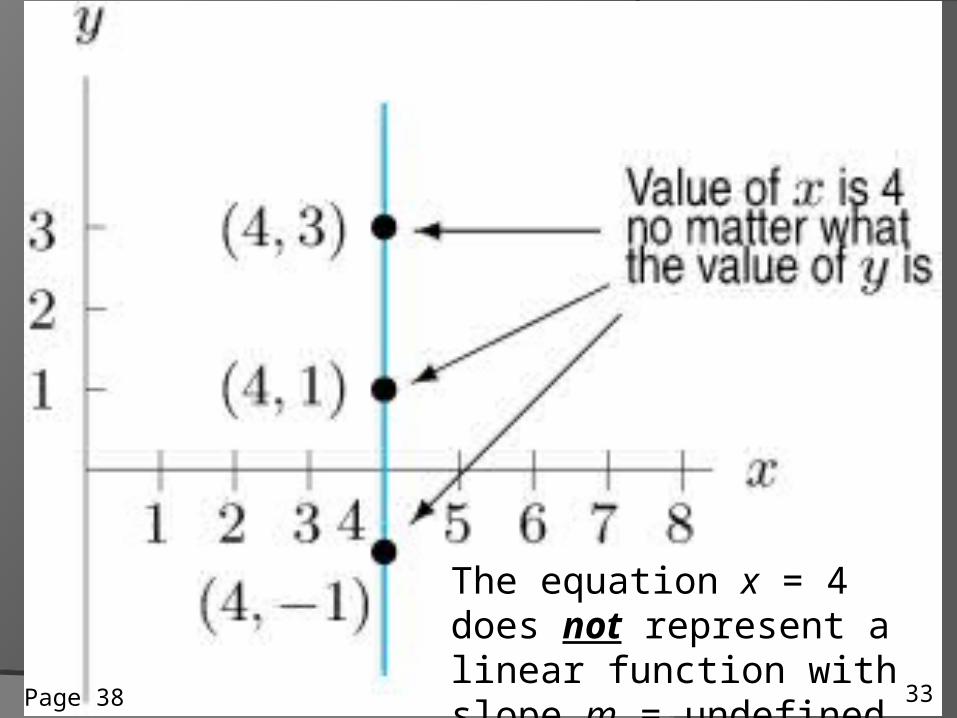
A
The equation x = 4 does not represent a linear function with slope m = undefined.
33Page 38
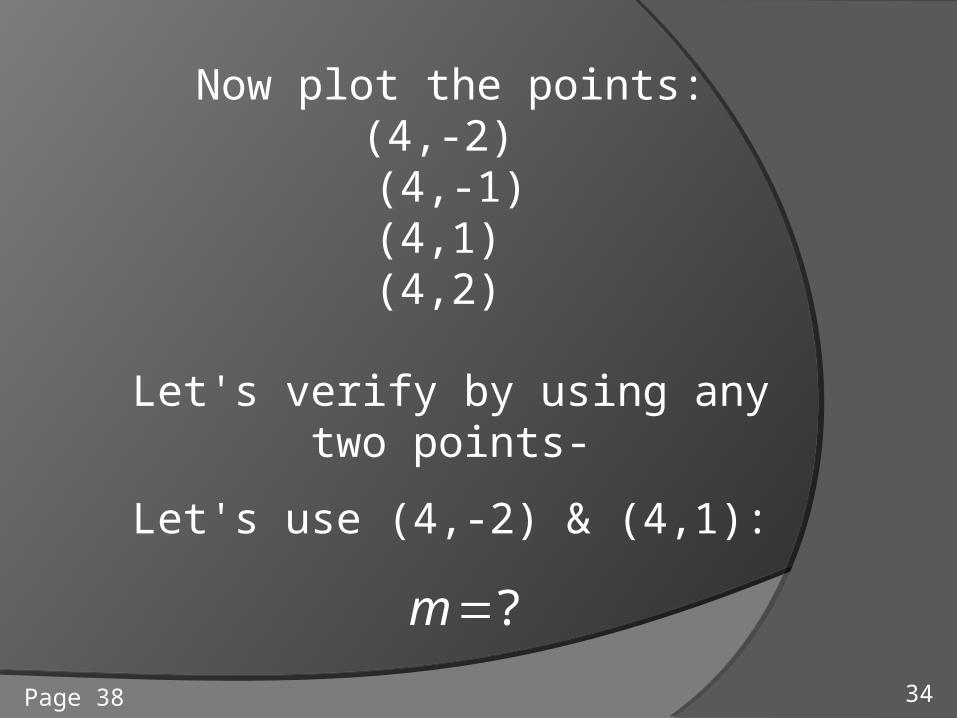
Now plot the points:(4,-2) (4,-1)(4,1) (4,2)
Let's verify by using any two points-
Let's use (4,-2) & (4,1):
?m
34Page 38
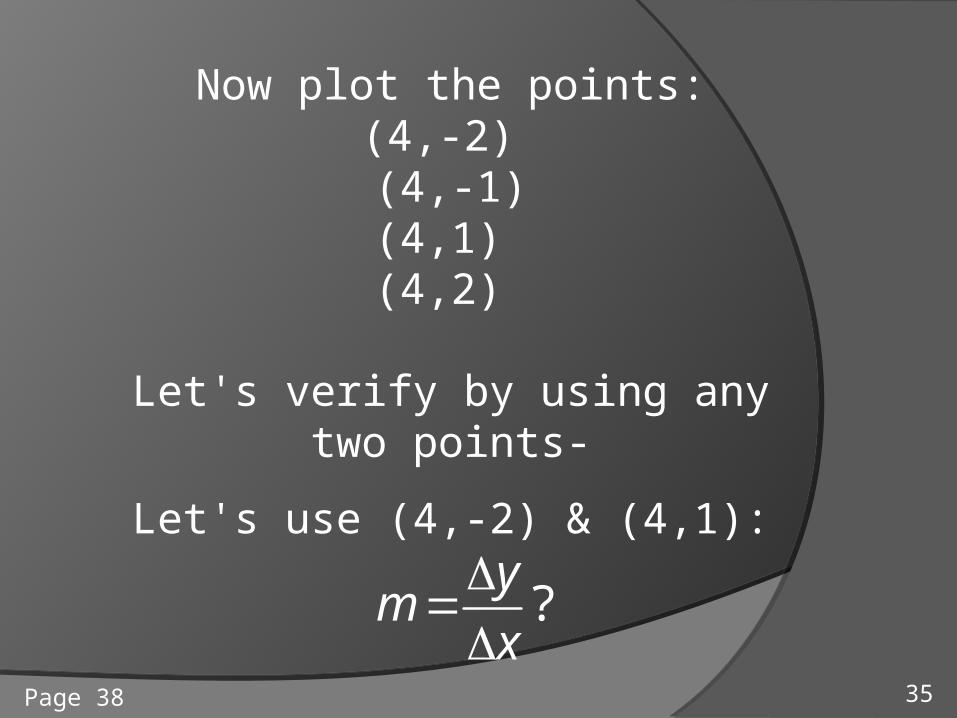
Now plot the points:(4,-2) (4,-1)(4,1) (4,2)
Let's verify by using any two points-
Let's use (4,-2) & (4,1):
?
y
mx
35Page 38
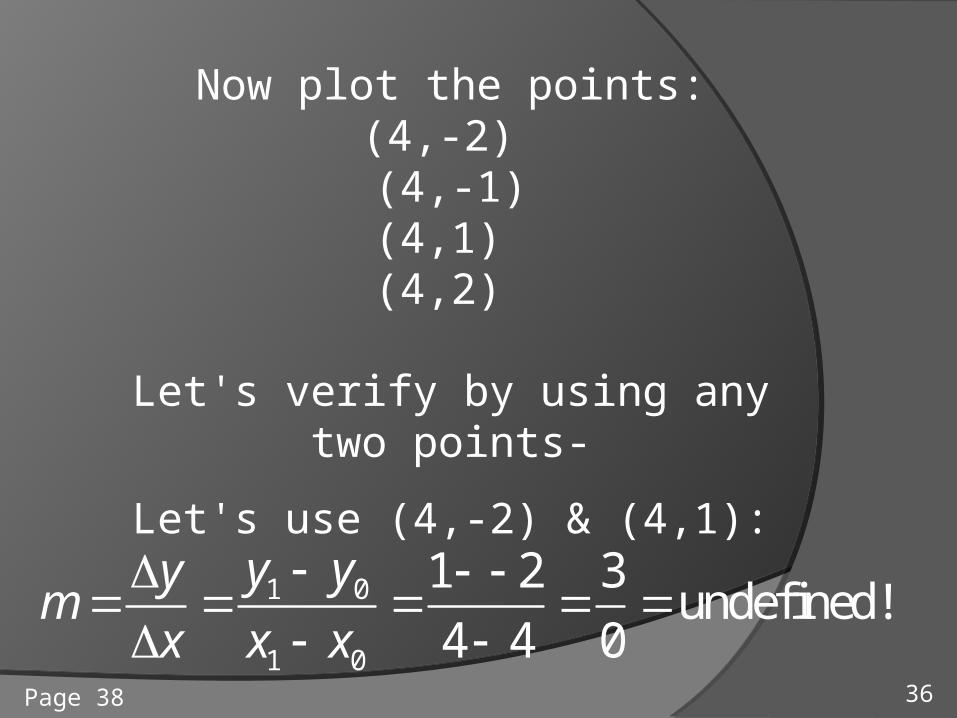
Now plot the points:(4,-2) (4,-1)(4,1) (4,2)
Let's verify by using any two points-
Let's use (4,-2) & (4,1):
1 0
1 0
1 2 3undefined!
4 4 0
y yy
mx x x
36Page 38
For any constant k: The graph of the equation y = k is a horizontal line and its slope is zero. The graph of the equation x = k is a vertical line and its slope is undefined.
37Page 39 Blue Box
Slope of Parallel (||) & Perpendicular ( ) lines: || lines have = slopes, while lines have slopes which are the negative reciprocals of each other. So if l1 & l2 are 2 lines having slopes m1 & m2, respectively. Then:
these lines are || iff m1 = m2
these lines are iff m1 = - 1 / m2
38Page 39 Blue Box
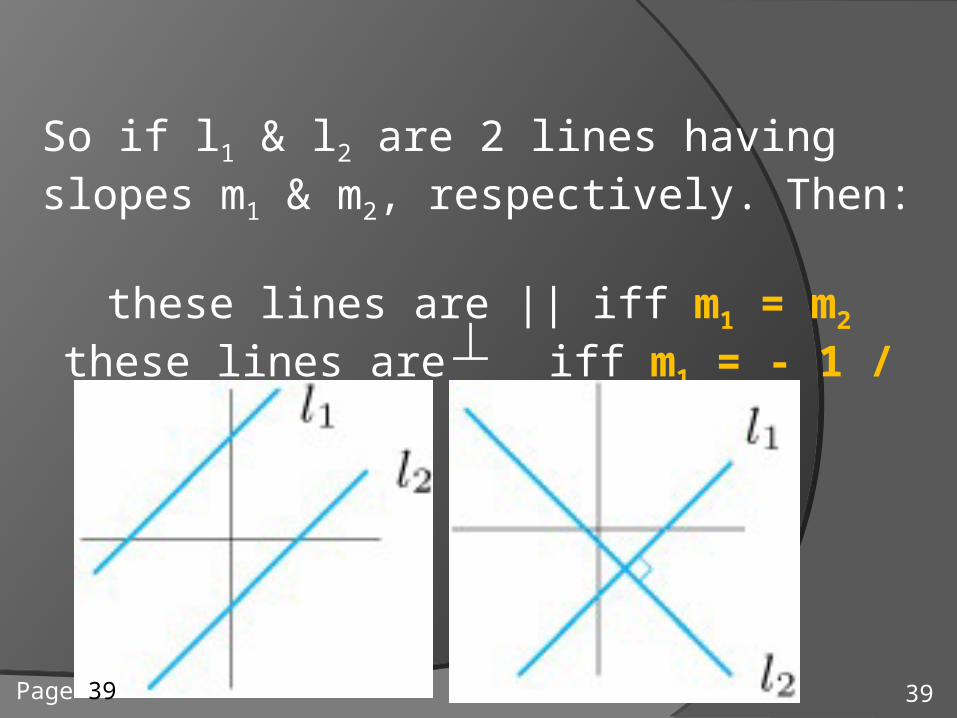
So if l1 & l2 are 2 lines having slopes m1 & m2, respectively. Then:
these lines are || iff m1 = m2
these lines are iff m1 = - 1 / m2
39Page 39

Are these 2 lines || or or neither?
y = 4+2x, y = -3+2x
40Page N/A
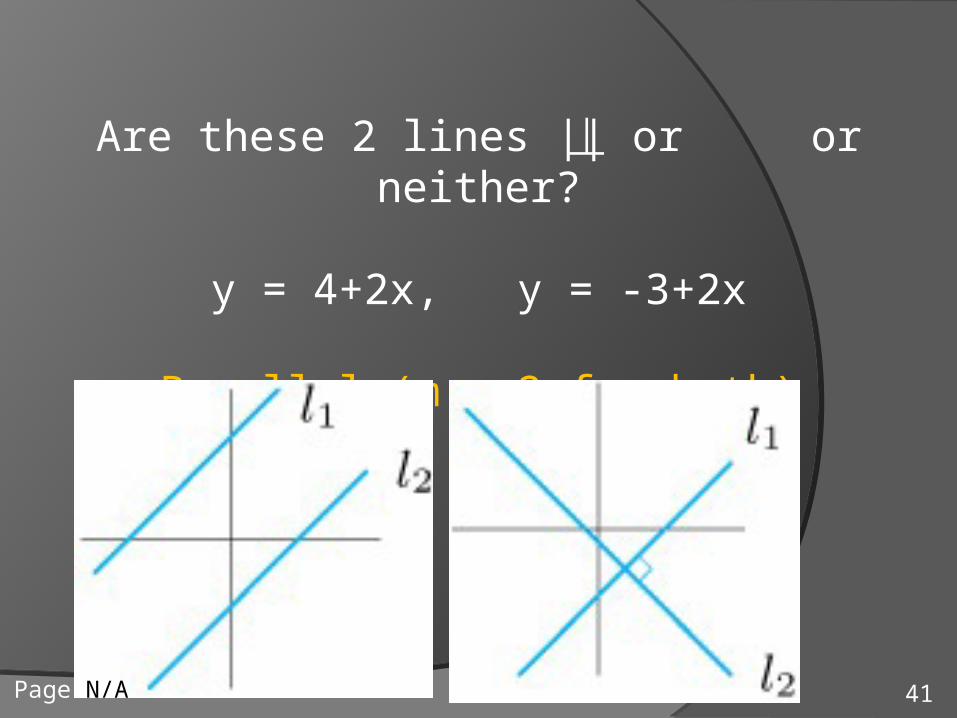
Are these 2 lines || or or neither?
y = 4+2x, y = -3+2x
Parallel (m = 2 for both)
41Page N/A

Are these 2 lines || or or neither?
y = -3+2x, y = -.1 -(1/2)x
42Page N/A
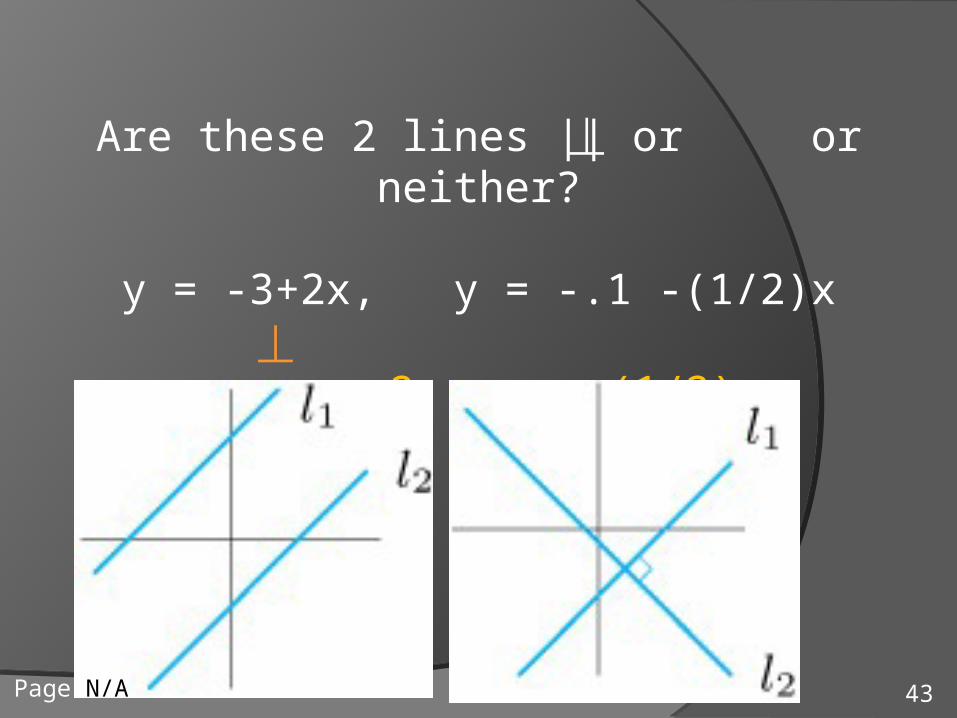
Are these 2 lines || or or neither?
y = -3+2x, y = -.1 -(1/2)x
: m1 = 2, m2 = -(1/2)
43Page N/A
End of Section 1.5.
44