Embed Size (px)
Citation preview
1
13th OECD – NBS Workshop on National Accounts,
November 2009
Stiglitz-Sen-Fitoussi Commission
Paul Schreyer
OECD Statistics Directorate
2
“Many people looked at US GDP growth in the 2000s and said: ‘How fast you are growing – we must imitate you.’ But it was not sustainable or equitable growth. Even before the crash, most people were worse off than they were in 2000. It was a decade of decline for most Americans.”
Joe Stiglitz
Financial Times 27 January 2009
3
Main features Commission put in place Feb 2008, report presented Sep
2009
Main thrust: statistical systems need to re-focus from measuring market production to measuring people’s well-being, and sustainability
Why important? Issue for credibility of statistical system, quality of political debates and democracy– Address discrepancy between perception and official
data– What we measure affects what we do
4
Main features
Arguing for such shift does not imply minimising either the significance of the NA (“one of the major inventions of the last century”) or the importance of improving existing measures of economic production (e.g. quality changes), but recognising:
– a “tension” within the NA between a production- and welfare-focus that has always been there but is more evident today than in the past
– a “political demand” for going beyond-GDP that was not there in the past and that combines with a ‘grass-root’ demand by citizens and civil society
5
Main features
Report covers a broad field under headings of:
i) Classical GDP issues – material living standards
ii) Quality of life;
iii) Inter-temporal aspects (sustainability).
6
Needed: statistical measures that bear a closer relation with people’s experiences
Such measures are already available inside the NA or can be developed consistent with the NA
NA ≠ GDP! 5 messages
Improve measures of material living standards (‘Classical GDP Issues’)
7
Message #1: look at income rather than production
At current prices: Income = production But real income ≠volume of production
Volume = the ‘quanity’ of goods and services coming out of the national ‘factory door’
‘Real’ income = how much goods and services (some of them produced abroad) can I purchase with the income generated in the factory?
8
Net rather than gross…and accounting for international income flows
Real net income instead of volume GDP Net income accounts for depreciation People receive income and transfer payments from
abroad and they also send them abroad Important issue in developing countries when eg incomes
are re-patriated by foreign investors: value of production may go up but national disposable income may decline
9
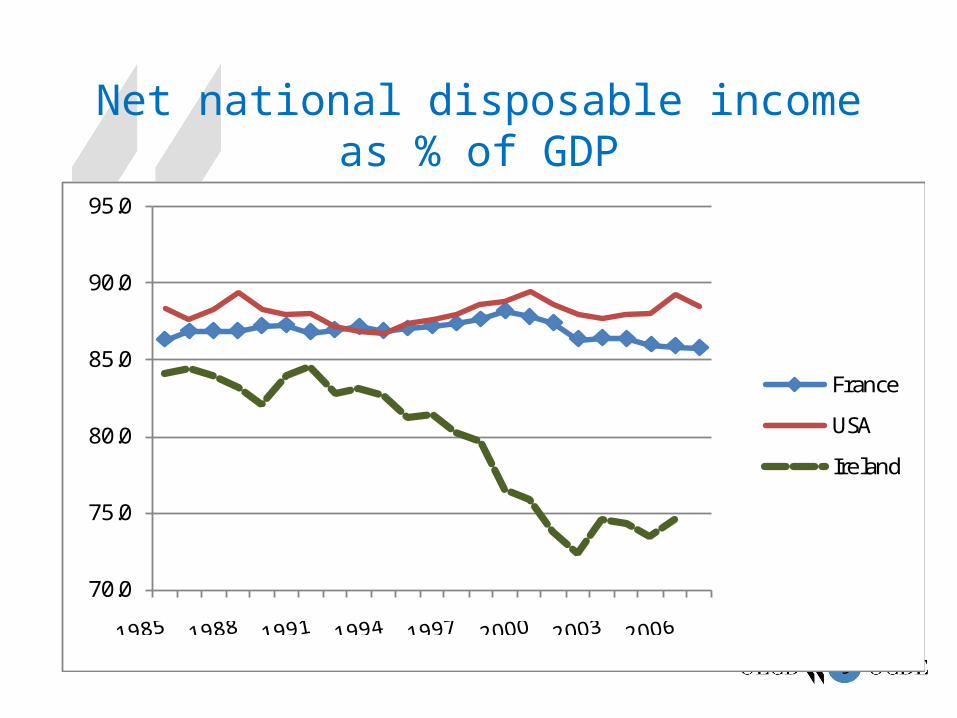
Net national disposable income as % of GDP
70.0
75.0
80.0
85.0
90.0
95.0
France
USA
Ireland
10
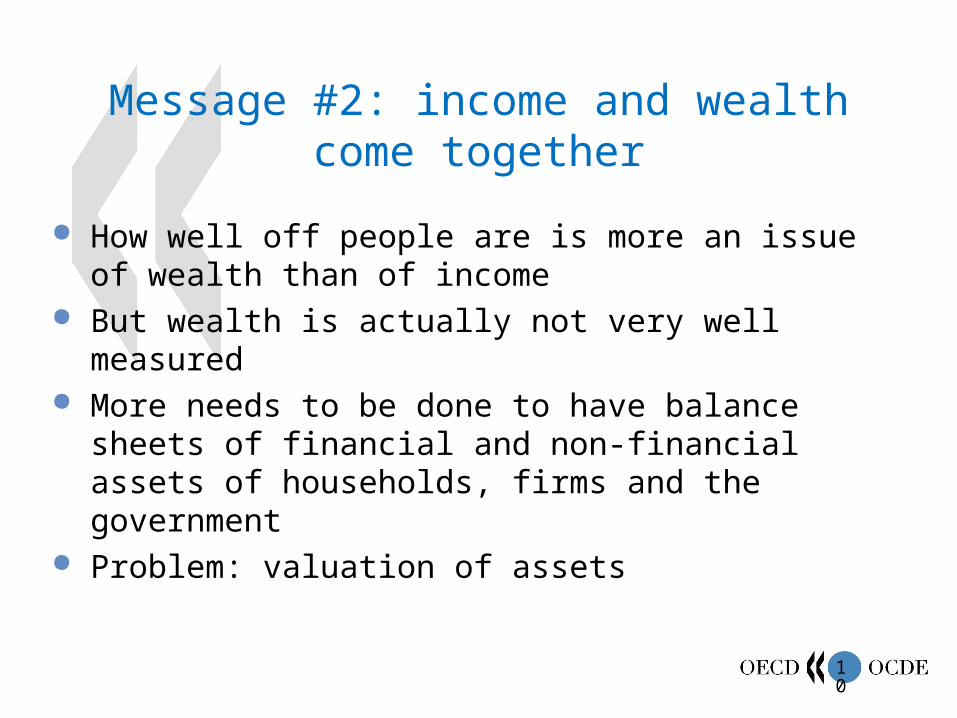
Message #2: income and wealth come together
How well off people are is more an issue of wealth than of income
But wealth is actually not very well measured More needs to be done to have balance sheets of
financial and non-financial assets of households, firms and the government
Problem: valuation of assets
11
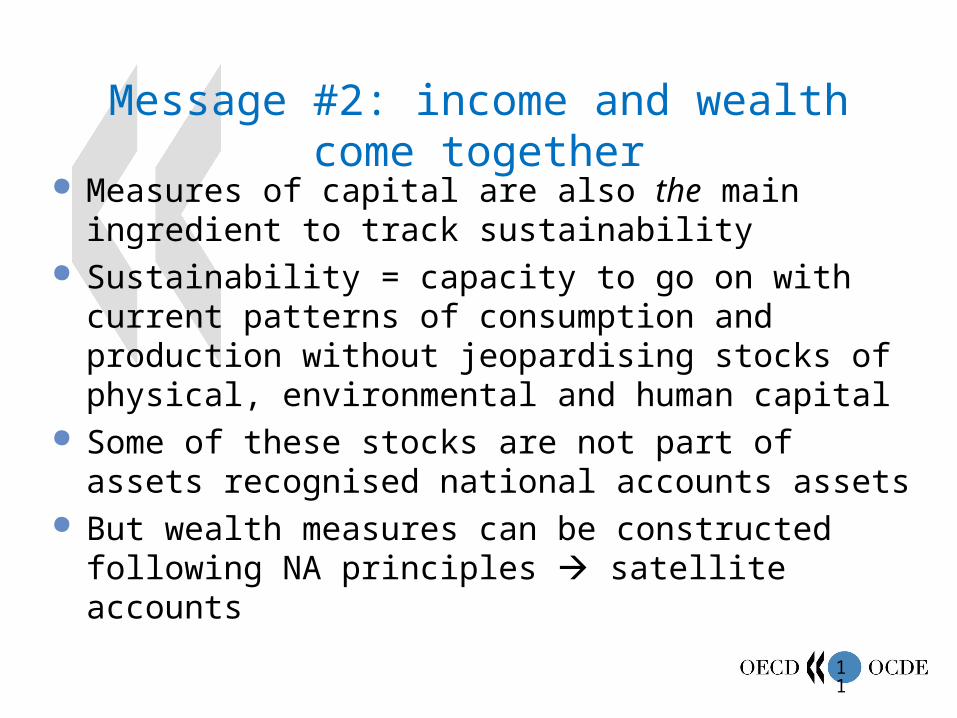
Message #2: income and wealth come together
Measures of capital are also the main ingredient to track sustainability
Sustainability = capacity to go on with current patterns of consumption and production without jeopardising stocks of physical, environmental and human capital
Some of these stocks are not part of assets recognised national accounts assets
But wealth measures can be constructed following NA principles satellite accounts
12
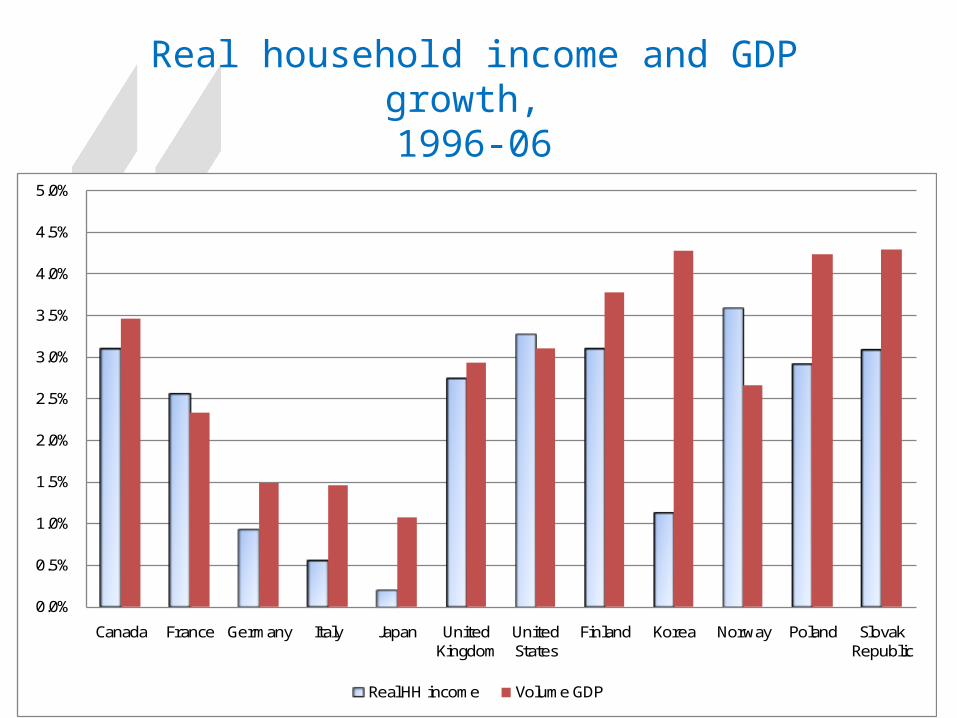
Message #3: emphasize the household perspective
A average HH income can move very differently from GDP
Examples: Italy, Japan, Korea, Poland, Slovakia, Germany as next graph shows
13
Real household income and GDP growth, 1996-06
0.0%
0.5%
1.0%
1.5%
2.0%
2.5%
3.0%
3.5%
4.0%
4.5%
5.0%
Canada France Germany Italy Japan United Kingdom
United States
Finland Korea Norway Poland Slovak Republic
Real HH income Volume GDP
14
…better than disposable income is adjusted disposable income
Adjusted disposable income corrects for (mainly) health and education services that households receive from government
Otherwise biased comparison between countries and/or over time
A look at France
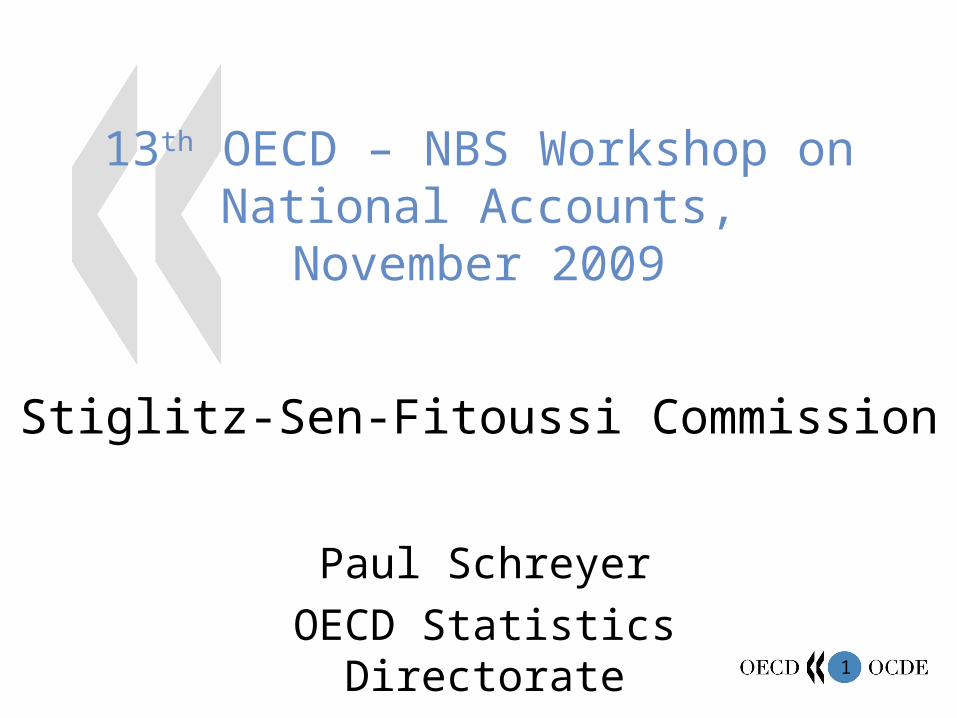
15
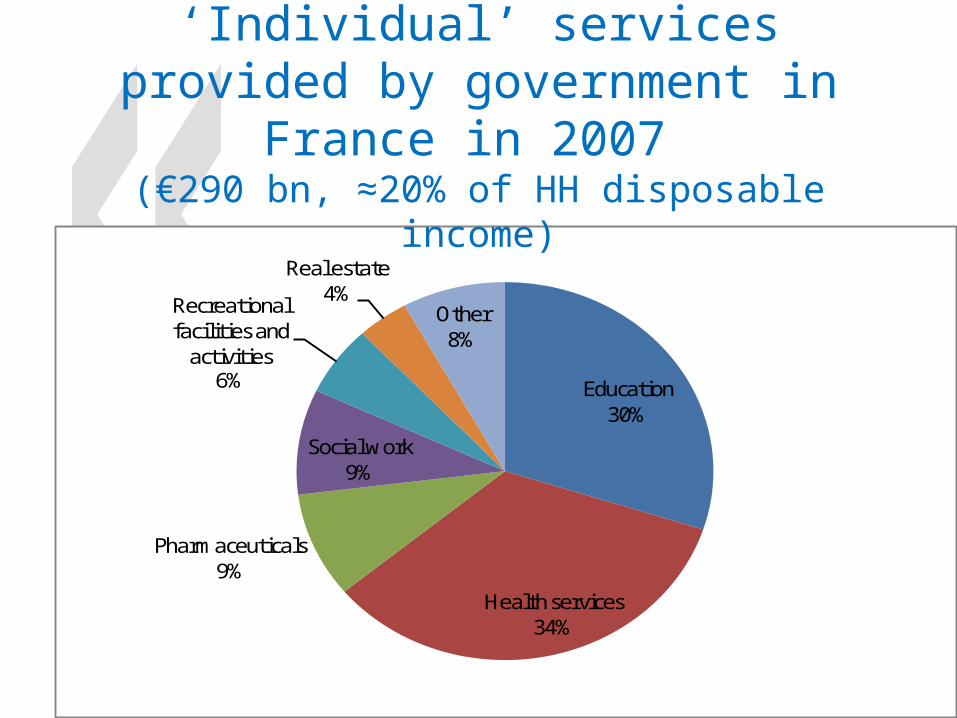
Education30%
Health services34%
Pharmaceuticals9%
Social work9%
Recreational facilities and
activities6%
Real estate4%
Other8%
‘Individual’ services provided by government in France in 2007
(€290 bn, ≈20% of HH disposable income)
16
…but these services have to be well measured
Traditionally, outputs=inputs Not necessarily true Measurement is tricky but possible Helpful: new administrative sources, for example for
health
Conclusion: let us make real adjusted disposal household income one of the headline figures
17
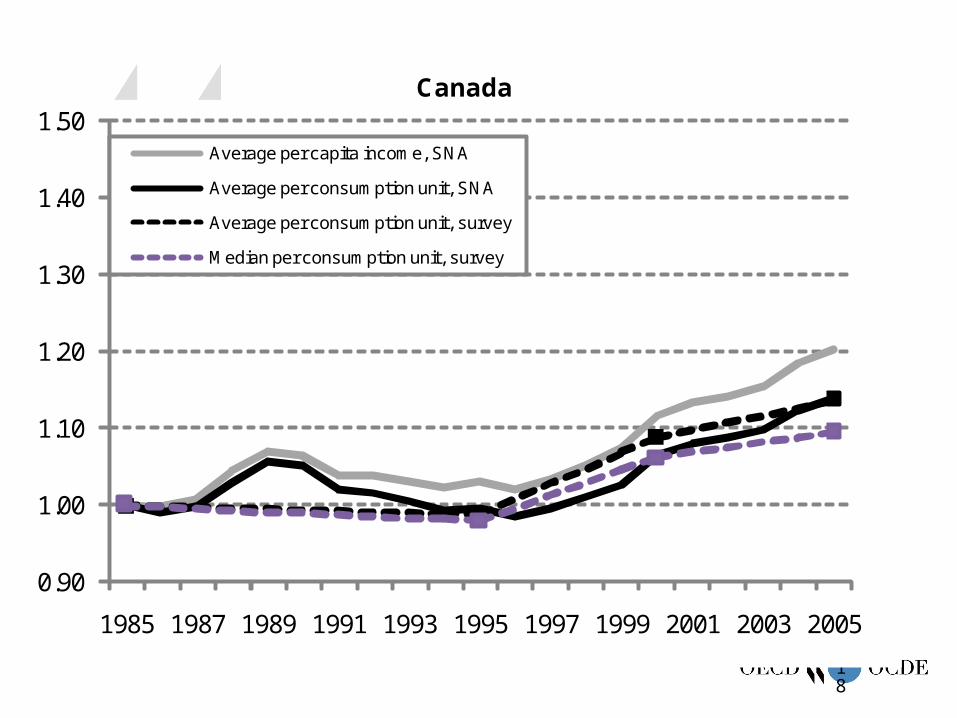
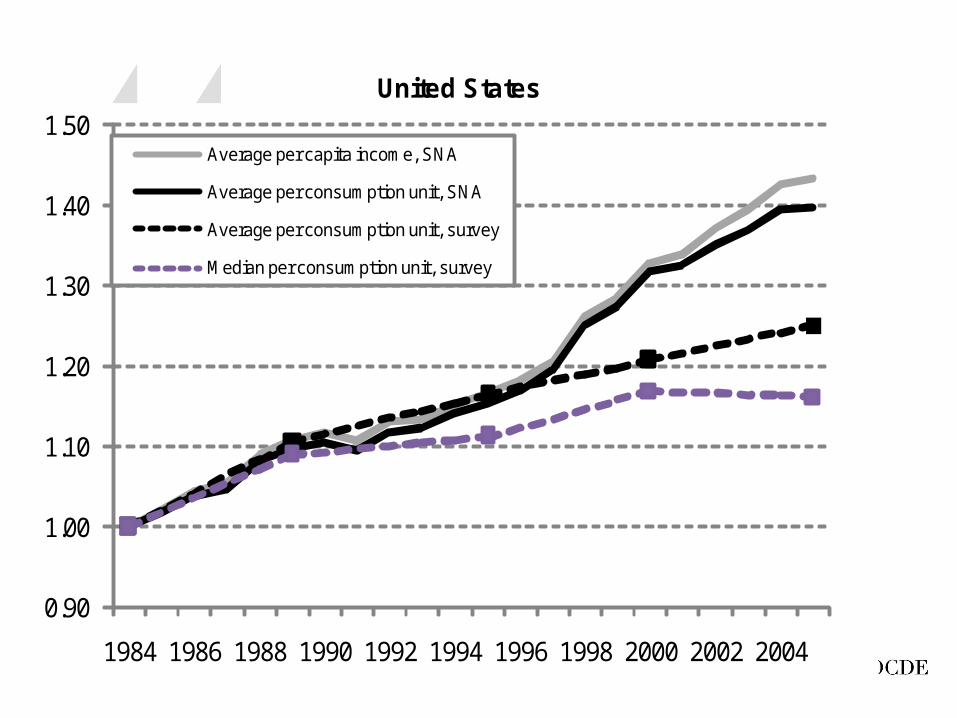
Message #4: more prominence to distributional information
Individuals cannot identify themselves with averages if distribution is very skewed
Introduce indicators such as median income alongside mean income
Problem: income measures for micro data ≠ income measures for national accounts data
But comparisons can be made
18
Canada
0.90
1.00
1.10
1.20
1.30
1.40
1.50
1985 1987 1989 1991 1993 1995 1997 1999 2001 2003 2005
Average per capita income, SNA
Average per consumption unit, SNA
Average per consumption unit, survey
Median per consumption unit, survey
19
United States
0.90
1.00
1.10
1.20
1.30
1.40
1.50
1984 1986 1988 1990 1992 1994 1996 1998 2000 2002 2004
Average per capita income, SNA
Average per consumption unit, SNA
Average per consumption unit, survey
Median per consumption unit, survey
20
Message #5: there is more economic activity than meets the (statistical) eye
No recognition of the production activity of services by households (typically provided by women)
Childcare, cooking, washing, care of the elderly All this constitutes productive activity and implicit income Putting a monetary value to housework is difficult but can be
done for research purposes Changes the picture of real income growth over time
(typically downwards) Changes the picture of comparisons of real income levels
across countries
21
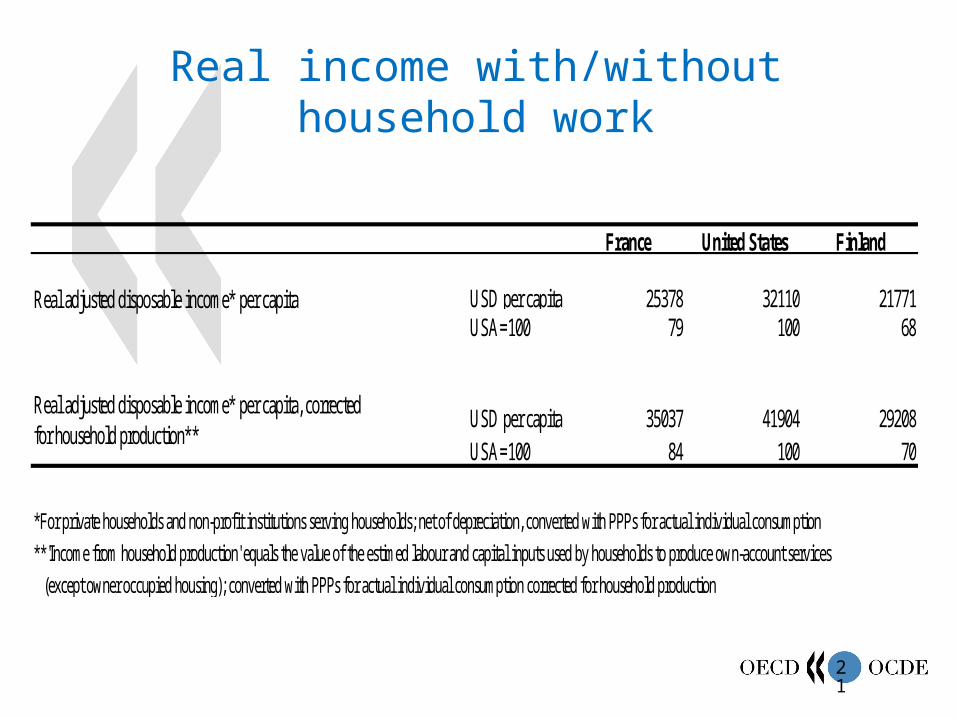
Real income with/without household work
France United States Finland
USD per capita 25378 32110 21771USA=100 79 100 68
USD per capita 35037 41904 29208USA=100 84 100 70
*For private households and non-profit institutions serving households; net of depreciation, converted with PPPs for actual individual consumption
**'Income from household production' equals the value of the estimed labour and capital inputs used by households to produce own-account services
(except owner occupied housing); converted with PPPs for actual individual consumption corrected for household production
Real adjusted disposable income* per capita, corrected for household production**
Real adjusted disposable income* per capita
22
From material living standards to quality of life
Economic resources are not all that matters for human well-being: many of the determinants of human well-being are not resources but aspects of people’s life (“doings and beings”);
Measurement of both objective and subjective dimensions is important
– Subjective measures, covering evaluations, feelings, affects ; they provide critical information about well-being and its determinants – often uncorrelated to measures of material well-being
23
From material living standards to quality of life
Objective measures: health, education, personal activities, political voice, social connections, environmental conditions, (in)security
Task: developing indicators for these areas or bringing existing information together
Big agenda: measuring inequalities in these conditions (e.g. health) and assessing how these conditions relate to each other and to income
24
Pragmatic approach to inter-temporal aspects of sustainability
Beyond current well-being (i.e. monetary resources and non-monetary dimensions of QoL) it is key to see whether current levels of well-being can last over time
– Measuring sustainability moves us from data to modelling of future interactions
–Indicators of sustainability should correspond to changes in some underlying “stock” relevant for well-being (man-made, natural human and social capital)
25
Pragmatic approach to inter-temporal aspects of sustainability
– Monetary valuation of stocks promising mainly for economic aspects (produced assets, human capital); for other types of capital (environmental capital, social capital) monetary index difficult
– Because of this difficulty, measuring environmental sustainability require physical indicators
26
How was the report received? President Sarkozy: France will put this report on the
agenda of all international meetings and discussions that have for objective the creation of a new economic order
French Minister of Finances: mandated INSEE and the OECD for concrete follow-up
Report played important role in the 3rd OECD World Forum on Statistics, Knowledge and Policy (Busan Korea)
Report fits perfectly into the Global Project on Measuring the Progress of Societies that is hosted by the OECD
OECD Road map prepared for follow-up work