Embed Size (px)
Citation preview
Available Online through International Journal of Pharmacy and Biological Sciences (eISSN: 2230-7605)
www.ijpbs.com IJPBS |Volume 1| Issue 3 |JULY-SEPT |2011|284-302
International Journal of Pharmacy and Biological Sciences (eISSN: 2230-7605)
Narasimha Rao R1*et al Int J Pharm Bio Sci www.ijpbs.com
Pag
e28
4
METHOD VALIDATION OF METAXALONE DRUG BY USING UV SPECTROSCOPY Narasimha Rao R1*, Anil Kumar Bn2, Laxmi Raj A3, Vamshi Raj A4, Sreenivasulu K5
1234&5 HITS COLLEGE OF PHARMACY, BOGARAM (V), KEESARA (M), R.R(DIST) 501301
*Corresponding Author Email: [email protected]
Research Article
RECEIVED ON 29-07-2011 ACCEPTED ON 20-08-2011
ABSTRACT
Ultraviolet spectroscopy deals with the measurement of energy absorbed when electrons are promoted to higher energy levels. On passing electromagnetic radiation in the Ultraviolet and visible regions through a compound with multiple bonds, a portion of the radiation is normally absorbed by the compound. The objective of validation of an analytical procedure is to demonstrate that it is suitable for its intended purpose. A tabular summation of the characteristics applicable to identification, control of impurities and assay procedures is included. The Skelaxin tablets containing 400 mg of Metaxalone was purchased from ATLANTA pharmacy U.S.A for method validation by using UV Spectroscopy method analysis.
KEYWORDS: Metaxalone , Method Validation , UV- Spectroscopy
Introduction
(Kalsi, 2007; Sharma, Y.R. 2007)Ultraviolet spectroscopy deals with the measurement of energy absorbed when electrons are promoted to higher energy levels. On passing electromagnetic radiation in the Ultraviolet and visible regions through a compound with multiple bonds, a portion of the radiation is normally absorbed by the compound. The amount of absorption depends on the wavelength of the radiation and the structure of the compound. Absorption of electromagnetic radiation in the visible and ultraviolet regions of the spectrum resulting in changes in the electronic structure of ions and molecules. Ultraviolet spectrum records the
wavelength of an absorption maximum, i.e. λmax and the strength of the absorption, i.e. molar absoptivity (extinction co-efficient ∑max) as defined by the combined Beer-Lambert’s law.
The λ at which maximum absorption occurs is called λmax. It is independent of concentration. The absorption of radiation is governed by Beer-Lambert’s law. (Silver Stein et al., 1991) The ultraviolet spectrum will be divided into the following region. Far (or Vacuum) ultra violet-10-200 nm , Near or quartz ultraviolet -200-300 nm , Visible region -380-780 nm.The visible region corresponds to 400-800 nm and ultraviolet region to 200-400 nm.
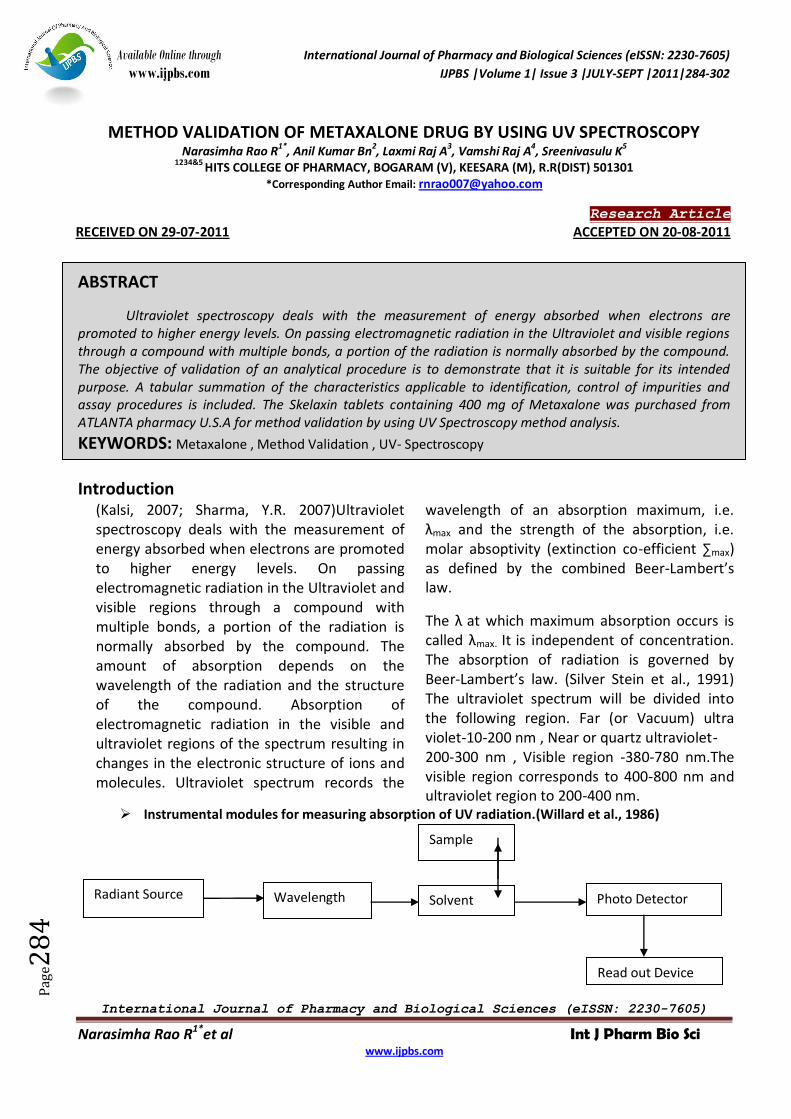
Instrumental modules for measuring absorption of UV radiation.(Willard et al., 1986)
Sample
Radiant Source Wavelength
Selector
Solvent Photo Detector
Read out Device
Available Online through
www.ijpbs.com IJPBS |Volume 1| Issue 3 |JULY-SEPT |2011|284-302
International Journal of Pharmacy and Biological Sciences (eISSN: 2230-7605)
Narasimha Rao R1* et al Int J Pharm Bio Sci www.ijpbs.com
Pag
e28
5
Absorption Laws (Jag Mohan, 2006): The absorption of light by the molecules is governed by the following laws.
a) Beer’s law: It states that the fraction of the incident light absorbed is proportion to the number of the absorbing molecules in the light path and will increase concentration or sample thickness.
b) Lambert’s law: It states that the fraction of the monochromatic light absorbed by a homogeneous medium is independent of the intensity of the incident light and each successive unit layer absorbs and equal fraction of the light incident on it.
From the laws, the following empirical expression, known as Beer – Lambert’s law:
Log10 IO/I = ∑cl = A.I
Where, I0 - Intensity of incident light , I - Intensity of emerged light , ∑-Molar
absorptivity , C - Concentration of solute in moles/litre , l- Path length (Cm) , A -Absorbance
Limitations of Beer-Lambert’s Law: The Beer-Lambert law is rigorously obsessed provided a single species gives rise to the observed absorption. However the law may not obsessed when, Different forms of the absorbing molecules are in equilibrium, Solute and solvent form association complexes. There is a thermal equilibrium between ground electronic state and a low lying excited state The compounds are charged by irradiation (fluorescent compounds)
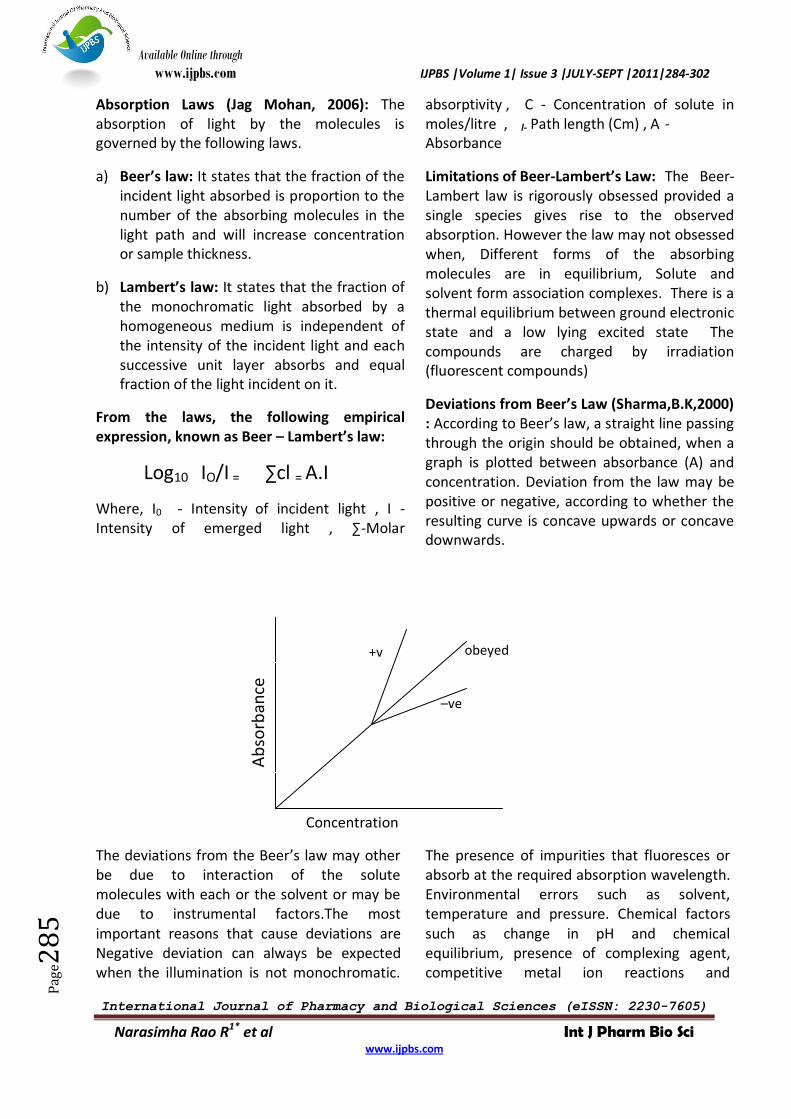
Deviations from Beer’s Law (Sharma,B.K,2000) : According to Beer’s law, a straight line passing through the origin should be obtained, when a graph is plotted between absorbance (A) and concentration. Deviation from the law may be positive or negative, according to whether the resulting curve is concave upwards or concave downwards.
Concentration
The deviations from the Beer’s law may other be due to interaction of the solute molecules with each or the solvent or may be due to instrumental factors.The most important reasons that cause deviations are Negative deviation can always be expected when the illumination is not monochromatic.
The presence of impurities that fluoresces or absorb at the required absorption wavelength. Environmental errors such as solvent, temperature and pressure. Chemical factors such as change in pH and chemical equilibrium, presence of complexing agent, competitive metal ion reactions and
Ab
sorb
ance
+v
e
–ve
obeyed
Available Online through
www.ijpbs.com IJPBS |Volume 1| Issue 3 |JULY-SEPT |2011|284-302
International Journal of Pharmacy and Biological Sciences (eISSN: 2230-7605)
Narasimha Rao R1* et al Int J Pharm Bio Sci www.ijpbs.com
Pag
e28
6
concentration dependence. Refractive index of sample. Instrumental errors such as radiation, stability of radiation source, stability of slit control and electronics and reliability of the optical parts1-6
Choice of solvent (Chatwal, 2000) : A suitable solvent for ultraviolet spectroscopy should meet the following requirements. It should not itself absorb radiations in the region under investigation. It should be less polar so that it
has minimum interaction with the solute molecules. The solvent used should be of high purity.Following table gives a list of common solvents used in UV spectroscopy (Williams, 2007).
Solvents Minimum wavelength for 1cm cell (nm)
1 Acetonitrile 190
2 Water 191
3 Cyclohexane 195
4 Hexane 201
5 Methanol 203
6 Ethanol 204
7 Ether 215
8 Methylene dichloride 220
9 Chloroform 237
10 Carbon tetrachloride 257
Solvent Effects (William Kemp, 1996): The position and intensity of an absorption band may shift when the spectrum is recorded in different solvents. For changes to solvents of increased polarity we can summarize the normal pattern of shifts as follows. Conjugated dienes and aromatic hydrocarbons experience very little solvent shift. α, β unsaturated carbonyl compounds show two different shifts. The π- π* band moves to longer wave length (red shift), The n- π* band moves to shorter wave length (blue shift)
Wavelength Choice (Robert D Braun, 2006) : When choosing a wavelength at which to make
an absorbance measurement, three factors must be considered.
Factor 1 : If the solution contains more than one absorbing species, the wavelength that should be chosen, whenever possible, is that at which the second species in the solution does not absorb radiation.
Factor 2 : It must be considered when a wave length is chosen is the required sensitive of the assay.
Factor 3 : This factor to be considered is the sensitive of the assay to small changes in wave length it is preferable to choose a wavelength
Available Online through
www.ijpbs.com IJPBS |Volume 1| Issue 3 |JULY-SEPT |2011|284-302
International Journal of Pharmacy and Biological Sciences (eISSN: 2230-7605)
Narasimha Rao R1* et al Int J Pharm Bio Sci www.ijpbs.com
Pag
e28
7
at which the absorbance will not be significantly altered if the wavelength is slightly changed.
Detectors (Sharma, B.K, 2000; Willard et al., 1986) : A detector is a transducer that convert electromagnetic radiation into an electron flow and subsequently, into a current flow or voltage in the readout circuit. Photoelectric or photomultiplier tubes are generally used as detectors. The detector must have the following important requirements. It must respond to radiant energy over a broad wavelength range. It should be sensitive to low levels of radiant power. It should rapidly respond to the radiation and produce an electrical signal that can be readily amplified. It should have relatively low noise level (for stability) . The signal produced be directly proportional to the power of beam striking it.
Qualitative Analysis : The assay of an absorbing substance may be quickly carried out by preparing a solution in a transparent solvent and measuring its absorbance at a suitable wavelength. The wavelength normally selected is a wavelength of maximum absorption (λmax) where small errors in setting the wavelength scale have little effects on the measured absorbance.
Quantitative Analysis (Beckett and Stenlake, 2002) :
Assay of substances in single Component Samples : Absorption spectroscopy is one of the most useful tools available to the chemist for quantitative analysis. The most important characteristics of photometric and spectrophotometric methods are high selectivity and case of convenience. Quantitative analysis (assay of an absorbing substance) can be done using following methods. Use of A (1%, 1 Cm) values , Use of calibration Graph (Multiple standard methods)
, By single or double point standardization method
Use of A (1%, 1 cm) Values : The method can be used for the estimation from formulation or raw material when reference standard not available. The use of standard A (1%, 1cm) value avoids the need to prepare a standard solution of the reference substance in order to determine its absorption.
Use of calibration graph : In this method a calibration curve is plotted using concentration (X-axis) Vs absorbance (Y-axis) with the value of 5 or more standard solutions. A straight line is drawn through maximum number of points. This method is called as line of best fit. By interpolating the absorbance of the sample solution and using the calibration curve, the concentration of the drug amount and percentage purity can be calculated.
Single or double point standardization : The procedure involves the measurement of the absorbance of a sample solution and of a standard of reference substance. The standard and the sample solution are prepared in similar manner; ideally the concentration of the standard solution should be close to that of the sample solution.
The concentration of the substance in the sample is calculated using followings formulas
Ctest = Atest / Astd x Cstd
Where, Ctest and Cstd are the concentration of the sample and standard solution, respectively, Atest and Astd are the absorbance of the sample and standard solutions, respectively.
In double point standardization, the concentration of one of the standard solutions is greater than that of the sample while the other standard solution has a lower concentration than the sample solution. The
Available Online through
www.ijpbs.com IJPBS |Volume 1| Issue 3 |JULY-SEPT |2011|284-302
International Journal of Pharmacy and Biological Sciences (eISSN: 2230-7605)
Narasimha Rao R1* et al Int J Pharm Bio Sci www.ijpbs.com
Pag
e28
8
concentration of the substance in the sample solution is given by
(Atest – Astd1) (Cstd1-Cstd2)+Cstd1 (Astd1-Astd2)
Ctest =
Astd1-Astd2
Where, Cstd is the concentration of standard solution, Atest and Astd are the absorbance of the sample and standard solutions, respectively. Std1 and Std2 are the more concentrated standard and less concentrated standard solutions, respectively.
Assay of Substance in Multi Component Samples:
The spectrophotometric assay of drugs rarely involves the measurement of absorbance of samples containing only one absorbing component. The pharmaceutical analyst frequently encounters the situation where the concentration of one or more substance is required in samples known to contain other absorbing substances which potentially interfere in the assay. Unwanted absorption from these sources is termed irrelevant absorption and if not removed, imparts systematic errors to the assay of the drug in the sample. A number of modifications to the simple spectrophotometric procedure for single-component samples is available to the analyst, which may eliminate certain sources of interferences and permit the accurate determination of one or all of the absorbing components7-17
The basis of all the spectrophotometric technique for multi component samples is the property that at all wavelengths: The absorbance of a solution is the sum of absorbances of the individual components; or The measured absorbance is the difference between the total absorbance of the solution in the sample cell and that of the solution in the reference (blank) cell. The determination of
the multi-component samples can be done by using the following methods.
Assay of a single-component sample , Assay using Absorbance corrected for interference , Assay after solvent extraction of the sample , Simultaneous equations method , Absorbance ratio method (Q-Analysis) , Geometric correction method , Orthogonal Polynomial Method , Difference Spectrophotometry , Derivative Spectrophotometry and Chemical derivatisation
ANALYTICAL PARAMETERS USED IN ASSAY VALIDATION AS PER ICH GUIDELINES :
The objective of validation of an analytical procedure is to demonstrate that it is suitable for its intended purpose. A tabular summation of the characteristics applicable to identification, control of impurities and assay procedures is included.
TYPES OF ANALYTICAL PROCEDURES TO BE VALIDATED :
The discussion of the validation of analytical procedures is directed to the four most common types of analytical procedures:
Identification Tests
Quantitative tests for impurities' content , Limit tests for the control of impurities.
Quantitative tests of the active moiety in samples of drug substance or drug product or other selected component(s) in the drug product. A brief description of the types of tests considered in this document is provided below. Identification tests are intended to ensure the identity of an analyte in a sample this is normally achieved by comparison of a property of the sample (example spectrum, chromatographic behavior, chemical reactivity etc.) to that of a reference standard. Testing for impurities can be either a quantitative test or a limit test for the impurity in a sample.
Available Online through
www.ijpbs.com IJPBS |Volume 1| Issue 3 |JULY-SEPT |2011|284-302
International Journal of Pharmacy and Biological Sciences (eISSN: 2230-7605)
Narasimha Rao R1* et al Int J Pharm Bio Sci www.ijpbs.com
Pag
e28
9
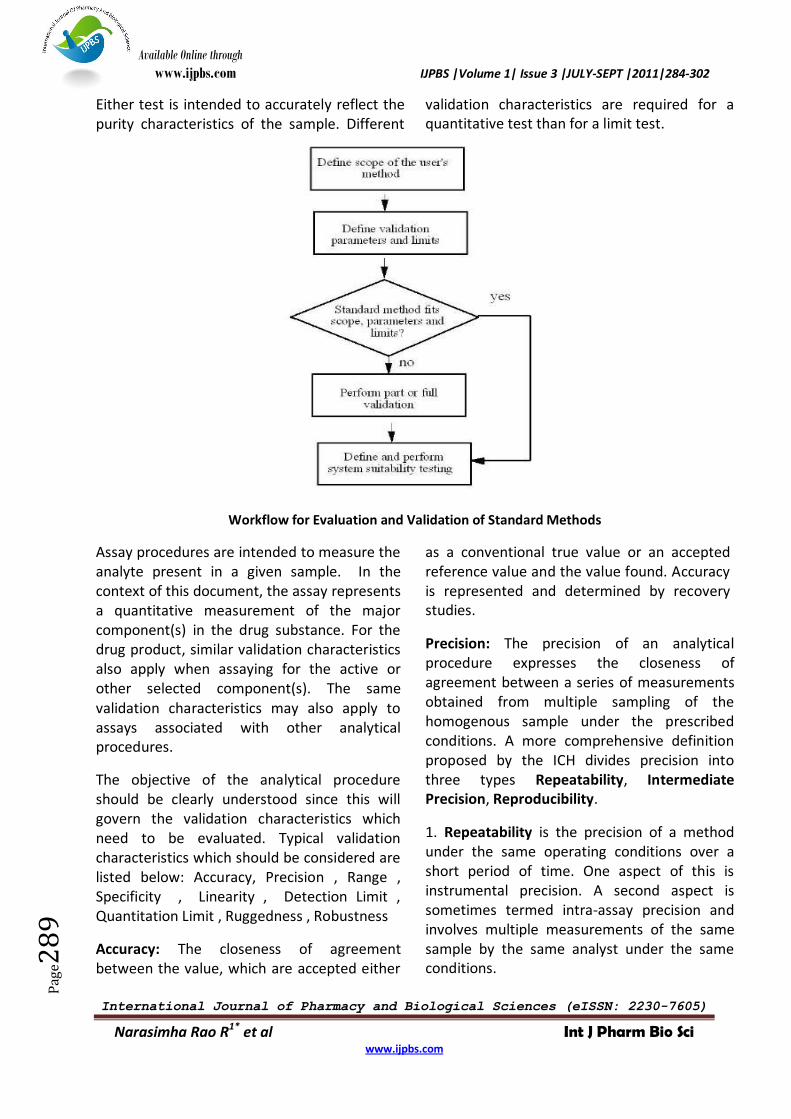
Either test is intended to accurately reflect the purity characteristics of the sample. Different
validation characteristics are required for a quantitative test than for a limit test.
Workflow for Evaluation and Validation of Standard Methods
Assay procedures are intended to measure the analyte present in a given sample. In the context of this document, the assay represents a quantitative measurement of the major component(s) in the drug substance. For the drug product, similar validation characteristics also apply when assaying for the active or other selected component(s). The same validation characteristics may also apply to assays associated with other analytical procedures.
The objective of the analytical procedure should be clearly understood since this will govern the validation characteristics which need to be evaluated. Typical validation characteristics which should be considered are listed below: Accuracy, Precision , Range , Specificity , Linearity , Detection Limit , Quantitation Limit , Ruggedness , Robustness
Accuracy: The closeness of agreement between the value, which are accepted either
as a conventional true value or an accepted reference value and the value found. Accuracy is represented and determined by recovery studies.
Precision: The precision of an analytical procedure expresses the closeness of agreement between a series of measurements obtained from multiple sampling of the homogenous sample under the prescribed conditions. A more comprehensive definition proposed by the ICH divides precision into three types Repeatability, Intermediate Precision, Reproducibility.
1. Repeatability is the precision of a method under the same operating conditions over a short period of time. One aspect of this is instrumental precision. A second aspect is sometimes termed intra-assay precision and involves multiple measurements of the same sample by the same analyst under the same conditions.
Available Online through
www.ijpbs.com IJPBS |Volume 1| Issue 3 |JULY-SEPT |2011|284-302
International Journal of Pharmacy and Biological Sciences (eISSN: 2230-7605)
Narasimha Rao R1* et al Int J Pharm Bio Sci www.ijpbs.com
Pag
e29
0
2. Intermediate precision is the agreement of complete measurements when the same method is applied many times within the same laboratory. This can include full analysis on different days, instruments or analysts, but would involve multiple preparations of samples and standards.
3. Reproducibility examines the precision between laboratories and is often determined in collaborative studies or method transfer experiments. Precision often is expressed by the standard deviation or relative standard deviation of the data set.
Range: The range of a method can be defined as the upper and lower concentrations for which the analytical method has adequate accuracy, precision and linearity. The range of concentrations examined will depend on the type of method and its use.
Specificity: Specificity is the ability to assess unequivocally the analyte in the presence of components, which may be expected to be present. Assuring specificity is the first step in developing and validating a good method. If specificity is not assured, method accuracy, precision and linearity all are seriously compromised. Method specificity should be reassessed continually during validation and subsequent use of the method.
Linearity: The linearity of an analytical procedure is its ability to obtain test results, which are directly proportional to the concentration of analyte in the sample. Linearity can be assessed by performing single measurements at several analyte concentrations. A linearity correlation coefficient above 0.999 is acceptable for most methods, especially for major components in assay methods. The range of an analytical procedure is the interval between the upper and lower concentration of analyte in the sample.
Detection Limit: The Detection Limit of an individual analytical procedure is the lowest amount of analyte in a sample which can be detected but not necessarily qualitated as an exact value.
The detection limit (LOD) may be expressed as:
LOD = 3.3σ
S
Where , = the standard deviation of the response , S = the slope of the calibration curve (of the analyte).
Quantification Limit: The Quantification limit of an analytical procedure is the lowest amount of analyte in a sample, which can be quantitatively determined with suitable precision and accuracy.
Quantification Limit (LOQ) may be expressed as:
LOQ = 10
S Where , =the standard deviation of the response ,S=the slope of the calibration curve (of the analyte).
Ruggedness: Method ruggedness is defined as the reproducibility of results when the method is performed under actual use conditions. This includes different analysts, laboratories, columns, instruments, sources of reagents, chemicals, solvents and so on. Method ruggedness may not be known when a method is first developed, but insight is obtained during subsequent use of that method.
Robustness: The concept of robustness of an analytical procedure has been defined by the ICH as “a measure of its capacity to remain unaffected by small, but deliberate variations in method parameters”. The most important aspect of robustness is to develop methods
Available Online through
www.ijpbs.com IJPBS |Volume 1| Issue 3 |JULY-SEPT |2011|284-302
International Journal of Pharmacy and Biological Sciences (eISSN: 2230-7605)
Narasimha Rao R1* et al Int J Pharm Bio Sci www.ijpbs.com
Pag
e29
1
that allow for expected variations in the separation parameters.
System Suitability Testing: System suitability testing is an integral part of many analytical procedures. The tests are based on the concept that the equipment, electronics, analytical operations, and samples to be analyzed constitute an integral system that can be evaluated as such. System suitability test parameters to be established for a particular procedure depend on the type of procedure being validated.
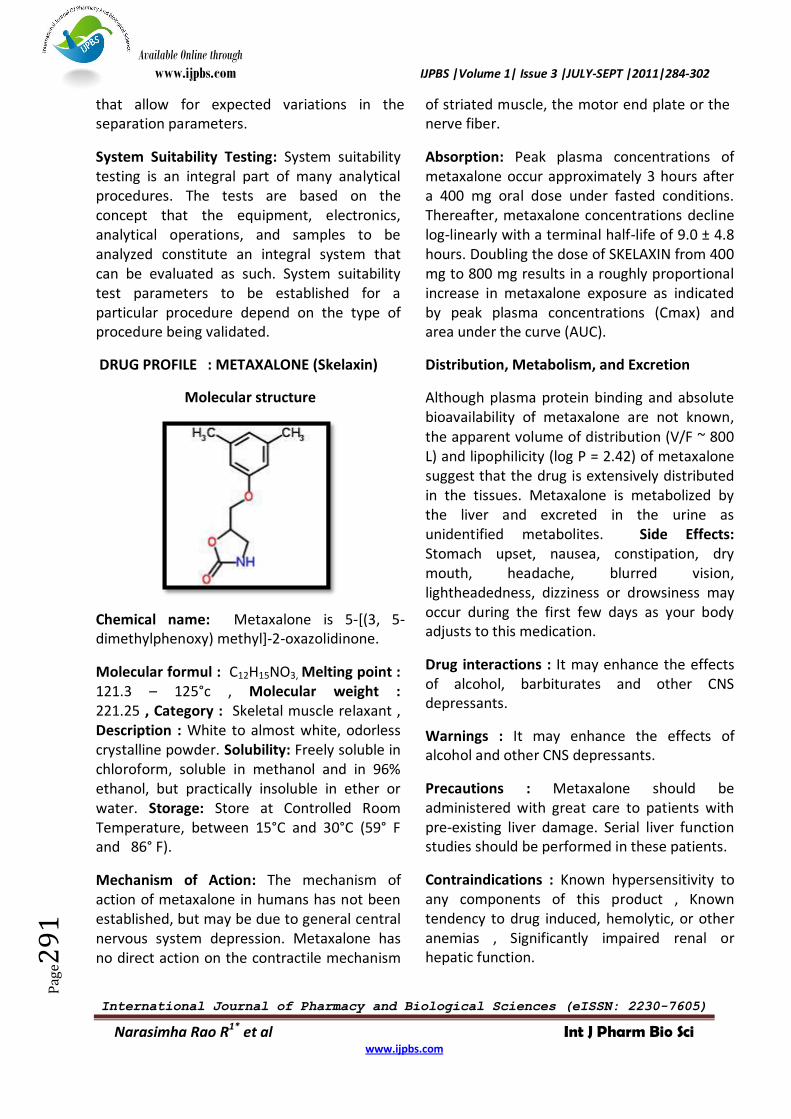
DRUG PROFILE : METAXALONE (Skelaxin)
Molecular structure
Chemical name: Metaxalone is 5-[(3, 5-dimethylphenoxy) methyl]-2-oxazolidinone.
Molecular formul : C12H15NO3, Melting point : 121.3 – 125°c , Molecular weight : 221.25 , Category : Skeletal muscle relaxant , Description : White to almost white, odorless crystalline powder. Solubility: Freely soluble in chloroform, soluble in methanol and in 96% ethanol, but practically insoluble in ether or water. Storage: Store at Controlled Room Temperature, between 15°C and 30°C (59° F and 86° F).
Mechanism of Action: The mechanism of action of metaxalone in humans has not been established, but may be due to general central nervous system depression. Metaxalone has no direct action on the contractile mechanism
of striated muscle, the motor end plate or the nerve fiber.
Absorption: Peak plasma concentrations of metaxalone occur approximately 3 hours after a 400 mg oral dose under fasted conditions. Thereafter, metaxalone concentrations decline log-linearly with a terminal half-life of 9.0 ± 4.8 hours. Doubling the dose of SKELAXIN from 400 mg to 800 mg results in a roughly proportional increase in metaxalone exposure as indicated by peak plasma concentrations (Cmax) and area under the curve (AUC).
Distribution, Metabolism, and Excretion
Although plasma protein binding and absolute bioavailability of metaxalone are not known, the apparent volume of distribution (V/F ~ 800 L) and lipophilicity (log P = 2.42) of metaxalone suggest that the drug is extensively distributed in the tissues. Metaxalone is metabolized by the liver and excreted in the urine as unidentified metabolites. Side Effects: Stomach upset, nausea, constipation, dry mouth, headache, blurred vision, lightheadedness, dizziness or drowsiness may occur during the first few days as your body adjusts to this medication.
Drug interactions : It may enhance the effects of alcohol, barbiturates and other CNS depressants.
Warnings : It may enhance the effects of alcohol and other CNS depressants.
Precautions : Metaxalone should be administered with great care to patients with pre-existing liver damage. Serial liver function studies should be performed in these patients.
Contraindications : Known hypersensitivity to any components of this product , Known tendency to drug induced, hemolytic, or other anemias , Significantly impaired renal or hepatic function.
Available Online through
www.ijpbs.com IJPBS |Volume 1| Issue 3 |JULY-SEPT |2011|284-302
International Journal of Pharmacy and Biological Sciences (eISSN: 2230-7605)
Narasimha Rao R1* et al Int J Pharm Bio Sci www.ijpbs.com
Pag
e29
2
MATERIALS AND METHODS: Metaxalone was obtained as a gift sample from AUROBINDO Pharmaceuticals Pvt.Ltd., Hyderabad. The drug sample received was authenticated by its melting point18-21
Formulation Used: Skelaxin tablets containing 400 mg of Metaxalone was purchased from ATLANTA pharmacy U.S.A
Chemicals and Solvents: All the following chemicals used were of analytical grade.
Methanol , Potassium Di Hydrogen Phosphate , Sodium Hydroxide , Chemicals and solvents are from Qualigens India Pvt. Ltd., and Loba Chemie India Ltd.,
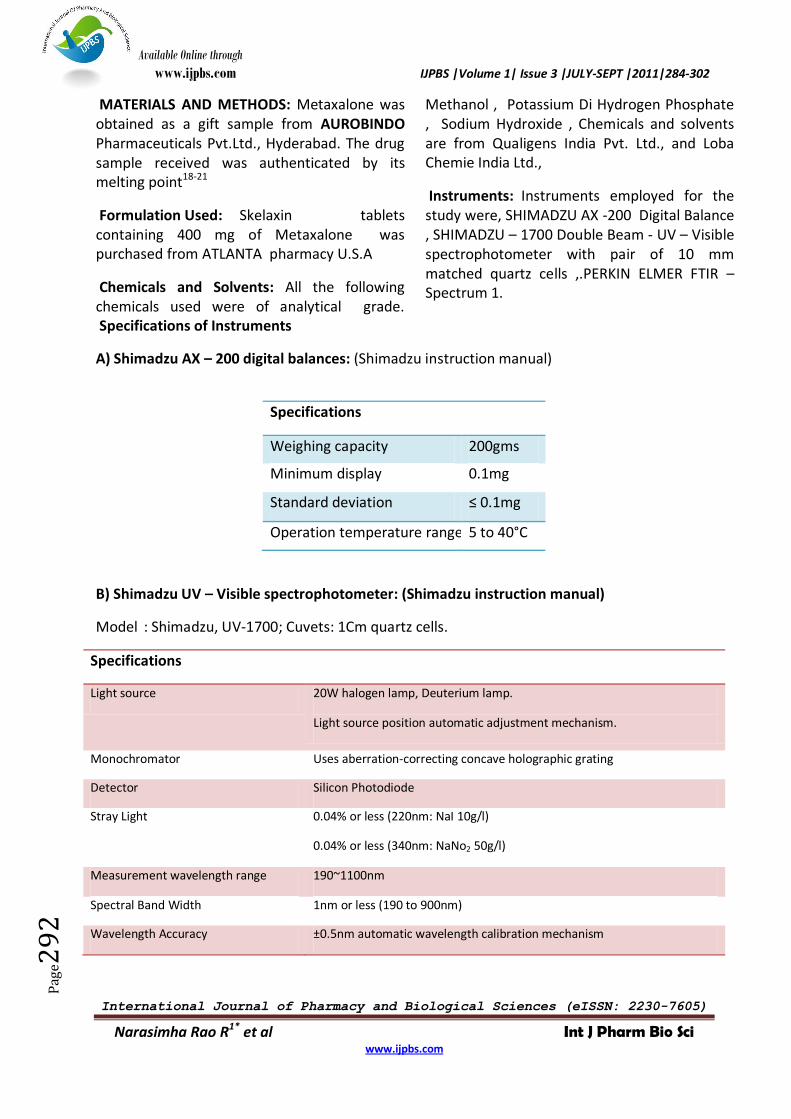
Instruments: Instruments employed for the study were, SHIMADZU AX -200 Digital Balance , SHIMADZU – 1700 Double Beam - UV – Visible spectrophotometer with pair of 10 mm matched quartz cells ,.PERKIN ELMER FTIR – Spectrum 1.
Specifications of Instruments
A) Shimadzu AX – 200 digital balances: (Shimadzu instruction manual)
Specifications
Weighing capacity 200gms
Minimum display 0.1mg
Standard deviation ≤ 0.1mg
Operation temperature range 5 to 40°C
B) Shimadzu UV – Visible spectrophotometer: (Shimadzu instruction manual)
Model : Shimadzu, UV-1700; Cuvets: 1Cm quartz cells.
Specifications
Light source 20W halogen lamp, Deuterium lamp.
Light source position automatic adjustment mechanism.
Monochromator Uses aberration-correcting concave holographic grating
Detector Silicon Photodiode
Stray Light 0.04% or less (220nm: NaI 10g/l)
0.04% or less (340nm: NaNo2 50g/l)
Measurement wavelength range 190~1100nm
Spectral Band Width 1nm or less (190 to 900nm)
Wavelength Accuracy ±0.5nm automatic wavelength calibration mechanism
Available Online through
www.ijpbs.com IJPBS |Volume 1| Issue 3 |JULY-SEPT |2011|284-302
International Journal of Pharmacy and Biological Sciences (eISSN: 2230-7605)
Narasimha Rao R1* et al Int J Pharm Bio Sci www.ijpbs.com
Pag
e29
3
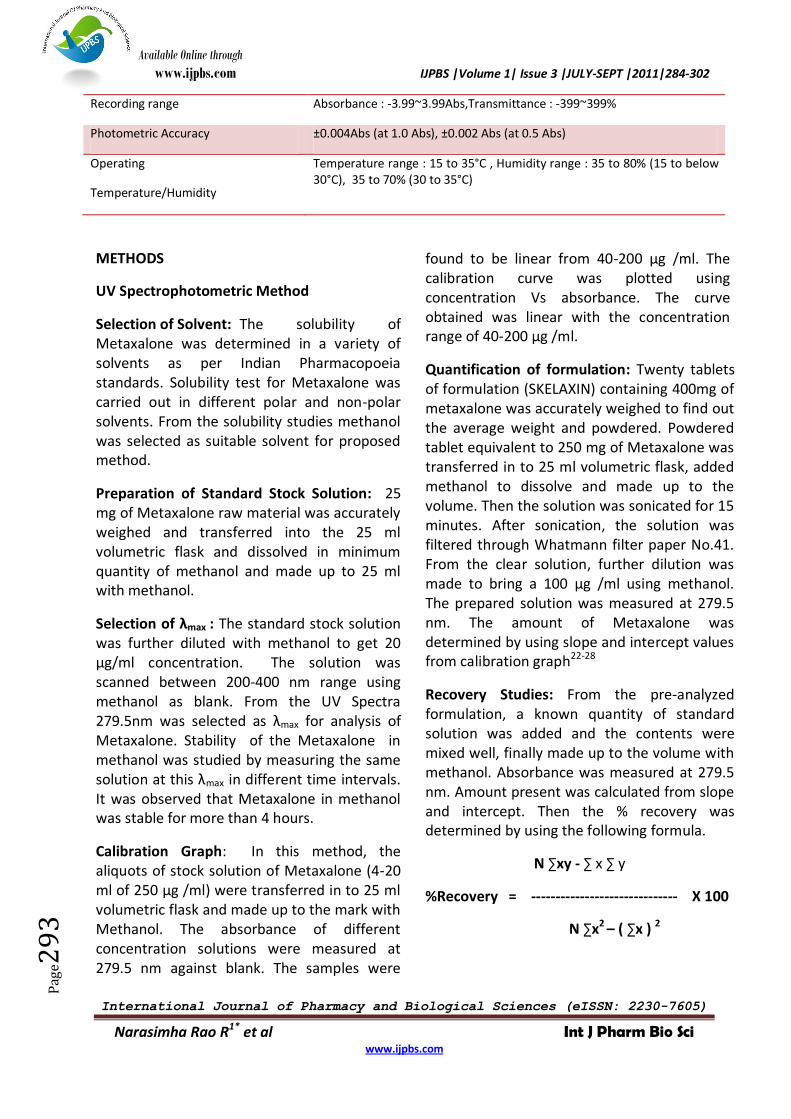
Recording range Absorbance : -3.99~3.99Abs,Transmittance : -399~399%
Photometric Accuracy ±0.004Abs (at 1.0 Abs), ±0.002 Abs (at 0.5 Abs)
Operating
Temperature/Humidity
Temperature range : 15 to 35°C , Humidity range : 35 to 80% (15 to below 30°C), 35 to 70% (30 to 35°C)
METHODS
UV Spectrophotometric Method
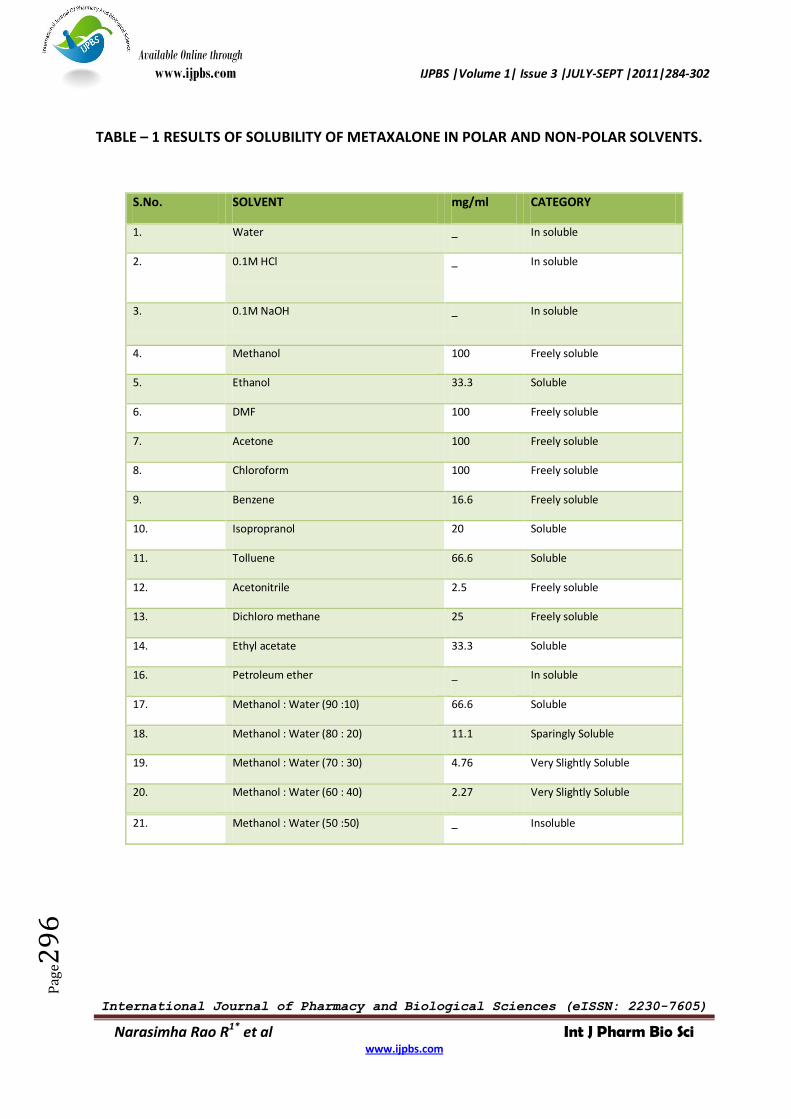
Selection of Solvent: The solubility of Metaxalone was determined in a variety of solvents as per Indian Pharmacopoeia standards. Solubility test for Metaxalone was carried out in different polar and non-polar solvents. From the solubility studies methanol was selected as suitable solvent for proposed method.
Preparation of Standard Stock Solution: 25 mg of Metaxalone raw material was accurately weighed and transferred into the 25 ml volumetric flask and dissolved in minimum quantity of methanol and made up to 25 ml with methanol.
Selection of λmax : The standard stock solution was further diluted with methanol to get 20 µg/ml concentration. The solution was scanned between 200-400 nm range using methanol as blank. From the UV Spectra 279.5nm was selected as λmax for analysis of Metaxalone. Stability of the Metaxalone in methanol was studied by measuring the same solution at this λmax in different time intervals. It was observed that Metaxalone in methanol was stable for more than 4 hours.
Calibration Graph: In this method, the aliquots of stock solution of Metaxalone (4-20 ml of 250 µg /ml) were transferred in to 25 ml volumetric flask and made up to the mark with Methanol. The absorbance of different concentration solutions were measured at 279.5 nm against blank. The samples were
found to be linear from 40-200 µg /ml. The calibration curve was plotted using concentration Vs absorbance. The curve obtained was linear with the concentration range of 40-200 µg /ml.
Quantification of formulation: Twenty tablets of formulation (SKELAXIN) containing 400mg of metaxalone was accurately weighed to find out the average weight and powdered. Powdered tablet equivalent to 250 mg of Metaxalone was transferred in to 25 ml volumetric flask, added methanol to dissolve and made up to the volume. Then the solution was sonicated for 15 minutes. After sonication, the solution was filtered through Whatmann filter paper No.41. From the clear solution, further dilution was made to bring a 100 µg /ml using methanol. The prepared solution was measured at 279.5 nm. The amount of Metaxalone was determined by using slope and intercept values from calibration graph22-28
Recovery Studies: From the pre-analyzed formulation, a known quantity of standard solution was added and the contents were mixed well, finally made up to the volume with methanol. Absorbance was measured at 279.5 nm. Amount present was calculated from slope and intercept. Then the % recovery was determined by using the following formula.
N ∑xy - ∑ x ∑ y
%Recovery = ------------------------------ X 100
N ∑x2 – ( ∑x ) 2
Available Online through
www.ijpbs.com IJPBS |Volume 1| Issue 3 |JULY-SEPT |2011|284-302
International Journal of Pharmacy and Biological Sciences (eISSN: 2230-7605)
Narasimha Rao R1* et al Int J Pharm Bio Sci www.ijpbs.com
Pag
e29
4
Where, N = Number of observations , X = Amount Added in microgram/ml , Y = Amount recovered in microgram/ml
Limit of Detection (LOD) and Limit of Quantification (LOQ) : Construction of six sets of calibration graph from the serial dilutions of standard. The limit of detection and limit of quantification was calculated by using the standard deviation of the response and the slope of the calibration curve.
Repeatability: Repeatability of the Metaxalone was carried out by repeating the calibration, formulation, and recovery studies six times.
Ruggedness: The degree of reproducibility of test results obtained by UV-method of Metaxalone was checked by analyzing the drug sample under following test conditions.By using different instruments – Double Beam and single Beam Spectrophotometers. By doing the experiments by different analysts. By doing the experiments with different glass wares. To validate and confirm the results, six solutions of Metaxalone were prepared and analysis was carried out.
RESULTS AND DISCUSSION: The solubility of Metaxalone was determined in a variety of solvents, sample approximately (10 mg) was taken in the test tube and various solvents were added to checking the solubility . The solvents used were distilled water, NaOH(0.1M), HCL(0.1M), Methonal, Acetonitrile, Acetone,Ethanol, Chloroform, Diethyl ether, Benzene, Toluene, Carbon Tetra Chloride, Ethyl Acetate, Isopropranol, DMF and DichloroMethane . Solubility profile of Metaxalone is given in Table 1. From the solubility studies Methanol was chosen as solvent. Based upon its availability, and the stability condition in account, we have selected the solvent.
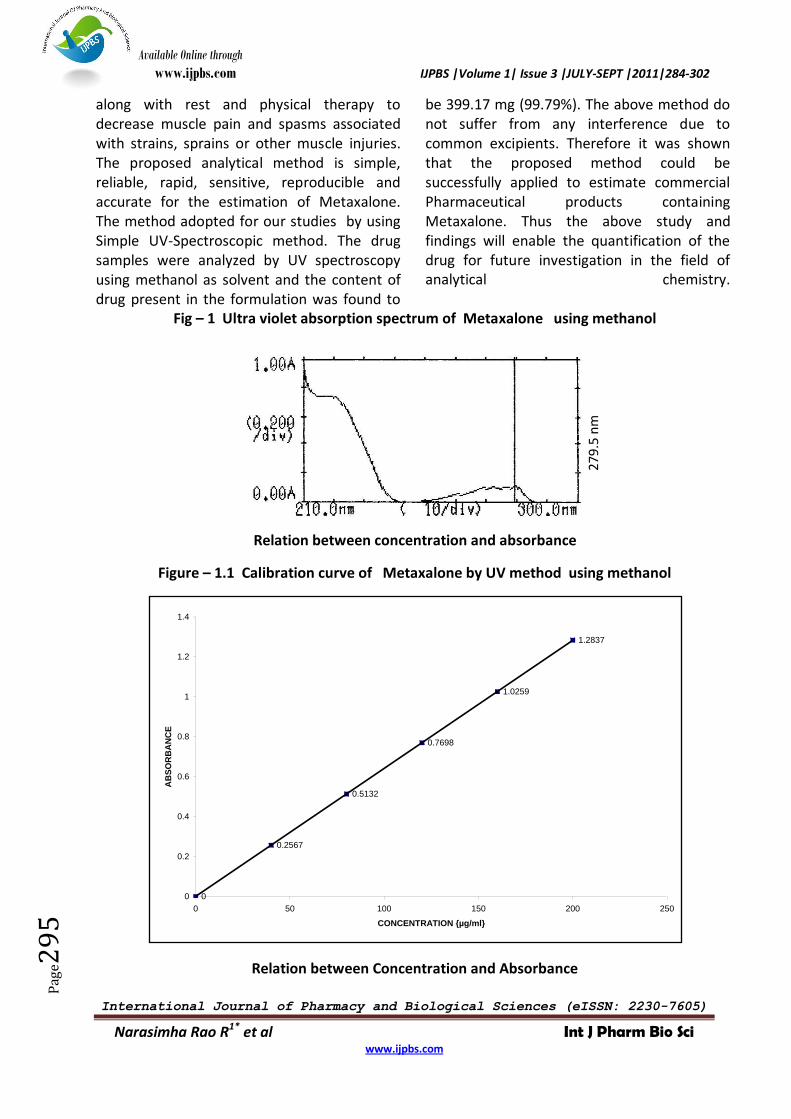
Drug was dissolved in Methanol and was made further dilutions with Methanol to produce 20 µg/ml. It was scanned in the range of 200-400 nm and it shows constant λmax at 279.5 nm this is shown in Fig.1. Stability of the absorbance at their λmax was also checked for upto 4 hours. The linearity of the drug Metaxalone was found ; its calibration curve was constructed and is shown in fig 1.1.
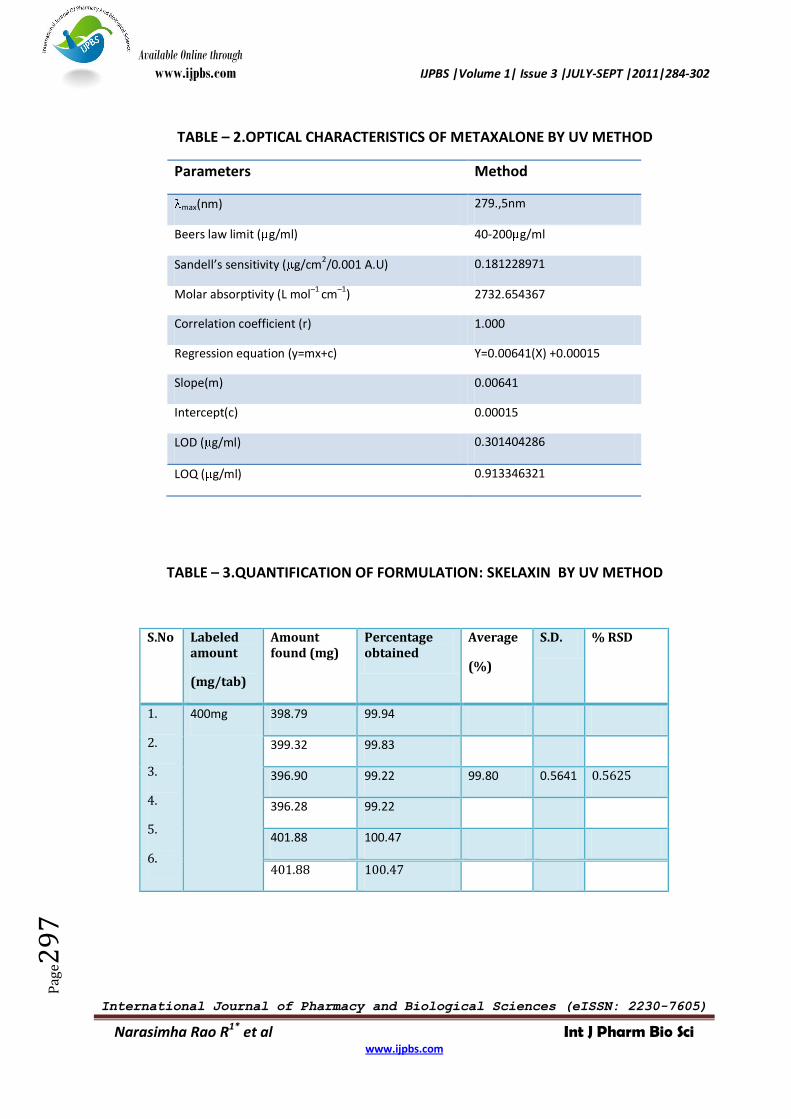
The optical characteristics such as Beer’s law limit (40-200µg/ml), sandell’s sensivity(0.181228971), correlation coefficient (0.9998), slope(0.00641) and intercept(0.00015) were calculated and shown in Table 2.
The limit of detection and limit of quantification were determined from the linearity studies. The limit of detection was found to be 0.301404286 µg/ml and the limit of quantification was found to be 0.913346321 µg/ml. It has been shown in Table 2.
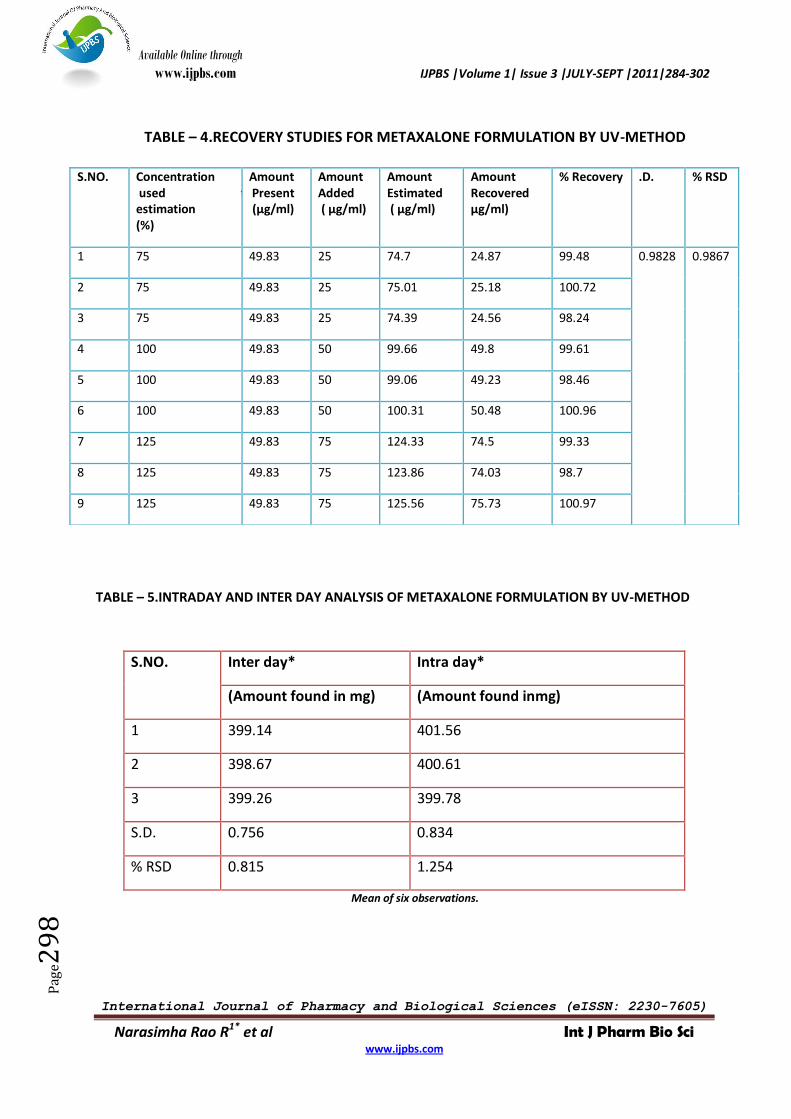
To evaluate the accuracy of the method, known amount of pure drug was added to the previously analyzed solution containing Pharmaceutical formulation and the mixture was analyzed by the proposed method and the recoveries were calculated. The percentage recovery of Metaxalone sample was found to be 98.24 % - 100.97 %. These values were given in Table 4.
Precision of the method was studied by making repeated analysis of the sample and it was carried out three times in a day and repeated for 3 days. The percentage standard deviation for inter-day and intra-day analysis was found for recovery and assay and respectively which are tabulated in 5 & 6. Statistical validation for the formulation was also calculated, which are shown in the Table 9 & 10.
SUMMARY AND CONCLUSION : Metaxalone is a newer skeletal muscle relaxant and is used
Available Online through
www.ijpbs.com IJPBS |Volume 1| Issue 3 |JULY-SEPT |2011|284-302
International Journal of Pharmacy and Biological Sciences (eISSN: 2230-7605)
Narasimha Rao R1* et al Int J Pharm Bio Sci www.ijpbs.com
Pag
e29
5
along with rest and physical therapy to decrease muscle pain and spasms associated with strains, sprains or other muscle injuries. The proposed analytical method is simple, reliable, rapid, sensitive, reproducible and accurate for the estimation of Metaxalone. The method adopted for our studies by using Simple UV-Spectroscopic method. The drug samples were analyzed by UV spectroscopy using methanol as solvent and the content of drug present in the formulation was found to
be 399.17 mg (99.79%). The above method do not suffer from any interference due to common excipients. Therefore it was shown that the proposed method could be successfully applied to estimate commercial Pharmaceutical products containing Metaxalone. Thus the above study and findings will enable the quantification of the drug for future investigation in the field of analytical chemistry.
Fig – 1 Ultra violet absorption spectrum of Metaxalone using methanol
Relation between concentration and absorbance
Figure – 1.1 Calibration curve of Metaxalone by UV method using methanol
Relation between Concentration and Absorbance
0
0.2567
0.5132
0.7698
1.0259
1.2837
0
0.2
0.4
0.6
0.8
1
1.2
1.4
0 50 100 150 200 250
CONCENTRATION {µg/ml}
AB
SO
RB
AN
CE
27
9.5
nm
Available Online through
www.ijpbs.com IJPBS |Volume 1| Issue 3 |JULY-SEPT |2011|284-302
International Journal of Pharmacy and Biological Sciences (eISSN: 2230-7605)
Narasimha Rao R1* et al Int J Pharm Bio Sci www.ijpbs.com
Pag
e29
6
TABLE – 1 RESULTS OF SOLUBILITY OF METAXALONE IN POLAR AND NON-POLAR SOLVENTS.
S.No. SOLVENT mg/ml CATEGORY
1. Water _ In soluble
2. 0.1M HCl _ In soluble
3. 0.1M NaOH _ In soluble
4. Methanol 100 Freely soluble
5. Ethanol 33.3 Soluble
6. DMF 100 Freely soluble
7. Acetone 100 Freely soluble
8. Chloroform 100 Freely soluble
9. Benzene 16.6 Freely soluble
10. Isopropranol 20 Soluble
11. Tolluene 66.6 Soluble
12. Acetonitrile 2.5 Freely soluble
13. Dichloro methane 25 Freely soluble
14. Ethyl acetate 33.3 Soluble
16. Petroleum ether _ In soluble
17. Methanol : Water (90 :10) 66.6 Soluble
18. Methanol : Water (80 : 20) 11.1 Sparingly Soluble
19. Methanol : Water (70 : 30) 4.76 Very Slightly Soluble
20. Methanol : Water (60 : 40) 2.27 Very Slightly Soluble
21. Methanol : Water (50 :50) _ Insoluble
Available Online through
www.ijpbs.com IJPBS |Volume 1| Issue 3 |JULY-SEPT |2011|284-302
International Journal of Pharmacy and Biological Sciences (eISSN: 2230-7605)
Narasimha Rao R1* et al Int J Pharm Bio Sci www.ijpbs.com
Pag
e29
7
TABLE – 2.OPTICAL CHARACTERISTICS OF METAXALONE BY UV METHOD
Parameters Method
max(nm) 279.,5nm
Beers law limit ( g/ml) 40-200 g/ml
Sandell’s sensitivity ( g/cm2/0.001 A.U) 0.181228971
Molar absorptivity (L mol–1 cm–1) 2732.654367
Correlation coefficient (r) 1.000
Regression equation (y=mx+c) Y=0.00641(X) +0.00015
Slope(m) 0.00641
Intercept(c) 0.00015
LOD ( g/ml) 0.301404286
LOQ ( g/ml) 0.913346321
TABLE – 3.QUANTIFICATION OF FORMULATION: SKELAXIN BY UV METHOD
S.No Labeled amount
(mg/tab)
Amount found (mg)
Percentage obtained
Average
(%)
S.D. % RSD
1.
2.
3.
4.
5.
6.
400mg 398.79 99.94
399.32 99.83
396.90 99.22 99.80 0.5641 0.5625
396.28 99.22
401.88 100.47
401.88 100.47
Available Online through
www.ijpbs.com IJPBS |Volume 1| Issue 3 |JULY-SEPT |2011|284-302
International Journal of Pharmacy and Biological Sciences (eISSN: 2230-7605)
Narasimha Rao R1* et al Int J Pharm Bio Sci www.ijpbs.com
Pag
e29
8
TABLE – 4.RECOVERY STUDIES FOR METAXALONE FORMULATION BY UV-METHOD
TABLE – 5.INTRADAY AND INTER DAY ANALYSIS OF METAXALONE FORMULATION BY UV-METHOD
S.NO. Inter day* Intra day*
(Amount found in mg) (Amount found inmg)
1 399.14 401.56
2 398.67 400.61
3 399.26 399.78
S.D. 0.756 0.834
% RSD 0.815 1.254
Mean of six observations.
S.NO. Concentration used for estimation (%)
Amount Present (µg/ml)
Amount Added ( µg/ml)
Amount Estimated ( µg/ml)
Amount Recovered ( µg/ml)
% Recovery .D. % RSD
1 75 49.83 25 74.7 24.87 99.48 0.9828 0.9867
2 75 49.83 25 75.01 25.18 100.72
3 75 49.83 25 74.39 24.56 98.24
4 100 49.83 50 99.66 49.8 99.61
5 100 49.83 50 99.06 49.23 98.46
6 100 49.83 50 100.31 50.48 100.96
7 125 49.83 75 124.33 74.5 99.33
8 125 49.83 75 123.86 74.03 98.7
9 125 49.83 75 125.56 75.73 100.97
Available Online through
www.ijpbs.com IJPBS |Volume 1| Issue 3 |JULY-SEPT |2011|284-302
International Journal of Pharmacy and Biological Sciences (eISSN: 2230-7605)
Narasimha Rao R1* et al Int J Pharm Bio Sci www.ijpbs.com
Pag
e29
9
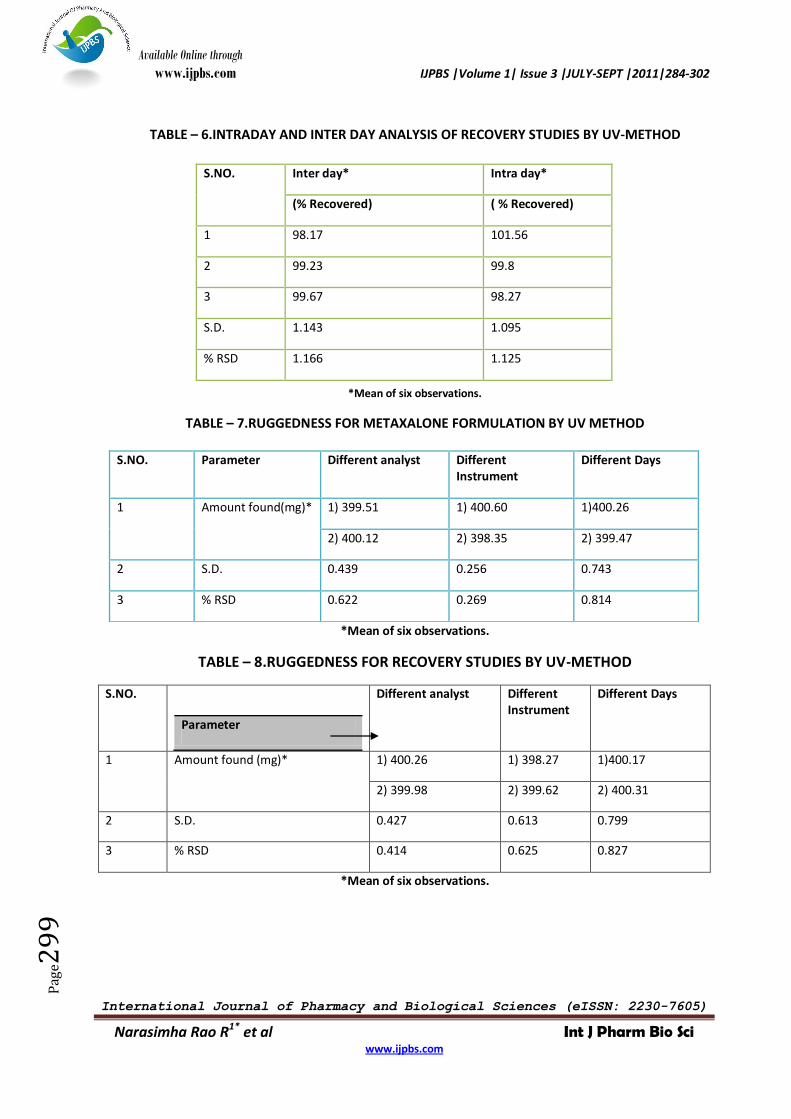
TABLE – 6.INTRADAY AND INTER DAY ANALYSIS OF RECOVERY STUDIES BY UV-METHOD
*Mean of six observations.
TABLE – 7.RUGGEDNESS FOR METAXALONE FORMULATION BY UV METHOD
*Mean of six observations.
TABLE – 8.RUGGEDNESS FOR RECOVERY STUDIES BY UV-METHOD
S.NO.
Parameter
Different analyst Different Instrument
Different Days
1 Amount found (mg)* 1) 400.26 1) 398.27 1)400.17
2) 399.98 2) 399.62 2) 400.31
2 S.D. 0.427 0.613 0.799
3 % RSD 0.414 0.625 0.827
*Mean of six observations.
S.NO. Inter day* Intra day*
(% Recovered) ( % Recovered)
1 98.17 101.56
2 99.23 99.8
3 99.67 98.27
S.D. 1.143 1.095
% RSD 1.166 1.125
S.NO. Parameter Different analyst Different Instrument
Different Days
1 Amount found(mg)* 1) 399.51 1) 400.60 1)400.26
2) 400.12 2) 398.35 2) 399.47
2 S.D. 0.439 0.256 0.743
3 % RSD 0.622 0.269 0.814
Available Online through
www.ijpbs.com IJPBS |Volume 1| Issue 3 |JULY-SEPT |2011|284-302
International Journal of Pharmacy and Biological Sciences (eISSN: 2230-7605)
Narasimha Rao R1* et al Int J Pharm Bio Sci www.ijpbs.com
Pag
e30
0
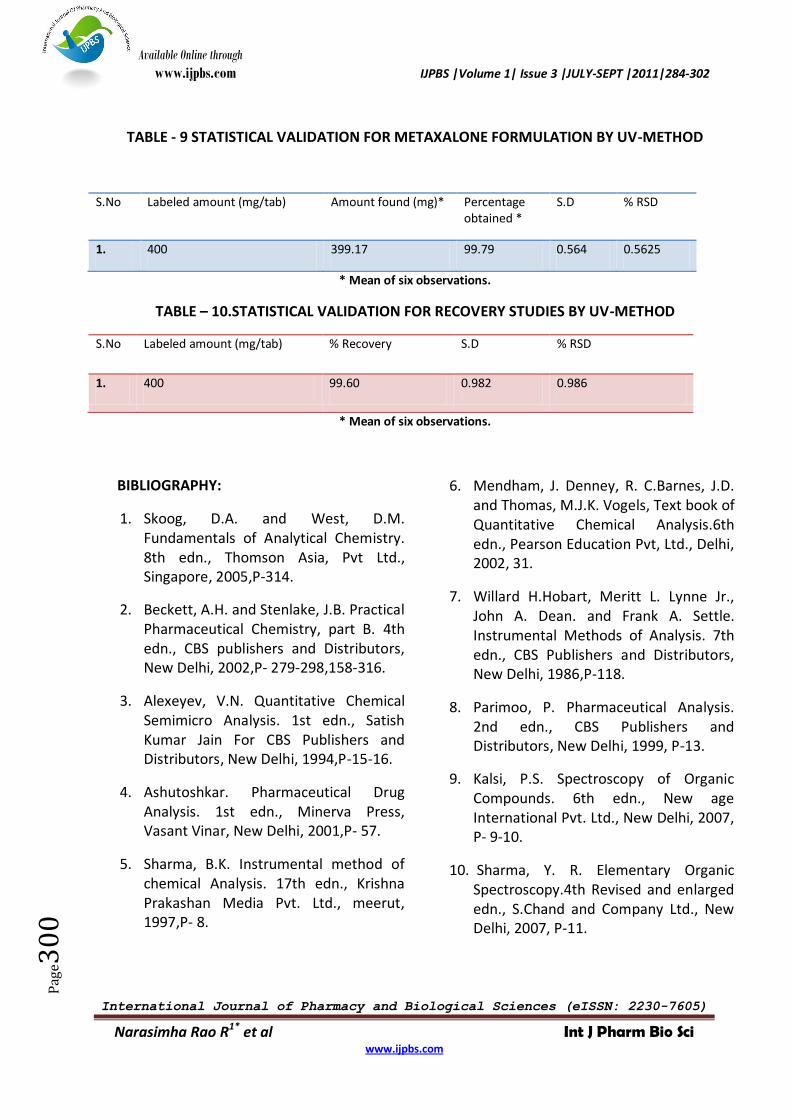
TABLE - 9 STATISTICAL VALIDATION FOR METAXALONE FORMULATION BY UV-METHOD
S.No Labeled amount (mg/tab) Amount found (mg)* Percentage obtained *
S.D % RSD
1. 400 399.17 99.79 0.564 0.5625
* Mean of six observations.
TABLE – 10.STATISTICAL VALIDATION FOR RECOVERY STUDIES BY UV-METHOD
S.No Labeled amount (mg/tab) % Recovery S.D % RSD
1. 400 99.60 0.982 0.986
* Mean of six observations.
BIBLIOGRAPHY:
1. Skoog, D.A. and West, D.M. Fundamentals of Analytical Chemistry. 8th edn., Thomson Asia, Pvt Ltd., Singapore, 2005,P-314.
2. Beckett, A.H. and Stenlake, J.B. Practical Pharmaceutical Chemistry, part B. 4th edn., CBS publishers and Distributors, New Delhi, 2002,P- 279-298,158-316.
3. Alexeyev, V.N. Quantitative Chemical Semimicro Analysis. 1st edn., Satish Kumar Jain For CBS Publishers and Distributors, New Delhi, 1994,P-15-16.
4. Ashutoshkar. Pharmaceutical Drug Analysis. 1st edn., Minerva Press, Vasant Vinar, New Delhi, 2001,P- 57.
5. Sharma, B.K. Instrumental method of chemical Analysis. 17th edn., Krishna Prakashan Media Pvt. Ltd., meerut, 1997,P- 8.
6. Mendham, J. Denney, R. C.Barnes, J.D. and Thomas, M.J.K. Vogels, Text book of Quantitative Chemical Analysis.6th edn., Pearson Education Pvt, Ltd., Delhi, 2002, 31.
7. Willard H.Hobart, Meritt L. Lynne Jr., John A. Dean. and Frank A. Settle. Instrumental Methods of Analysis. 7th edn., CBS Publishers and Distributors, New Delhi, 1986,P-118.
8. Parimoo, P. Pharmaceutical Analysis. 2nd edn., CBS Publishers and Distributors, New Delhi, 1999, P-13.
9. Kalsi, P.S. Spectroscopy of Organic Compounds. 6th edn., New age International Pvt. Ltd., New Delhi, 2007, P- 9-10.
10. Sharma, Y. R. Elementary Organic Spectroscopy.4th Revised and enlarged edn., S.Chand and Company Ltd., New Delhi, 2007, P-11.
Available Online through
www.ijpbs.com IJPBS |Volume 1| Issue 3 |JULY-SEPT |2011|284-302
International Journal of Pharmacy and Biological Sciences (eISSN: 2230-7605)
Narasimha Rao R1* et al Int J Pharm Bio Sci www.ijpbs.com
Pag
e30
1
11. Silverstein, R.M., Claytion Bassler, G. and Terrence C. Morrill. Spectrometric Identification of Organic compounds. John Wiley and sons, New York, 1991,P- 289.
12. Jag mohan. Organic Analytical Chemistry Theory and Practice. 2nd edn., Narosa Publishing House, New Delhi, 2006,P- 125-126.
13. Sharma, B.K. Instrumental Methods of Chemical Analysis. 26th edn., Goel publishing House, Meerut, India, 2000, P- S74-S75, S86.
14. Chatwal , R. Gurdeep and Sham, K. Anand. Instrumental Methods of Chemical Analysis. 5th Revised edn., Himalaya publishing House, Mumbai, 2000, P-160.
15. Williams H. Dudley. Spectroscopic Methods in Organic Chemistry. 5th edn., Tata McGraw-Hill Publishing Company Ltd., New Delhi, 2007, P-3.
16. William Kemp, Organic Spectroscopy. 3rd edn., Palgrave Publishers, New York, 1996, P-258-259.
17. Devala Rao, G. Text Book of Pharmaceutical Analysis. 4th edn., Birla publications Pvt. Ltd., 2, 2007-2008,P- 1-15.
18. www.pubmed.com,
19. www.chromtech.com.
20. Sethi, P.D. HPLC Quantitative Analysis of Pharmaceutical formulations. 1st edn., CBS Publishers and Distributors, Delhi, 2001, P-3-94.
21. Anonymous. The Indian Pharmacopoeia volume-I. The controller of publication, New Delhi, 1996, P- A-44.
22. Nirog R.v ,Ramakrishna V.S.; Kandikere, Vishwottam N.; Shukla Quantification of Metaxalone in human plasma by Liquid chromatograph coupled to tandem mass spectrometry. Journal of Analytical Toxicology, Florida, Vol-30, 2006, page-4.
23. Juan Zhang, Yi-Feng Liu, BoLan, Xiao-Dong Fan, Synthesis of dextran-metaxalone conjugates and study on their control drug release Behaviors, National Nature Science Foundation of China. 2007 page-42Your browser may not support display of this image.
24. Janice Cacace, Eugene E. Reilly, and Anton Amann. Comparison of the Dissolution Of Metaxalone Tablets (Skelaxin) Using USP Apparatus, Journal of Pharmaceutical and Biomedical Analysis ,Volume 16 Submitted: July 14, 2003 Accepted: October23, 2003; Published: February 6, 2004
25. Gruszecki AC, Kloda S, Simmons GT, Daly TM, Hardy RW., Polydrug fatality involving metaxal. Asian Journal of Chemistry, 2006,page 823.
26. Toth PP, UrtisJ., Commonly used muscle relaxant therapies for acute low back pain: a review of carisoprodol, cyclobenzaprine hydrochloride, and metaxalone. Indian Journal of Pharmaceutical Science. September 8, 2004. , page- 546.
27. Elenbaas JK., Centrally acting oral skeletal muscle relaxants. amjhopharm 1980 Oct 37(10) page-1313-23
28. Stanko JR., Review of oral skeletal muscle relaxants for the craniomandibular disorder (CMD) practitioner, U.S. National Library of Medicine, 1999. page-263.
Available Online through
www.ijpbs.com IJPBS |Volume 1| Issue 3 |JULY-SEPT |2011|284-302
International Journal of Pharmacy and Biological Sciences (eISSN: 2230-7605)
Narasimha Rao R1* et al Int J Pharm Bio Sci www.ijpbs.com
Pag
e30
2
*Address for the Correspondence:
NARASIMHARAO R1*
Professor,
HITS COLLEGE OF PHARMACY,
BOGARAM (V), KEESARA (M),R.R(DIST) 501301
E.mail: [email protected]