Embed Size (px)
Citation preview
1-1
Contents - I External Environment
Financial System Financial sector The mechanics of moving resources Economic forces Industry factors
Internal Environment Inputs, Operations, Outputs and supporting activities The various departments Corporate governance and agency problems Company risk and return
The Future Forecasted cash flows Forecasted growth rates
1-2
Contents II Types of Financial Analysis Fundamental Analysis Profit Maximization. ROE (Du Pont) Analysis Factors That Affect Stock Value Fundamental Valuation Models Technical Analysis Use of Exotics in Financial Analysis and valuation Use of Mathematics in Financial Analysis Forecasting in financial Analysis PE and PB Rations in Depth Analysis
1-3
Review -What is Financial Analysis
Financial analysis: To evaluate and valuate.
Evaluate determinants of financial performance
Determine and put a value to performance parameters
Make a decision
1-4
Review of the First Session Introduction to the financial system including an
explanation of the financial sector, participants in the financial system and interest and money as the driver and lubricants of the economy.
Reviewed the external and internal environment and their effects as determinants of forecasting and drivers of value.
Reviewed the basics of financial analysis like its scope and content and some new trends in financial analysis that are becoming the new tools that are increasingly used especially in valuation of financial derivatives and other structured financial instruments.
1-5
Manager – Shareholder Agents--managers with a fiduciary duty to act in the best interests of
owners Agency problem--managers maximize their own self-interests at the
expense of owners High salaries of CEOs Emphasis on short-term performance at expense of long-term performance Empire building for status perquisites
The burden is to align the interests of the manager with those of the shareholders
This puts a DRAIN on the performance and value of the firm. Tactics used to align interest:
Manager part owner Stock options Bonuses Cash dividends Debt Monitoring Corporate control markets
1-6
Shareholder – Debt holder The conflict of interest arises here when the
firm is over indebted. Shareholders will get into high risk – high
return investments, if such investments materialize, shareholders will reap most of the benefit (debt holders are paid a fixed percentage and the residual goes to the shareholders), if not most of the loss will be on the side of the debt holders.
The solution is covenants The financial analyst needs to assess such
situation in the process of determining a risk premium among other things.
1-7
Shareholder - Shareholder A rises in companies with subsidiaries
and affiliates The interests of the subsidiary
shareholders are not in line with those of the shareholders of the parent companies
Appears in capital budgeting decisions especially when the parent and the subsidiary are in two different tax and regulatory regimes
1-8
Auditors Auditors are prone to be lenient in
auditing financial statements and in valuing business because they are paid by the very same party they are auditing or do not want to lose future business opportunities.
Such considerations need to be taken into account when financially analyzing a firm.
1-9
Regulators The regulators interests may be
different from those of the company being analyzed
The regulator may enact regulations that hurt the company for the public good; levying taxes is an example.
1-10
The Market for Corporate Control Participants in the financial markets are
monitoring each other to capitalize on opportunities of buying an undervalued firm.
Firms that have corporate governance problems are prone to incur higher rate of return due to the risk premium added from such problems.
The financial analyst needs to incorporate such factors in estimating and forecasting required rates of return and future cash flows.
1-11
Company Risk and Return The analyst needs to incorporate specific analysis of the
riskness of the company to reflect that on the required rate of return on investing sums of money in such company.
Many measures of risk, the most important ones are the most simple ones, because they are the ones used most in industry practice.
Beta Sigma VaR Many more like: down side risk, coefficient of variation,
regressions, time series, FF two factor model, FF multi factor models, Merton intertemporal model, stochastic models, stress tests under various distributions …..
1-12
Types of Financial Analysis Fundamental: use of all relevant
information and to predict value – assumes markets efficiency.
Technical: use of past price, trading volume and people behavior to predict value – assumes market inefficiency.
Naïve: Financial ratios and some calculated indicators – limited usefulness.
1-13
Fundamental Analysis The value of an asset is equal to the
present value of all of its future net cash flow.
Need to take previous factors into account when forecasting cash flows, growth rates and required rates of return.
Depends on all relevant information Believes in Semi strong form market
efficiency.
1-14
Is stock price maximization the same as profit maximization?
No, despite a generally high correlation amongst stock price, EPS, and cash flow.
Current stock price relies upon current earnings, as well as future earnings and cash flow.
Some actions may cause an increase in earnings, yet cause the stock price to decrease (and vice versa).
1-15
Profit Maximization Example:Equity = 10 million shares @ DHS1 a share
book value, no RE, no PIC and no reserves.
Profits = DHS10 millionCEO and CFO claim that they can
maximize profits by increasing them to DHS10.5 million if they company would issue 1 million new shares.
In this case profits are maximized however profitability is lowered
1-16
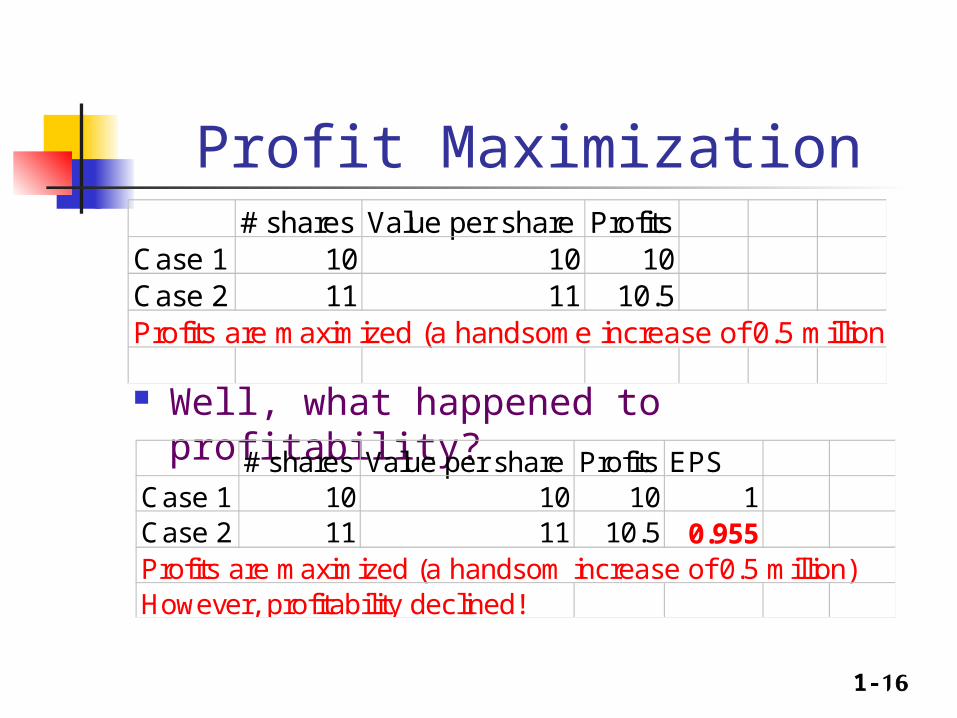
Profit Maximization
Well, what happened to profitability?
# shares Value per share ProfitsCase 1 10 10 10Case 2 11 11 10.5Profits are maximized (a handsome increase of 0.5 million)
# shares Value per share Profits EPSCase 1 10 10 10 1Case 2 11 11 10.5 0.955Profits are maximized (a handsom increase of 0.5 million)However, profitability declined!
1-17
Profit and Profitability Maximization
Example:Equity = 1 million shares @ DHS1 a share
book value, no RE, no PIC and no reserves.
Profits = DHS1 millionCEO and CFO claim that they can maximize
profits by increasing them to DHS1.5 million if they company would retain all of last year’s earnings, i.e. DHS1 million .
In this case profits and profitability are maximized
1-18
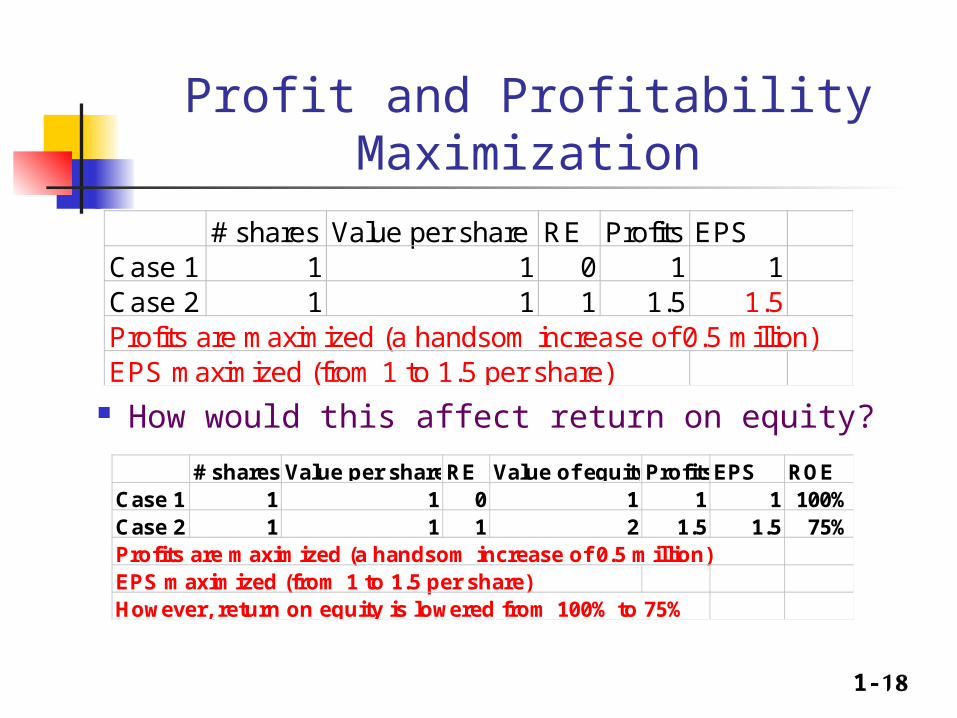
Profit and Profitability Maximization
# shares Value per shareRE Value of equityProfitsEPS ROECase 1 1 1 0 1 1 1 100%Case 2 1 1 1 2 1.5 1.5 75%Profits are maximized (a handsom increase of 0.5 million)EPS maximized (from 1 to 1.5 per share)However, return on equity is lowered from 100% to 75%
# shares Value per share RE Profits EPSCase 1 1 1 0 1 1Case 2 1 1 1 1.5 1.5Profits are maximized (a handsom increase of 0.5 million)EPS maximized (from 1 to 1.5 per share)
How would this affect return on equity?
1-19
Maximizing Profits, Profitability and Return on
Equity! Use leverage to increase the return on equity However this will increase the riskness of the firm Increasing risk lowers the price. Furthermore, the return on total assets will decline
1-20
Maximizing Profits, Profitability and Return on
Equity!
Example same as last example, but instead of
retaining earnings, finance growth operations and profits by borrowing from the bank at 10%.
1-21
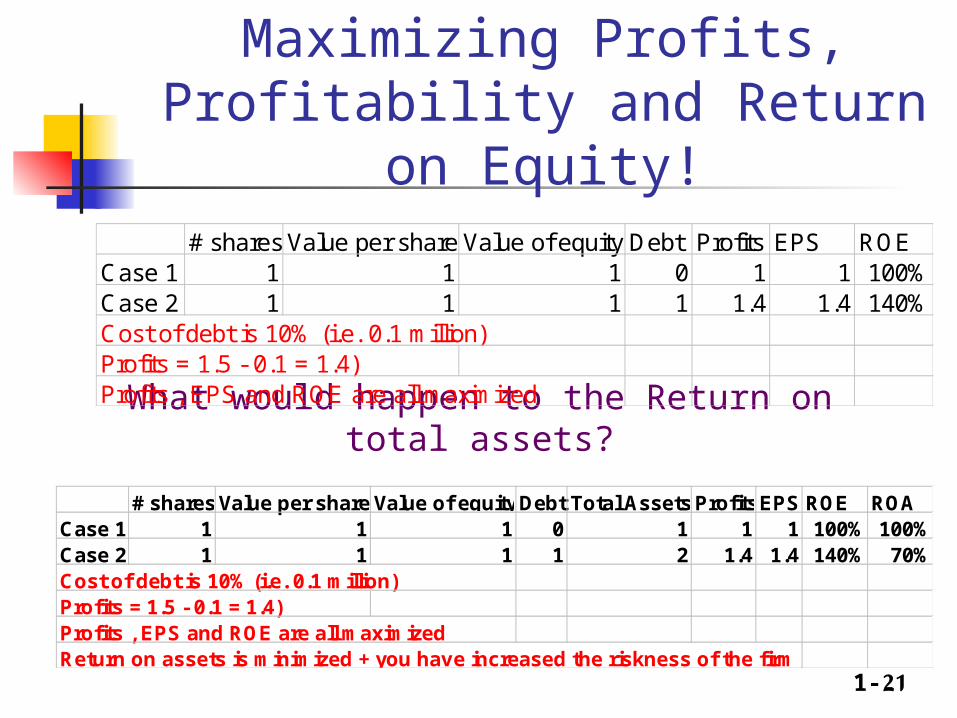
What would happen to the Return on total assets?
# shares Value per share Value of equity Debt Profits EPS ROECase 1 1 1 1 0 1 1 100%Case 2 1 1 1 1 1.4 1.4 140%Cost of debt is 10% (i.e. 0.1 million)Profits = 1.5 - 0.1 = 1.4)Profits , EPS and ROE are all maximized
Maximizing Profits, Profitability and Return on
Equity!
# shares Value per share Value of equityDebt Total Assets ProfitsEPS ROE ROACase 1 1 1 1 0 1 1 1 100% 100%Case 2 1 1 1 1 2 1.4 1.4 140% 70%Cost of debt is 10% (i.e. 0.1 million)Profits = 1.5 - 0.1 = 1.4)Profits , EPS and ROE are all maximizedReturn on assets is minimized + you have increased the riskness of the firm
1-22
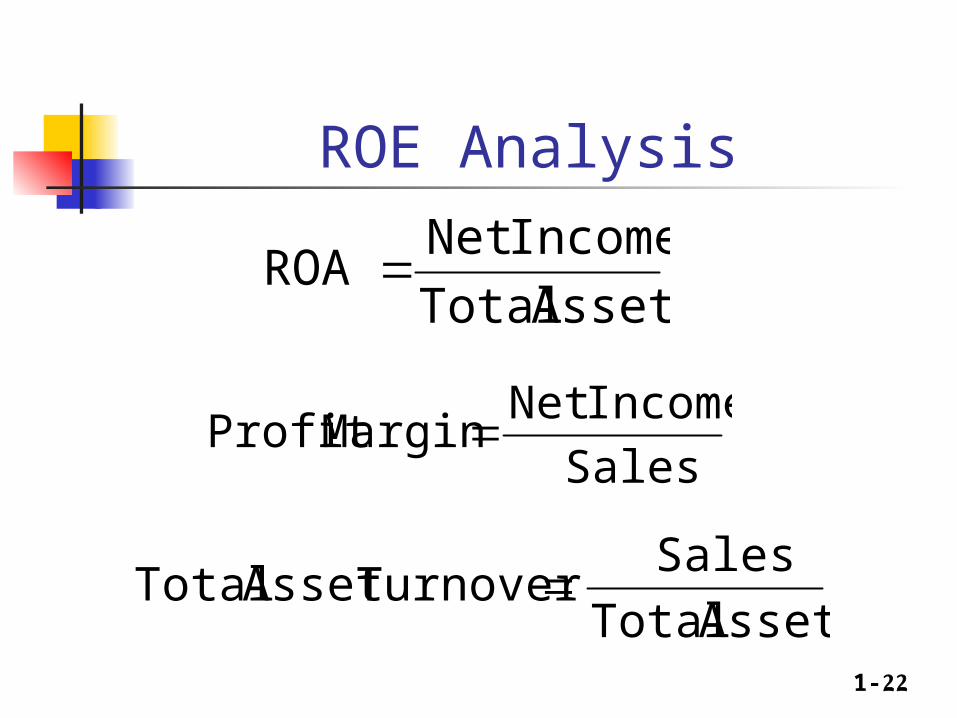
ROE Analysis
Assets Total
IncomeNet ROA
Assets Total
Sales Turnover Asset Total
Sales
IncomeNet MarginProfit
1-23
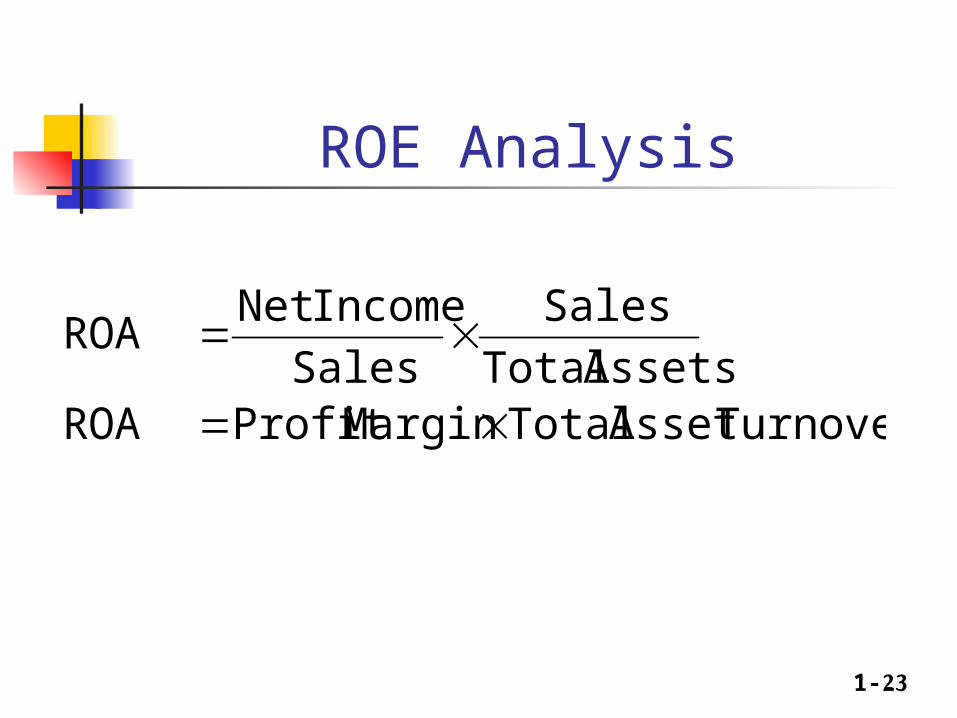
ROE Analysis
TurnoverAsset TotalMarginProfit ROA Assets Total
Sales
Sales
IncomeNet ROA
1-24
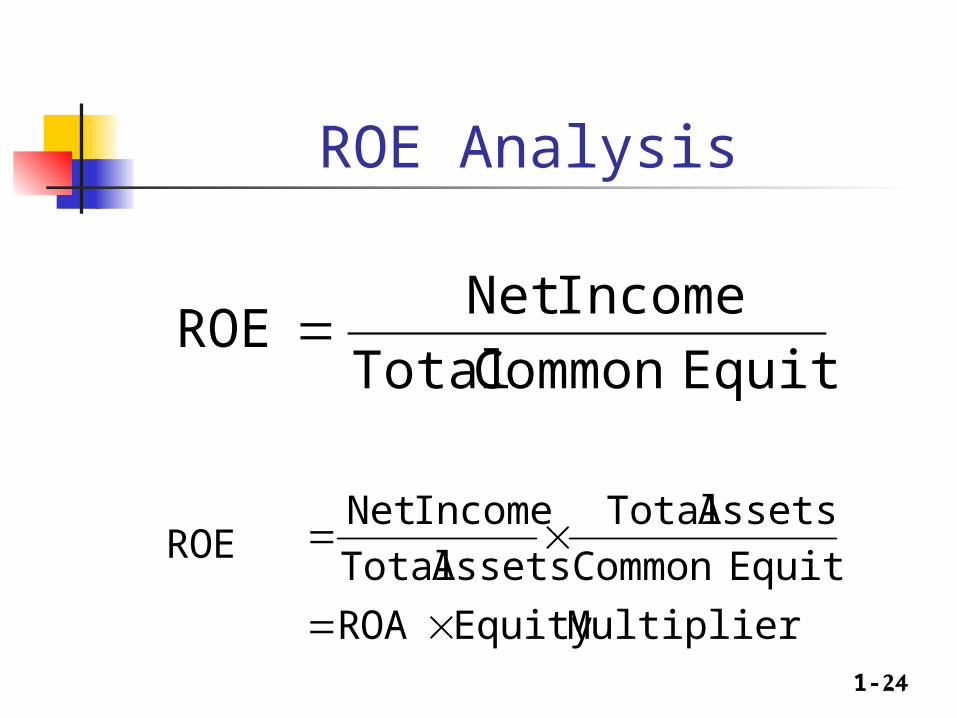
ROE Analysis
MultiplierEquity ROA
EquityCommon
Assets Total
Assets Total
IncomeNet ROE
EquityCommon Total
IncomeNet ROE
1-25
ROE Analysis
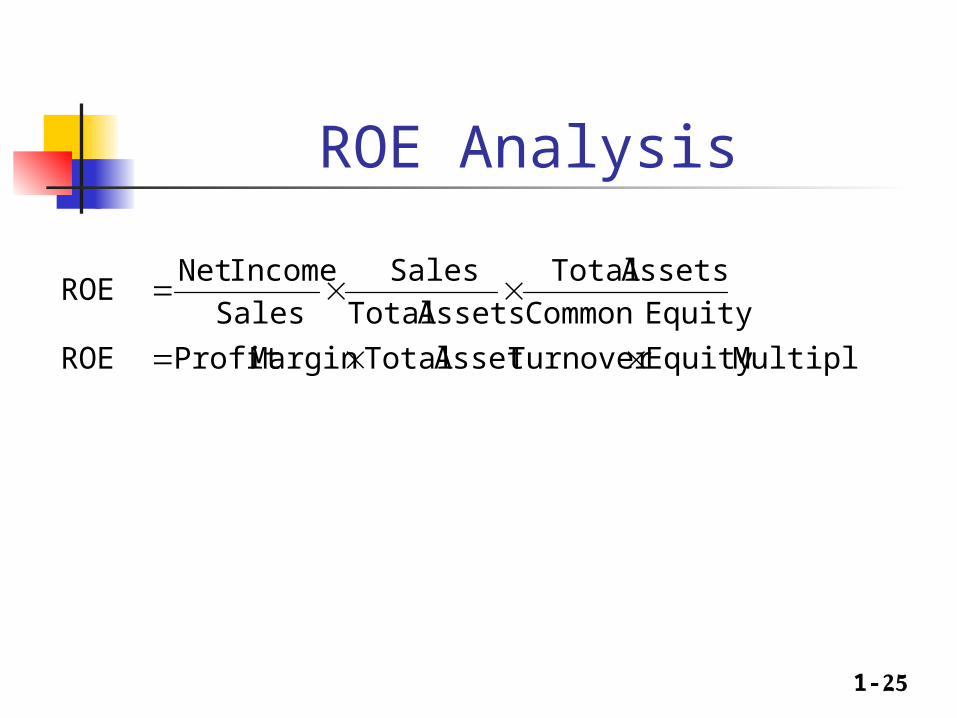
MultiplierEquity TurnoverAsset TotalMarginProfit ROE
EquityCommon
Assets Total
Assets Total
Sales
Sales
IncomeNet ROE
1-26
Factors that affect stock price Projected cash flows to shareholders
Timing of the cash flow stream
Riskiness of the cash flows
1-27
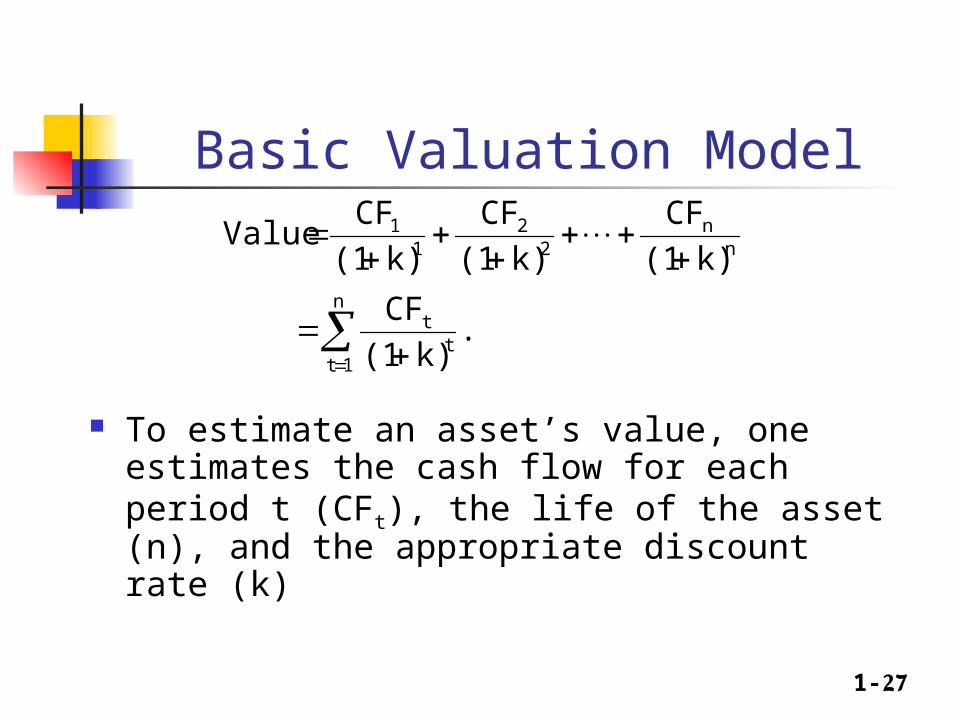
Basic Valuation Model
To estimate an asset’s value, one estimates the cash flow for each period t (CFt), the life of the asset (n), and the appropriate discount rate (k)
n
1tt
t
nn
22
11
.k)(1
CF
k)(1
CF
k)(1
CF
k)(1
CF Value
1-28
Dividend Discount Models Constant growth Two growth Multi growth Stochastic
Additive w and w/o bankruptcy Geometric w and w/o bankruptcy
1-29
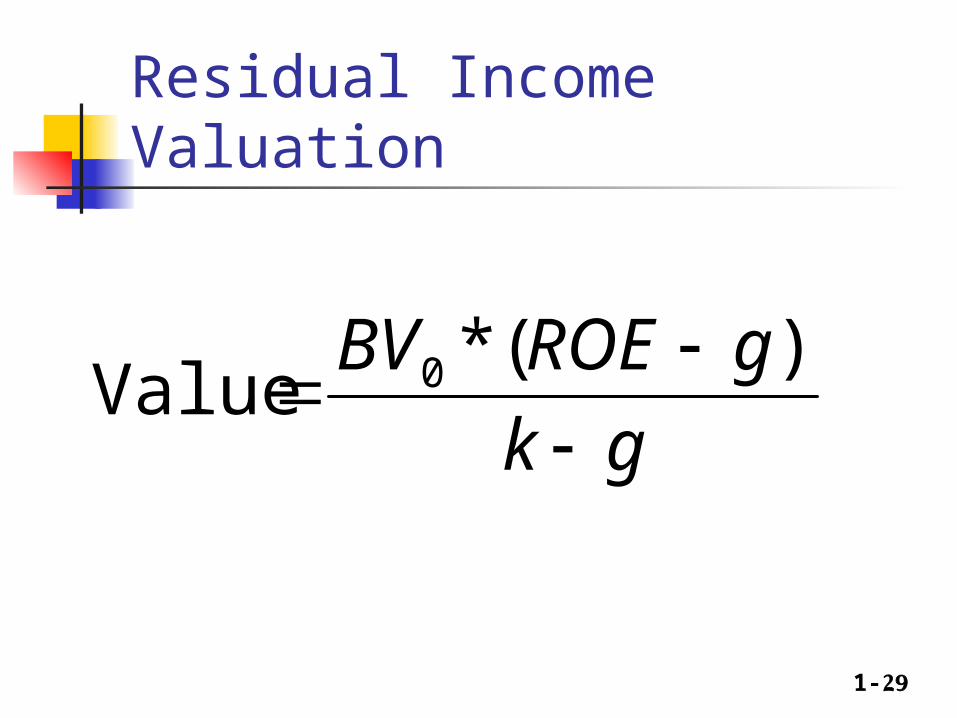
Residual Income Valuation
gk
gROEBV
)(*
Value 0
1-30
Multipliers PE PB V/EBIT P/S P/CF
1-31
Technical analysis Depends on past prices and
trading volumes to predict price and performance
Markets are inefficient Prices are trendy Can be very mathematical
1-32
Technical Charts Point and figure Candlesticks OHLC Price lines Moving averages ……
1-33
Technical Indicators Candlesticks: hammer, bullish engulfing,
morning star, bearish engulfing, hanging man, harami, Marubozu, three white soldiers, …. Many more.
Technical indicators: moving averages, exponential moving averages, Bollinger bands, slow stochastic, fast stochastic, Trin, Trix, Money flow index, RSI, Average directional index, Williams %R, Price rate of change, Oscillators, …. Many more.
1-34
Exotic Financial Analysis Stochastic models in forecasting
items and future interest rates and discount rates, and the previously mentioned stochastic dividend discount models.
Real Options Abandonment Options
1-35
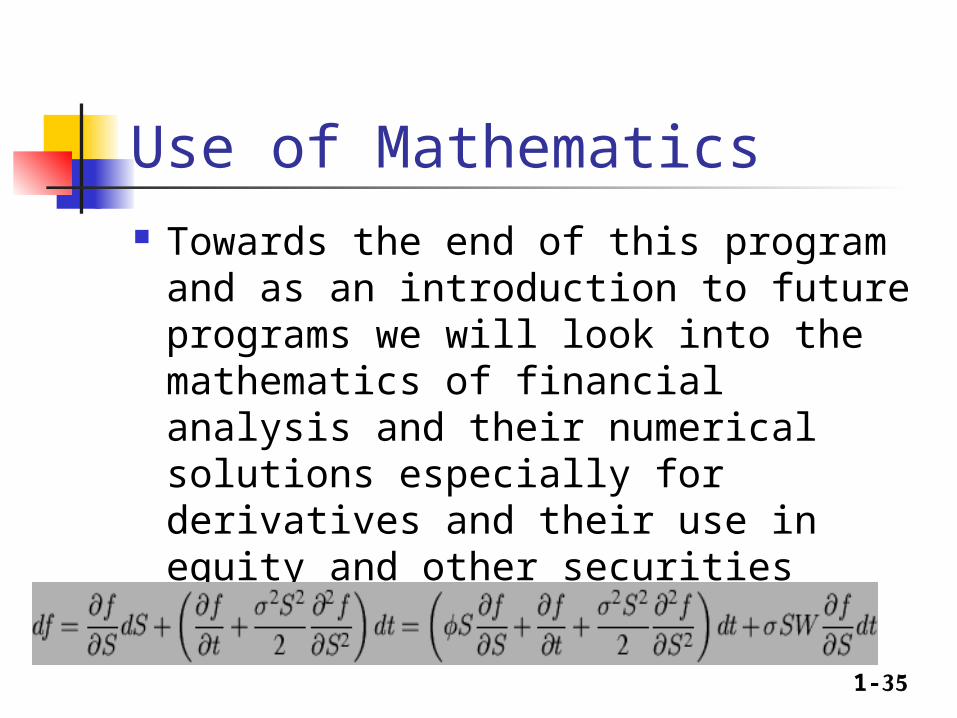
Use of Mathematics Towards the end of this program
and as an introduction to future programs we will look into the mathematics of financial analysis and their numerical solutions especially for derivatives and their use in equity and other securities financial analyses.
1-36
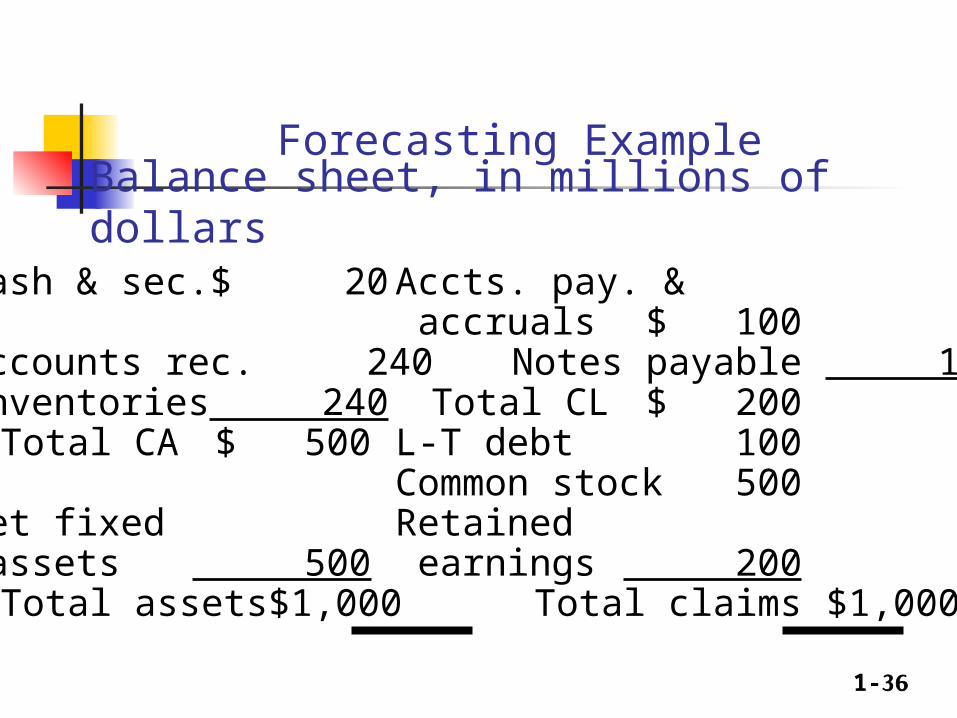
Forecasting Example
Cash & sec. $ 20 Accts. pay. & accruals $ 100
Accounts rec. 240 Notes payable 100Inventories 240 Total CL $ 200
Total CA $ 500 L-T debt 100Common stock 500
Net fixed Retained assets 500 earnings 200
Total assets $1,000 Total claims $1,000
Balance sheet, in millions of dollars
1-37
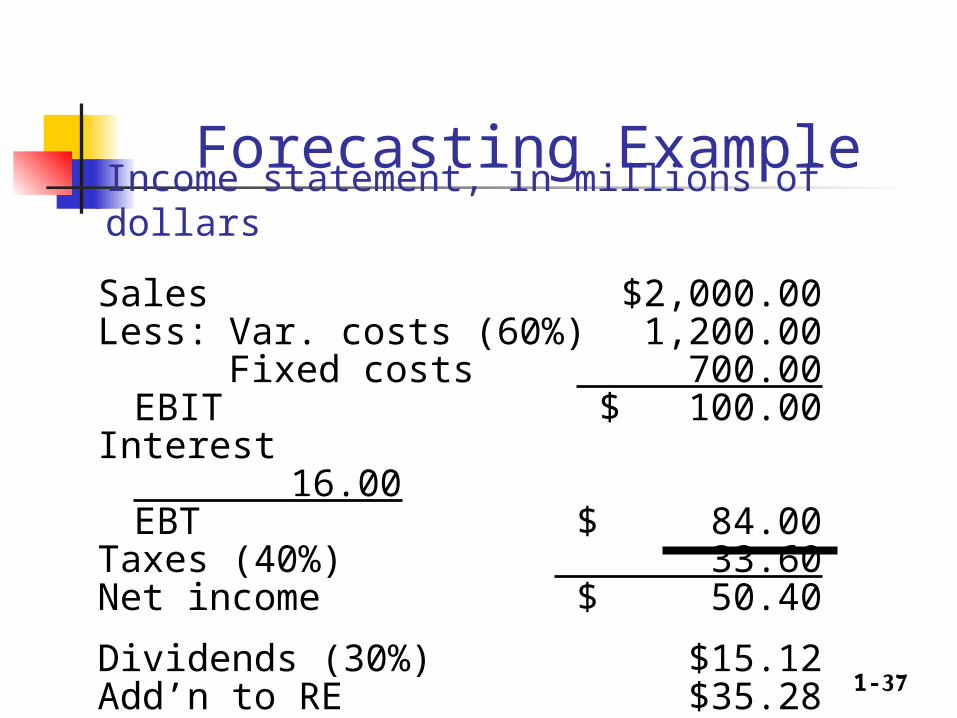
Sales $2,000.00Less: Var. costs (60%) 1,200.00
Fixed costs 700.00EBIT $ 100.00
Interest 16.00EBT $ 84.00
Taxes (40%) 33.60Net income $ 50.40
Dividends (30%) $15.12Add’n to RE $35.28
Income statement, in millions of dollars
Forecasting Example
1-38
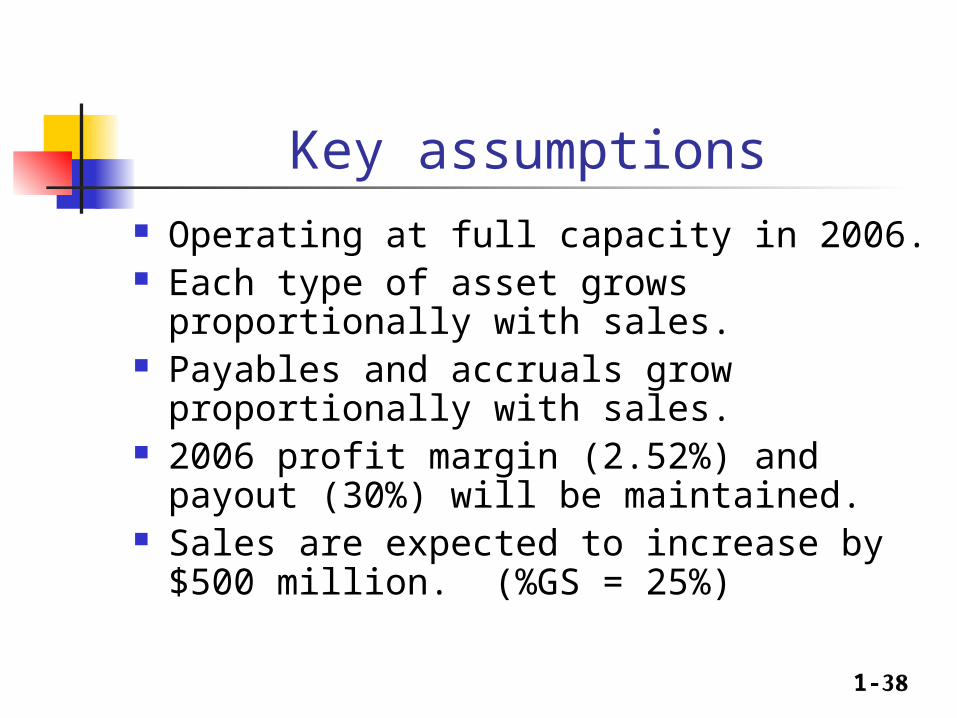
Key assumptions Operating at full capacity in 2006. Each type of asset grows proportionally
with sales. Payables and accruals grow
proportionally with sales. 2006 profit margin (2.52%) and payout
(30%) will be maintained. Sales are expected to increase by $500
million. (%GS = 25%)
1-39
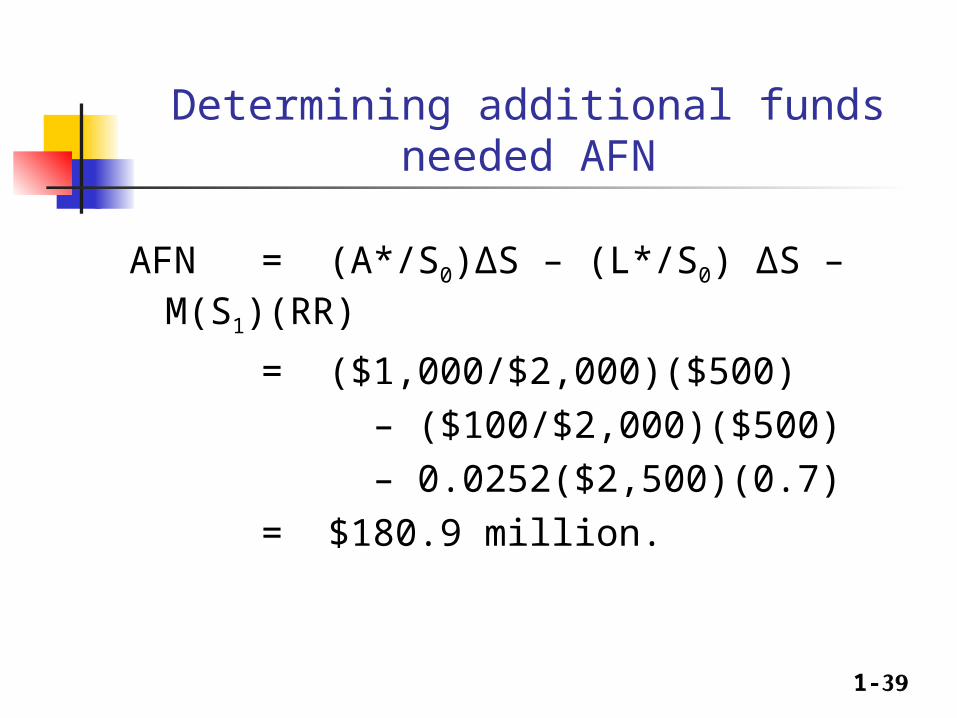
Determining additional funds needed AFN
AFN = (A*/S0)ΔS – (L*/S0) ΔS – M(S1)(RR)
= ($1,000/$2,000)($500) – ($100/$2,000)($500) – 0.0252($2,500)(0.7)= $180.9 million.
1-40
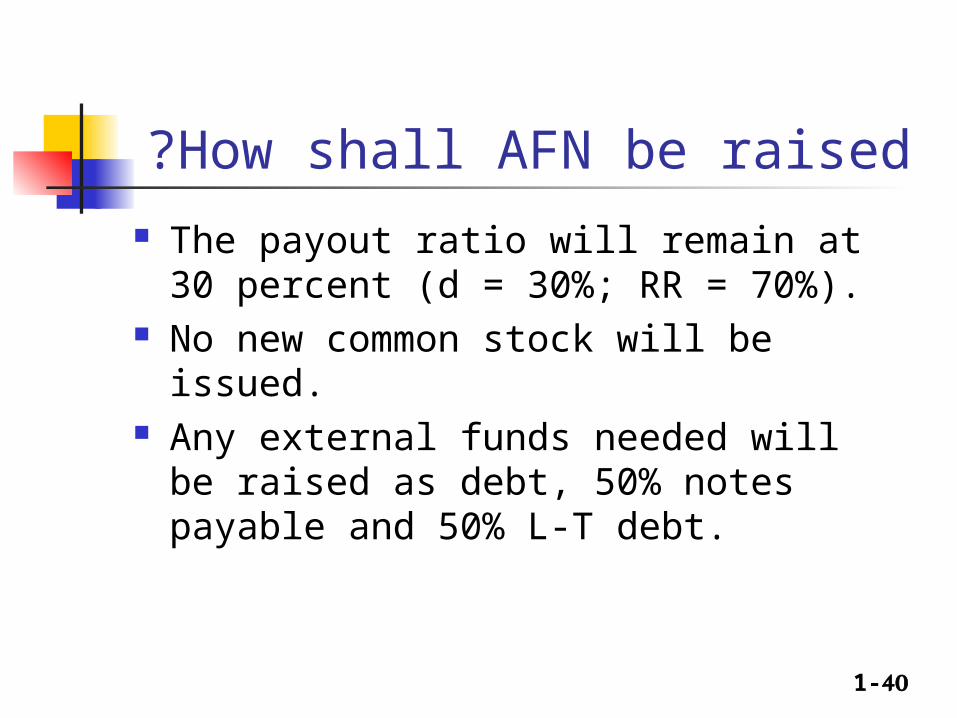
How shall AFN be raised? The payout ratio will remain at 30
percent (d = 30%; RR = 70%). No new common stock will be issued. Any external funds needed will be
raised as debt, 50% notes payable and 50% L-T debt.
1-41
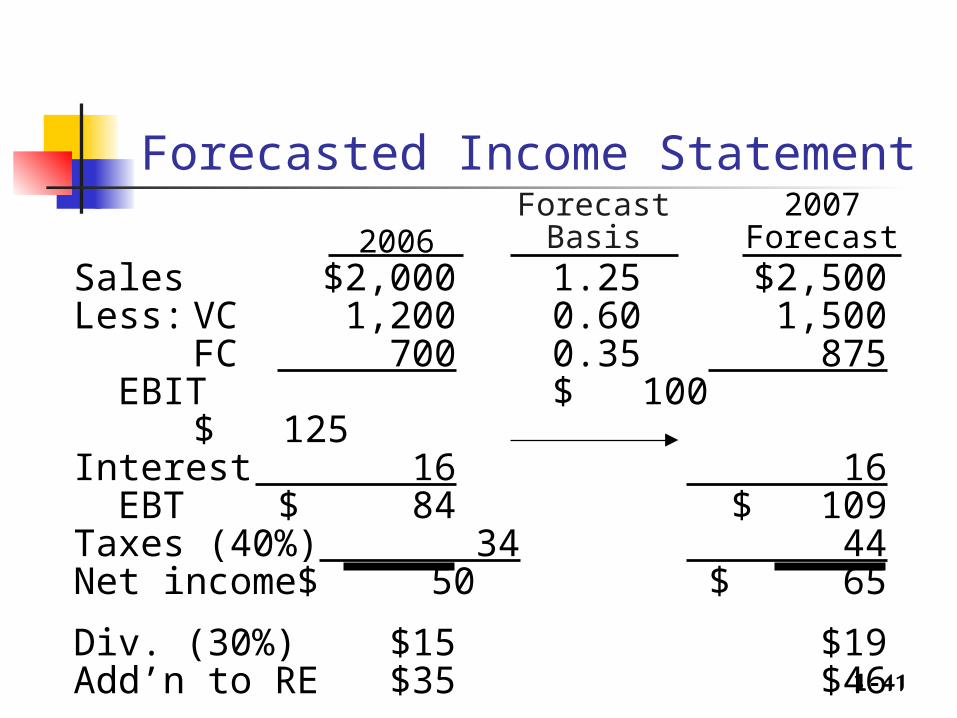
Forecasted Income Statement
Sales $2,000 1.25 $2,500Less: VC 1,200 0.60 1,500
FC 700 0.35 875 EBIT $ 100 $ 125Interest 16 16 EBT $ 84 $ 109Taxes (40%) 34 44Net income $ 50 $ 65
Div. (30%) $15 $19Add’n to RE $35 $46
ForecastBasis
2007Forecast2006
1-42
20071st Pass
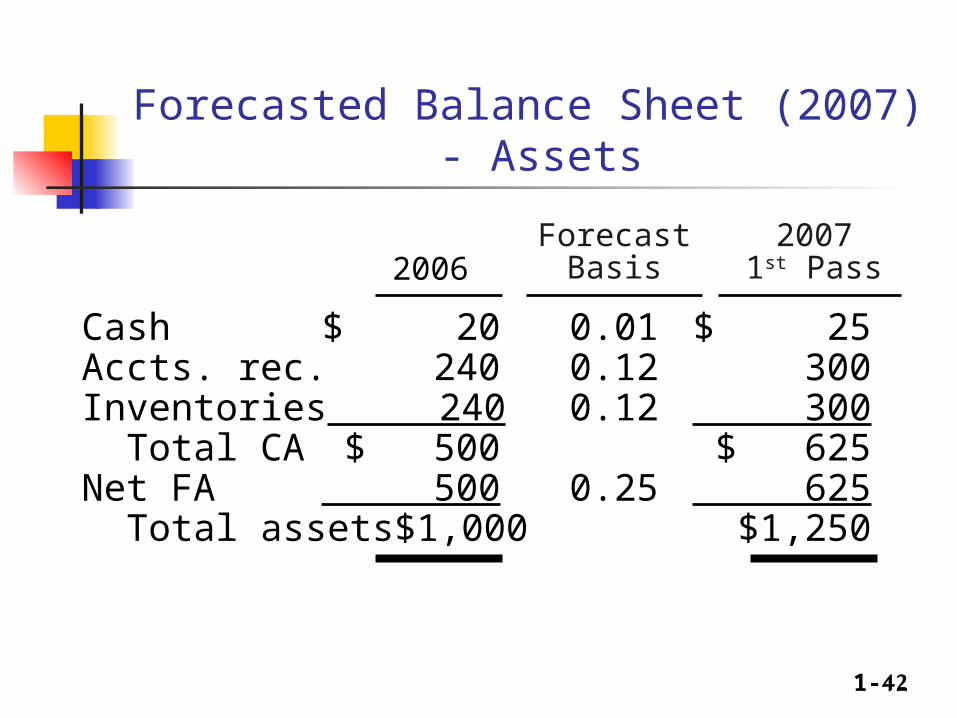
Forecasted Balance Sheet (2007) - Assets
2006Forecast
Basis
Cash $ 20 0.01 $ 25Accts. rec. 240 0.12 300Inventories 240 0.12 300 Total CA $ 500 $ 625Net FA 500 0.25 625 Total assets $1,000 $1,250
1-43
20071st Pass2006
ForecastBasis
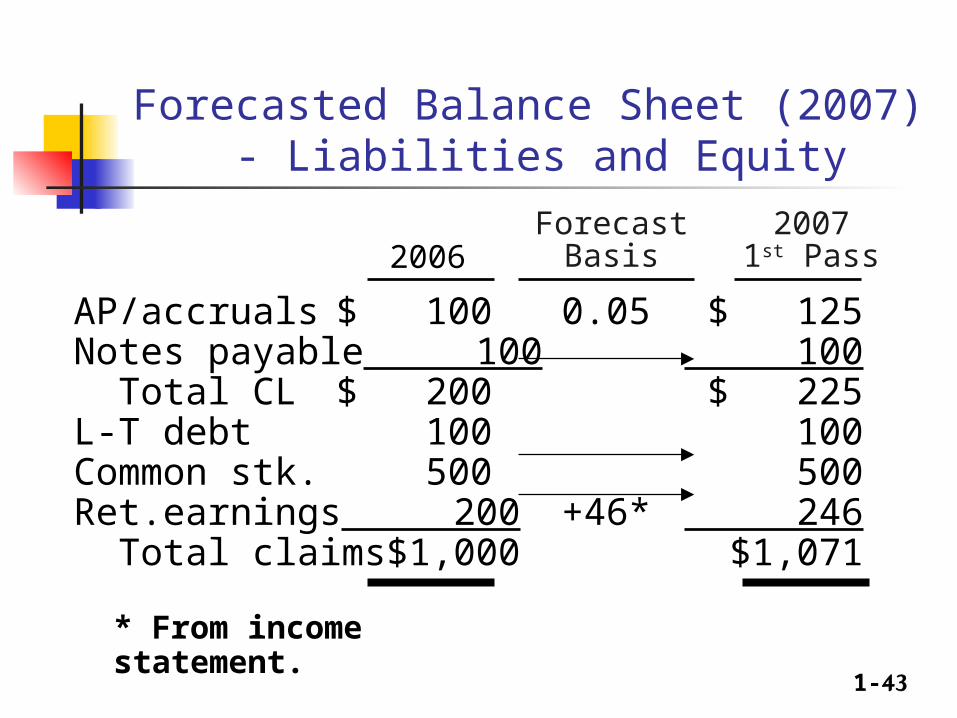
Forecasted Balance Sheet (2007) - Liabilities and Equity
AP/accruals $ 100 0.05 $ 125Notes payable 100 100 Total CL $ 200 $ 225L-T debt 100 100Common stk. 500 500Ret.earnings 200 +46* 246 Total claims $1,000 $1,071
* From income statement.
1-44
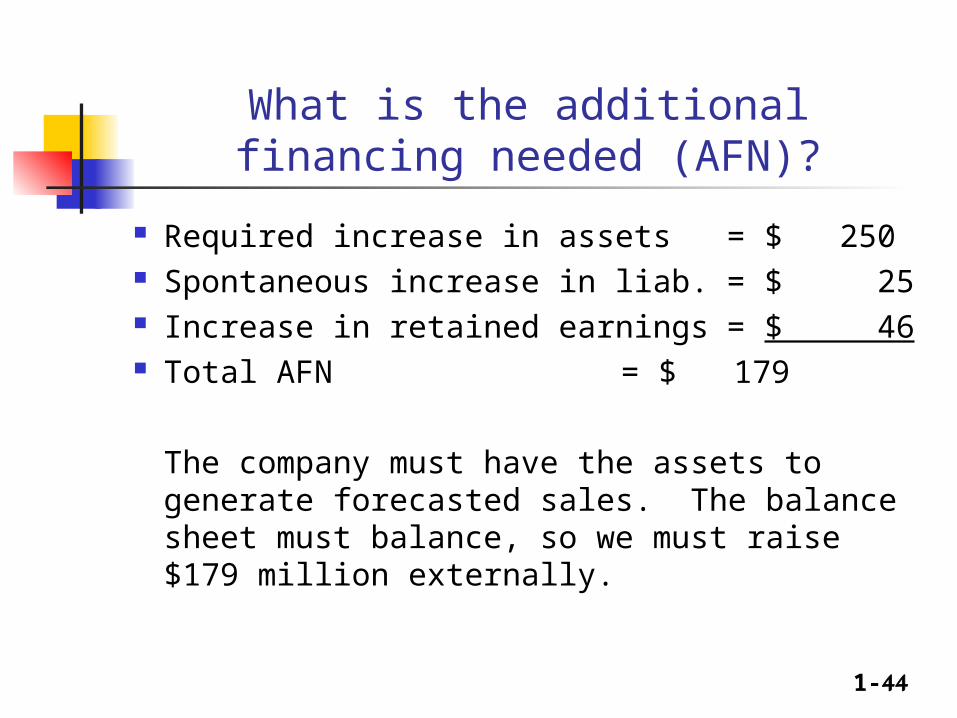
What is the additional financing needed (AFN)?
Required increase in assets = $ 250 Spontaneous increase in liab. = $ 25 Increase in retained earnings = $ 46 Total AFN = $ 179
The company must have the assets to generate forecasted sales. The balance sheet must balance, so we must raise $179 million externally.
1-45
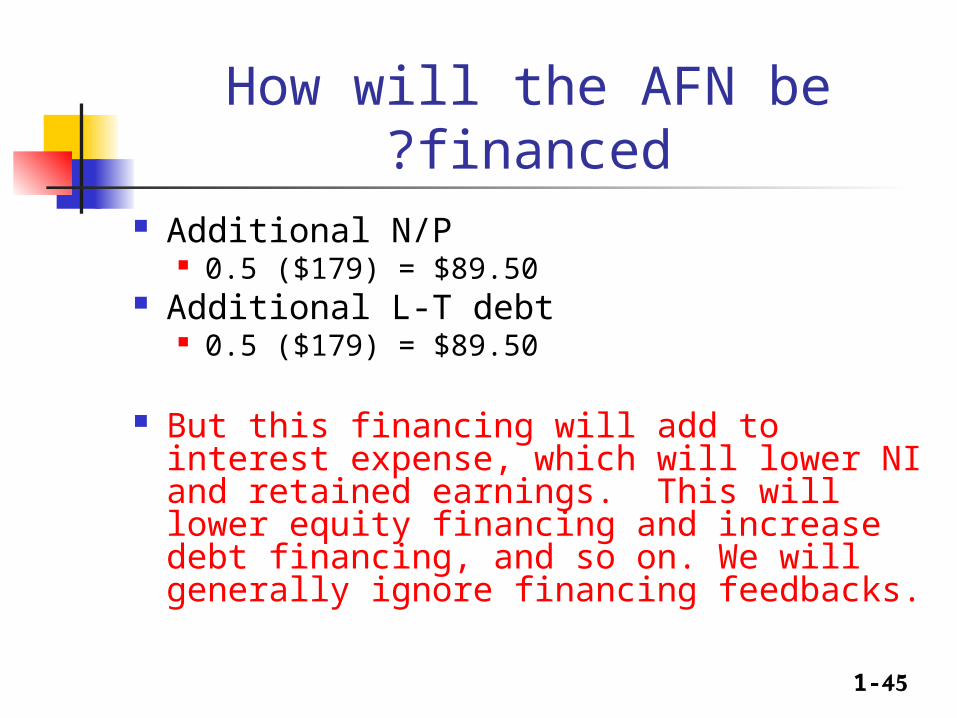
How will the AFN be financed?
Additional N/P 0.5 ($179) = $89.50
Additional L-T debt 0.5 ($179) = $89.50
But this financing will add to interest expense, which will lower NI and retained earnings. This will lower equity financing and increase debt financing, and so on. We will generally ignore financing feedbacks.
1-46
20072nd Pass
20071st Pass AFN
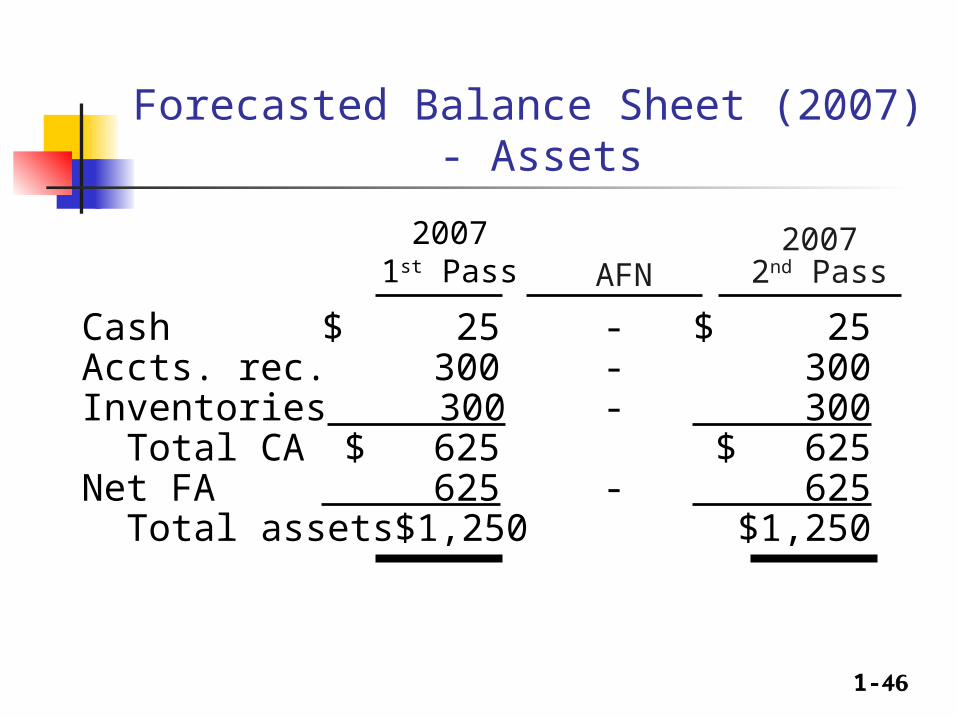
Forecasted Balance Sheet (2007) - Assets
Cash $ 25 - $ 25Accts. rec. 300 - 300Inventories 300 - 300 Total CA $ 625 $ 625Net FA 625 - 625 Total assets $1,250 $1,250
1-47
20072nd Pass
20071st Pass AFN
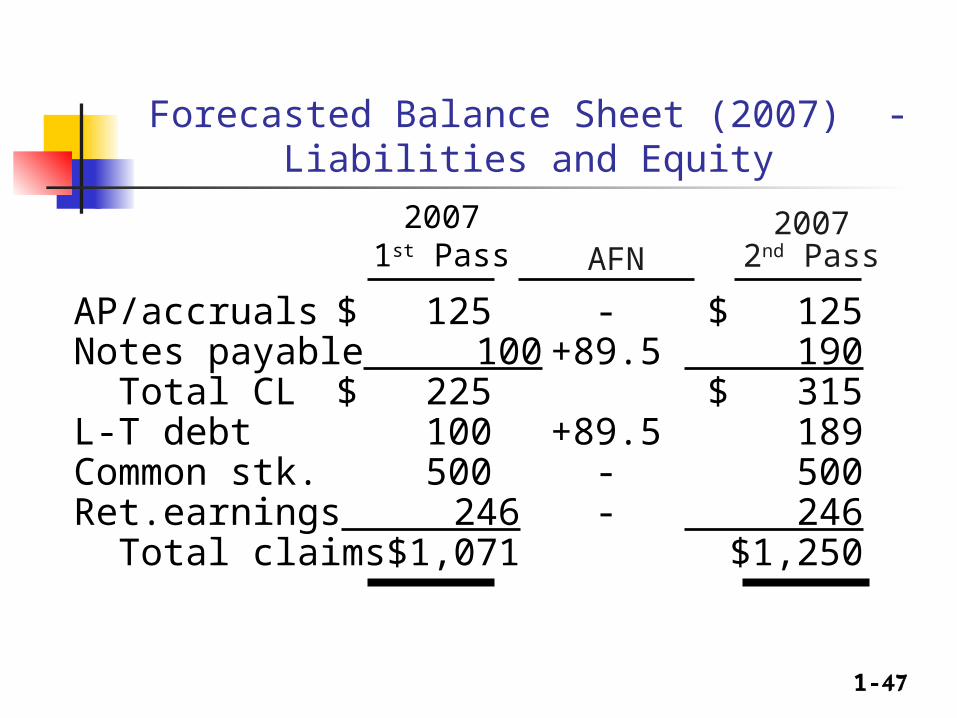
Forecasted Balance Sheet (2007) - Liabilities and Equity
AP/accruals $ 125 - $ 125Notes payable 100 +89.5 190 Total CL $ 225 $ 315L-T debt 100 +89.5 189Common stk. 500 - 500Ret.earnings 246 - 246 Total claims $1,071 $1,250
1-48
Advanced Forecasting Use of regressions for each item Use of iterations in finding interest
income and expense Forecasting with stock dividends,
stock repurchase, stock issuance, stock splits, ….
1-49
Analyzing PE and PB and its UsagesCase I
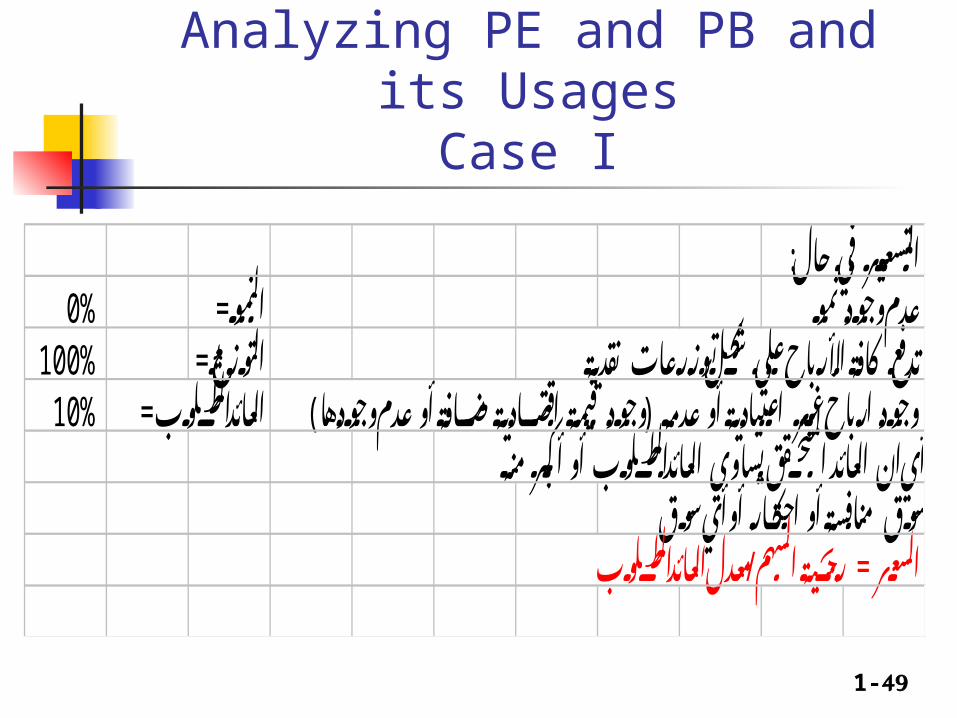
: فيحال التسعيرنمو %0النمو=عدموجود
علىشكلتوزرعاتنقدية كافةاألرباح %100التوزيع=تدفع( عدموجودها عدمه (وجودقيمةاقتصاديةمضافةأو اعتياديةأو غير ارباح =وجود %10العائدالمطلوب
منه أكبر أيانالعائدالمتحققيساويالعائدالمطلوبأوأيسوق أو احتكار سوقمنافسةأو
/معدلالعائدالمطلوب السعر = ربحيةالسهم
1-50
Analyzing PE and PB and its UsagesCase I
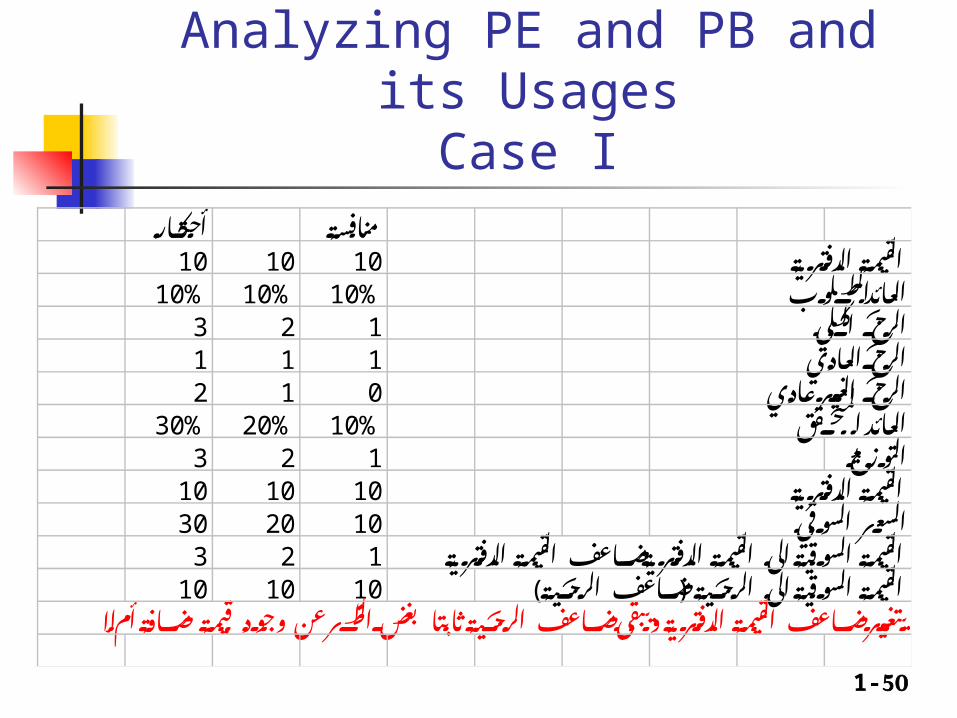
أحتكارمنافسة101010القيمةالدفترية %10%10%10العائدالمطلوب 123الربحالكلي 111الربحالعادي
عادي 012الربحالغير%30%20%10العائدالمتحقق
123التوزيع101010القيمةالدفترية السوقي 102030السعر
123القيمةالسوقيةالىالقيمةالدفتريةمضاعفالقيمةالدفترية ( 101010القيمةالسوقيةالىالربحية (مضاعفالربحية
عنوجودقيمةمضافةأمال بغضالنظر مضاعفالقيمةالدفتريةويبقىمضاعفالربحيةثابتا يتغير
1-51
Analyzing PE and PB and its UsagesCase II
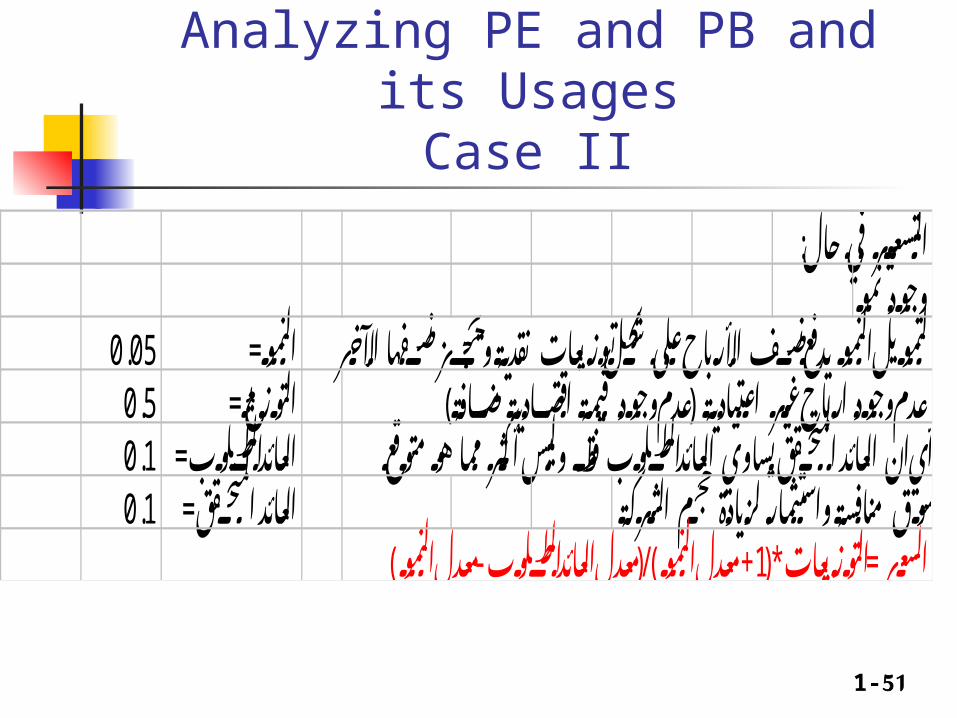
: فيحال التسعيرنمو وجود
اآلخر نصفها علىشكلتوزيعاتنقديةويحجز نصفاألرباح يدفع 0.05النمو=لتمويلالنمو( قيمةاقتصاديةمضافة اعتيادية (عدموجود غير ارباح 0.5التوزيع=عدموجود
متوقع هو مما =أيانالعائدالمتحققيساويالعائدالمطلوبفقطوليسأكثر 0.1العائدالمطلوب لزيادةحجمالشركة =سوقمنافسةواستثمار 0.1العائدالمتحقق
( -معدلالنمو )/(معدلالعائدالمطلوب السعر = التوزيعات*(1+معدلالنمو
1-52
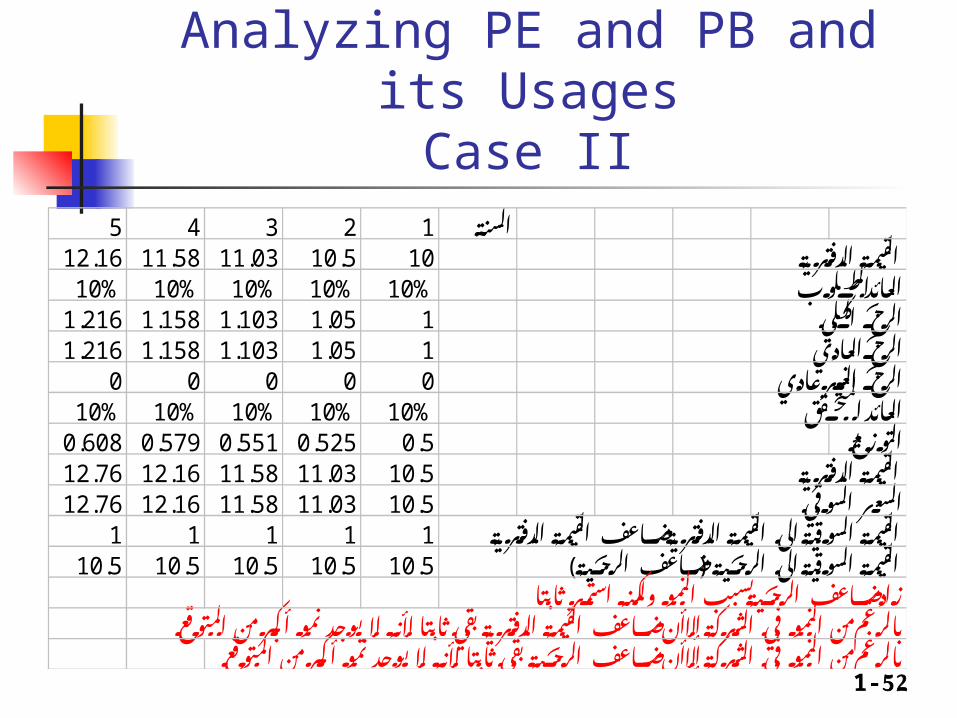
Analyzing PE and PB and its UsagesCase II
12345السنة1010.511.0311.5812.16القيمةالدفترية %10%10%10%10%10العائدالمطلوب 11.051.1031.1581.216الربحالكلي 11.051.1031.1581.216الربحالعادي
عادي 00000الربحالغير%10%10%10%10%10العائدالمتحقق
0.50.5250.5510.5790.608التوزيع10.511.0311.5812.1612.76القيمةالدفترية السوقي 10.511.0311.5812.1612.76السعر
11111القيمةالسوقيةالىالقيمةالدفتريةمضاعفالقيمةالدفترية ( 10.510.510.510.510.5القيمةالسوقيةالىالربحية (مضاعفالربحية
ثابتا ولكنهاستمر زادمضاعفالربحيةبسببالنمومنالمتوقع أكبر يوجدنمو ألنهال أنمضاعفالقيمةالدفتريةبقيثابتا فيالشركةإال بالرغممنالنمو
منالمتوقع أكبر يوجدنمو ألنهال أنمضاعفالربحيةبقيثابتا فيالشركةإال بالرغممنالنمو
1-53
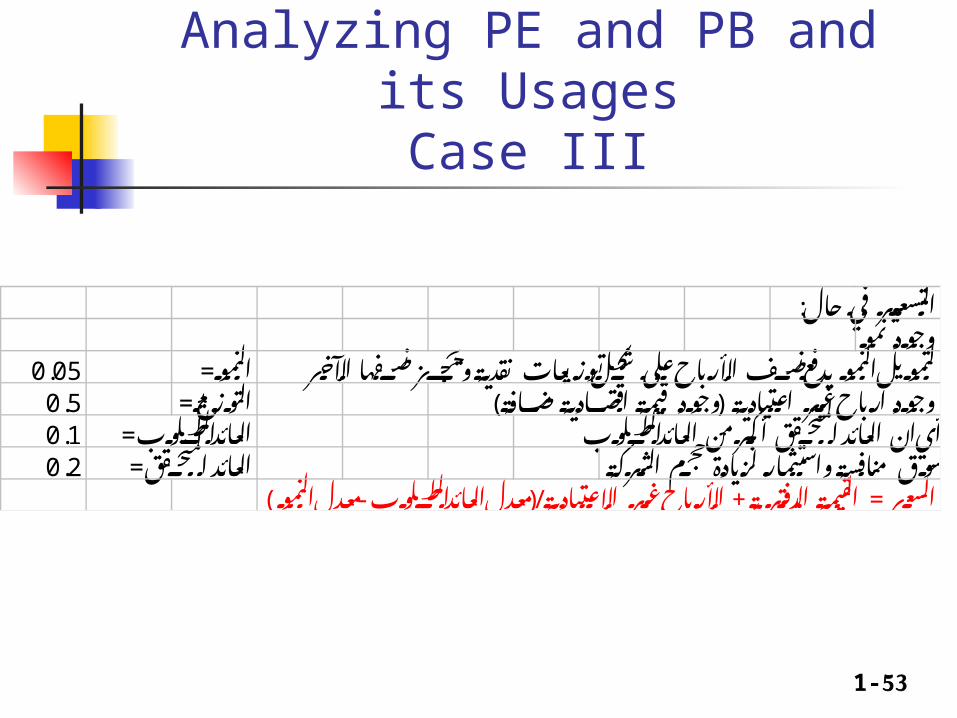
Analyzing PE and PB and its UsagesCase III
: فيحال التسعيرنمو وجود
اآلخر نصفها علىشكلتوزيعاتنقديةويحجز نصفاألرباح يدفع 0.05النمو=لتمويلالنمو( اعتيادية (وجودقيمةاقتصاديةمضافة غير ارباح 0.5التوزيع=وجود
منالعائدالمطلوب =أيانالعائدالمتحققأكبر 0.1العائدالمطلوب لزيادةحجمالشركة =سوقمنافسةواستثمار 0.2العائدالمتحقق
( -معدلالنمو /(معدلالعائدالمطلوب االعتيادية غير السعر = القيمةالدفترية + األرباح
1-54
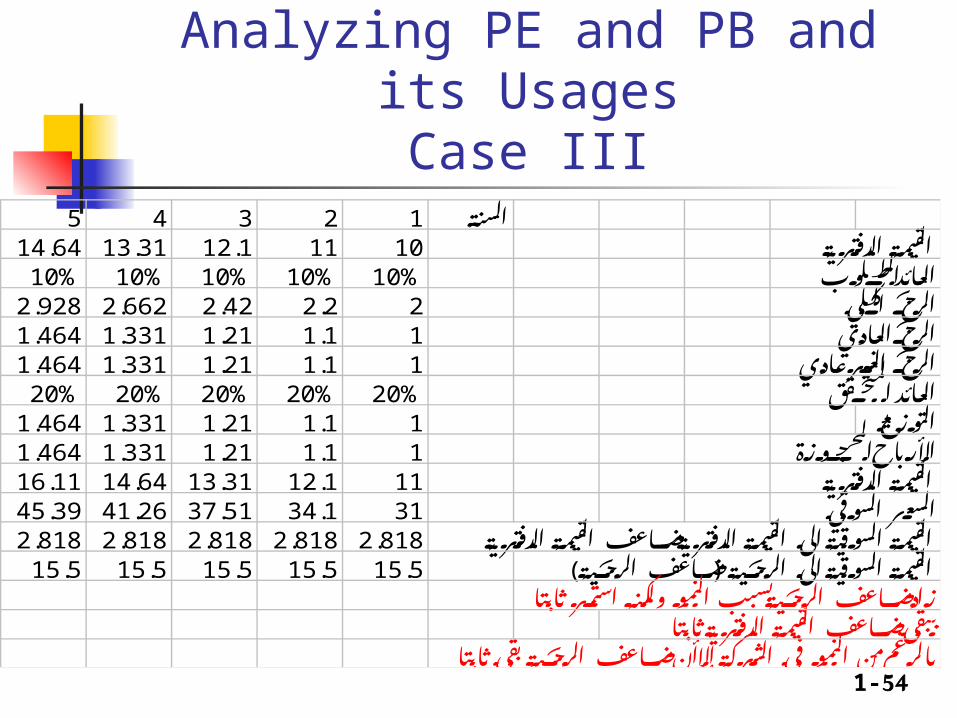
Analyzing PE and PB and its UsagesCase III
12345السنة101112.113.3114.64القيمةالدفترية %10%10%10%10%10العائدالمطلوب 22.22.422.6622.928الربحالكلي العادي 11.11.211.3311.464الربح
عادي 11.11.211.3311.464الربحالغير%20%20%20%20%20العائدالمتحقق
11.11.211.3311.464التوزيعالمحجوزة 11.11.211.3311.464األرباح
1112.113.3114.6416.11القيمةالدفترية السوقي 3134.137.5141.2645.39السعر
2.8182.8182.8182.8182.818القيمةالسوقيةالىالقيمةالدفتريةمضاعفالقيمةالدفترية ( 15.515.515.515.515.5القيمةالسوقيةالىالربحية (مضاعفالربحية
ثابتا ولكنهاستمر زادمضاعفالربحيةبسببالنمويبقىمضاعفالقيمةالدفتريةثابتا
أنمضاعفالربحيةبقيثابتا فيالشركةإال بالرغممنالنمو
1-55
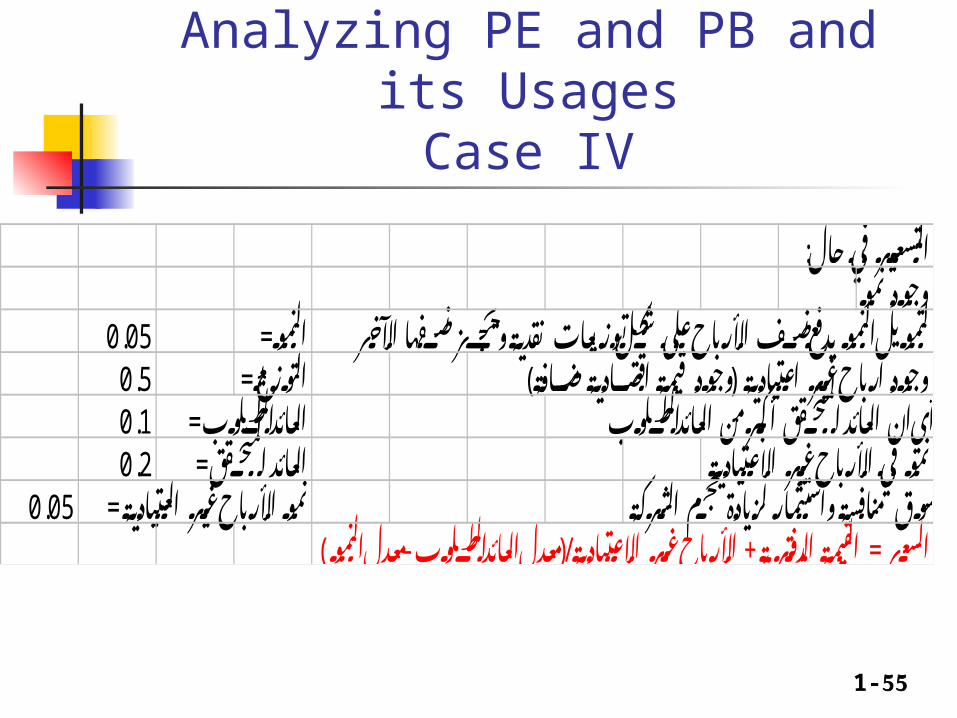
Analyzing PE and PB and its UsagesCase IV
: فيحال التسعيرنمو وجود
اآلخر نصفها علىشكلتوزيعاتنقديةويحجز نصفاألرباح يدفع 0.05النمو=لتمويلالنمو( قيمةاقتصاديةمضافة اعتيادية (وجود غير ارباح 0.5التوزيع=وجود
منالعائدالمطلوب =أيانالعائدالمتحققأكبر 0.1العائدالمطلوب االعتيادية غير فياألرباح =نمو 0.2العائدالمتحقق
لزيادةحجمالشركة العتيادية = سوقمنافسةواستثمار غير األرباح 0.05نمو( -معدلالنمو /(معدلالعائدالمطلوب االعتيادية غير السعر = القيمةالدفترية + األرباح
1-56
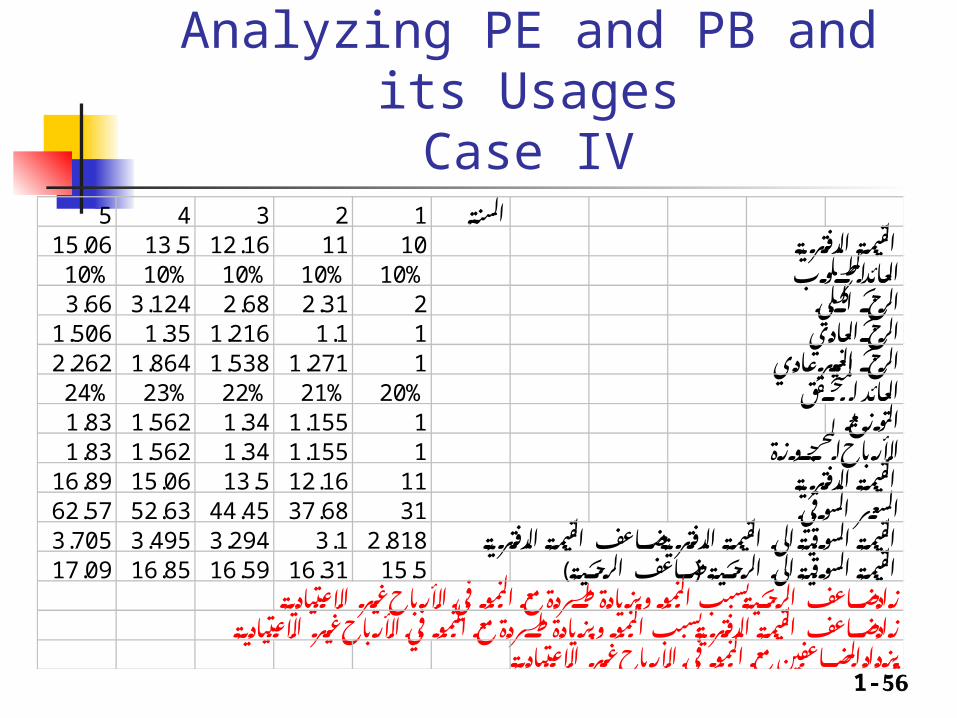
Analyzing PE and PB and its UsagesCase IV
12345السنة101112.1613.515.06القيمةالدفترية %10%10%10%10%10العائدالمطلوب 22.312.683.1243.66الربحالكلي 11.11.2161.351.506الربحالعادي
عادي 11.2711.5381.8642.262الربحالغير%24%23%22%21%20العائدالمتحقق
11.1551.341.5621.83التوزيعالمحجوزة 11.1551.341.5621.83األرباح
1112.1613.515.0616.89القيمةالدفترية السوقي 3137.6844.4552.6362.57السعر
2.8183.13.2943.4953.705القيمةالسوقيةالىالقيمةالدفتريةمضاعفالقيمةالدفترية ( 15.516.3116.5916.8517.09القيمةالسوقيةالىالربحية (مضاعفالربحية
االعتيادية غير فياألرباح النمو وبزيادةمطردةمع زادمضاعفالربحيةبسببالنمواالعتيادية غير فياألرباح النمو وبزيادةمطردةمع زادمضاعفالقيمةالدفتريةبسببالنمو
االعتيادية غير فياالرباح النمو المضاعفينمع يزداد
1-57
Analyzing PE and PB and its Usages
Conclusions Reinvestment of free cash flow at rates of
return in excess of capital costs creates growth in abnormal earnings, resulting in valuation multiple expansion.
The PE is a function of the prospective growth in future abnormal earnings.
Usages of PE in any other case will result in mispricing and arbitrage opportunities.
This huge limitation should be considered among many other ones.
1-58
Analyzing PE and PB and its Usages
Conclusions
Which PE to use the historical average of the same firm’s PE’s, OR
The PE of similar firms, OR The PE of the industry How are PE’s used for companies
that have more than one division
1-59
Analyzing PE and PB and its Usages
Conclusions PE does take risk into account indirectly (i.e.
through the used pricing model’s discount rate). PE gives the dollar amount (Price) the investor
is willing to pay for one dollar of continued earnings. PE is the reciprocal of the required rate if return. Empirical studies show that the required rate of return (calculated using other return models like the market model or CAPM) is usually different from the one calculated by PE ratios.
Only sustainable earnings are used, transitory or non recurring earnings must be excluded.
1-60
Analyzing PE and PB and its Usages
Recommendations
Use PE ratios with maximum caution
Know when it is used and what it means
PB is also problematic some times, it is used when there are abnormal returns regardless whether they grow or not.

1-61
Tools of Financial Analysis See you all in December