Embed Size (px)
Citation preview

11
Compiled by TNS Business IntelligenceOctober 2010
Consumer Sector FactBook
2
Table of Contents
Overall Fast Moving Consumer Goods (FMCG) Market 3
Food Market 21
Market for Alcoholic Beverages 44
Market for Non-Alcoholic Beverages 67
Tobacco Market 90
Personal Care Market 112
Household Care Market 135
Pet Care Market 158
33
Overall FMCG Market
4
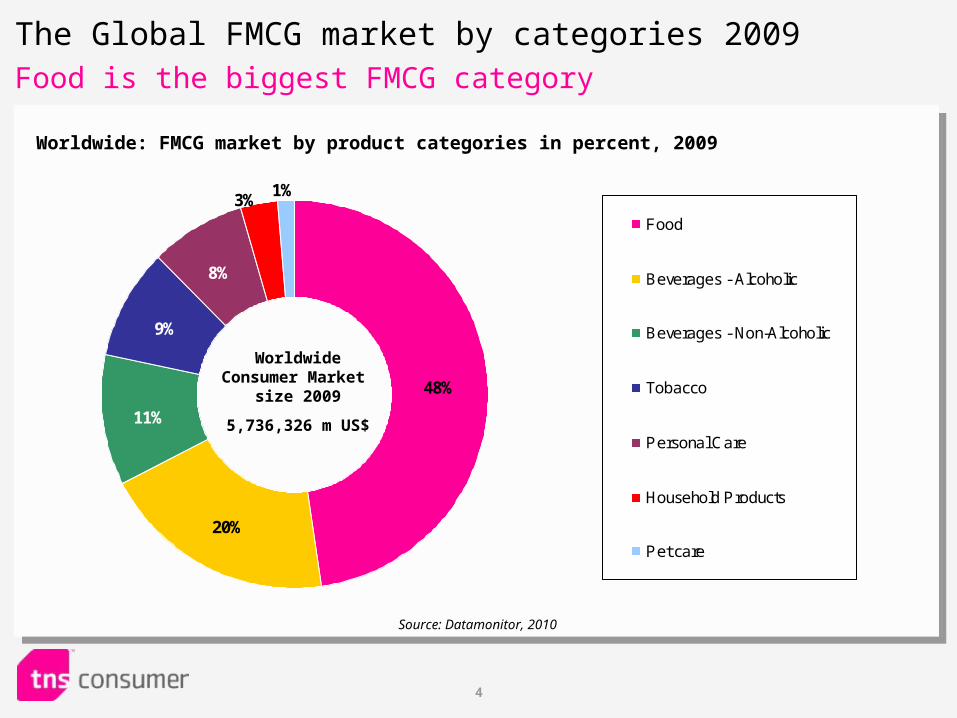
48%
20%
11%
9%
8%
1%3%
Food
Beverages - Alcoholic
Beverages - Non-Alcoholic
Tobacco
Personal Care
Household Products
Pet care
The Global FMCG market by categories 2009Food is the biggest FMCG category
Worldwide: FMCG market by product categories in percent, 2009
Worldwide Consumer Market
size 2009
5,736,326 m US$
Source: Datamonitor, 2010
5
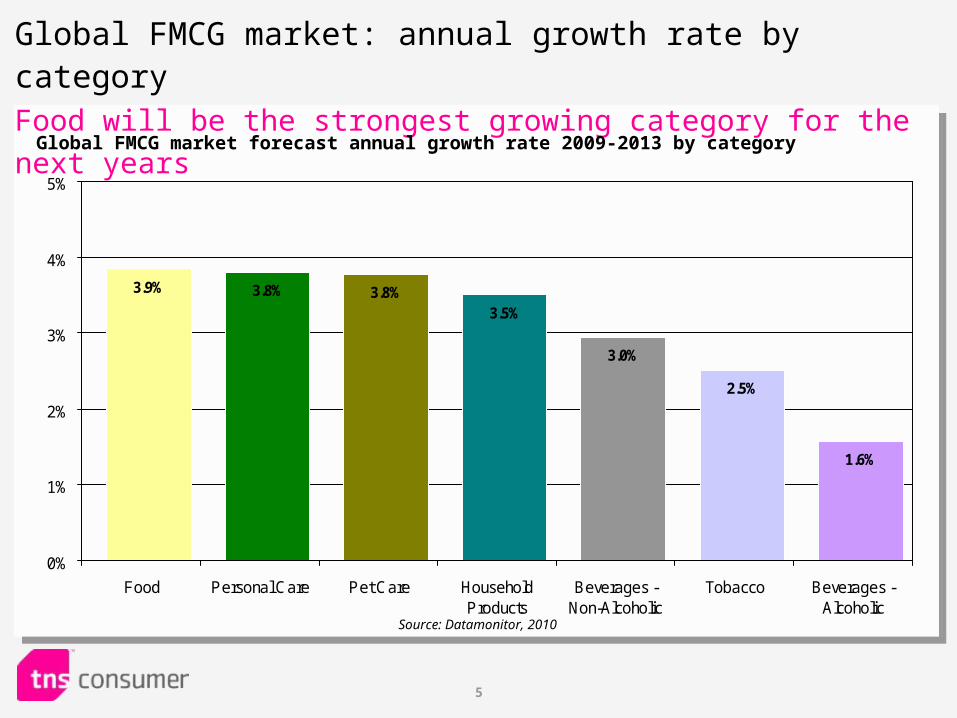
Global FMCG market: annual growth rate by categoryFood will be the strongest growing category for the next years
2.5%
1.6%
3.0%
3.5%3.8%3.8%3.9%
0%
1%
2%
3%
4%
5%
Food Personal Care Pet Care HouseholdProducts
Beverages -Non-Alcoholic
Tobacco Beverages -Alcoholic
Global FMCG market forecast annual growth rate 2009-2013 by category
Source: Datamonitor, 2010
6
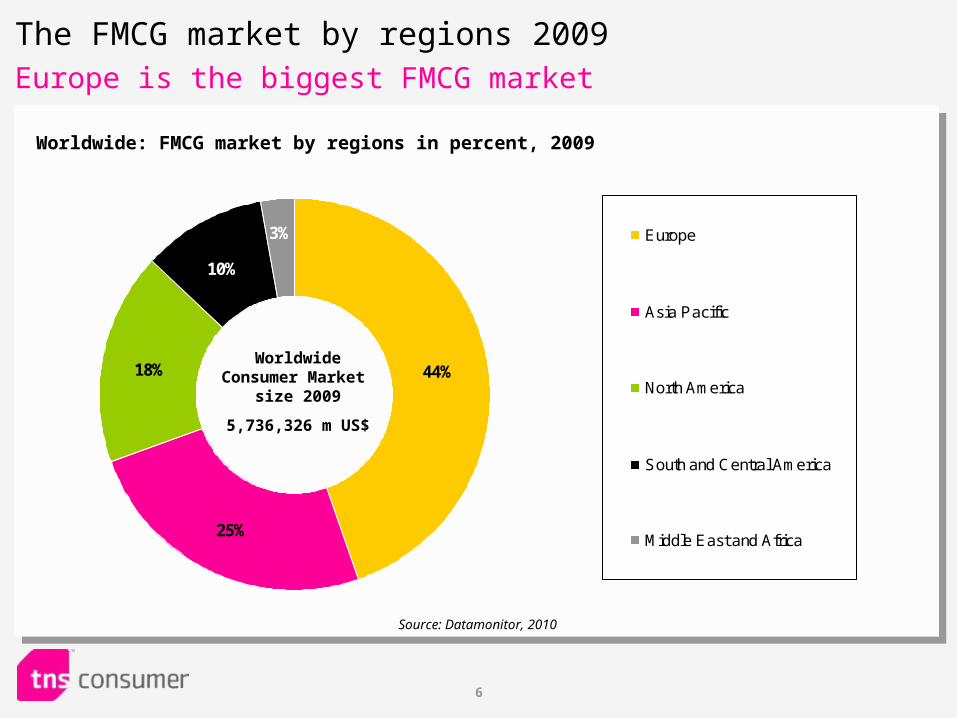
44%
25%
18%
3%
10%
Europe
Asia Pacific
North America
South and Central America
Middle East and Africa
The FMCG market by regions 2009Europe is the biggest FMCG market
Worldwide: FMCG market by regions in percent, 2009
Source: Datamonitor, 2010
Worldwide Consumer Market
size 2009
5,736,326 m US$
7
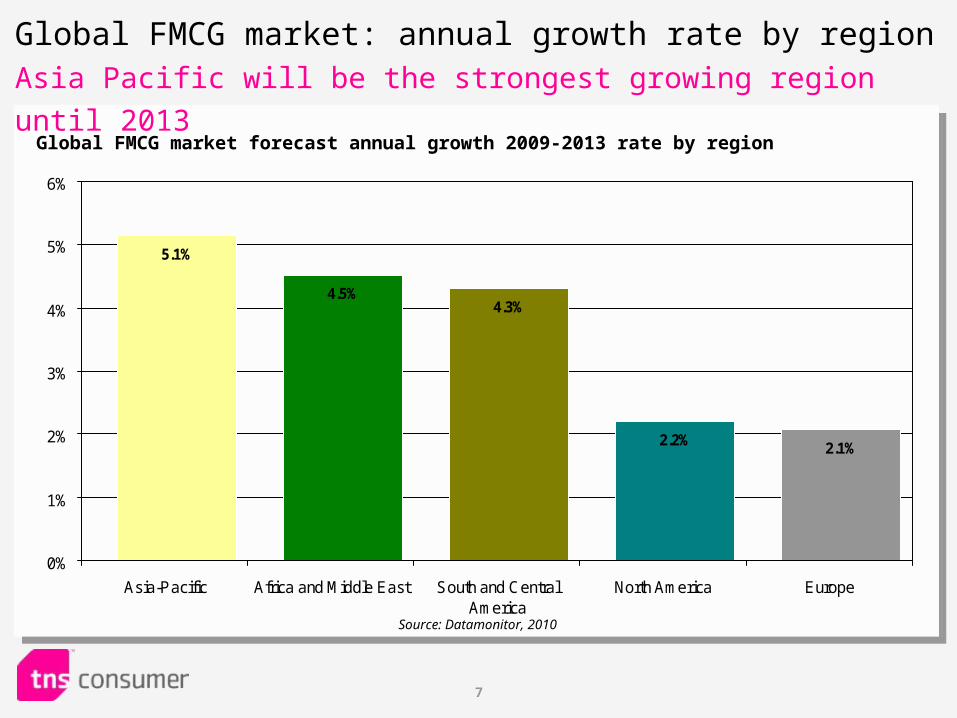
Global FMCG market: annual growth rate by regionAsia Pacific will be the strongest growing region until 2013
5.1%
4.5%4.3%
2.2% 2.1%
0%
1%
2%
3%
4%
5%
6%
Asia-Pacific Africa and Middle East South and CentralAmerica
North America Europe
Global FMCG market forecast annual growth 2009-2013 rate by region
Source: Datamonitor, 2010
8
Source: Datamonitor, 2010
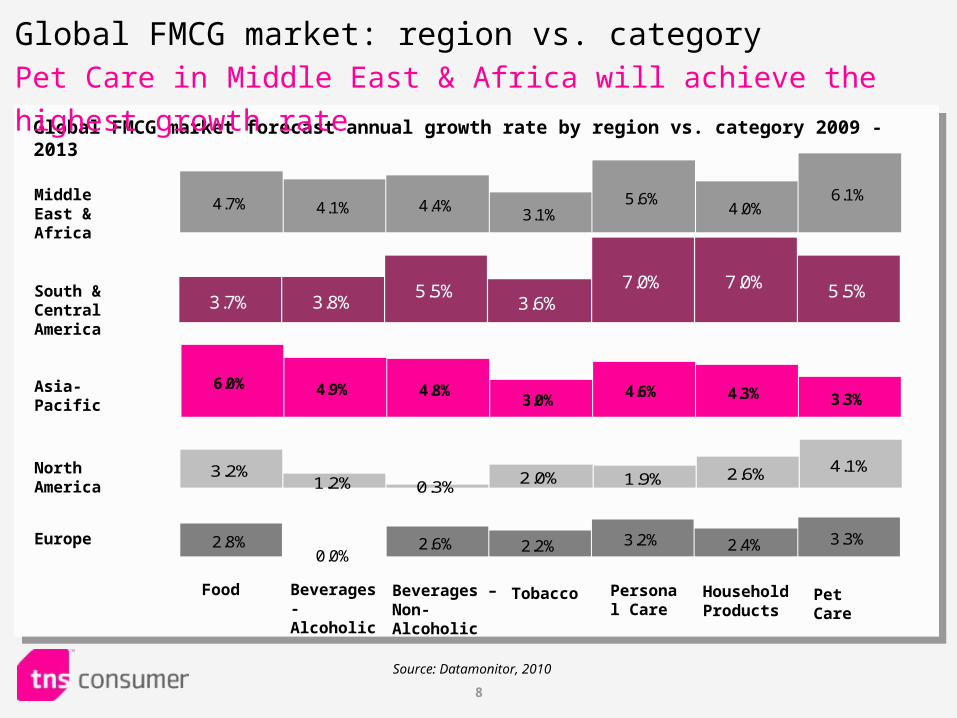
Middle East & Africa
South & Central America
Asia-Pacific
North America
Europe
Food Beverages - Alcoholic
Beverages – Non-Alcoholic
Tobacco Personal Care
Household Products
Pet Care
Global FMCG market forecast annual growth rate by region vs. category 2009 - 2013
Global FMCG market: region vs. category Pet Care in Middle East & Africa will achieve the highest growth rate
4.7% 4.1% 4.4%3.1%
5.6%4.0%
6.1%
3.7% 3.8% 3.6%7.0% 7.0% 5.5%5.5%
6.0% 4.9% 4.8%3.0%
4.6% 4.3% 3.3%
3.2%1.2% 2.0% 1.9% 2.6% 4.1%
0.3%
2.8%0.0%
2.6% 2.2% 3.2% 2.4% 3.3%
9
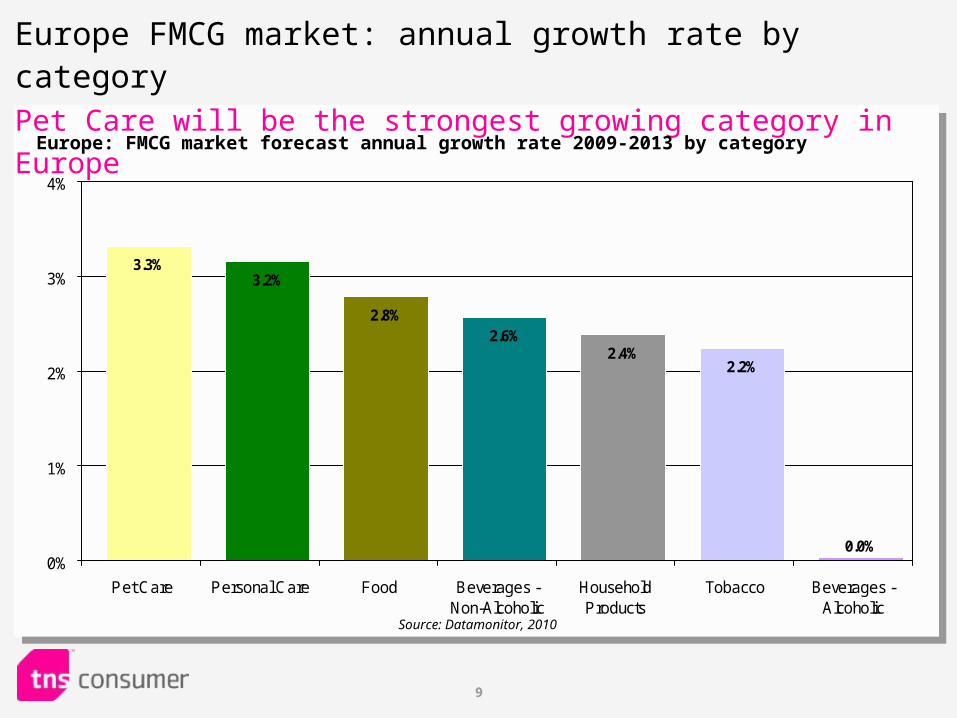
Europe FMCG market: annual growth rate by categoryPet Care will be the strongest growing category in Europe
2.2%
0.0%
2.4%2.6%
2.8%
3.2%3.3%
0%
1%
2%
3%
4%
Pet Care Personal Care Food Beverages -Non-Alcoholic
HouseholdProducts
Tobacco Beverages -Alcoholic
Europe: FMCG market forecast annual growth rate 2009-2013 by category
Source: Datamonitor, 2010
10
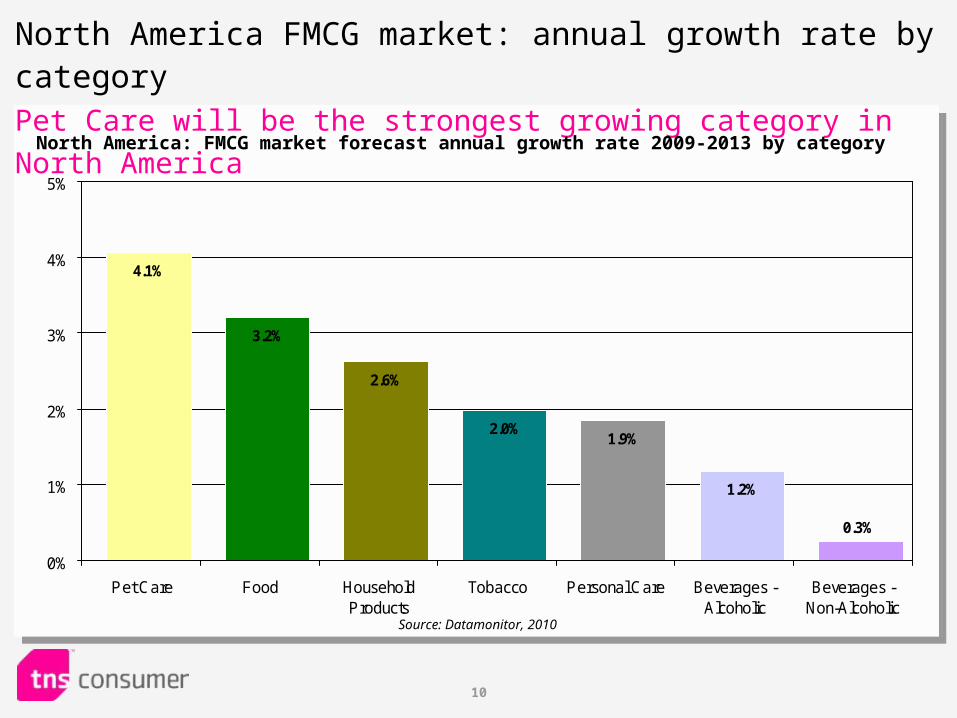
North America FMCG market: annual growth rate by categoryPet Care will be the strongest growing category in North America
1.2%
0.3%
1.9%2.0%
2.6%
3.2%
4.1%
0%
1%
2%
3%
4%
5%
Pet Care Food HouseholdProducts
Tobacco Personal Care Beverages -Alcoholic
Beverages -Non-Alcoholic
North America: FMCG market forecast annual growth rate 2009-2013 by category
Source: Datamonitor, 2010
11
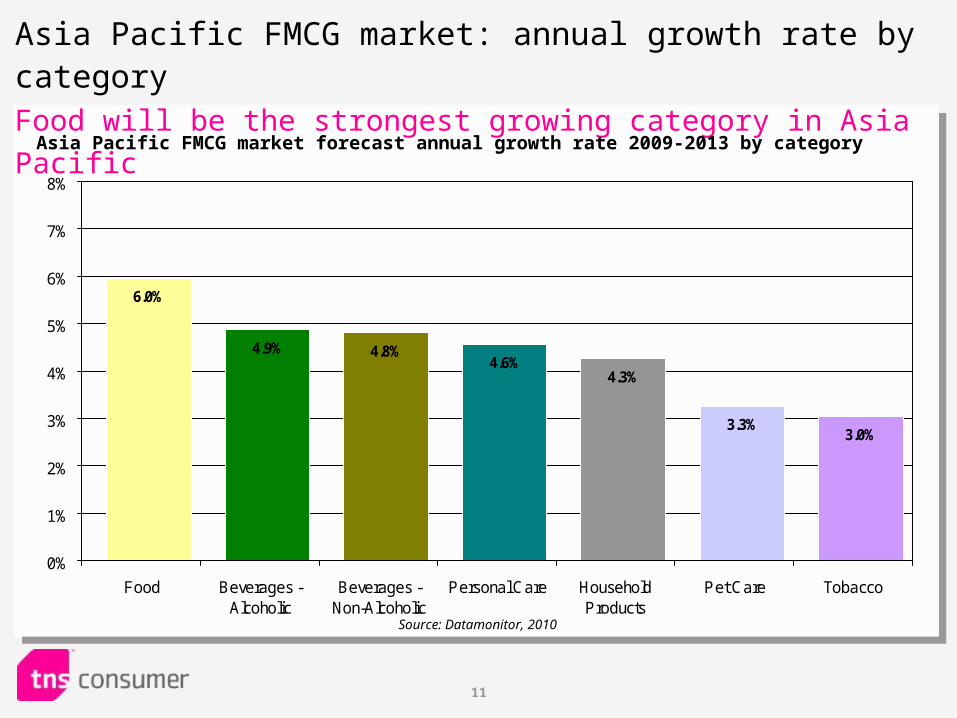
Asia Pacific FMCG market: annual growth rate by categoryFood will be the strongest growing category in Asia Pacific
3.3%3.0%
4.3%4.6%
4.8%4.9%
6.0%
0%
1%
2%
3%
4%
5%
6%
7%
8%
Food Beverages -Alcoholic
Beverages -Non-Alcoholic
Personal Care HouseholdProducts
Pet Care Tobacco
Asia Pacific FMCG market forecast annual growth rate 2009-2013 by category
Source: Datamonitor, 2010
12
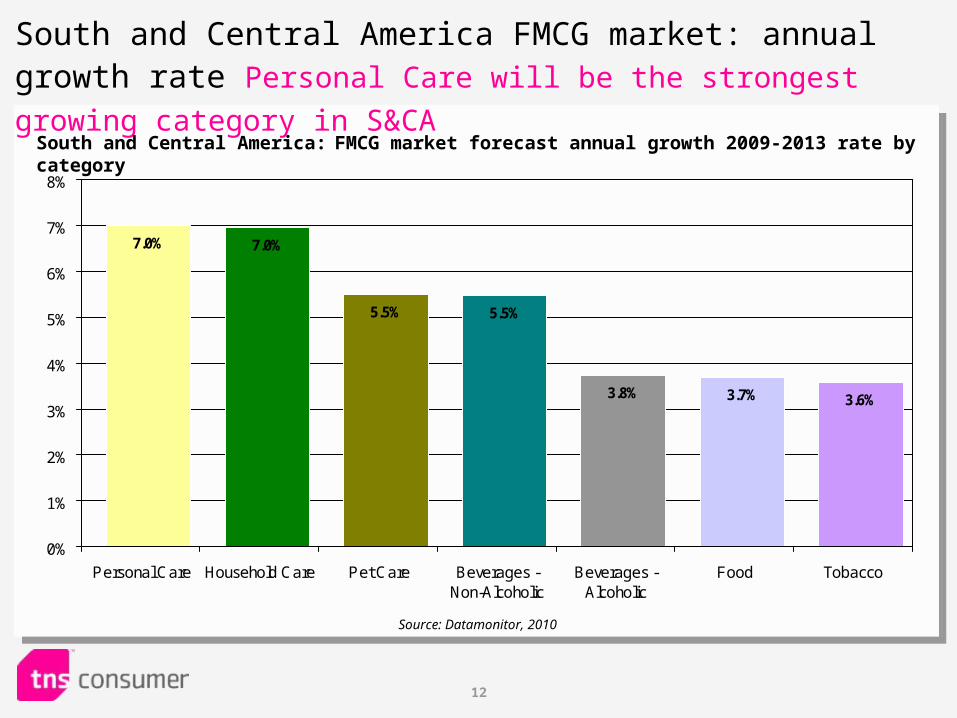
South and Central America FMCG market: annual growth rate Personal Care will be the strongest growing category in S&CA
7.0% 7.0%
5.5% 5.5%
3.8% 3.6%3.7%
0%
1%
2%
3%
4%
5%
6%
7%
8%
Personal Care Household Care Pet Care Beverages -Non-Alcoholic
Beverages -Alcoholic
Food Tobacco
South and Central America: FMCG market forecast annual growth 2009-2013 rate by category
Source: Datamonitor, 2010
13
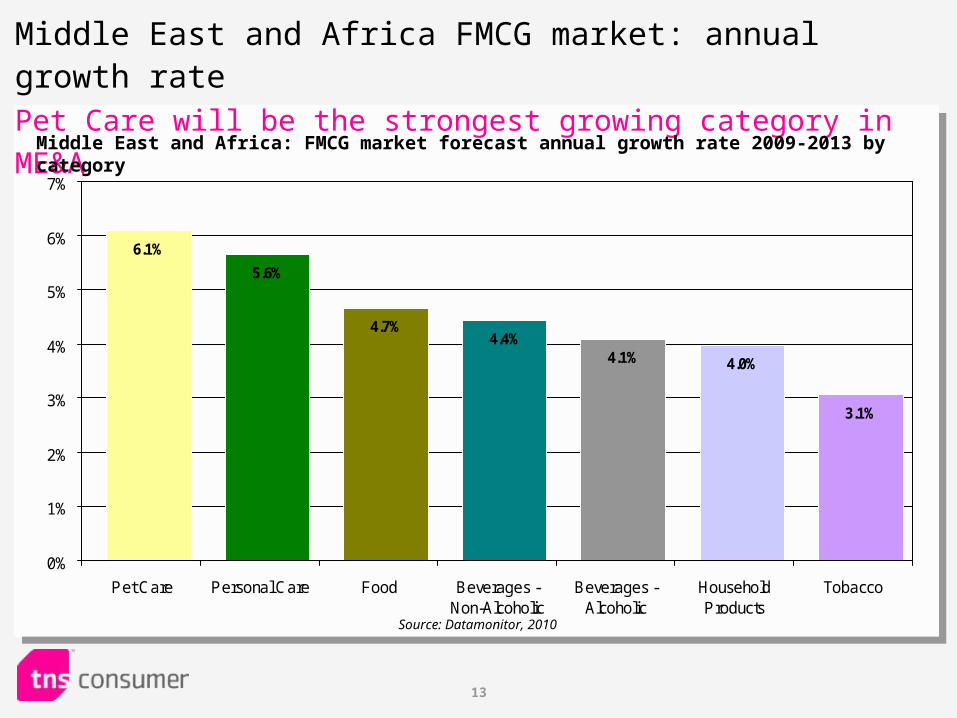
Middle East and Africa FMCG market: annual growth rate Pet Care will be the strongest growing category in ME&A
4.0%
3.1%
4.1%4.4%
4.7%
5.6%
6.1%
0%
1%
2%
3%
4%
5%
6%
7%
Pet Care Personal Care Food Beverages -Non-Alcoholic
Beverages -Alcoholic
HouseholdProducts
Tobacco
Middle East and Africa: FMCG market forecast annual growth rate 2009-2013 by category
Source: Datamonitor, 2010
14
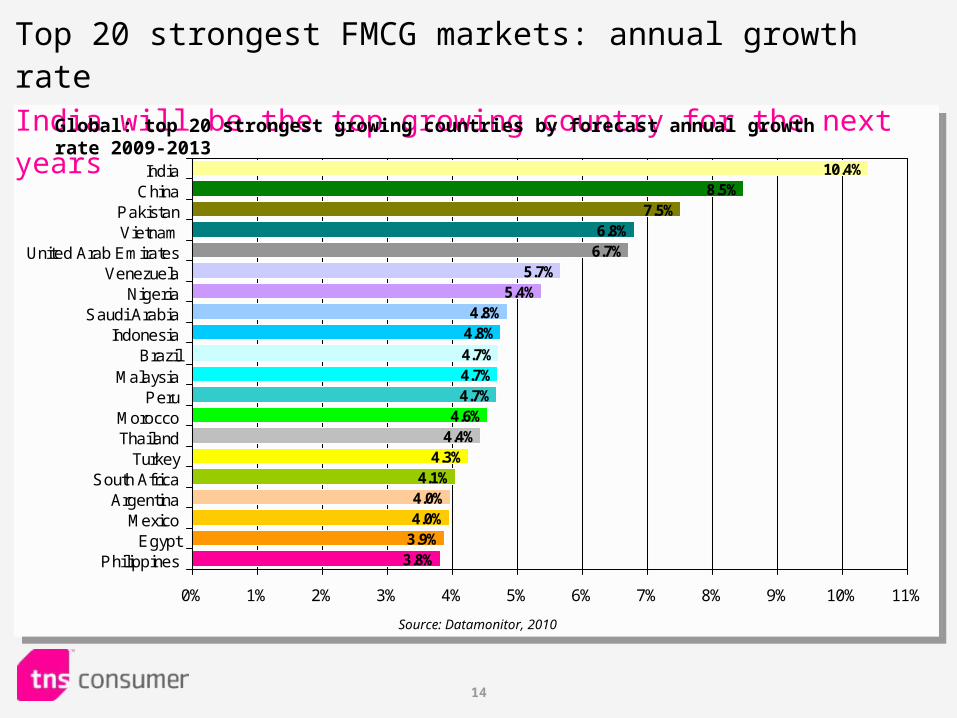
Top 20 strongest FMCG markets: annual growth rateIndia will be the top growing country for the next years
5.7%5.4%
4.8%4.8%
4.7%4.7%4.7%
4.6%4.4%
4.3%4.1%
4.0%
3.8%
4.0%3.9%
6.7%6.8%
7.5%8.5%
10.4%
0% 1% 2% 3% 4% 5% 6% 7% 8% 9% 10% 11%
IndiaChina
PakistanVietnam
United Arab EmiratesVenezuela
NigeriaSaudi Arabia
IndonesiaBrazil
MalaysiaPeru
MoroccoThailand
TurkeySouth Africa
ArgentinaMexico
EgyptPhilippines
Global: top 20 strongest growing countries by forecast annual growth rate 2009-2013
Source: Datamonitor, 2010
15
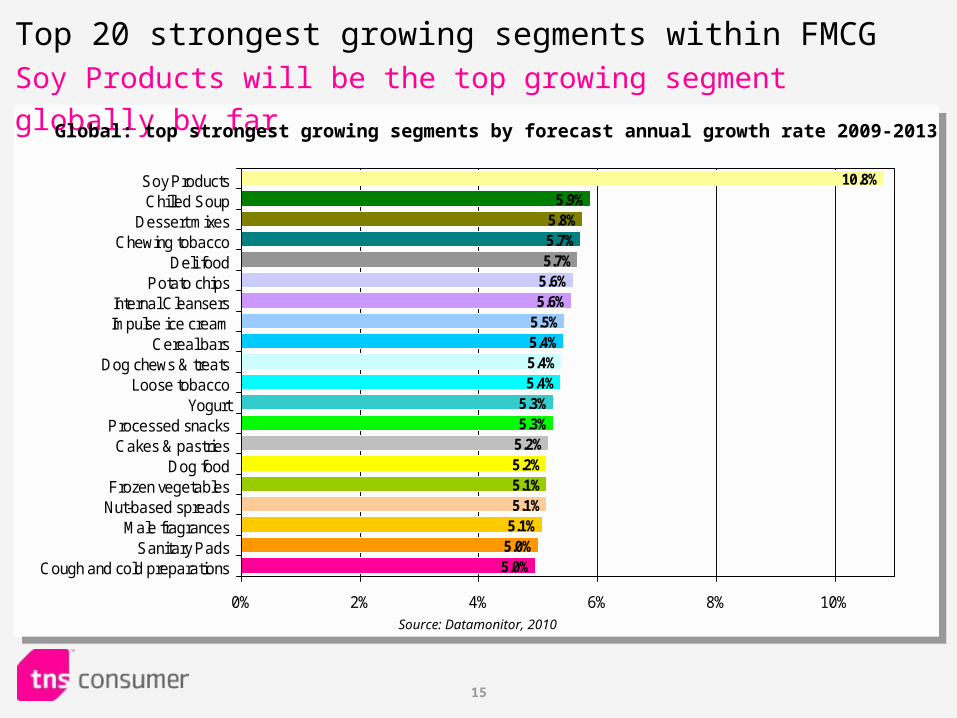
Top 20 strongest growing segments within FMCG Soy Products will be the top growing segment globally by far
10.8%5.9%
5.8%5.7%5.7%
5.0%5.1%
5.0%
5.1%5.1%5.2%5.2%5.3%5.3%5.4%5.4%5.4%5.5%5.6%5.6%
0% 2% 4% 6% 8% 10%
Soy ProductsChilled Soup
Dessert mixesChewing tobacco
Deli foodPotato chips
Internal CleansersImpulse ice cream
Cereal barsDog chews & treats
Loose tobaccoYogurt
Processed snacksCakes & pastries
Dog foodFrozen vegetables
Nut-based spreadsMale fragrances
Sanitary PadsCough and cold preparations
Global: top strongest growing segments by forecast annual growth rate 2009-2013
Source: Datamonitor, 2010
16
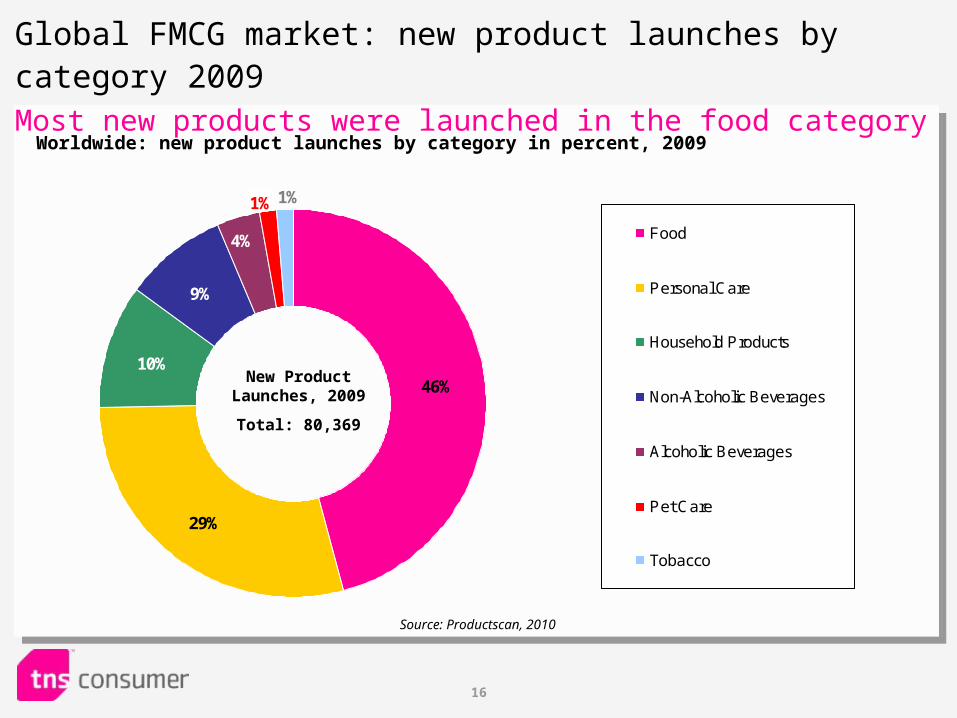
46%
29%
10%
9%
4%
1%1%
Food
Personal Care
Household Products
Non-Alcoholic Beverages
Alcoholic Beverages
Pet Care
Tobacco
Global FMCG market: new product launches by category 2009Most new products were launched in the food category
Worldwide: new product launches by category in percent, 2009
New Product Launches, 2009
Total: 80,369
Source: Productscan, 2010
17
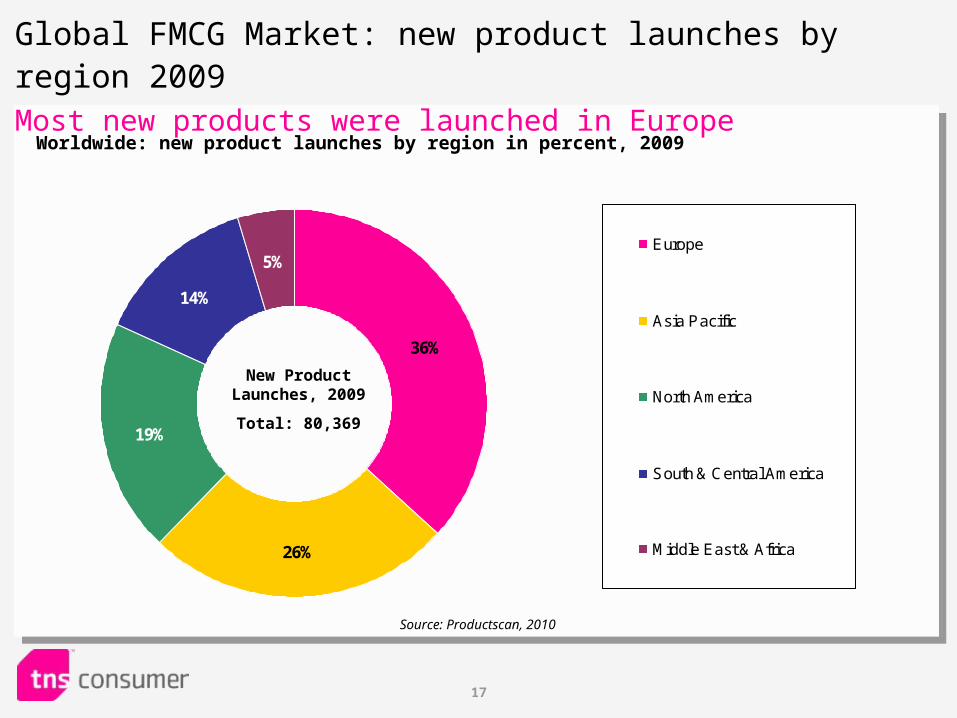
36%
26%
19%
14%
5%Europe
Asia Pacific
North America
South & Central America
Middle East & Africa
Global FMCG Market: new product launches by region 2009Most new products were launched in Europe
Worldwide: new product launches by region in percent, 2009
Source: Productscan, 2010
New Product Launches, 2009
Total: 80,369
18
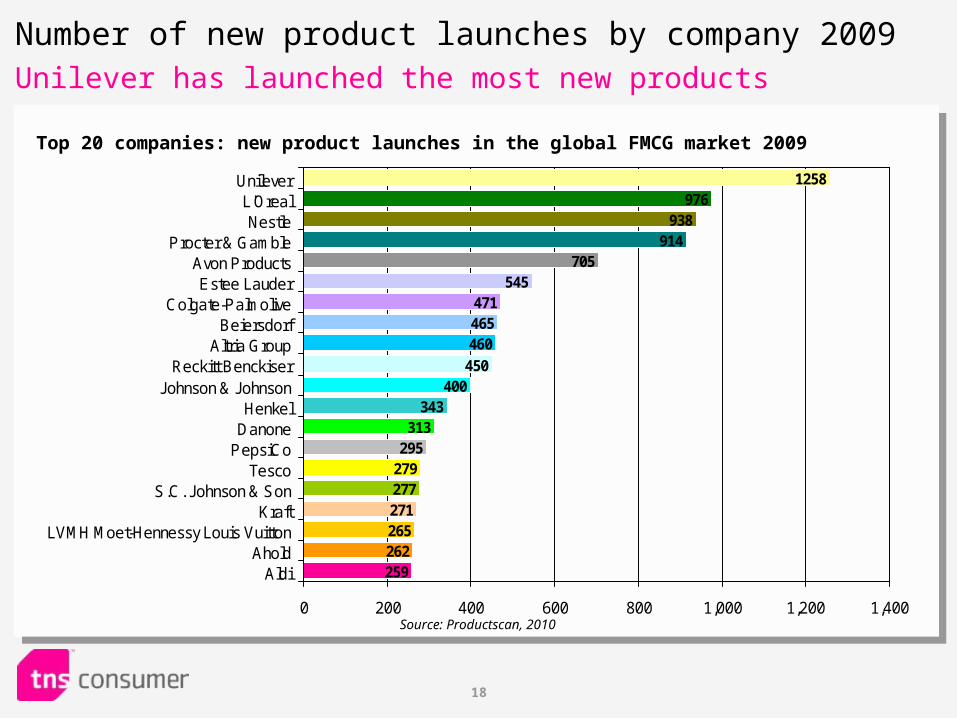
Number of new product launches by company 2009Unilever has launched the most new products
545471465460
450400
343313
295279277271
259
265262
705914
938976
1258
0 200 400 600 800 1,000 1,200 1,400
UnileverL'OrealNestle
Procter & GambleAvon ProductsEstee Lauder
Colgate-PalmoliveBeiersdorf
Altria GroupReckitt Benckiser
Johnson & JohnsonHenkel
DanonePepsiCo
TescoS.C. Johnson & Son
KraftLVMH Moet-Hennessy Louis Vuitton
AholdAldi
Top 20 companies: new product launches in the global FMCG market 2009
Source: Productscan, 2010
19
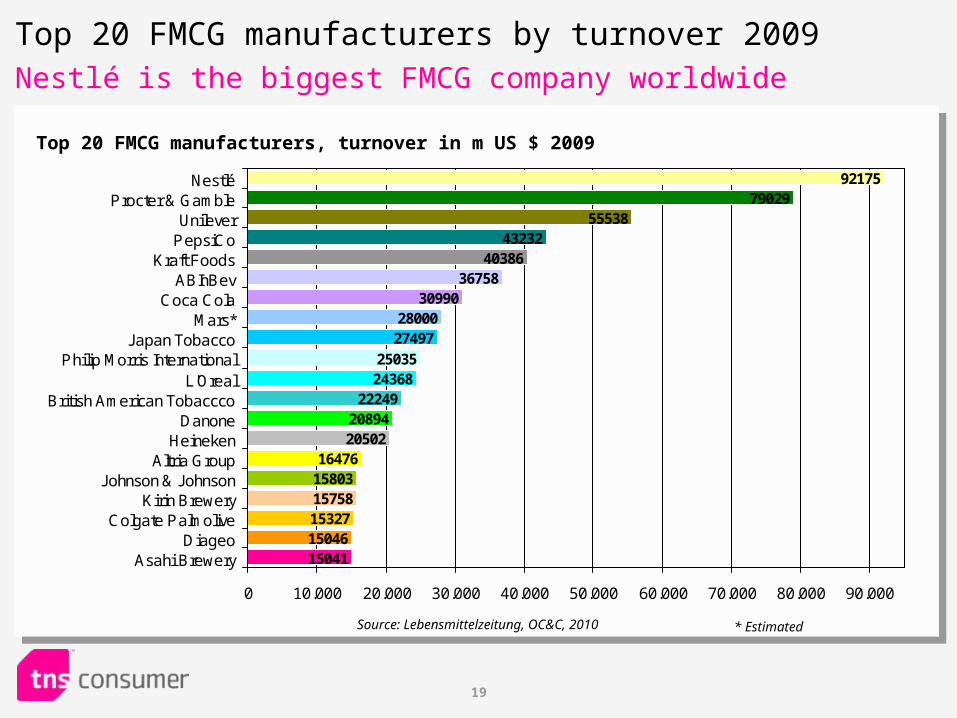
3675830990
2800027497
2503524368
222492089420502
164761580315758
15041
1532715046
4038643232
5553879029
92175
0 10.000 20.000 30.000 40.000 50.000 60.000 70.000 80.000 90.000
NestléProcter & Gamble
UnileverPepsiCo
Kraft FoodsABInBev
Coca ColaMars*
Japan TobaccoPhilip Morris International
L'OrealBritish American Tobaccco
DanoneHeineken
Altria GroupJohnson & Johnson
Kirin BreweryColgate Palmolive
DiageoAsahi Brewery
Top 20 FMCG manufacturers by turnover 2009Nestlé is the biggest FMCG company worldwide
Top 20 FMCG manufacturers, turnover in m US $ 2009
Source: Lebensmittelzeitung, OC&C, 2010 * Estimated
20
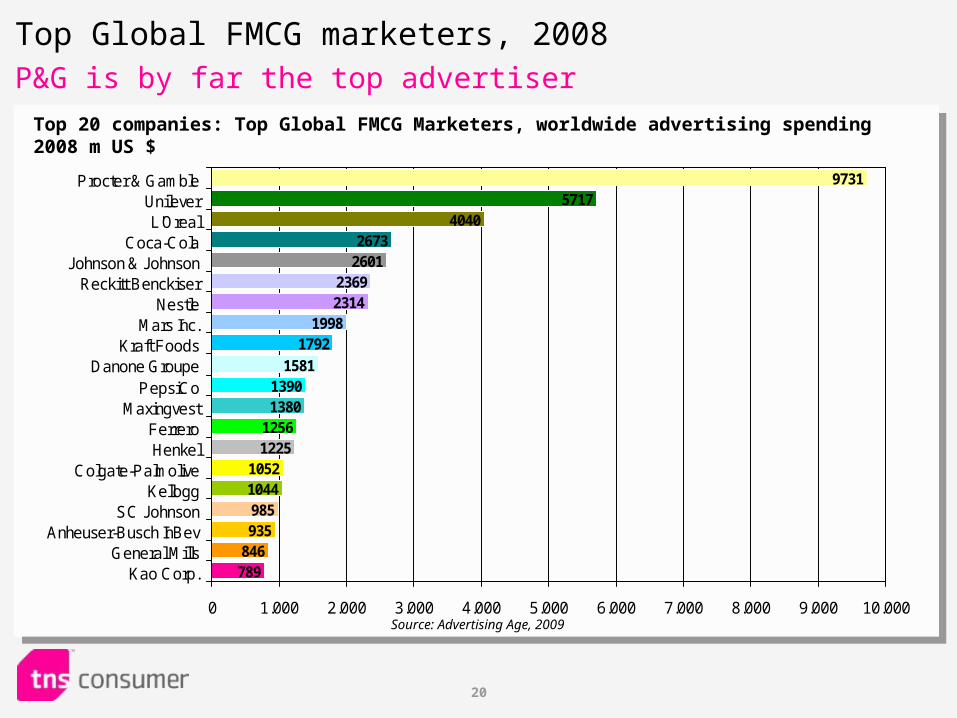
Top Global FMCG marketers, 2008P&G is by far the top advertiser
97315717
40402673
260123692314
19981792
158113901380
12561225
10521044985935
846789
0 1.000 2.000 3.000 4.000 5.000 6.000 7.000 8.000 9.000 10.000
Procter & GambleUnileverL'Oreal
Coca-ColaJohnson & Johnson
Reckitt BenckiserNestle
Mars Inc.Kraft Foods
Danone GroupePepsiCo
MaxingvestFerreroHenkel
Colgate-PalmoliveKellogg
SC JohnsonAnheuser-Busch InBev
General MillsKao Corp.
Top 20 companies: Top Global FMCG Marketers, worldwide advertising spending 2008 m US $
Source: Advertising Age, 2009

21
Food Market
22
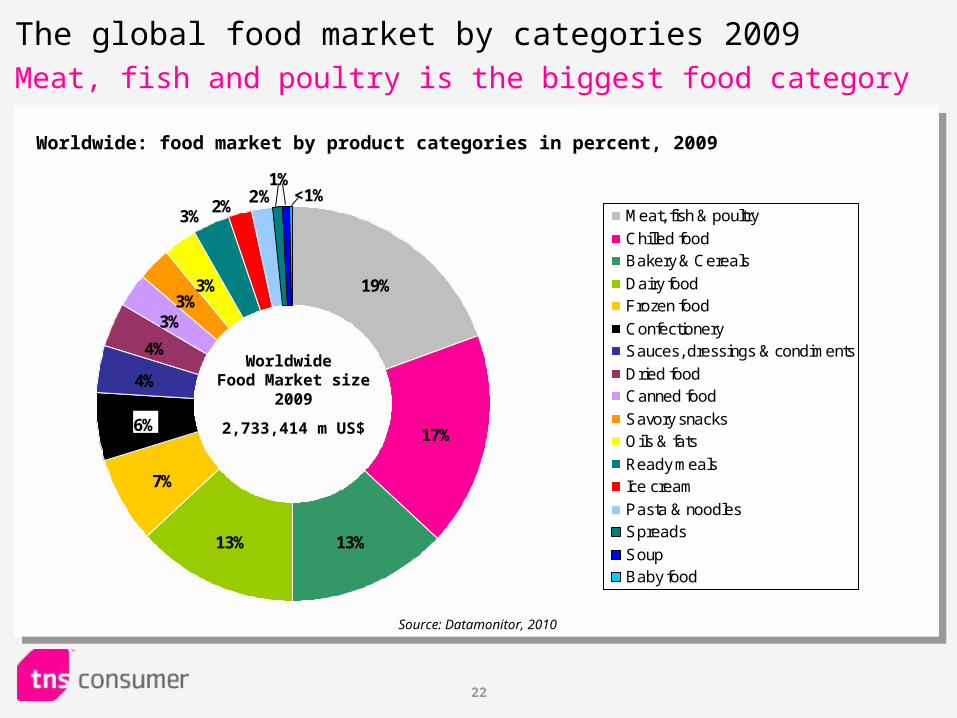
19%
17%
13%13%
7%
6%
4%
4%
3%3%
3%
1%<1%
3%2%
Meat, fish & poultry
Chilled foodBakery & Cereals
Dairy foodFrozen food
ConfectionerySauces, dressings & condiments
Dried foodCanned food
Savory snacksOils & fats
Ready mealsIce cream
Pasta & noodlesSpreads
SoupBaby food
The global food market by categories 2009Meat, fish and poultry is the biggest food category
Worldwide: food market by product categories in percent, 2009
Worldwide Food Market size
2009
2,733,414 m US$
Source: Datamonitor, 2010
2%
23
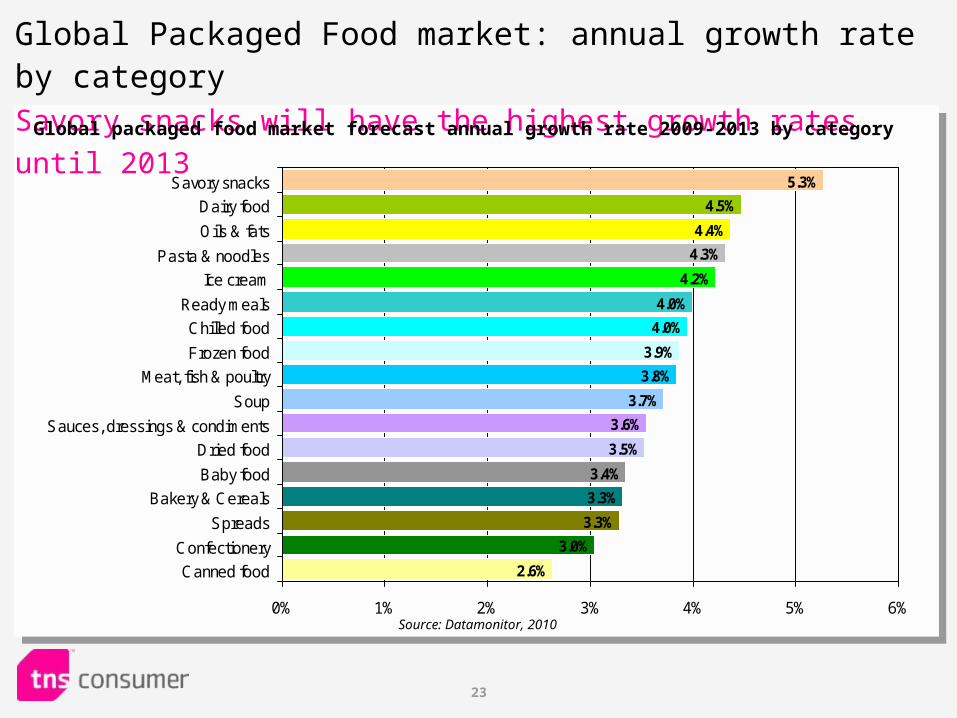
Global Packaged Food market: annual growth rate by categorySavory snacks will have the highest growth rates until 2013
3.5%
3.6%
3.7%
3.8%
3.9%
4.0%
4.0%
4.2%
4.3%
4.4%
4.5%
5.3%
3.4%
3.3%
3.3%
3.0%
2.6%
0% 1% 2% 3% 4% 5% 6%
Canned food
Confectionery
Spreads
Bakery & Cereals
Baby food
Dried food
Sauces, dressings & condiments
Soup
Meat, fish & poultry
Frozen food
Chilled food
Ready meals
Ice cream
Pasta & noodles
Oils & fats
Dairy food
Savory snacks
Global packaged food market forecast annual growth rate 2009-2013 by category
Source: Datamonitor, 2010
24
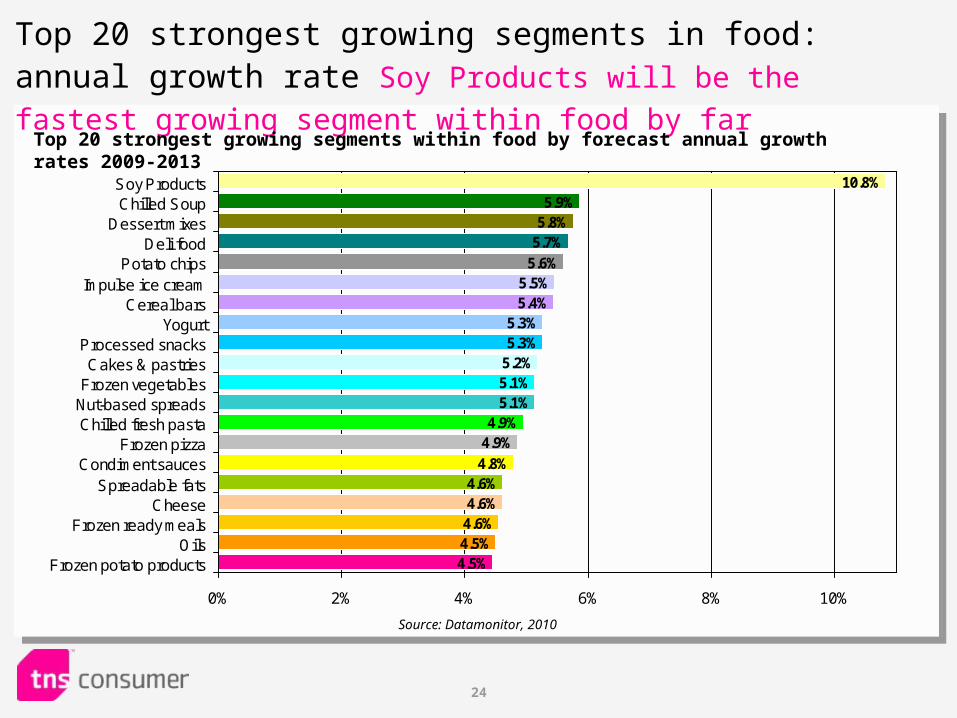
Top 20 strongest growing segments in food: annual growth rate Soy Products will be the fastest growing segment within food by far
5.5%5.4%
5.3%5.3%
5.2%5.1%5.1%
4.9%4.9%4.8%
4.6%4.6%
4.5%
4.6%4.5%
5.6%5.7%5.8%5.9%
10.8%
0% 2% 4% 6% 8% 10%
Soy ProductsChilled Soup
Dessert mixesDeli food
Potato chipsImpulse ice cream
Cereal barsYogurt
Processed snacksCakes & pastries
Frozen vegetablesNut-based spreadsChilled fresh pasta
Frozen pizzaCondiment sauces
Spreadable fatsCheese
Frozen ready mealsOils
Frozen potato products
Top 20 strongest growing segments within food by forecast annual growth rates 2009-2013
Source: Datamonitor, 2010
25
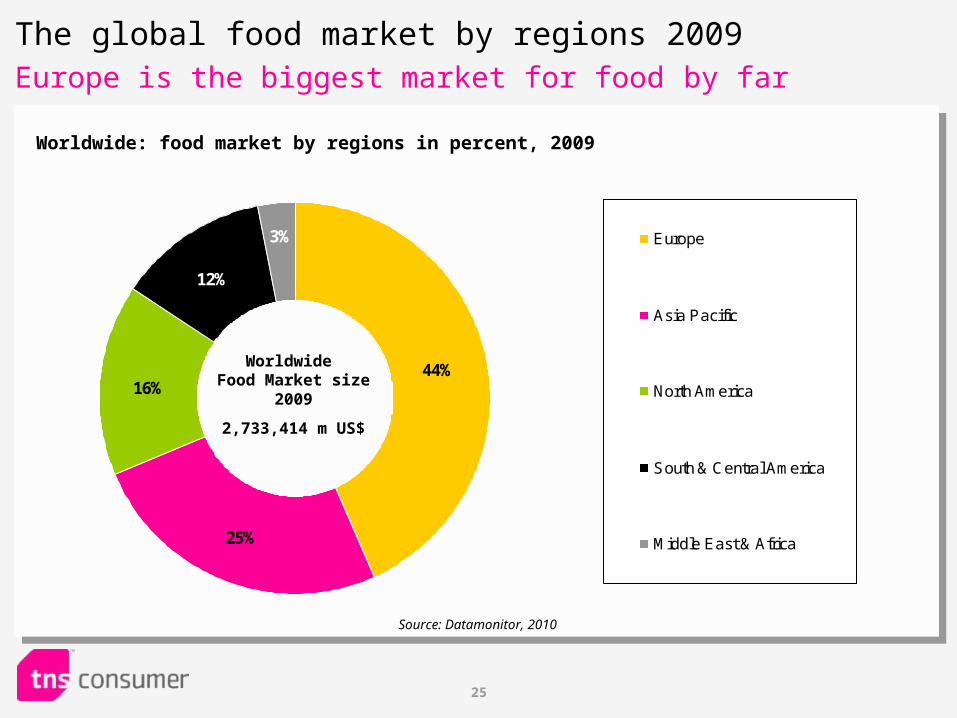
44%
25%
16%
3%
12%
Europe
Asia Pacific
North America
South & Central America
Middle East & Africa
The global food market by regions 2009Europe is the biggest market for food by far
Worldwide: food market by regions in percent, 2009
Source: Datamonitor, 2010
Worldwide Food Market size
2009
2,733,414 m US$
26
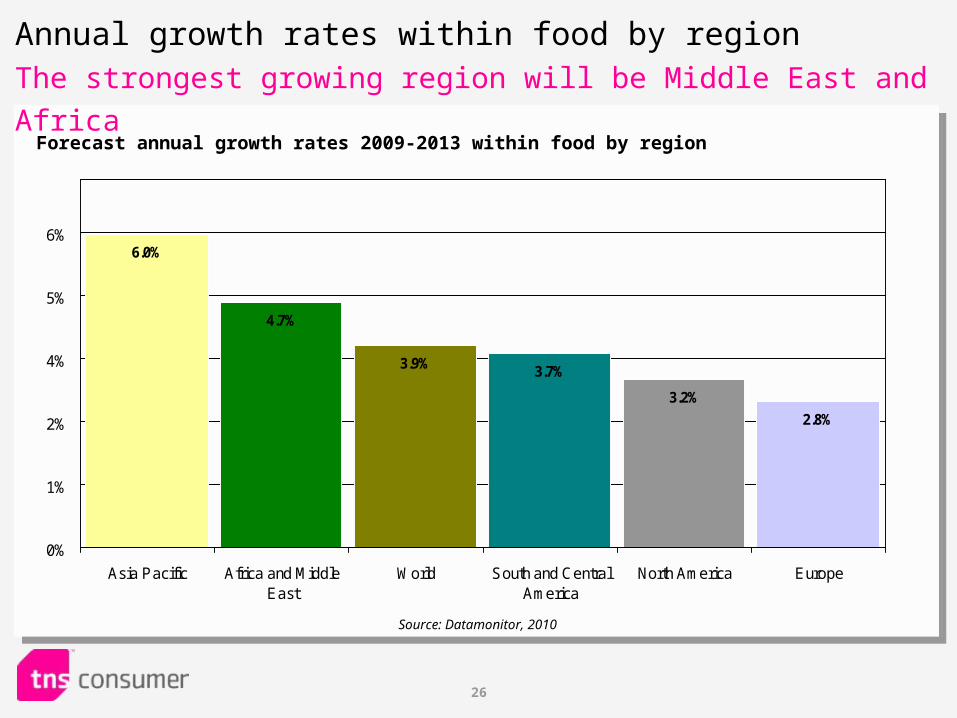
Annual growth rates within food by region The strongest growing region will be Middle East and Africa
2.8%
3.2%
3.7%3.9%
4.7%
6.0%
0%
1%
2%
4%
5%
6%
Asia Pacific Africa and MiddleEast
World South and CentralAmerica
North America Europe
Forecast annual growth rates 2009-2013 within food by region
Source: Datamonitor, 2010
27
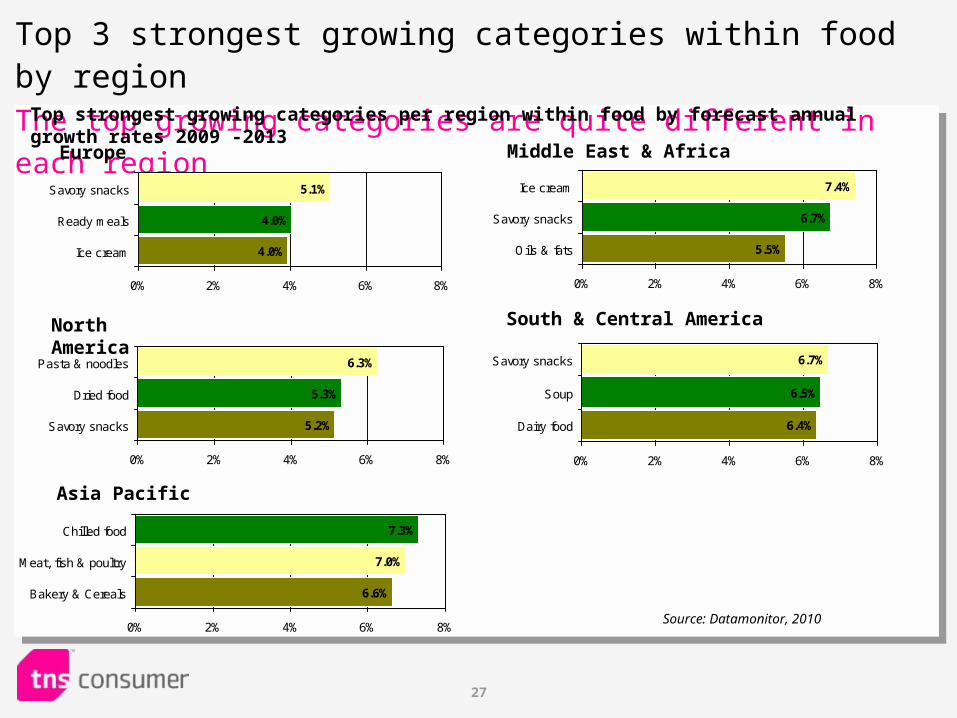
Top 3 strongest growing categories within food by region The top growing categories are quite different in each region
4.0%
4.0%
5.1%
0% 2% 4% 6% 8%
Savory snacks
Ready meals
Ice cream
Top strongest growing categories per region within food by forecast annual growth rates 2009 -2013
Source: Datamonitor, 2010
5.2%
5.3%
6.3%
0% 2% 4% 6% 8%
Pasta & noodles
Dried food
Savory snacks
6.6%
7.0%
7.3%
0% 2% 4% 6% 8%
Chilled food
Meat, fish & poultry
Bakery & Cereals
Europe
North America
Asia Pacific
5.5%
6.7%
7.4%
0% 2% 4% 6% 8%
Ice cream
Savory snacks
Oils & fats
South & Central America
6.4%
6.5%
6.7%
0% 2% 4% 6% 8%
Savory snacks
Soup
Dairy food
Middle East & Africa
28
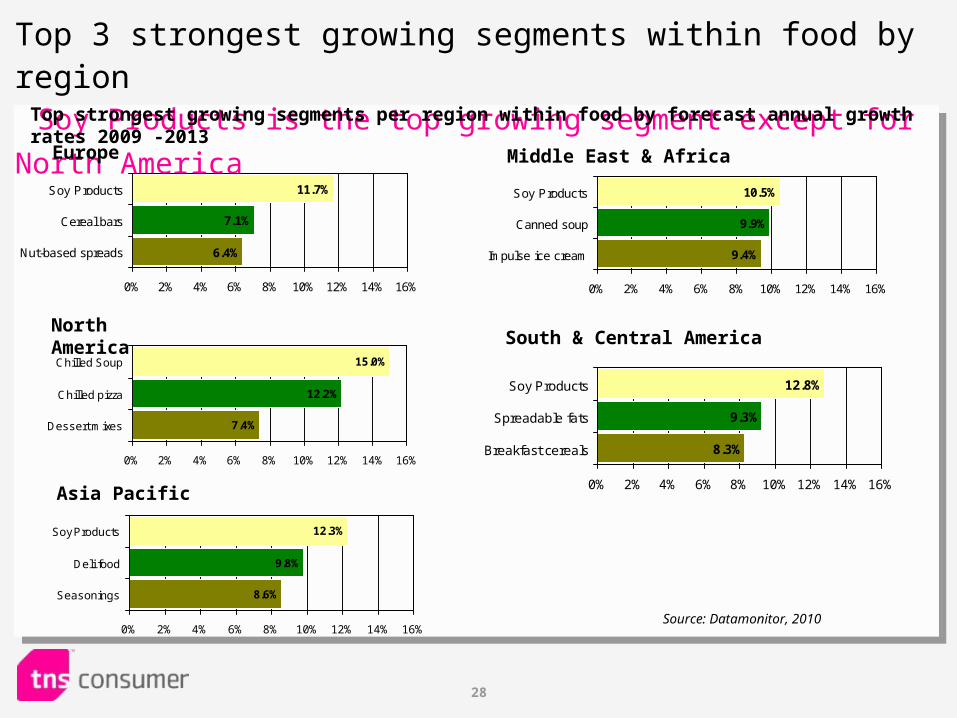
Top 3 strongest growing segments within food by region Soy Products is the top growing segment except for North America
6.4%
7.1%
11.7%
0% 2% 4% 6% 8% 10% 12% 14% 16%
Soy Products
Cereal bars
Nut-based spreads
Top strongest growing segments per region within food by forecast annual growth rates 2009 -2013
Source: Datamonitor, 2010
7.4%
12.2%
15.0%
0% 2% 4% 6% 8% 10% 12% 14% 16%
Chilled Soup
Chilled pizza
Dessert mixes
8.6%
9.8%
12.3%
0% 2% 4% 6% 8% 10% 12% 14% 16%
Soy Products
Deli food
Seasonings
Europe
North America
Asia Pacific
9.4%
9.9%
10.5%
0% 2% 4% 6% 8% 10% 12% 14% 16%
Soy Products
Canned soup
Impulse ice cream
South & Central America
8.3%
9.3%
12.8%
0% 2% 4% 6% 8% 10% 12% 14% 16%
Soy Products
Spreadable fats
Breakfast cereals
Middle East & Africa
29
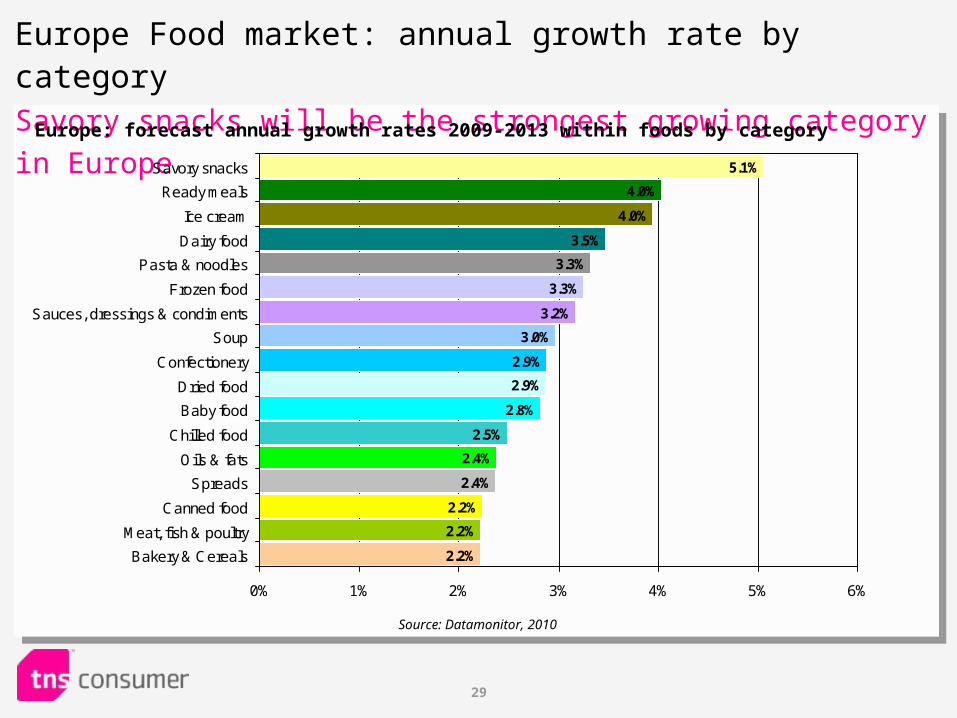
Europe Food market: annual growth rate by categorySavory snacks will be the strongest growing category in Europe
3.3%
3.2%
3.0%
2.9%
2.9%
2.8%
2.5%
2.4%
2.4%
2.2%
2.2%
2.2%
3.3%
3.5%
4.0%
4.0%
5.1%
0% 1% 2% 3% 4% 5% 6%
Savory snacks
Ready meals
Ice cream
Dairy food
Pasta & noodles
Frozen food
Sauces, dressings & condiments
Soup
Confectionery
Dried food
Baby food
Chilled food
Oils & fats
Spreads
Canned food
Meat, fish & poultry
Bakery & Cereals
Europe: forecast annual growth rates 2009-2013 within foods by category
Source: Datamonitor, 2010
30
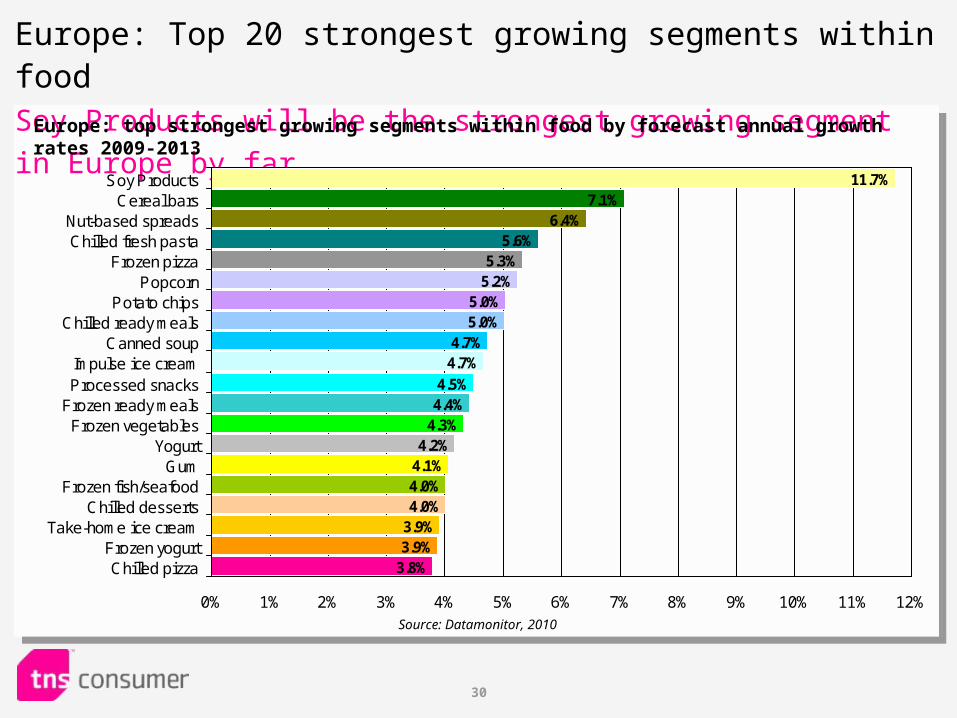
Europe: Top 20 strongest growing segments within food Soy Products will be the strongest growing segment in Europe by far
5.2%5.0%5.0%
4.7%4.7%
4.5%4.4%
4.3%4.2%
4.1%4.0%4.0%
3.8%
3.9%3.9%
5.3%5.6%
6.4%7.1%
11.7%
0% 1% 2% 3% 4% 5% 6% 7% 8% 9% 10% 11% 12%
Soy ProductsCereal bars
Nut-based spreadsChilled fresh pasta
Frozen pizzaPopcorn
Potato chipsChilled ready meals
Canned soupImpulse ice creamProcessed snacks
Frozen ready mealsFrozen vegetables
YogurtGum
Frozen fish/seafoodChilled desserts
Take-home ice creamFrozen yogurtChilled pizza
Europe: top strongest growing segments within food by forecast annual growth rates 2009-2013
Source: Datamonitor, 2010
31
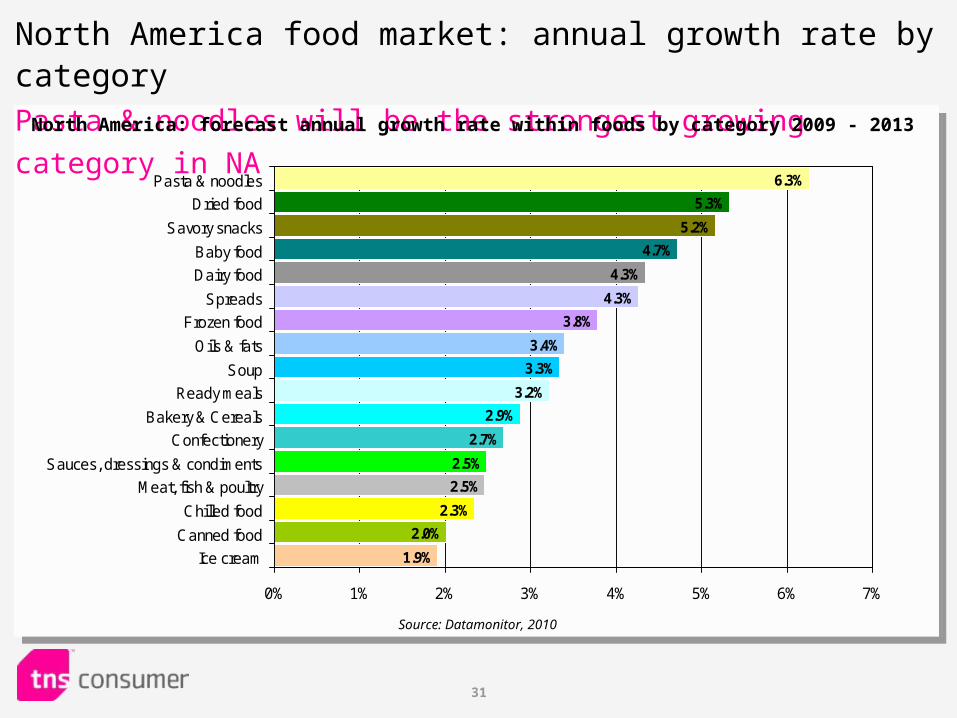
North America food market: annual growth rate by category Pasta & noodles will be the strongest growing category in NA
4.3%
3.8%
3.4%
3.3%
3.2%
2.9%
2.7%
2.5%
2.5%
2.3%
2.0%
1.9%
4.3%
4.7%
5.2%
5.3%
6.3%
0% 1% 2% 3% 4% 5% 6% 7%
Pasta & noodles
Dried food
Savory snacks
Baby food
Dairy food
Spreads
Frozen food
Oils & fats
Soup
Ready meals
Bakery & Cereals
Confectionery
Sauces, dressings & condiments
Meat, fish & poultry
Chilled food
Canned food
Ice cream
North America: forecast annual growth rate within foods by category 2009 - 2013
Source: Datamonitor, 2010
32
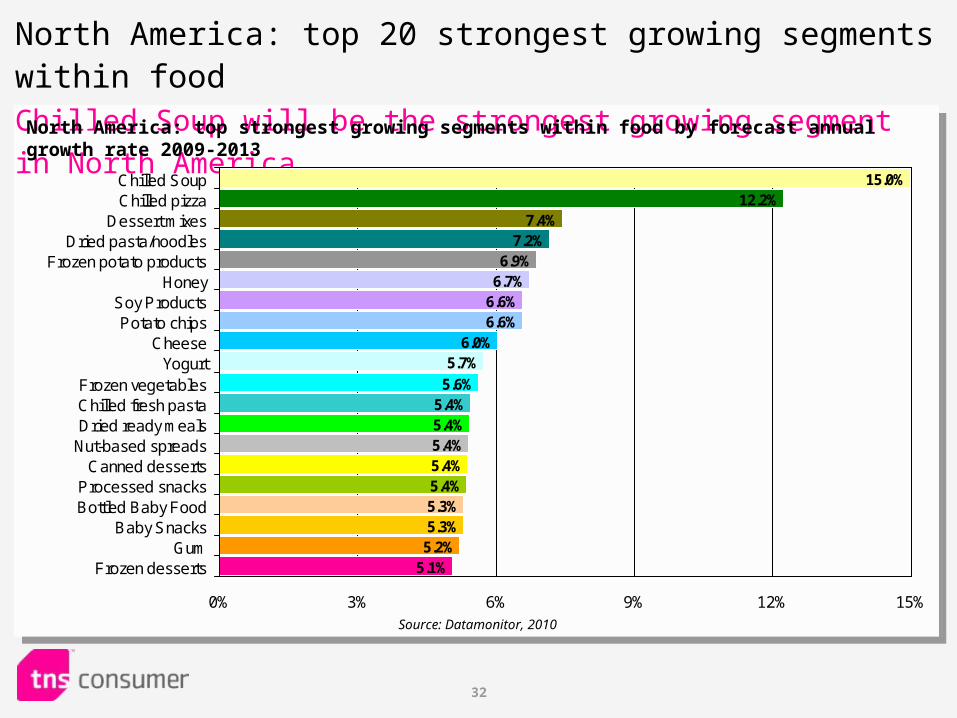
North America: top 20 strongest growing segments within food Chilled Soup will be the strongest growing segment in North America
6.7%6.6%6.6%
6.0%5.7%
5.6%5.4%5.4%5.4%5.4%5.4%5.3%
5.1%
5.3%5.2%
6.9%7.2%
7.4%12.2%
15.0%
0% 3% 6% 9% 12% 15%
Chilled SoupChilled pizza
Dessert mixesDried pasta/noodles
Frozen potato productsHoney
Soy ProductsPotato chips
CheeseYogurt
Frozen vegetablesChilled fresh pastaDried ready meals
Nut-based spreadsCanned desserts
Processed snacksBottled Baby Food
Baby SnacksGum
Frozen desserts
North America: top strongest growing segments within food by forecast annual growth rate 2009-2013
Source: Datamonitor, 2010
33
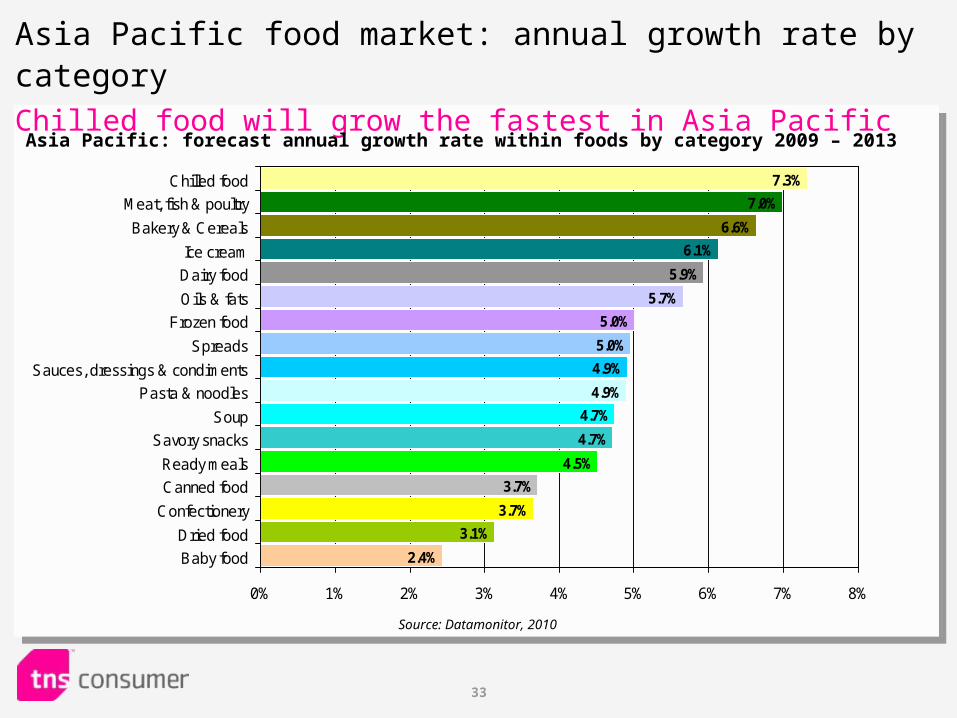
Asia Pacific food market: annual growth rate by category Chilled food will grow the fastest in Asia Pacific
5.7%
5.0%
5.0%
4.9%
4.9%
4.7%
4.7%
4.5%
3.7%
3.7%
3.1%
2.4%
5.9%
6.1%
6.6%
7.0%
7.3%
0% 1% 2% 3% 4% 5% 6% 7% 8%
Chilled food
Meat, fish & poultry
Bakery & Cereals
Ice cream
Dairy food
Oils & fats
Frozen food
Spreads
Sauces, dressings & condiments
Pasta & noodles
Soup
Savory snacks
Ready meals
Canned food
Confectionery
Dried food
Baby food
Asia Pacific: forecast annual growth rate within foods by category 2009 – 2013
Source: Datamonitor, 2010
34
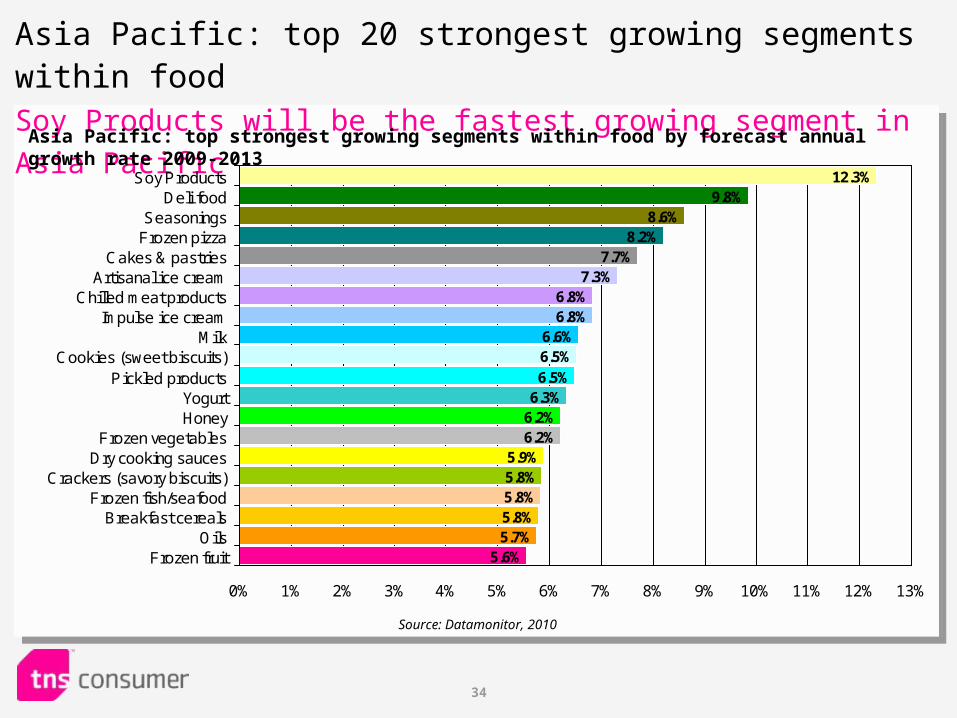
Asia Pacific: top 20 strongest growing segments within food Soy Products will be the fastest growing segment in Asia Pacific
12.3%9.8%
8.6%8.2%
7.7%
5.7%5.8%
5.6%
5.8%5.8%5.9%
6.2%6.2%6.3%6.5%6.5%6.6%
6.8%6.8%
7.3%
0% 1% 2% 3% 4% 5% 6% 7% 8% 9% 10% 11% 12% 13%
Soy ProductsDeli food
SeasoningsFrozen pizza
Cakes & pastriesArtisanal ice cream
Chilled meat productsImpulse ice cream
MilkCookies (sweet biscuits)
Pickled productsYogurtHoney
Frozen vegetablesDry cooking sauces
Crackers (savory biscuits)Frozen fish/seafood
Breakfast cerealsOils
Frozen fruit
Asia Pacific: top strongest growing segments within food by forecast annual growth rate 2009-2013
Source: Datamonitor, 2010
35
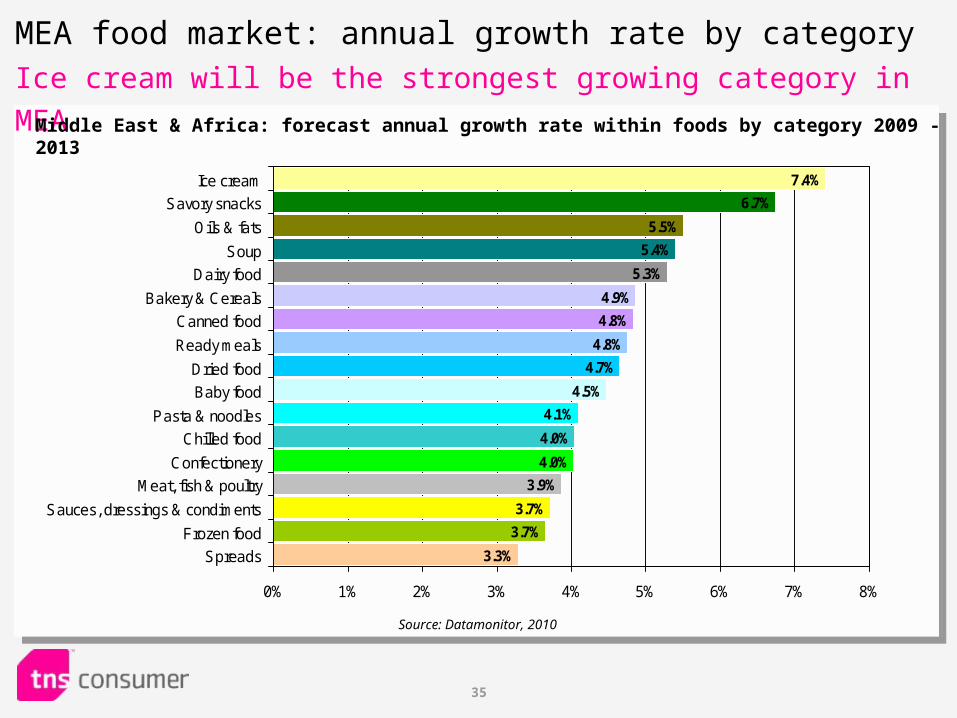
MEA food market: annual growth rate by category Ice cream will be the strongest growing category in MEA
4.9%
4.8%
4.8%
4.7%
4.5%
4.1%
4.0%
4.0%
3.9%
3.7%
3.7%
3.3%
5.3%
5.4%
5.5%
6.7%
7.4%
0% 1% 2% 3% 4% 5% 6% 7% 8%
Ice cream
Savory snacks
Oils & fats
Soup
Dairy food
Bakery & Cereals
Canned food
Ready meals
Dried food
Baby food
Pasta & noodles
Chilled food
Confectionery
Meat, fish & poultry
Sauces, dressings & condiments
Frozen food
Spreads
Middle East & Africa: forecast annual growth rate within foods by category 2009 - 2013
Source: Datamonitor, 2010
36
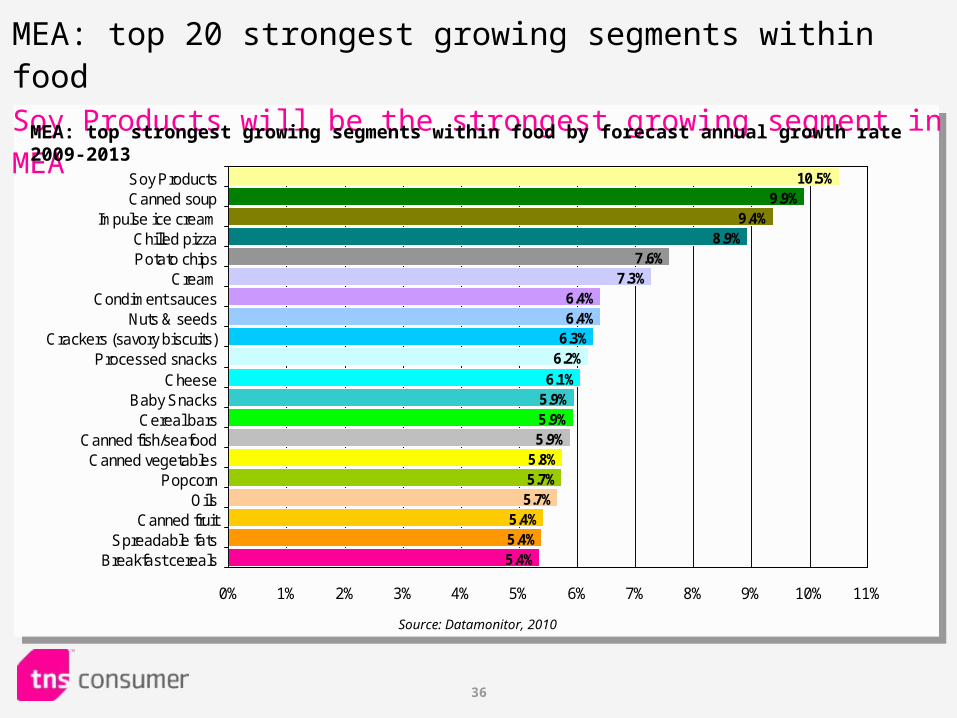
MEA: top 20 strongest growing segments within food Soy Products will be the strongest growing segment in MEA
7.3%6.4%6.4%
6.3%6.2%
6.1%5.9%5.9%5.9%
5.8%5.7%5.7%
5.4%
5.4%5.4%
7.6%8.9%
9.4%9.9%
10.5%
0% 1% 2% 3% 4% 5% 6% 7% 8% 9% 10% 11%
Soy ProductsCanned soup
Impulse ice creamChilled pizzaPotato chips
CreamCondiment sauces
Nuts & seedsCrackers (savory biscuits)
Processed snacksCheese
Baby SnacksCereal bars
Canned fish/seafoodCanned vegetables
PopcornOils
Canned fruitSpreadable fats
Breakfast cereals
MEA: top strongest growing segments within food by forecast annual growth rate 2009-2013
Source: Datamonitor, 2010
37
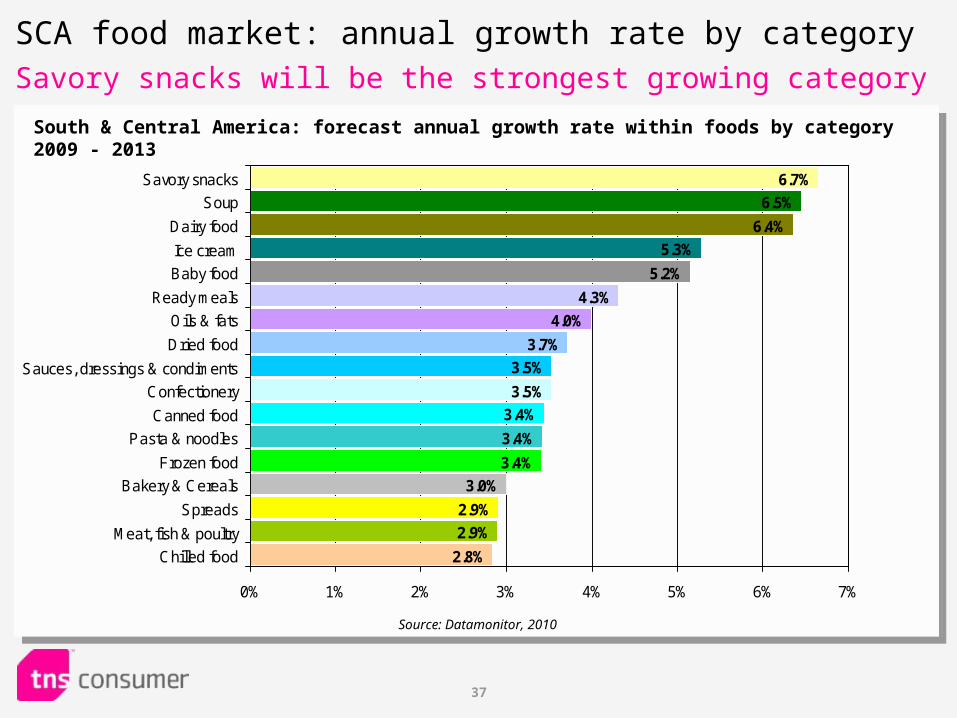
SCA food market: annual growth rate by category Savory snacks will be the strongest growing category
4.3%
4.0%
3.7%
3.5%
3.5%
3.4%
3.4%
3.4%
3.0%
2.9%
2.9%
2.8%
5.2%
5.3%
6.4%
6.5%
6.7%
0% 1% 2% 3% 4% 5% 6% 7%
Savory snacks
Soup
Dairy food
Ice cream
Baby food
Ready meals
Oils & fats
Dried food
Sauces, dressings & condiments
Confectionery
Canned food
Pasta & noodles
Frozen food
Bakery & Cereals
Spreads
Meat, fish & poultry
Chilled food
South & Central America: forecast annual growth rate within foods by category 2009 - 2013
Source: Datamonitor, 2010
38
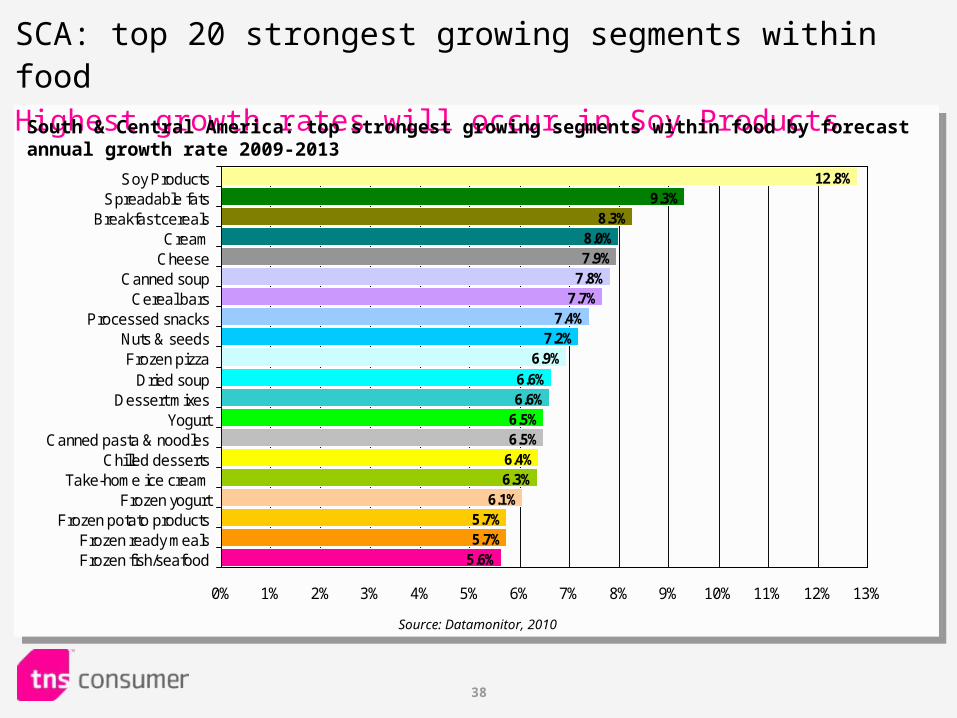
7.8%7.7%
7.4%7.2%
6.9%
6.6%6.6%
6.5%6.5%
6.4%6.3%
6.1%
5.6%
5.7%5.7%
7.9%8.0%
8.3%9.3%
12.8%
0% 1% 2% 3% 4% 5% 6% 7% 8% 9% 10% 11% 12% 13%
Soy ProductsSpreadable fats
Breakfast cerealsCream
CheeseCanned soup
Cereal barsProcessed snacks
Nuts & seedsFrozen pizza
Dried soupDessert mixes
YogurtCanned pasta & noodles
Chilled dessertsTake-home ice cream
Frozen yogurtFrozen potato products
Frozen ready mealsFrozen fish/seafood
SCA: top 20 strongest growing segments within food Highest growth rates will occur in Soy Products
South & Central America: top strongest growing segments within food by forecast annual growth rate 2009-2013
Source: Datamonitor, 2010
39
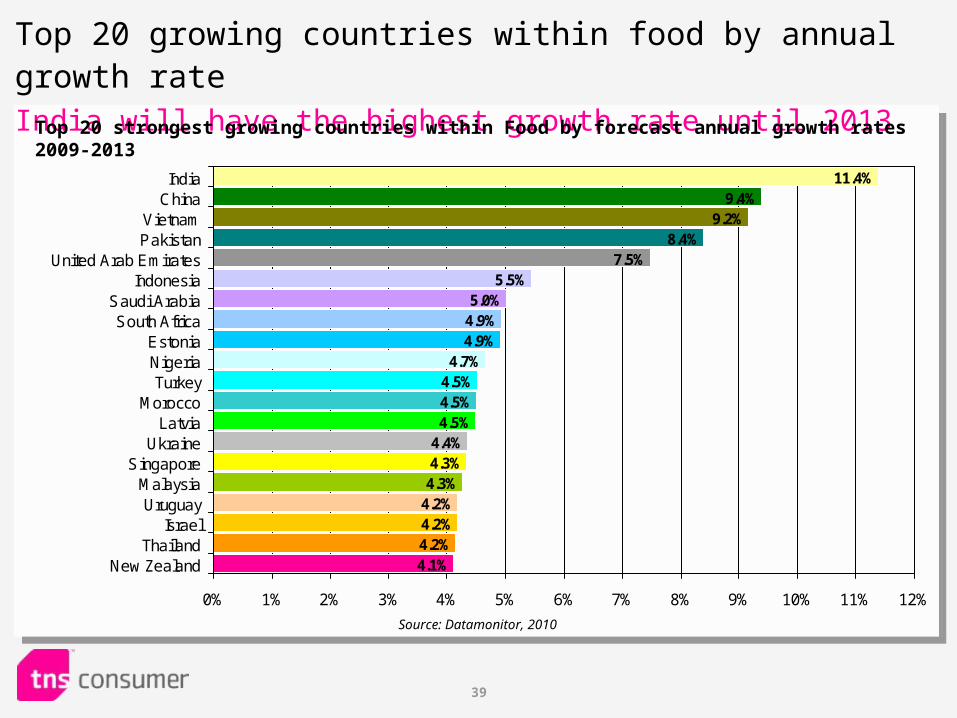
Top 20 growing countries within food by annual growth rateIndia will have the highest growth rate until 2013
5.5%5.0%
4.9%4.9%
4.7%4.5%4.5%4.5%
4.4%4.3%4.3%
4.2%
4.1%
4.2%4.2%
7.5%8.4%
9.2%9.4%
11.4%
0% 1% 2% 3% 4% 5% 6% 7% 8% 9% 10% 11% 12%
IndiaChina
VietnamPakistan
United Arab EmiratesIndonesia
Saudi ArabiaSouth Africa
EstoniaNigeriaTurkey
MoroccoLatvia
UkraineSingapore
MalaysiaUruguay
IsraelThailand
New Zealand
Top 20 strongest growing countries within Food by forecast annual growth rates 2009-2013
Source: Datamonitor, 2010
40
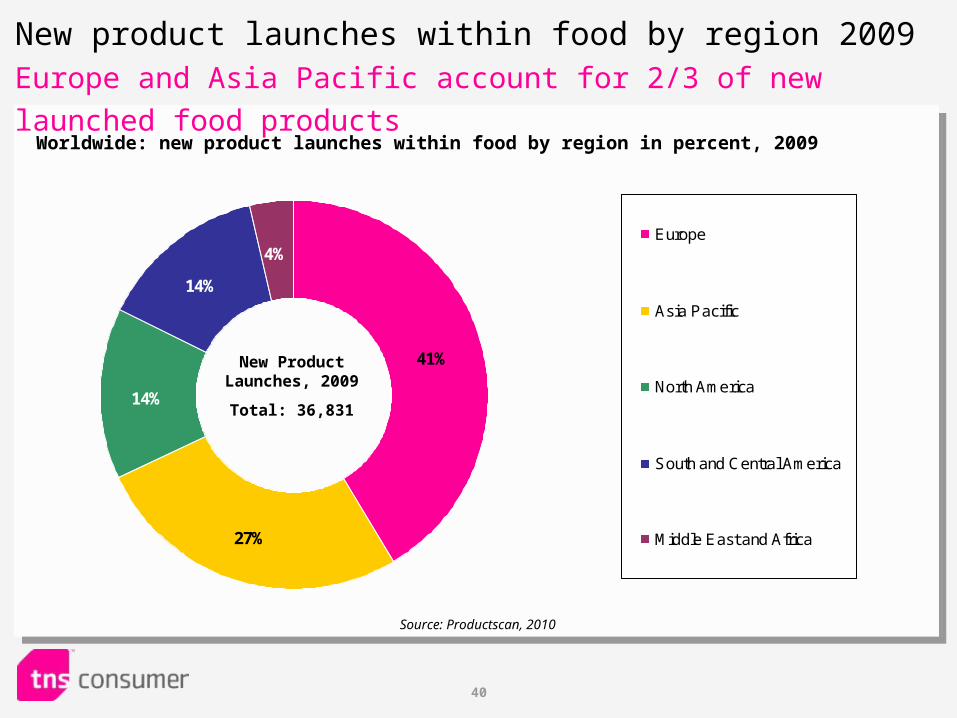
41%
27%
14%
14%
4%Europe
Asia Pacific
North America
South and Central America
Middle East and Africa
New product launches within food by region 2009Europe and Asia Pacific account for 2/3 of new launched food products
Worldwide: new product launches within food by region in percent, 2009
New Product Launches, 2009
Total: 36,831
Source: Productscan, 2010
41
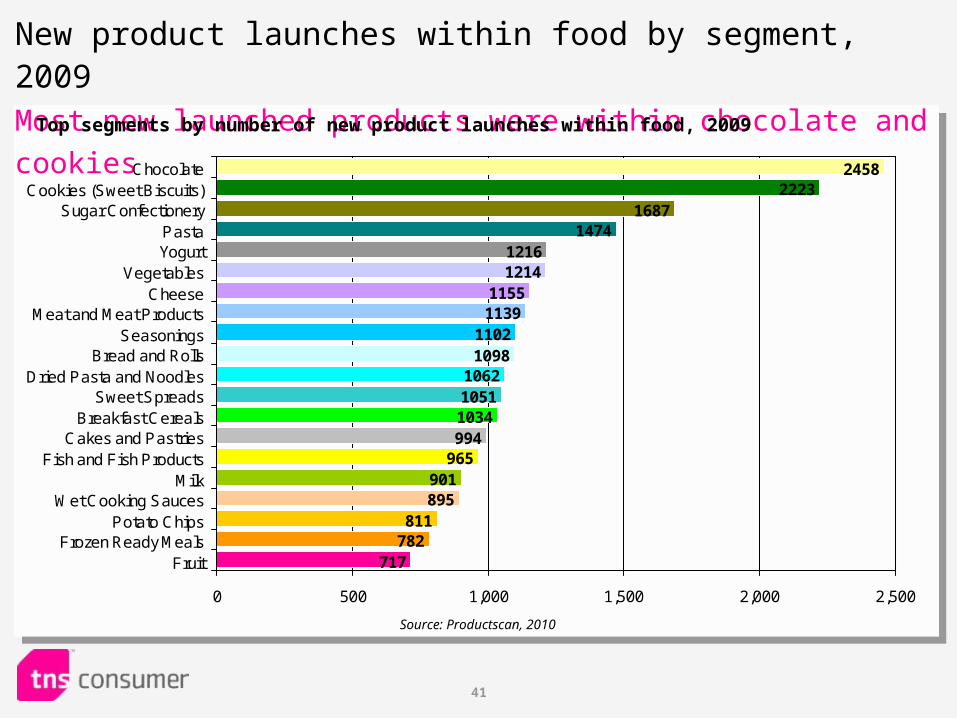
New product launches within food by segment, 2009Most new launched products were within chocolate and cookies
24582223
16871474
12161214
11551139
11021098
106210511034994
965901895
811782
717
0 500 1,000 1,500 2,000 2,500
ChocolateCookies (Sweet Biscuits)
Sugar ConfectioneryPastaYogurt
VegetablesCheese
Meat and Meat ProductsSeasonings
Bread and RollsDried Pasta and Noodles
Sweet SpreadsBreakfast Cereals
Cakes and PastriesFish and Fish Products
MilkWet Cooking Sauces
Potato ChipsFrozen Ready Meals
Fruit
Top segments by number of new product launches within food, 2009
Source: Productscan, 2010
42
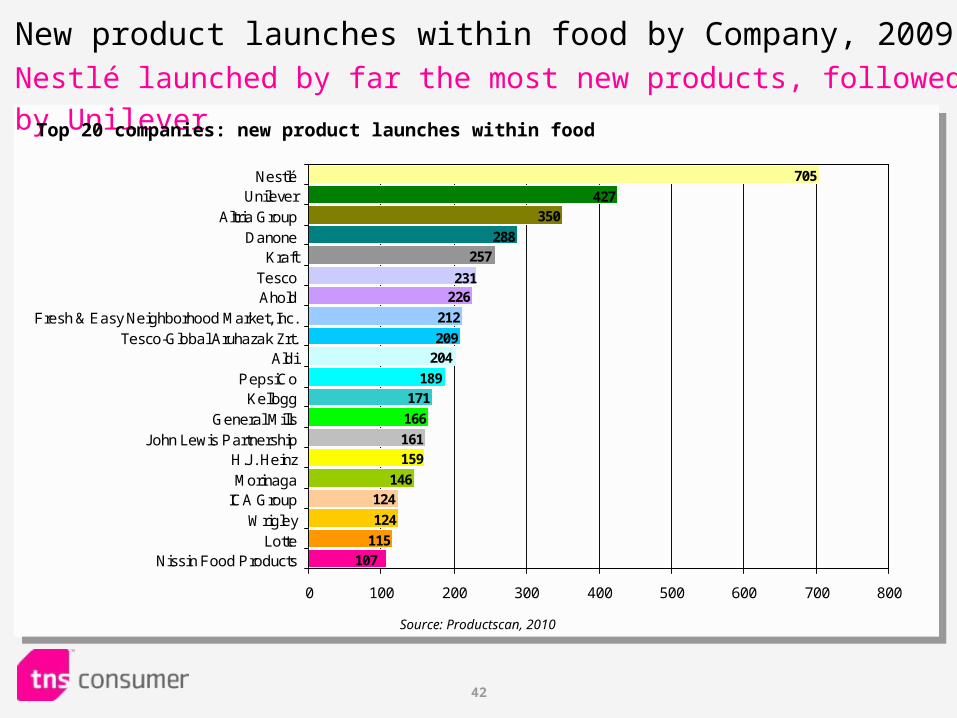
New product launches within food by Company, 2009Nestlé launched by far the most new products, followed by Unilever
705
427
350
288
257
115
124
107
124
146
159
161
166
171
189
204
209
212
226231
0 100 200 300 400 500 600 700 800
NestléUnilever
Altria GroupDanone
KraftTescoAhold
Fresh & Easy Neighborhood Market, Inc.Tesco-Global Aruhazak Zrt.
AldiPepsiCo
KelloggGeneral Mills
John Lewis PartnershipH.J. HeinzMorinaga
ICA GroupWrigley
LotteNissin Food Products
Top 20 companies: new product launches within food
Source: Productscan, 2010
43
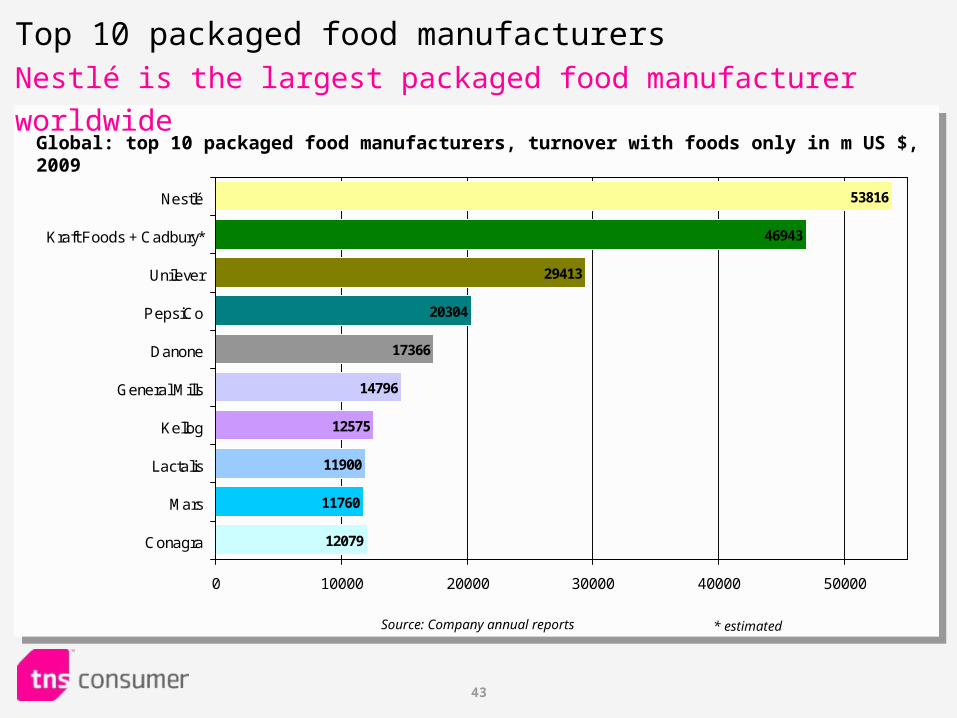
53816
46943
29413
20304
17366
12079
11760
11900
12575
14796
0 10000 20000 30000 40000 50000
Nestlé
Kraft Foods + Cadbury*
Unilever
PepsiCo
Danone
General Mills
Kellog
Lactalis
Mars
Conagra
Top 10 packaged food manufacturersNestlé is the largest packaged food manufacturer worldwide
Global: top 10 packaged food manufacturers, turnover with foods only in m US $, 2009
Source: Company annual reports * estimated

44
Market for Alcoholic Beverages
45
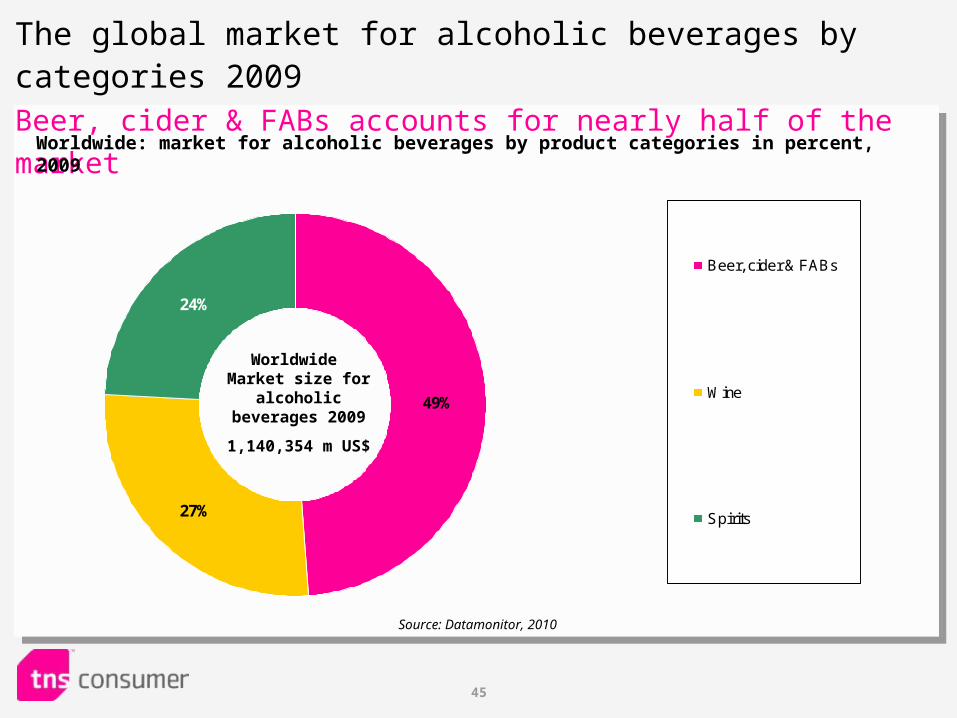
The global market for alcoholic beverages by categories 2009Beer, cider & FABs accounts for nearly half of the market
Worldwide: market for alcoholic beverages by product categories in percent, 2009
Source: Datamonitor, 2010
Worldwide Market size for
alcoholic beverages 2009
1,140,354 m US$
49%
27%
24%
Beer, cider & FABs
Wine
Spirits
46
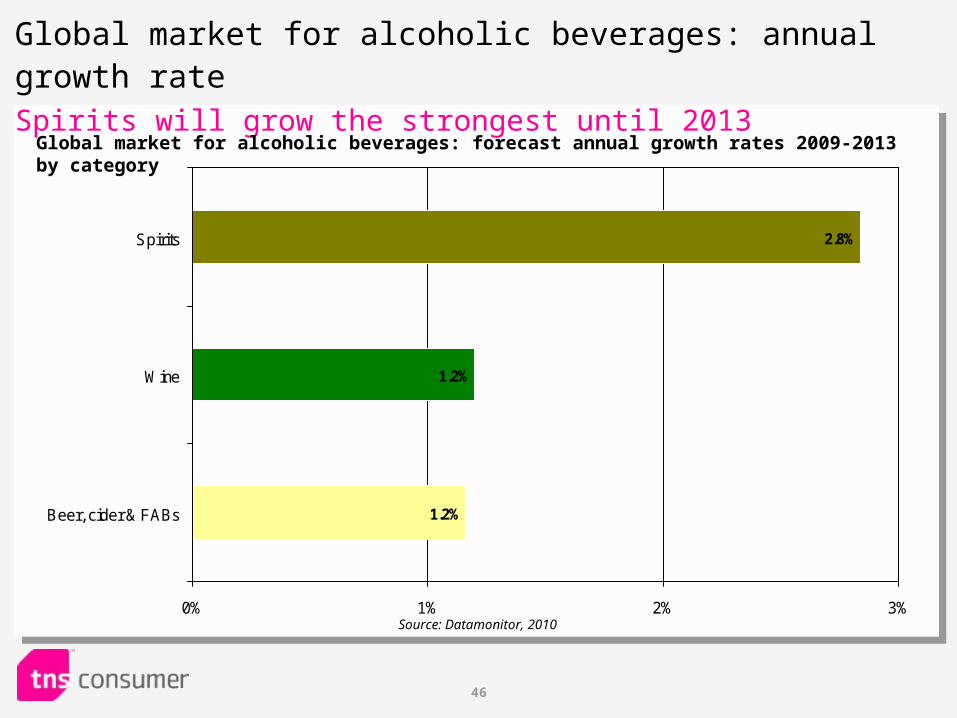
Global market for alcoholic beverages: annual growth rate Spirits will grow the strongest until 2013
2.8%
1.2%
1.2%
0% 1% 2% 3%
Beer, cider & FABs
Wine
Spirits
Global market for alcoholic beverages: forecast annual growth rates 2009-2013 by category
Source: Datamonitor, 2010
47
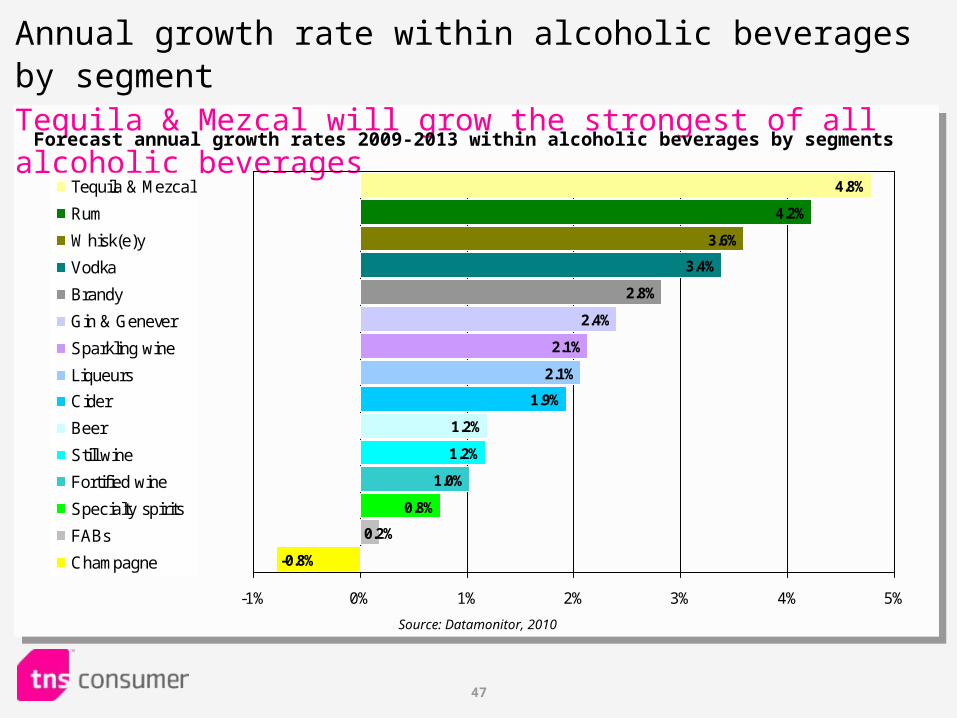
Annual growth rate within alcoholic beverages by segment Tequila & Mezcal will grow the strongest of all alcoholic beverages
2.4%
2.1%
2.1%
1.9%
1.2%
1.2%
1.0%
0.8%
0.2%
-0.8%
2.8%
3.4%
3.6%
4.2%
4.8%
-1% 0% 1% 2% 3% 4% 5%
Tequila & Mezcal
Rum
Whisk(e)y
Vodka
Brandy
Gin & Genever
Sparkling wine
Liqueurs
Cider
Beer
Still wine
Fortified wine
Specialty spirits
FABs
Champagne
Source: Datamonitor, 2010
Forecast annual growth rates 2009-2013 within alcoholic beverages by segments
48
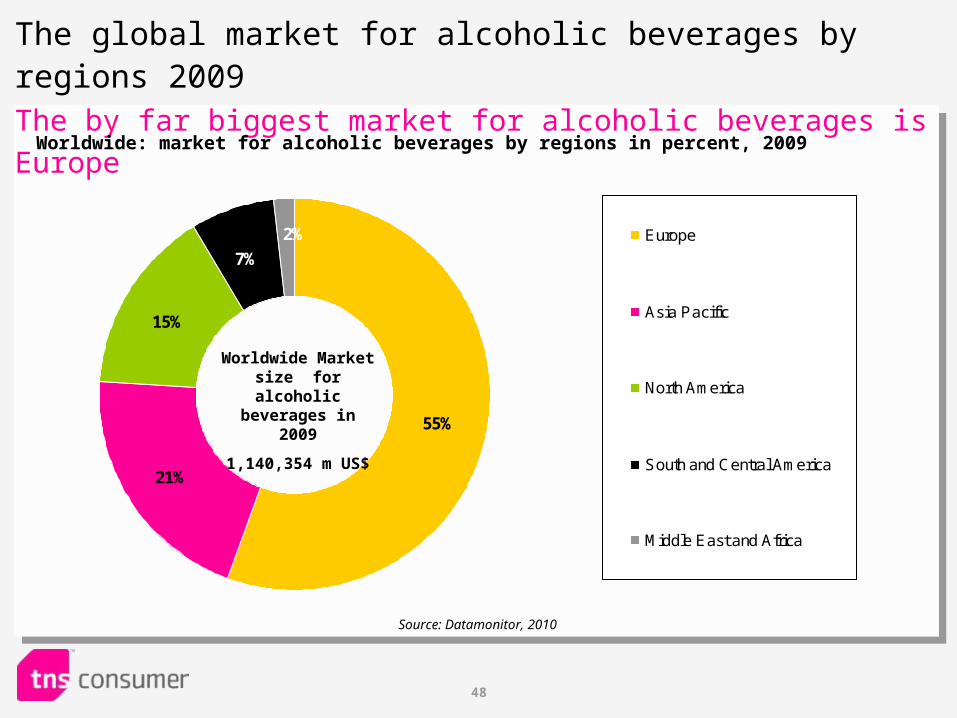
55%
21%
15%
2%
7%Europe
Asia Pacific
North America
South and Central America
Middle East and Africa
The global market for alcoholic beverages by regions 2009The by far biggest market for alcoholic beverages is Europe
Worldwide: market for alcoholic beverages by regions in percent, 2009
Source: Datamonitor, 2010
Worldwide Market size for alcoholic beverages in 2009
1,140,354 m US$
49
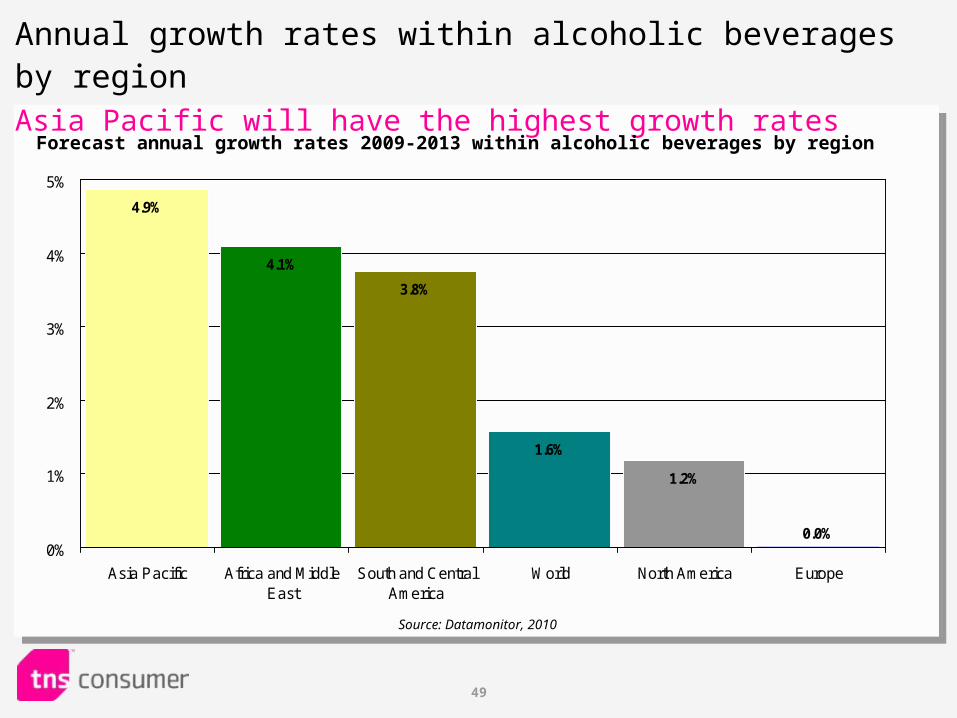
Annual growth rates within alcoholic beverages by regionAsia Pacific will have the highest growth rates
0.0%
1.2%
1.6%
3.8%
4.1%
4.9%
0%
1%
2%
3%
4%
5%
Asia Pacific Africa and MiddleEast
South and CentralAmerica
World North America Europe
Forecast annual growth rates 2009-2013 within alcoholic beverages by region
Source: Datamonitor, 2010
50
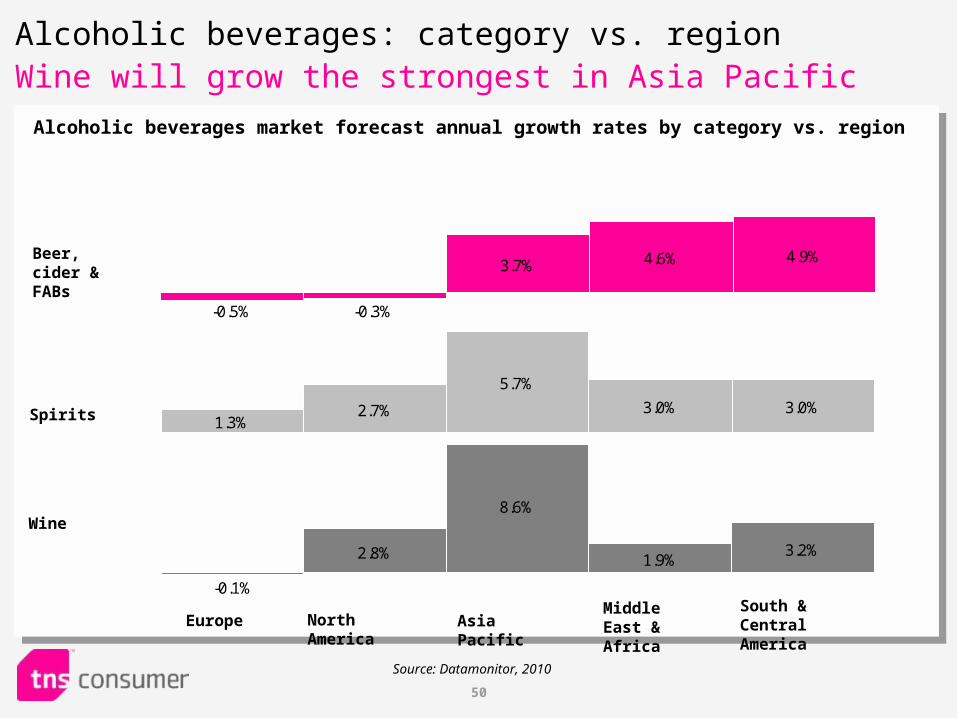
Source: Datamonitor, 2010
Middle East & Africa
South & Central AmericaAsia PacificNorth AmericaEurope
Wine
Spirits
Beer, cider & FABs
Alcoholic beverages market forecast annual growth rates by category vs. region
2.8%
8.6%
1.9%3.2%
-0.1%
Alcoholic beverages: category vs. regionWine will grow the strongest in Asia Pacific
1.3%2.7%
5.7%
3.0% 3.0%
3.7% 4.6% 4.9%
-0.3%-0.5%
51
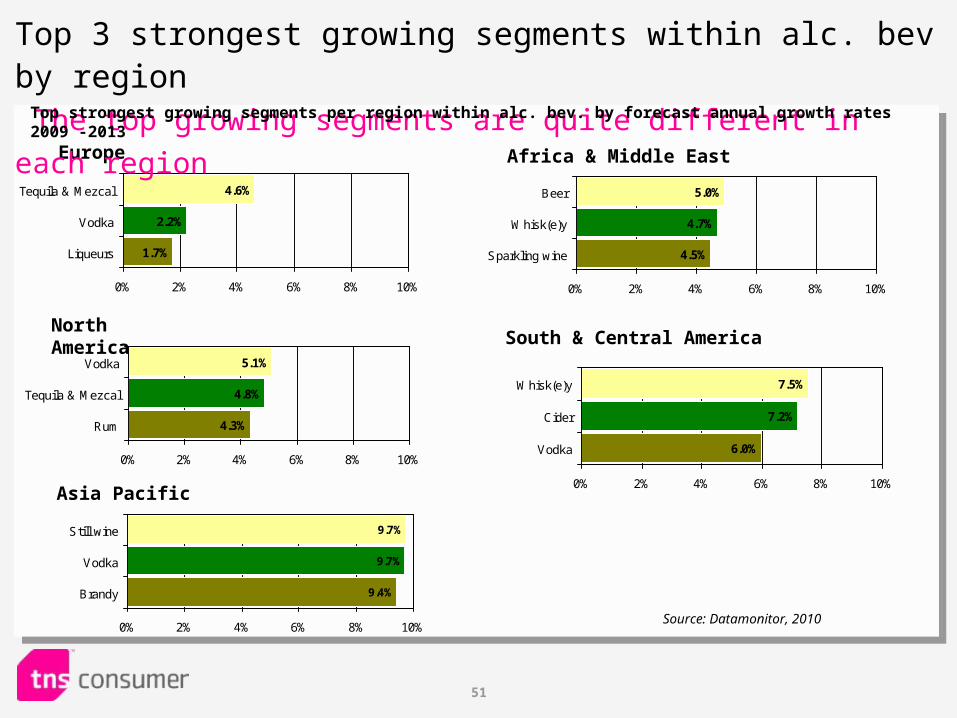
1.7%
2.2%
4.6%
0% 2% 4% 6% 8% 10%
Tequila & Mezcal
Vodka
Liqueurs
Source: Datamonitor, 2010
4.3%
4.8%
5.1%
0% 2% 4% 6% 8% 10%
Vodka
Tequila & Mezcal
Rum
9.4%
9.7%
9.7%
0% 2% 4% 6% 8% 10%
Still wine
Vodka
Brandy
Europe
North America
Asia Pacific
4.5%
4.7%
5.0%
0% 2% 4% 6% 8% 10%
Beer
Whisk(e)y
Sparkling wine
South & Central America
6.0%
7.2%
7.5%
0% 2% 4% 6% 8% 10%
Whisk(e)y
Cider
Vodka
Africa & Middle East
Top 3 strongest growing segments within alc. bev by region The top growing segments are quite different in each region
Top strongest growing segments per region within alc. bev. by forecast annual growth rates 2009 -2013
52
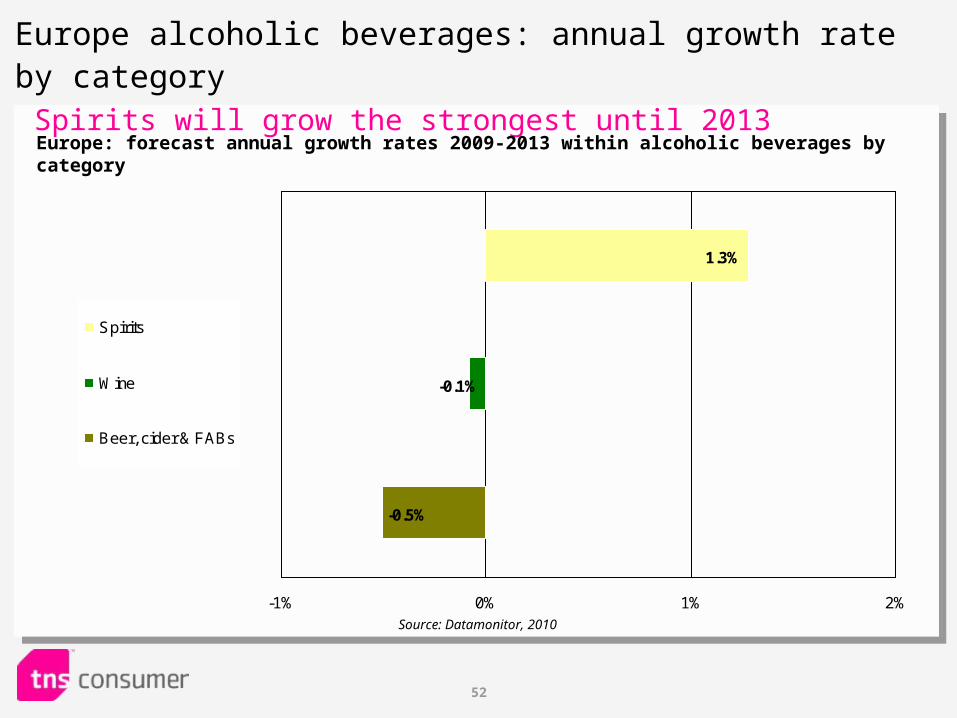
Europe alcoholic beverages: annual growth rate by category Spirits will grow the strongest until 2013
-0.5%
-0.1%
1.3%
-1% 0% 1% 2%
Spirits
Wine
Beer, cider & FABs
Europe: forecast annual growth rates 2009-2013 within alcoholic beverages by category
Source: Datamonitor, 2010
53
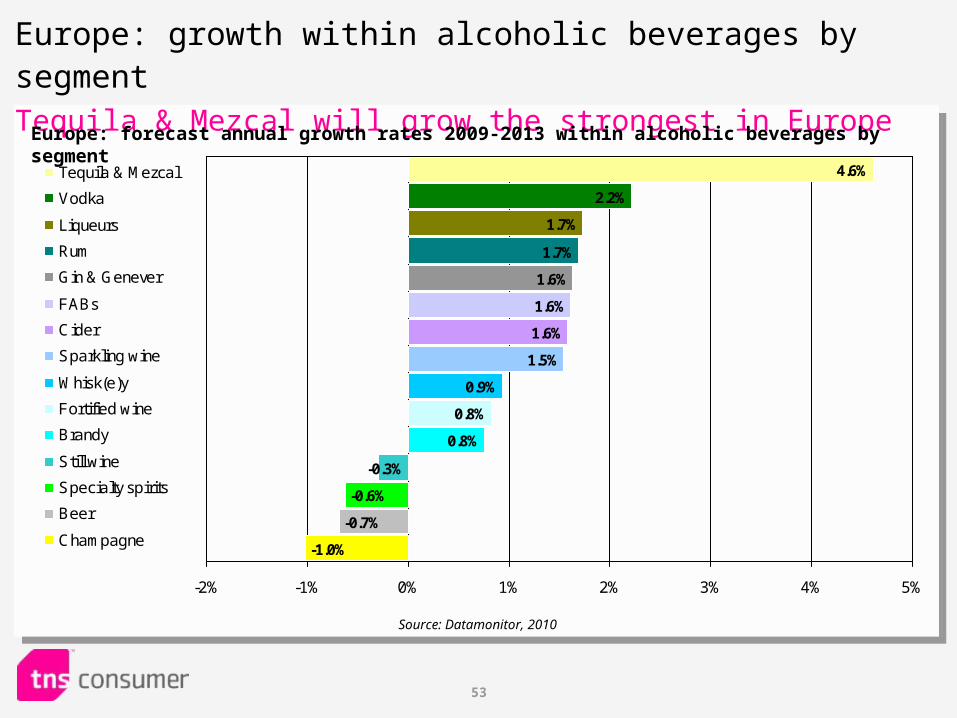
1.6%
1.6%
1.5%
0.9%
0.8%
0.8%
-0.3%
-0.6%
-0.7%
-1.0%
1.6%
1.7%
1.7%
2.2%
4.6%
-2% -1% 0% 1% 2% 3% 4% 5%
Tequila & Mezcal
Vodka
Liqueurs
Rum
Gin & Genever
FABs
Cider
Sparkling wine
Whisk(e)y
Fortified wine
Brandy
Still wine
Specialty spirits
Beer
Champagne
Europe: growth within alcoholic beverages by segmentTequila & Mezcal will grow the strongest in Europe
Europe: forecast annual growth rates 2009-2013 within alcoholic beverages by segment
Source: Datamonitor, 2010
54
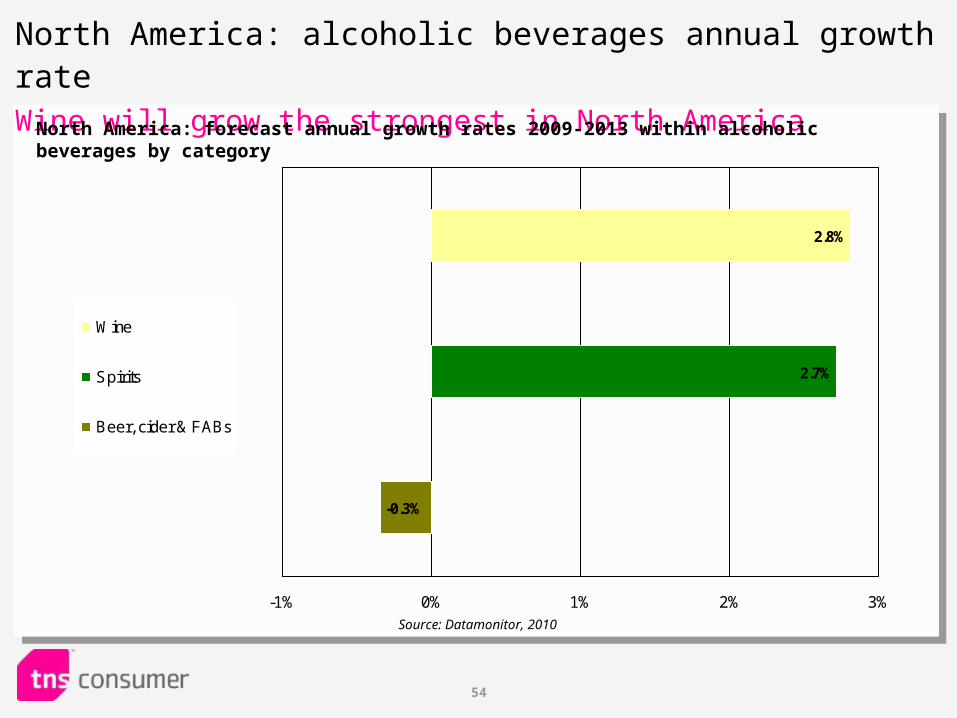
North America: alcoholic beverages annual growth rate Wine will grow the strongest in North America
-0.3%
2.7%
2.8%
-1% 0% 1% 2% 3%
Wine
Spirits
Beer, cider & FABs
North America: forecast annual growth rates 2009-2013 within alcoholic beverages by category
Source: Datamonitor, 2010
55
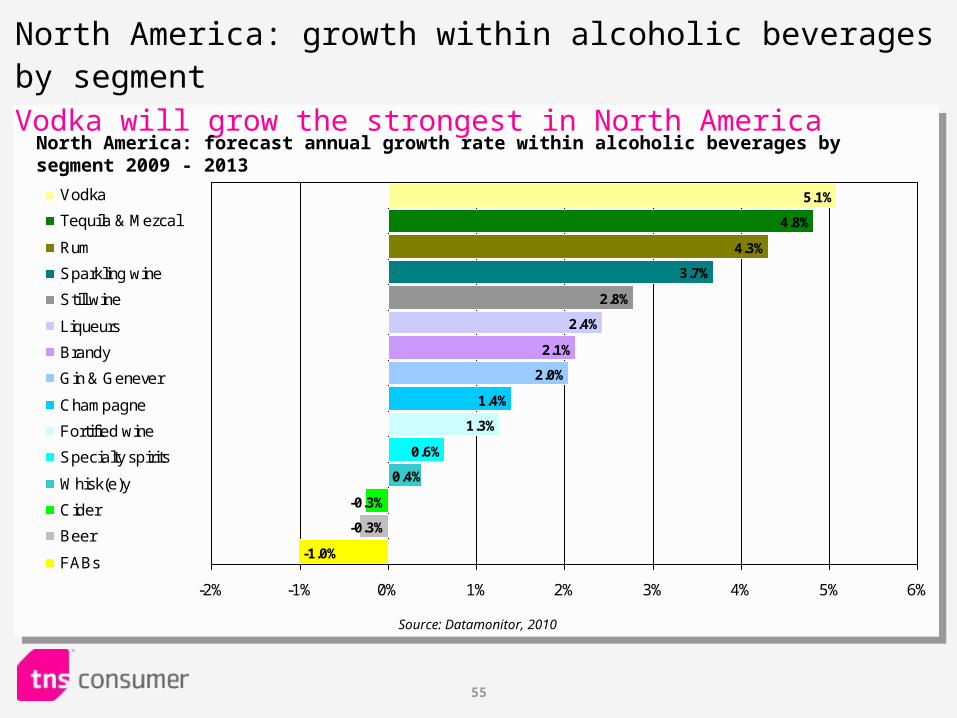
2.4%
2.1%
2.0%
1.4%
1.3%
0.6%
0.4%
-0.3%
-0.3%
-1.0%
2.8%
3.7%
4.3%
4.8%
5.1%
-2% -1% 0% 1% 2% 3% 4% 5% 6%
Vodka
Tequila & Mezcal
Rum
Sparkling wine
Still wine
Liqueurs
Brandy
Gin & Genever
Champagne
Fortified wine
Specialty spirits
Whisk(e)y
Cider
Beer
FABs
North America: growth within alcoholic beverages by segment Vodka will grow the strongest in North America
North America: forecast annual growth rate within alcoholic beverages by segment 2009 - 2013
Source: Datamonitor, 2010
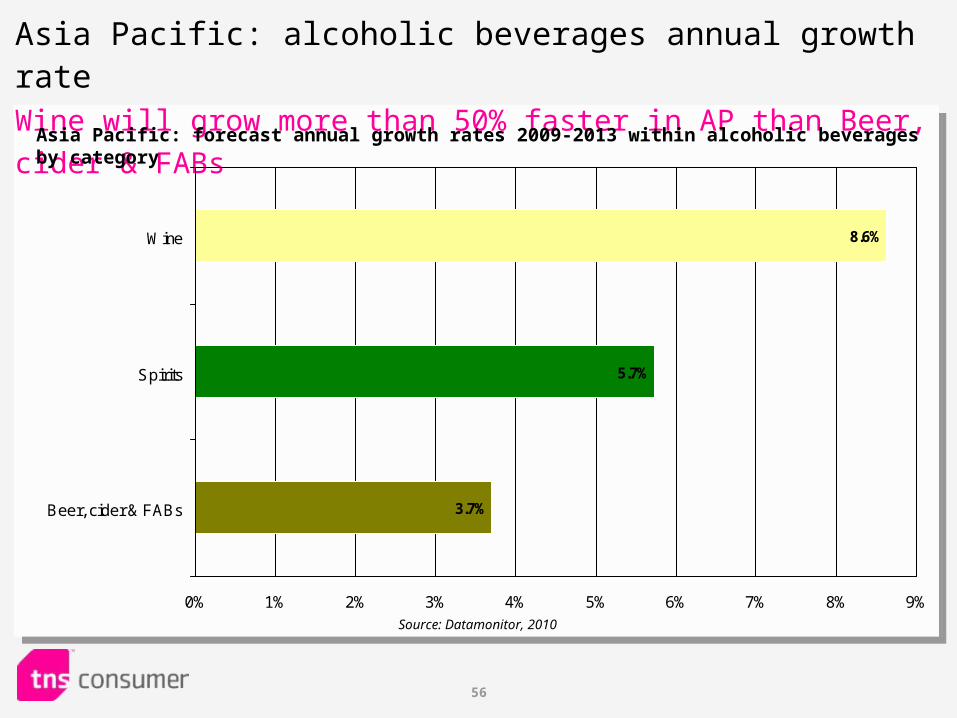
56
Asia Pacific: alcoholic beverages annual growth rate Wine will grow more than 50% faster in AP than Beer, cider & FABs
3.7%
5.7%
8.6%
0% 1% 2% 3% 4% 5% 6% 7% 8% 9%
Wine
Spirits
Beer, cider & FABs
Asia Pacific: forecast annual growth rates 2009-2013 within alcoholic beverages by category
Source: Datamonitor, 2010
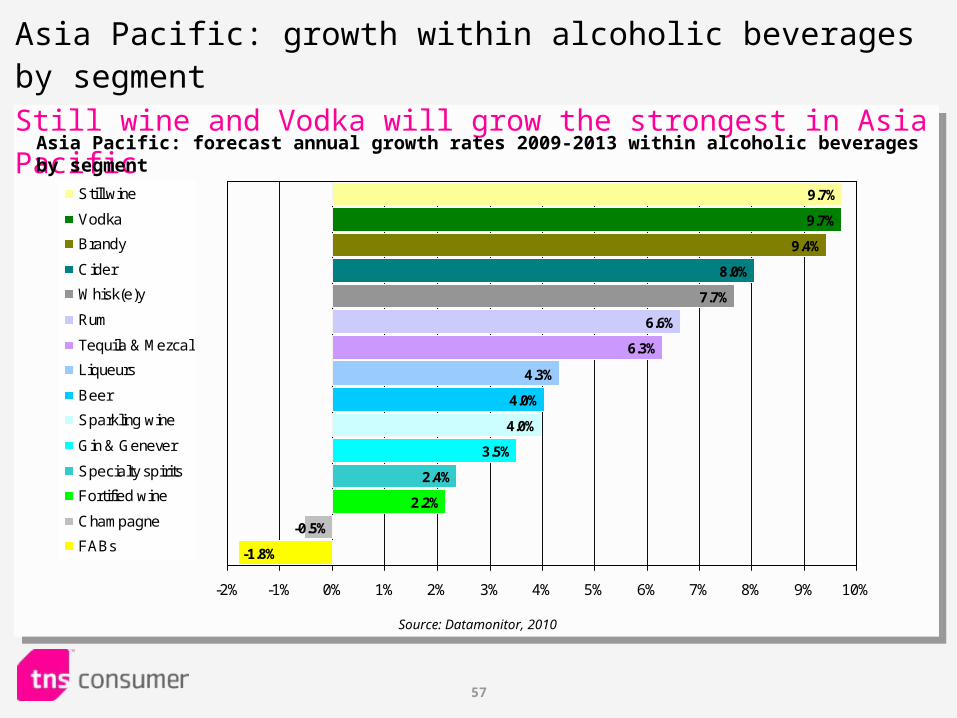
57
Asia Pacific: growth within alcoholic beverages by segmentStill wine and Vodka will grow the strongest in Asia Pacific
6.6%
6.3%
4.3%
4.0%
4.0%
3.5%
2.4%
2.2%
-0.5%
-1.8%
7.7%
8.0%
9.4%
9.7%
9.7%
-2% -1% 0% 1% 2% 3% 4% 5% 6% 7% 8% 9% 10%
Still wine
Vodka
Brandy
Cider
Whisk(e)y
Rum
Tequila & Mezcal
Liqueurs
Beer
Sparkling wine
Gin & Genever
Specialty spirits
Fortified wine
Champagne
FABs
Asia Pacific: forecast annual growth rates 2009-2013 within alcoholic beverages by segment
Source: Datamonitor, 2010
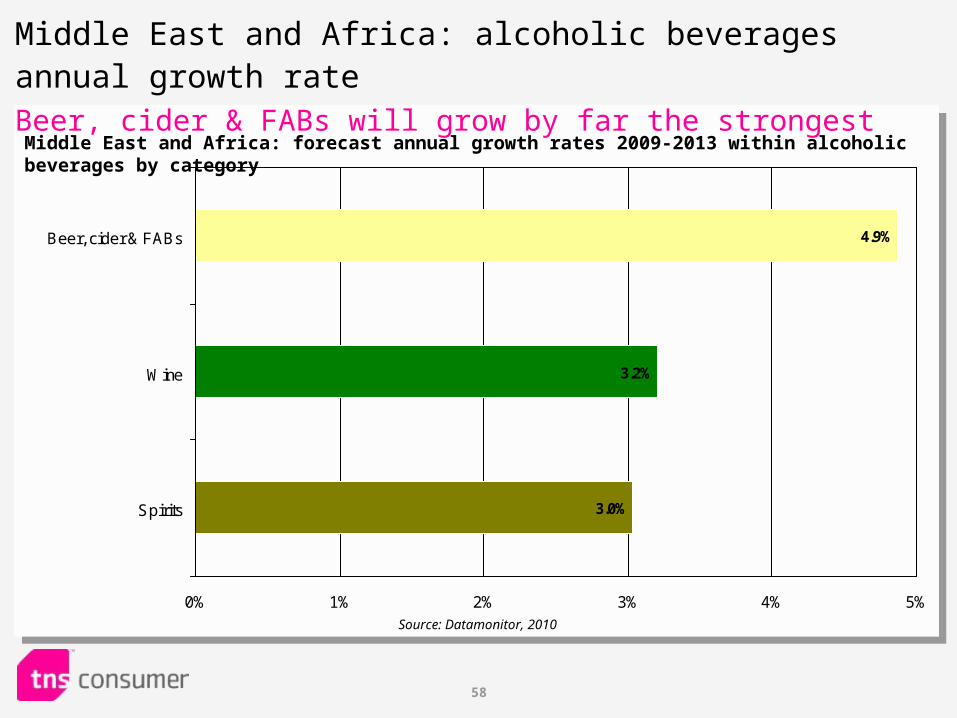
58
Middle East and Africa: alcoholic beverages annual growth rate Beer, cider & FABs will grow by far the strongest
3.0%
3.2%
4.9%
0% 1% 2% 3% 4% 5%
Beer, cider & FABs
Wine
Spirits
Middle East and Africa: forecast annual growth rates 2009-2013 within alcoholic beverages by category
Source: Datamonitor, 2010
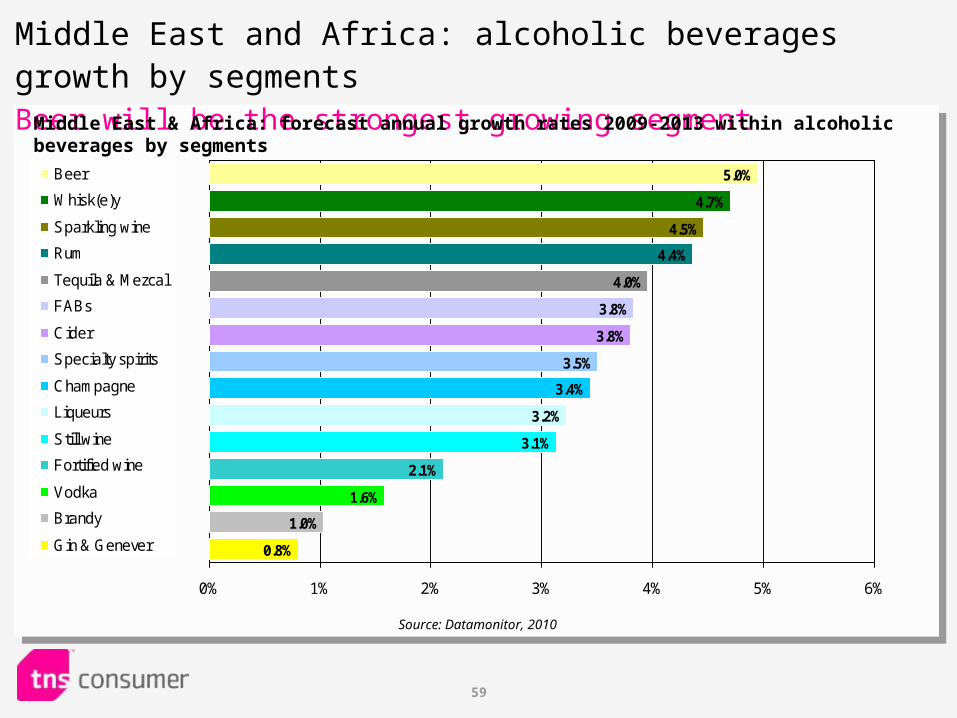
59
Middle East and Africa: alcoholic beverages growth by segmentsBeer will be the strongest growing segment
5.0%
4.7%
4.5%
4.4%
4.0%
0.8%
1.0%
1.6%
2.1%
3.1%
3.2%
3.4%
3.5%
3.8%
3.8%
0% 1% 2% 3% 4% 5% 6%
Beer
Whisk(e)y
Sparkling wine
Rum
Tequila & Mezcal
FABs
Cider
Specialty spirits
Champagne
Liqueurs
Still wine
Fortified wine
Vodka
Brandy
Gin & Genever
Middle East & Africa: forecast annual growth rates 2009-2013 within alcoholic beverages by segments
Source: Datamonitor, 2010
60
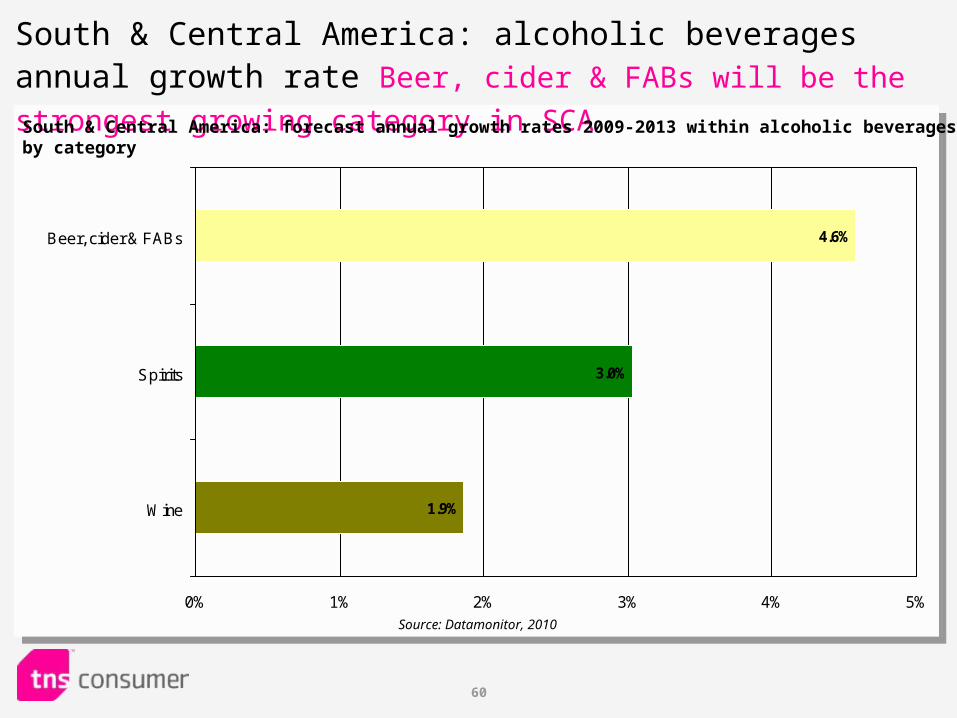
South & Central America: alcoholic beverages annual growth rate Beer, cider & FABs will be the strongest growing category in SCA
1.9%
3.0%
4.6%
0% 1% 2% 3% 4% 5%
Beer, cider & FABs
Spirits
Wine
South & Central America: forecast annual growth rates 2009-2013 within alcoholic beverages by category
Source: Datamonitor, 2010
61
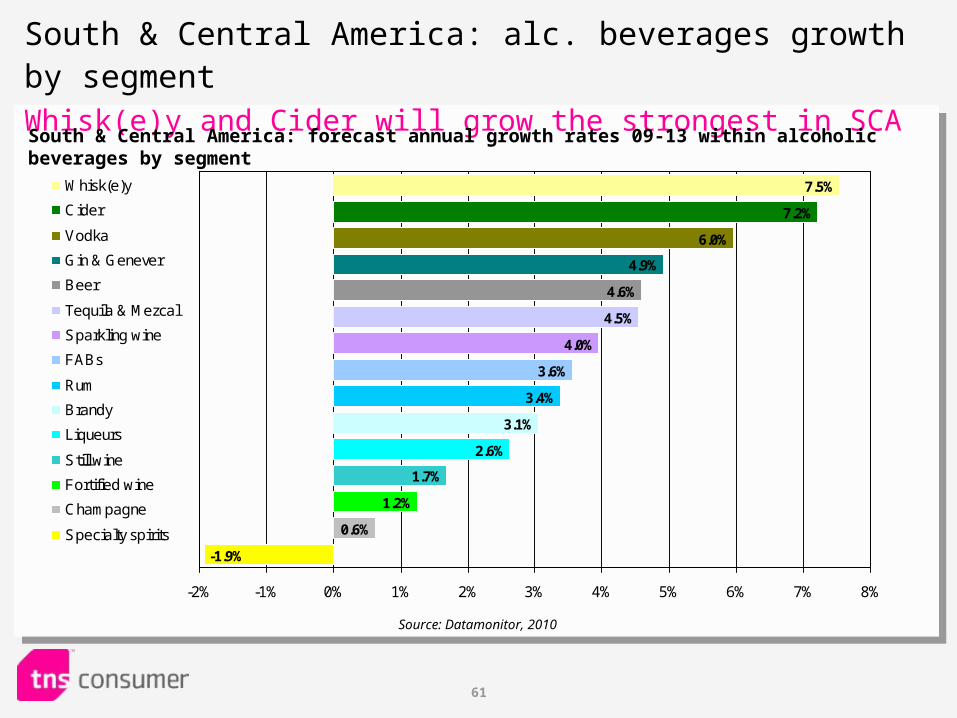
South & Central America: alc. beverages growth by segmentWhisk(e)y and Cider will grow the strongest in SCA
4.5%
4.0%
3.6%
3.4%
3.1%
2.6%
1.7%
1.2%
0.6%
-1.9%
4.6%
4.9%
6.0%
7.2%
7.5%
-2% -1% 0% 1% 2% 3% 4% 5% 6% 7% 8%
Whisk(e)y
Cider
Vodka
Gin & Genever
Beer
Tequila & Mezcal
Sparkling wine
FABs
Rum
Brandy
Liqueurs
Still wine
Fortified wine
Champagne
Specialty spirits
South & Central America: forecast annual growth rates 09-13 within alcoholic beverages by segment
Source: Datamonitor, 2010
62
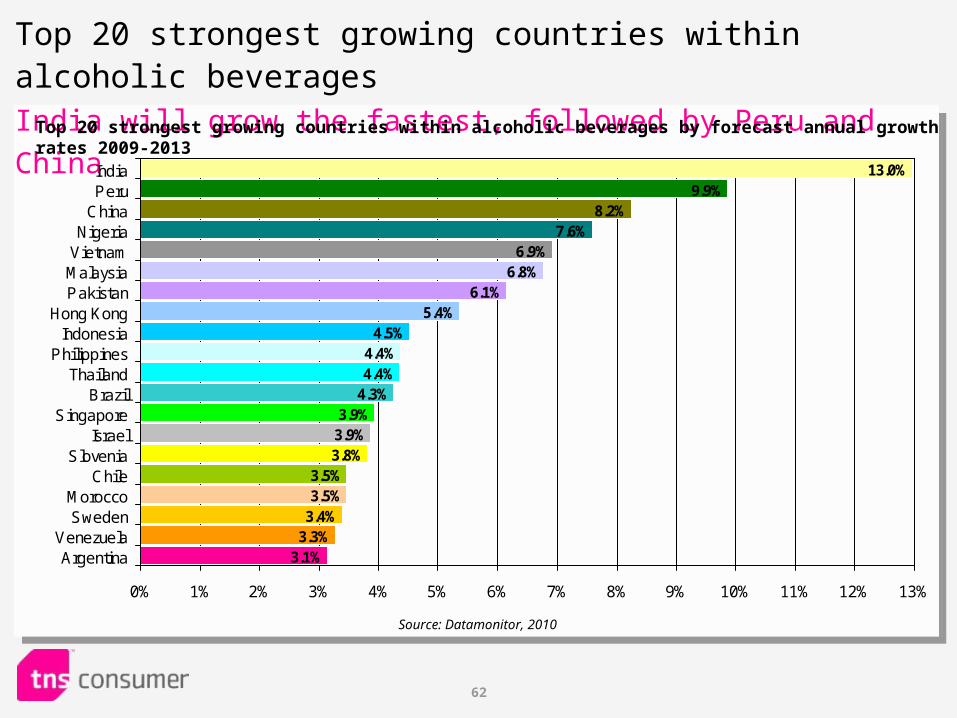
Top 20 strongest growing countries within alcoholic beveragesIndia will grow the fastest, followed by Peru and China
6.8%6.1%
5.4%4.5%
4.4%4.4%
4.3%3.9%3.9%3.8%
3.5%3.5%
3.1%
3.4%3.3%
6.9%7.6%
8.2%9.9%
13.0%
0% 1% 2% 3% 4% 5% 6% 7% 8% 9% 10% 11% 12% 13%
IndiaPeru
ChinaNigeria
VietnamMalaysiaPakistan
Hong KongIndonesia
PhilippinesThailand
BrazilSingapore
IsraelSlovenia
ChileMoroccoSweden
VenezuelaArgentina
Top 20 strongest growing countries within alcoholic beverages by forecast annual growth rates 2009-2013
Source: Datamonitor, 2010
63
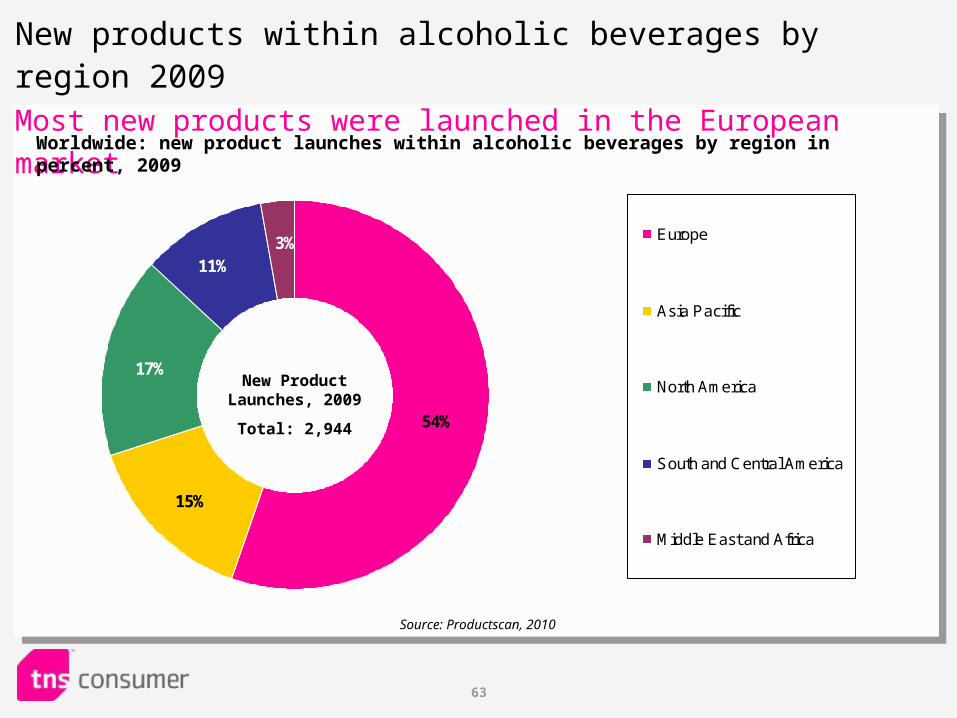
54%
15%
17%
11%3% Europe
Asia Pacific
North America
South and Central America
Middle East and Africa
New products within alcoholic beverages by region 2009Most new products were launched in the European market
Worldwide: new product launches within alcoholic beverages by region in percent, 2009
New Product Launches, 2009
Total: 2,944
Source: Productscan, 2010
64
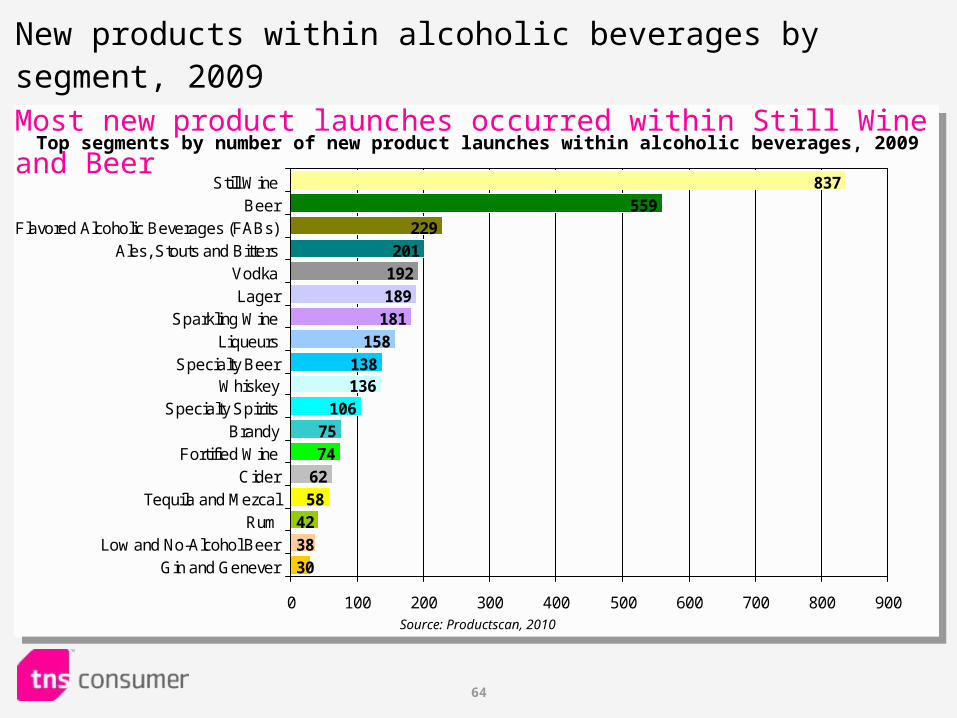
New products within alcoholic beverages by segment, 2009Most new product launches occurred within Still Wine and Beer
837559
229201
192189
181158
138136
1067574
6258
423830
0 100 200 300 400 500 600 700 800 900
Still WineBeer
Flavored Alcoholic Beverages (FABs)Ales, Stouts and Bitters
VodkaLager
Sparkling WineLiqueurs
Specialty BeerWhiskey
Specialty SpiritsBrandy
Fortified WineCider
Tequila and MezcalRum
Low and No-Alcohol BeerGin and Genever
Top segments by number of new product launches within alcoholic beverages, 2009
Source: Productscan, 2010
65
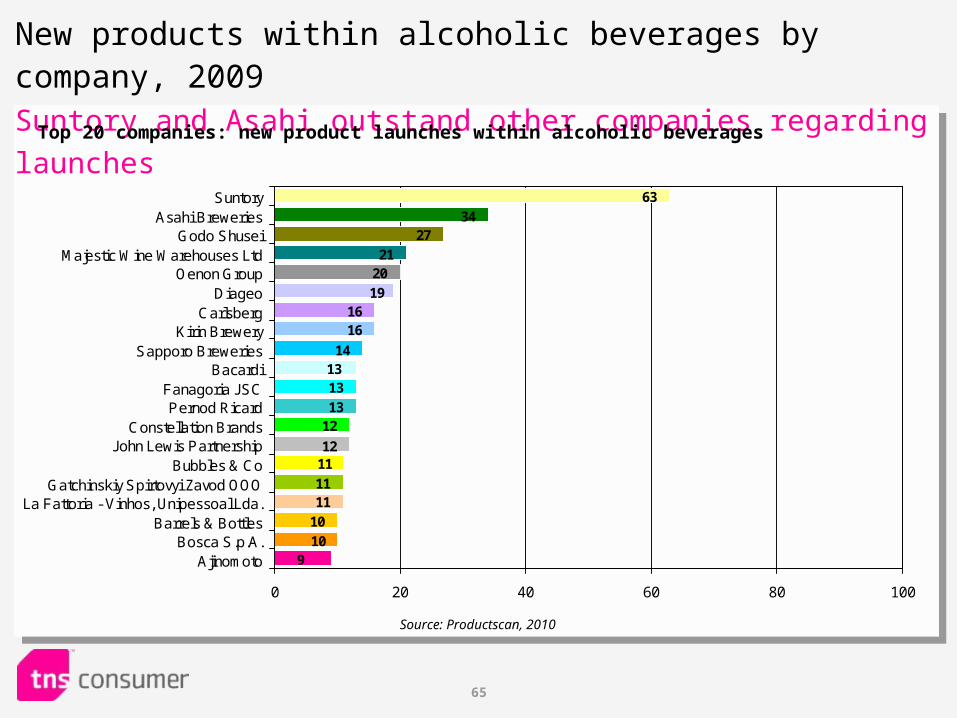
New products within alcoholic beverages by company, 2009Suntory and Asahi outstand other companies regarding launches
63
3427
2120
10
10
9
1111
1112
1213
1313
14
1616
19
0 20 40 60 80 100
SuntoryAsahi Breweries
Godo ShuseiMajestic Wine Warehouses Ltd
Oenon GroupDiageo
CarlsbergKirin Brewery
Sapporo BreweriesBacardi
Fanagoria JSCPernod Ricard
Constellation BrandsJohn Lewis Partnership
Bubbles & CoGatchinskiy Spirtovyi Zavod OOO
La Fattoria - Vinhos, Unipessoal Lda.Barrels & Bottles
Bosca S.p.A.Ajinomoto
Top 20 companies: new product launches within alcoholic beverages
Source: Productscan, 2010
66
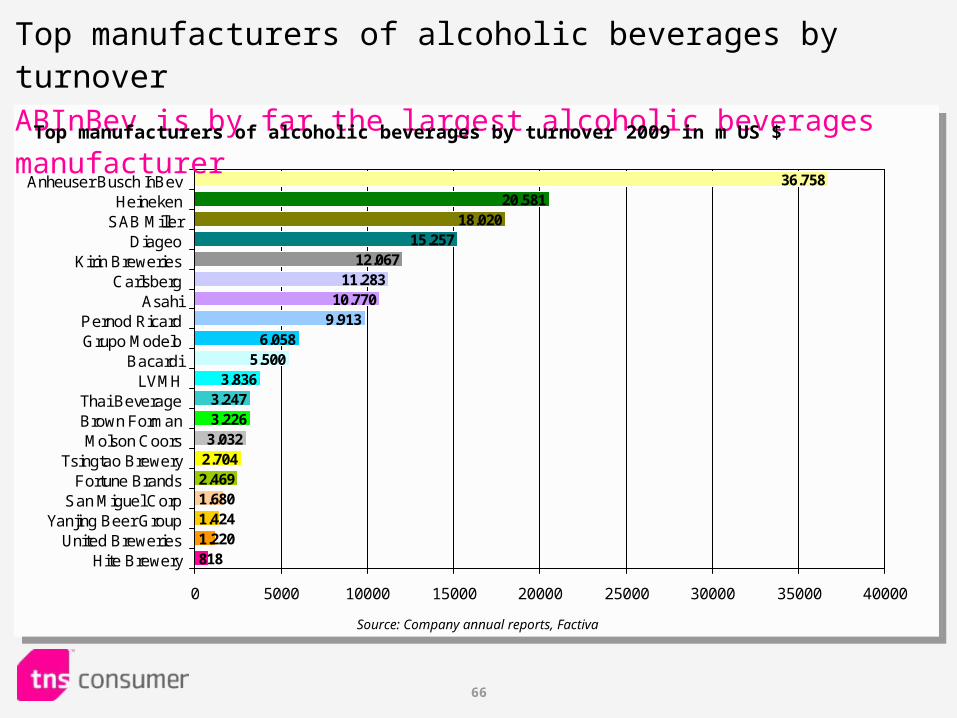
11.28310.770
9.9136.058
5.5003.836
3.2473.2263.032
2.7042.4691.680
818
1.4241.220
12.06715.257
18.02020.581
36.758
0 5000 10000 15000 20000 25000 30000 35000 40000
Anheuser Busch InBevHeineken
SAB MillerDiageo
Kirin BreweriesCarlsberg
AsahiPernod RicardGrupo Modelo
BacardiLVMH
Thai BeverageBrown FormanMolson Coors
Tsingtao BreweryFortune Brands
San Miguel CorpYanjing Beer Group
United BreweriesHite Brewery
Top manufacturers of alcoholic beverages by turnoverABInBev is by far the largest alcoholic beverages manufacturer
Top manufacturers of alcoholic beverages by turnover 2009 in m US $
Source: Company annual reports, Factiva

67
Market for Non-Alcoholic Beverages
68
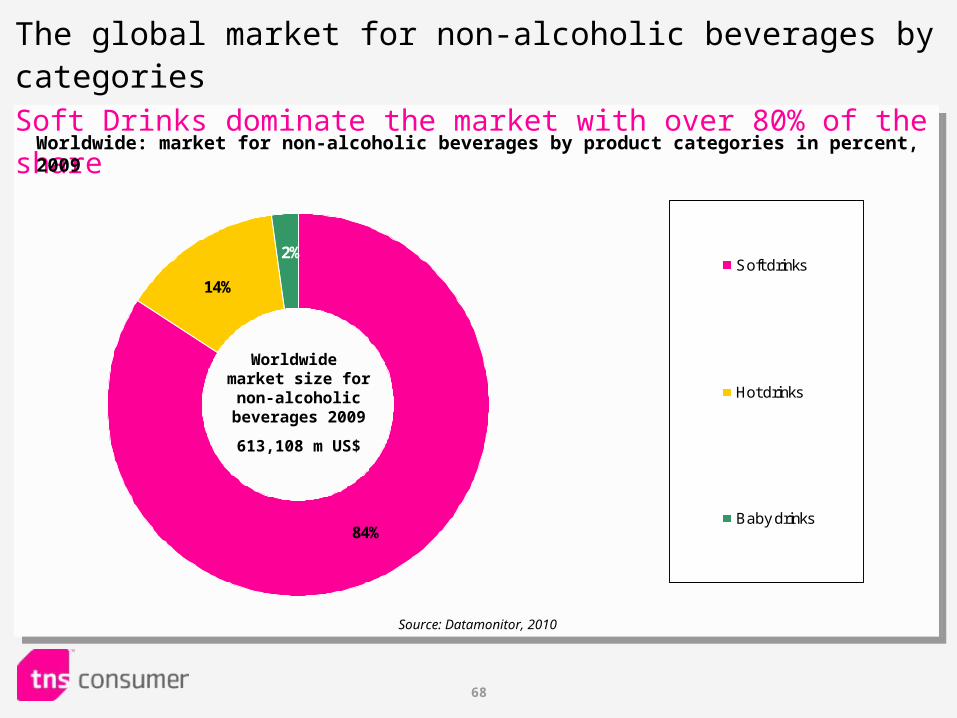
84%
14%
2%Soft drinks
Hot drinks
Baby drinks
The global market for non-alcoholic beverages by categoriesSoft Drinks dominate the market with over 80% of the share
Worldwide: market for non-alcoholic beverages by product categories in percent, 2009
Source: Datamonitor, 2010
Worldwide market size for non-alcoholic beverages
2009
613,108 m US$
69
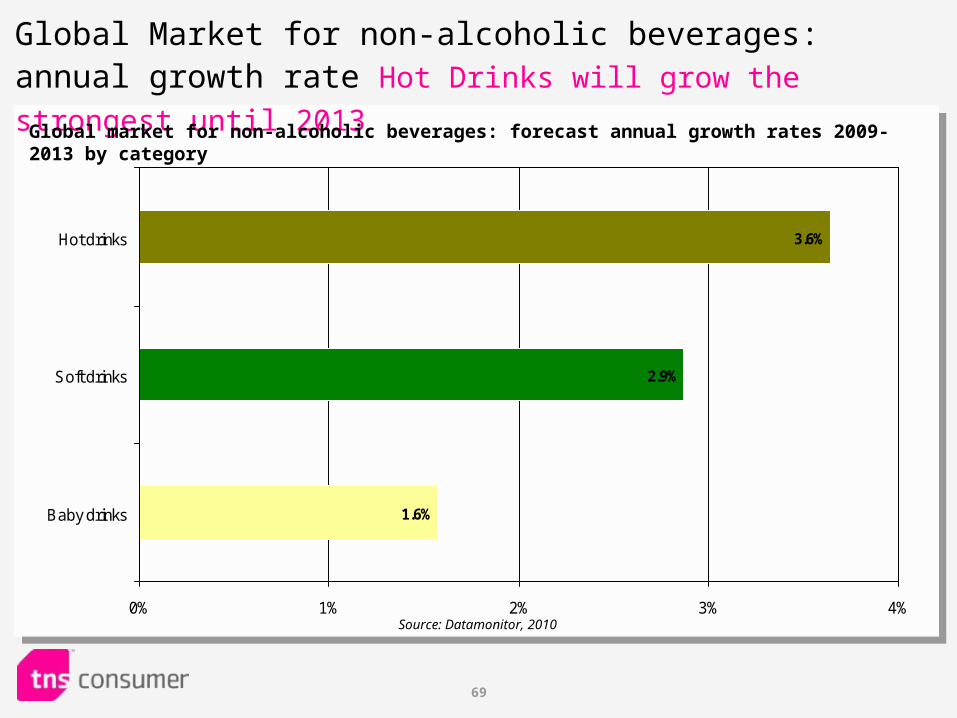
Global Market for non-alcoholic beverages: annual growth rate Hot Drinks will grow the strongest until 2013
3.6%
2.9%
1.6%
0% 1% 2% 3% 4%
Baby drinks
Soft drinks
Hot drinks
Global market for non-alcoholic beverages: forecast annual growth rates 2009-2013 by category
Source: Datamonitor, 2010
70
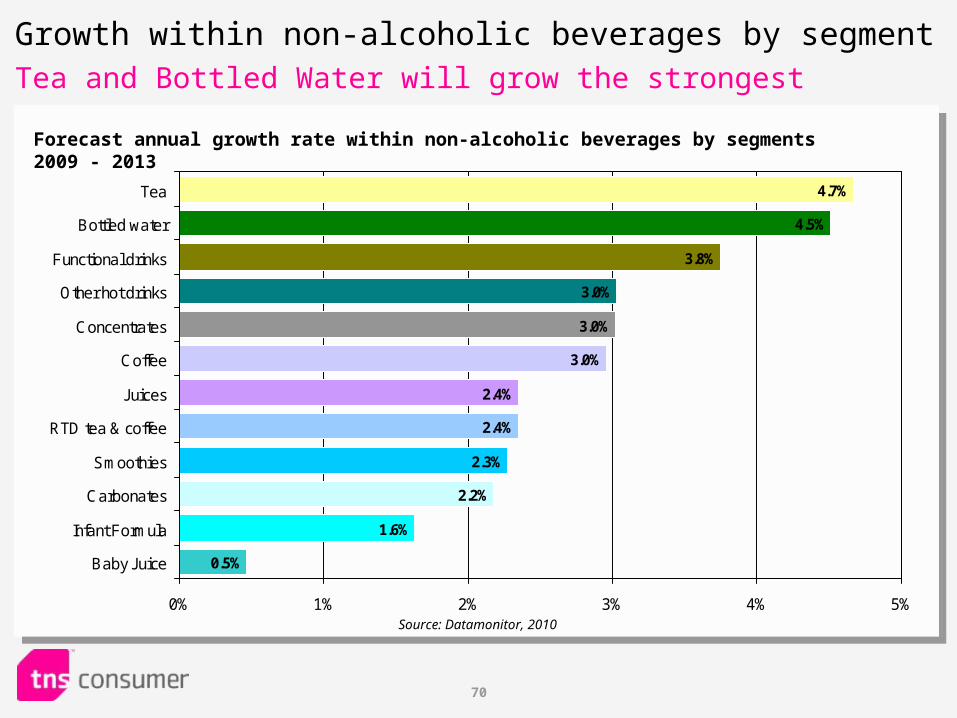
Growth within non-alcoholic beverages by segmentTea and Bottled Water will grow the strongest
3.0%
2.4%
2.4%
2.3%
2.2%
1.6%
0.5%
3.0%
3.0%
3.8%
4.5%
4.7%
0% 1% 2% 3% 4% 5%
Tea
Bottled water
Functional drinks
Other hot drinks
Concentrates
Coffee
Juices
RTD tea & coffee
Smoothies
Carbonates
Infant Formula
Baby Juice
Source: Datamonitor, 2010
Forecast annual growth rate within non-alcoholic beverages by segments 2009 - 2013
71
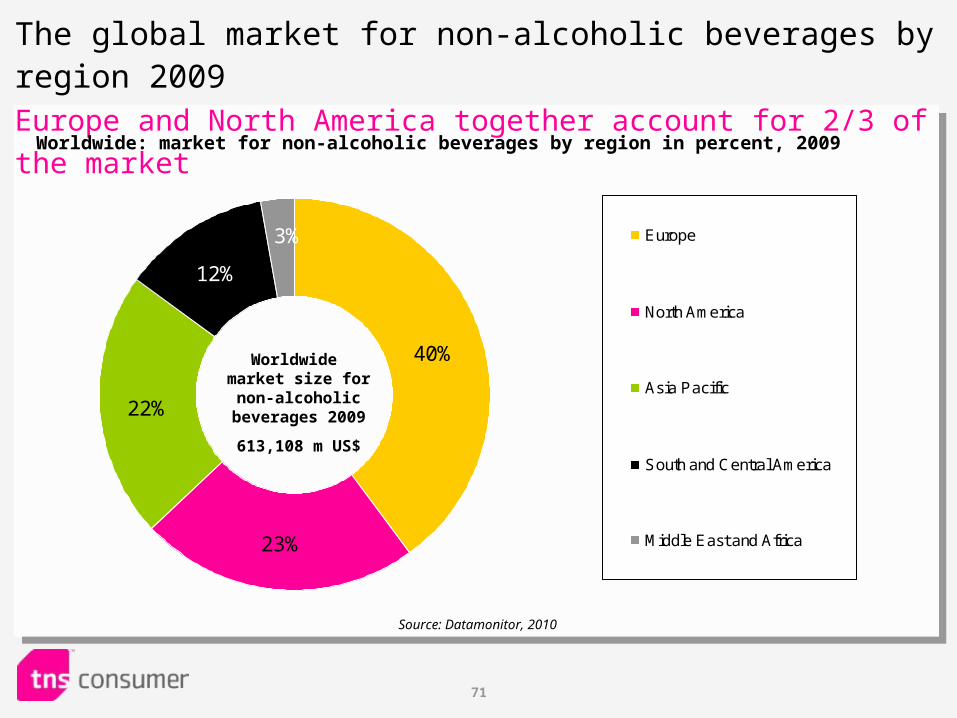
40%
23%
22%
3%
12%
Europe
North America
Asia Pacific
South and Central America
Middle East and Africa
The global market for non-alcoholic beverages by region 2009Europe and North America together account for 2/3 of the market
Worldwide: market for non-alcoholic beverages by region in percent, 2009
Source: Datamonitor, 2010
Worldwide market size for non-alcoholic beverages
2009
613,108 m US$
72
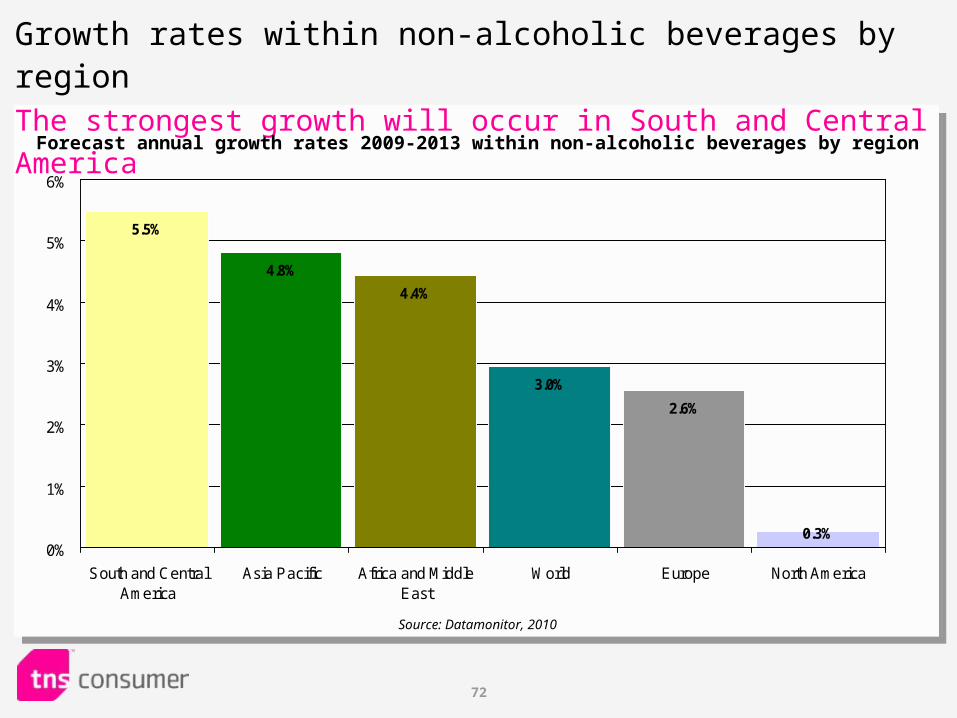
Growth rates within non-alcoholic beverages by regionThe strongest growth will occur in South and Central America
0.3%
2.6%
3.0%
4.4%
4.8%
5.5%
0%
1%
2%
3%
4%
5%
6%
South and CentralAmerica
Asia Pacific Africa and MiddleEast
World Europe North America
Forecast annual growth rates 2009-2013 within non-alcoholic beverages by region
Source: Datamonitor, 2010
73
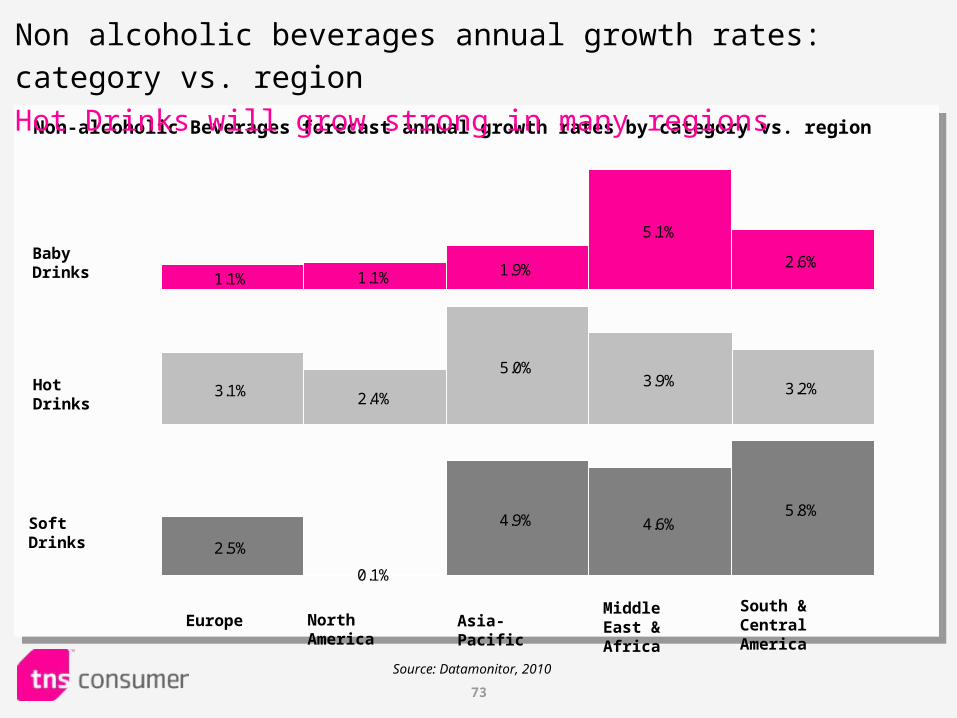
Source: Datamonitor, 2010
Middle East & Africa
South & Central AmericaAsia-PacificNorth AmericaEurope
Soft Drinks
Hot Drinks
Baby Drinks
Non-alcoholic Beverages forecast annual growth rates by category vs. region
2.5%
0.1%
4.9% 4.6%5.8%
Non alcoholic beverages annual growth rates: category vs. region
Hot Drinks will grow strong in many regions
3.1% 2.4%
5.0%3.9% 3.2%
1.1% 1.1% 1.9%
5.1%
2.6%
74
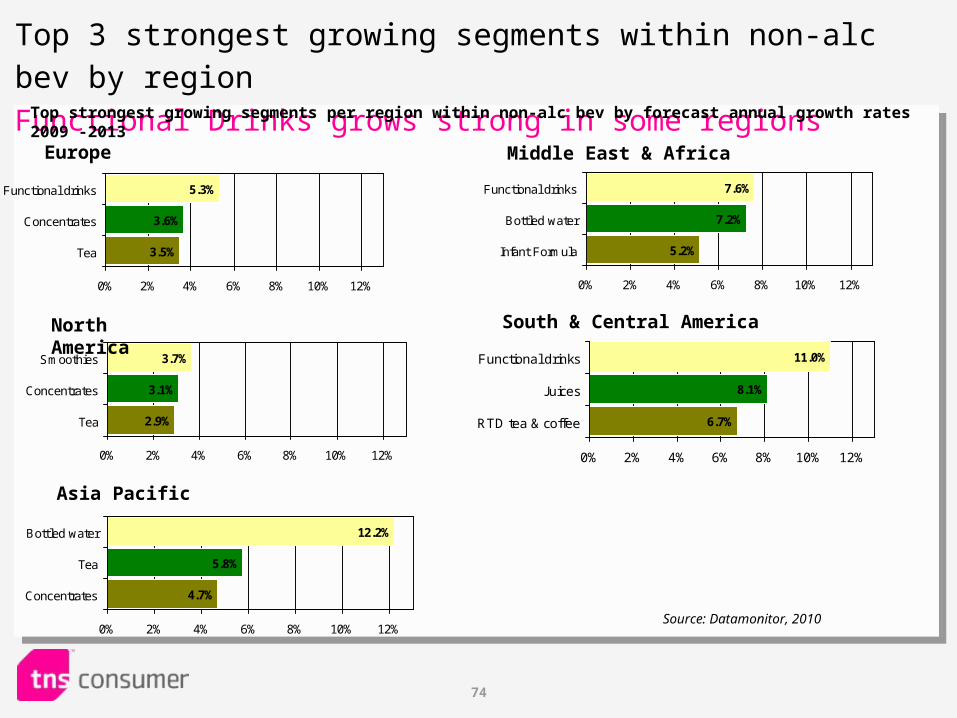
3.5%
3.6%
5.3%
0% 2% 4% 6% 8% 10% 12%
Functional drinks
Concentrates
Tea
Source: Datamonitor, 2010
2.9%
3.1%
3.7%
0% 2% 4% 6% 8% 10% 12%
Smoothies
Concentrates
Tea
4.7%
5.8%
12.2%
0% 2% 4% 6% 8% 10% 12%
Bottled water
Tea
Concentrates
Europe
North America
Asia Pacific
5.2%
7.2%
7.6%
0% 2% 4% 6% 8% 10% 12%
Functional drinks
Bottled water
Infant Formula
South & Central America
6.7%
8.1%
11.0%
0% 2% 4% 6% 8% 10% 12%
Functional drinks
Juices
RTD tea & coffee
Middle East & Africa
Top 3 strongest growing segments within non-alc bev by region
Functional Drinks grows strong in some regionsTop strongest growing segments per region within non-alc bev by forecast annual growth rates 2009 -2013
75
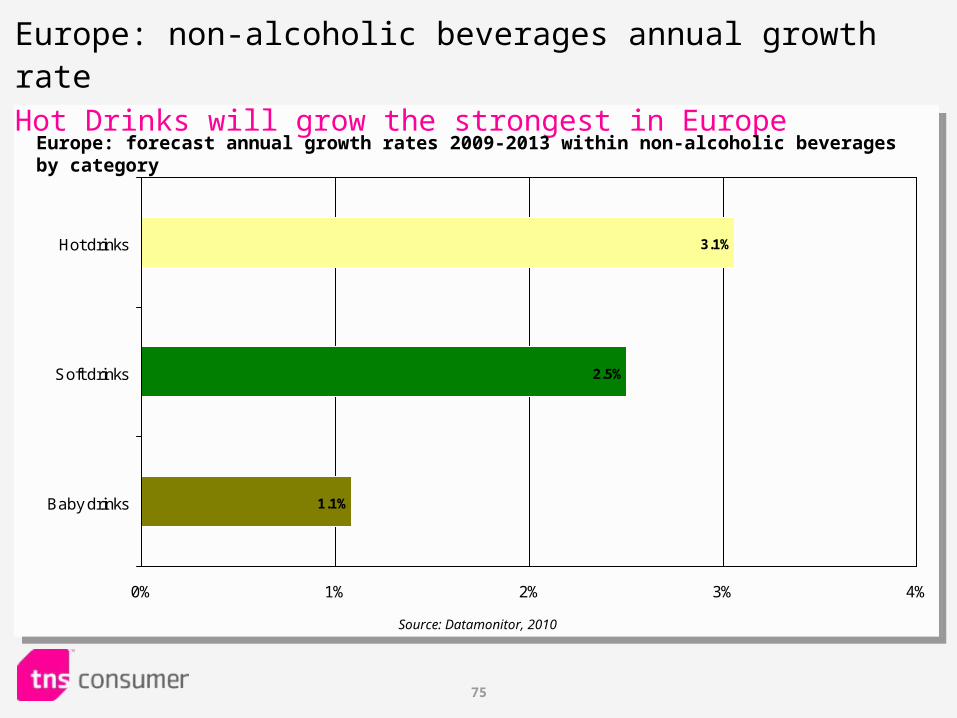
Europe: non-alcoholic beverages annual growth rateHot Drinks will grow the strongest in Europe
1.1%
2.5%
3.1%
0% 1% 2% 3% 4%
Hot drinks
Soft drinks
Baby drinks
Europe: forecast annual growth rates 2009-2013 within non-alcoholic beverages by category
Source: Datamonitor, 2010
76
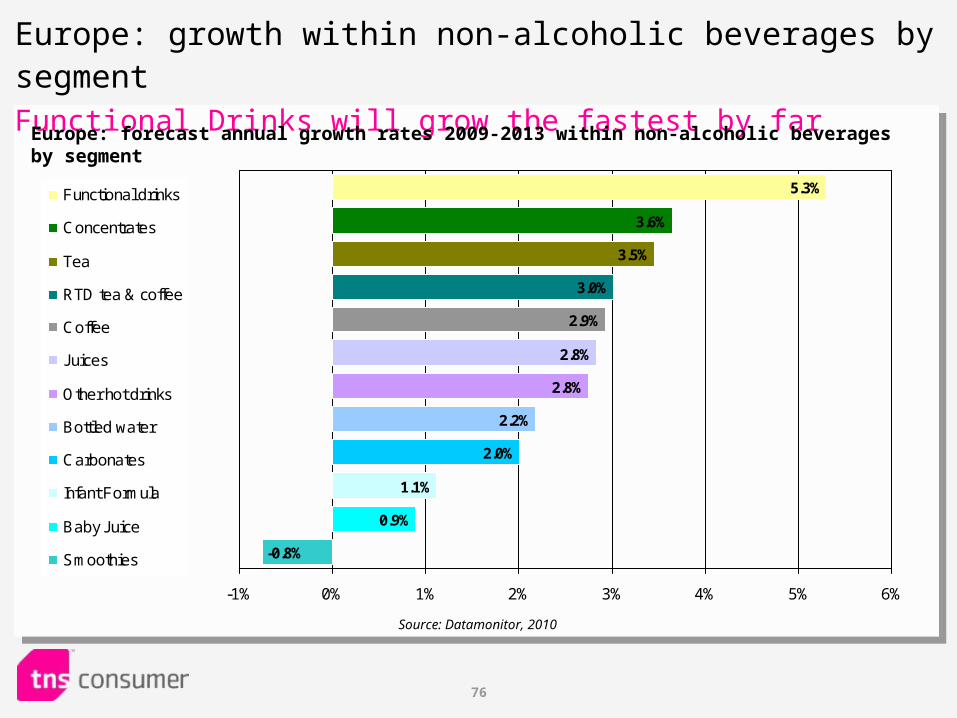
2.8%
2.8%
2.2%
2.0%
1.1%
0.9%
-0.8%
2.9%
3.0%
3.5%
3.6%
5.3%
-1% 0% 1% 2% 3% 4% 5% 6%
Functional drinks
Concentrates
Tea
RTD tea & coffee
Coffee
Juices
Other hot drinks
Bottled water
Carbonates
Infant Formula
Baby Juice
Smoothies
Europe: growth within non-alcoholic beverages by segmentFunctional Drinks will grow the fastest by far
Europe: forecast annual growth rates 2009-2013 within non-alcoholic beverages by segment
Source: Datamonitor, 2010
77
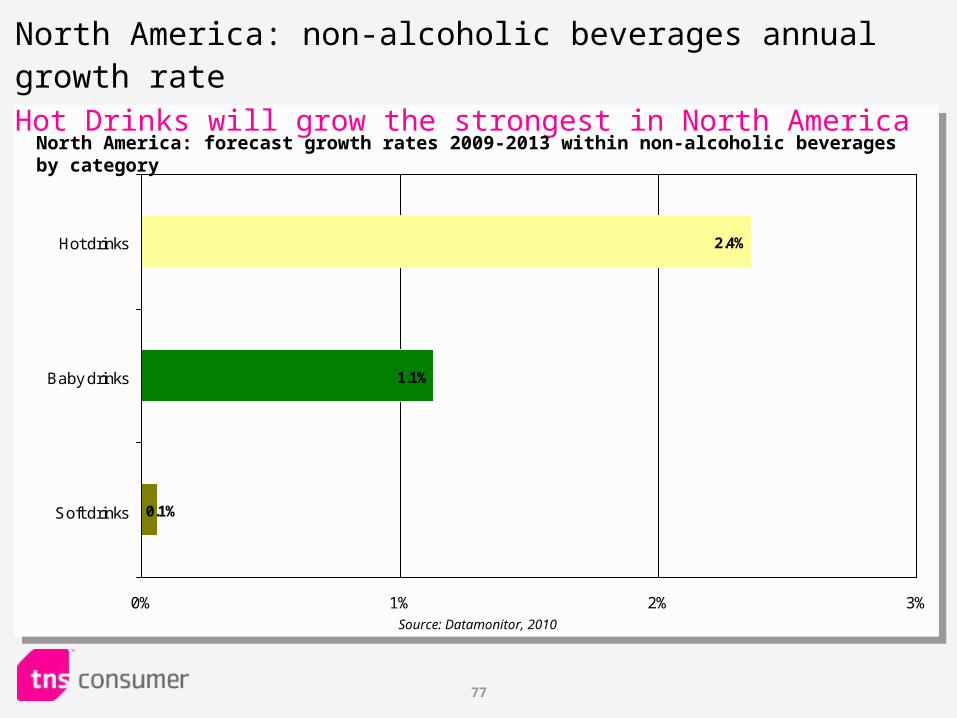
North America: non-alcoholic beverages annual growth rate Hot Drinks will grow the strongest in North America
0.1%
1.1%
2.4%
0% 1% 2% 3%
Hot drinks
Baby drinks
Soft drinks
North America: forecast growth rates 2009-2013 within non-alcoholic beverages by category
Source: Datamonitor, 2010
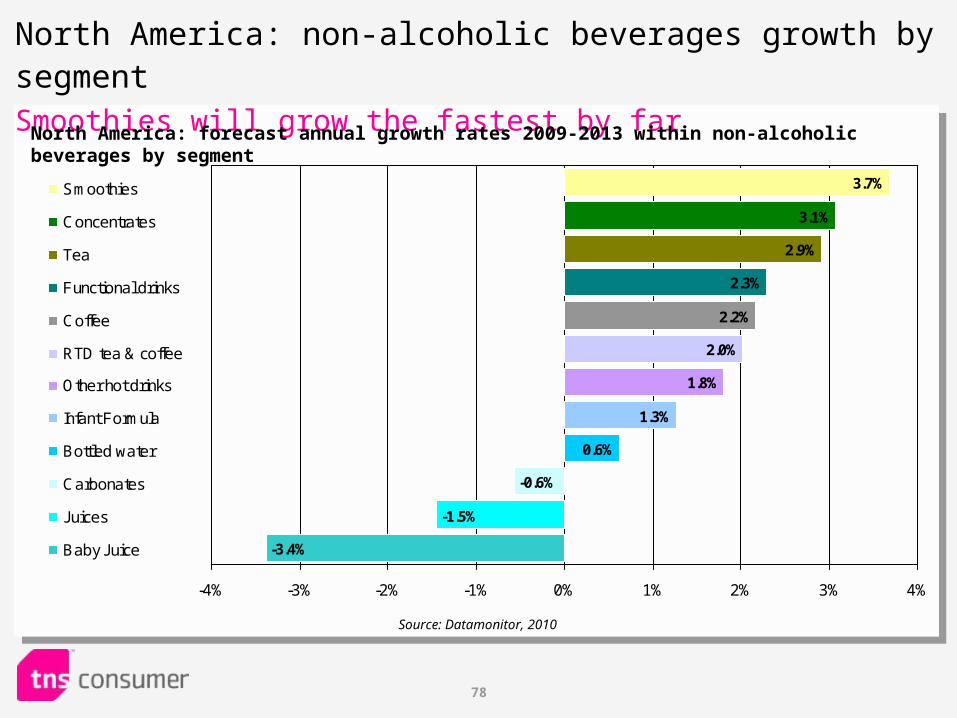
78
2.0%
1.8%
1.3%
0.6%
-0.6%
-1.5%
-3.4%
2.2%
2.3%
2.9%
3.1%
3.7%
-4% -3% -2% -1% 0% 1% 2% 3% 4%
Smoothies
Concentrates
Tea
Functional drinks
Coffee
RTD tea & coffee
Other hot drinks
Infant Formula
Bottled water
Carbonates
Juices
Baby Juice
North America: non-alcoholic beverages growth by segmentSmoothies will grow the fastest by far
North America: forecast annual growth rates 2009-2013 within non-alcoholic beverages by segment
Source: Datamonitor, 2010
79
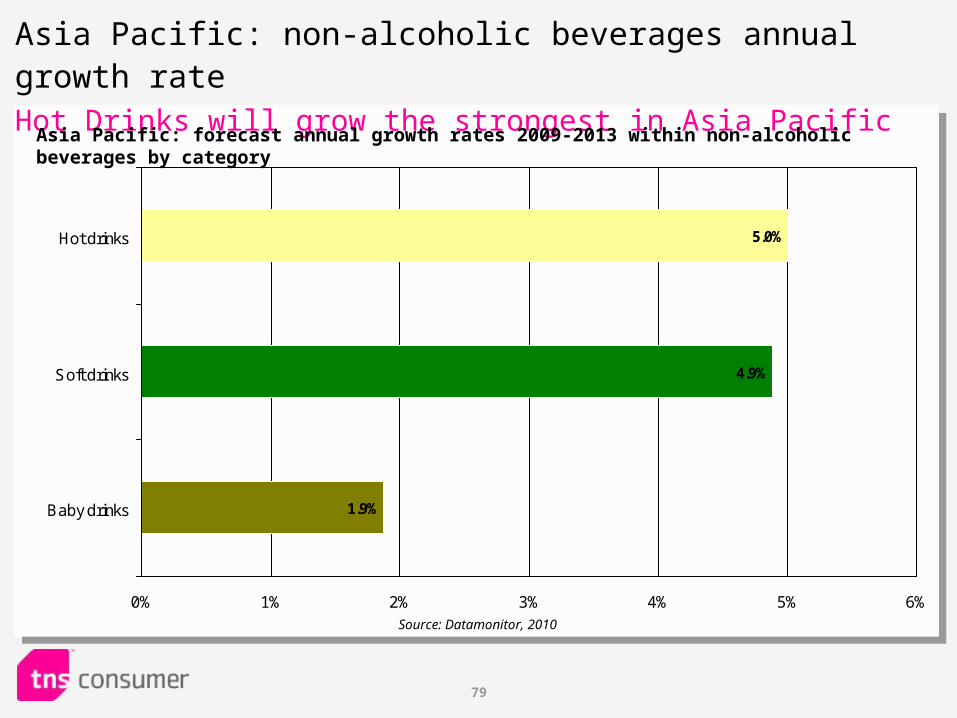
Asia Pacific: non-alcoholic beverages annual growth rate Hot Drinks will grow the strongest in Asia Pacific
1.9%
4.9%
5.0%
0% 1% 2% 3% 4% 5% 6%
Hot drinks
Soft drinks
Baby drinks
Asia Pacific: forecast annual growth rates 2009-2013 within non-alcoholic beverages by category
Source: Datamonitor, 2010
80
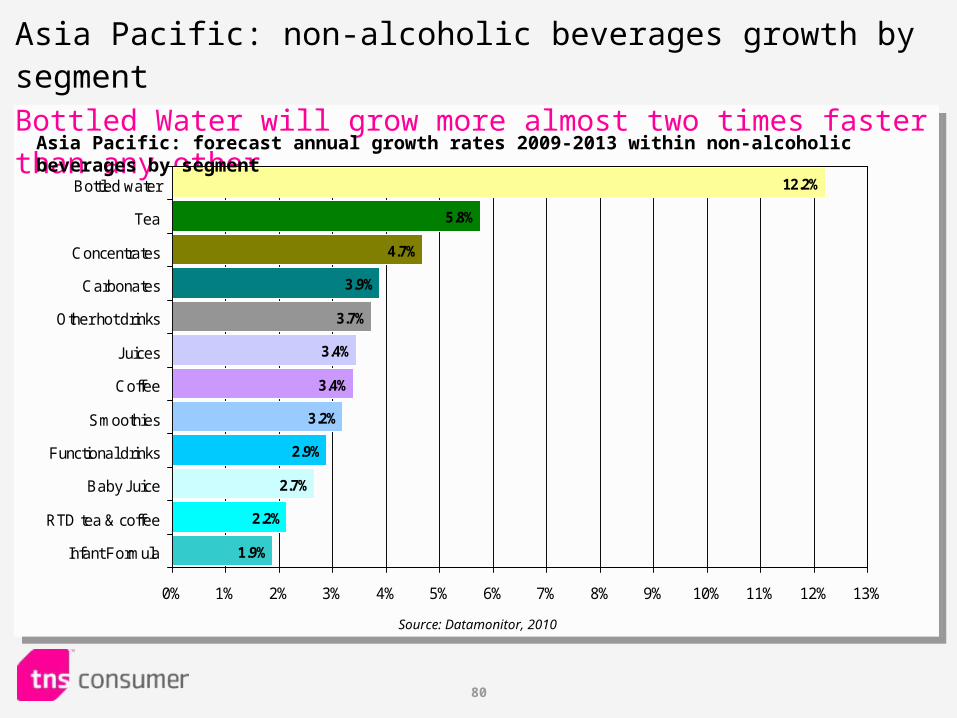
Asia Pacific: non-alcoholic beverages growth by segmentBottled Water will grow more almost two times faster than any other
3.4%
3.4%
3.2%
2.9%
2.7%
2.2%
1.9%
3.7%
3.9%
4.7%
5.8%
12.2%
0% 1% 2% 3% 4% 5% 6% 7% 8% 9% 10% 11% 12% 13%
Bottled water
Tea
Concentrates
Carbonates
Other hot drinks
Juices
Coffee
Smoothies
Functional drinks
Baby Juice
RTD tea & coffee
Infant Formula
Asia Pacific: forecast annual growth rates 2009-2013 within non-alcoholic beverages by segment
Source: Datamonitor, 2010
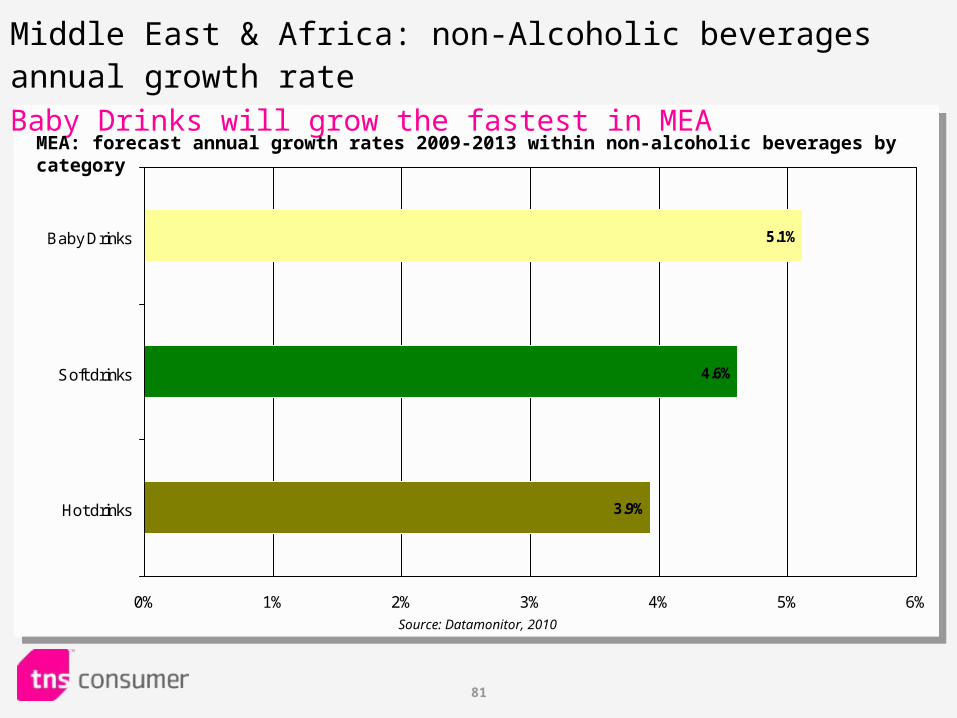
81
Middle East & Africa: non-Alcoholic beverages annual growth rate Baby Drinks will grow the fastest in MEA
5.1%
4.6%
3.9%
0% 1% 2% 3% 4% 5% 6%
Baby Drinks
Soft drinks
Hot drinks
MEA: forecast annual growth rates 2009-2013 within non-alcoholic beverages by category
Source: Datamonitor, 2010
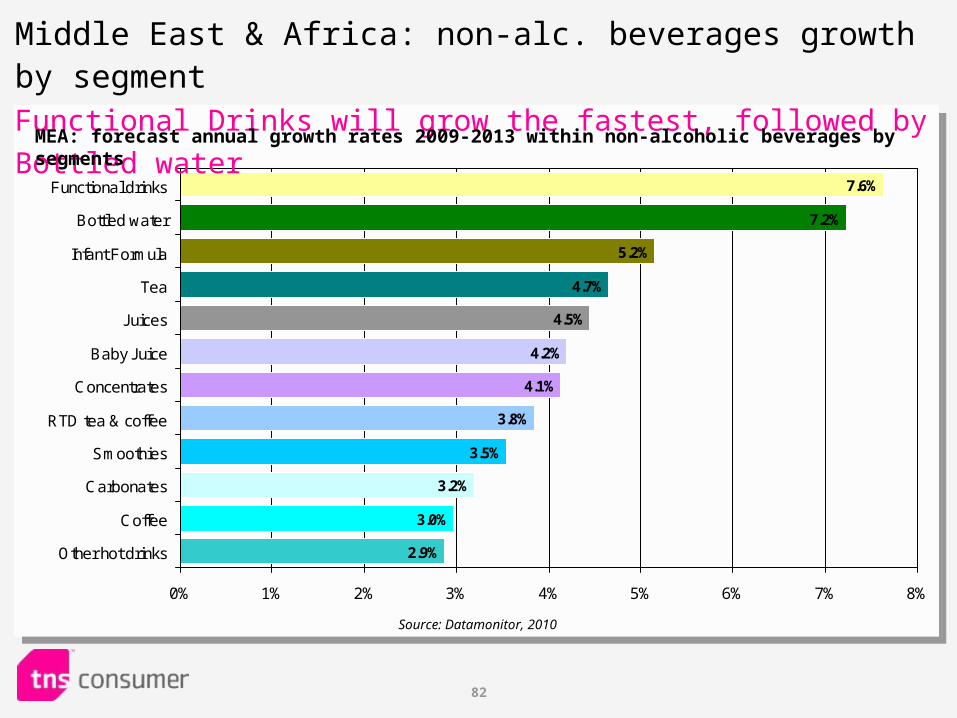
82
4.2%
4.1%
3.8%
3.5%
3.2%
3.0%
2.9%
4.5%
4.7%
5.2%
7.2%
7.6%
0% 1% 2% 3% 4% 5% 6% 7% 8%
Functional drinks
Bottled water
Infant Formula
Tea
Juices
Baby Juice
Concentrates
RTD tea & coffee
Smoothies
Carbonates
Coffee
Other hot drinks
Middle East & Africa: non-alc. beverages growth by segmentFunctional Drinks will grow the fastest, followed by Bottled water
MEA: forecast annual growth rates 2009-2013 within non-alcoholic beverages by segments
Source: Datamonitor, 2010
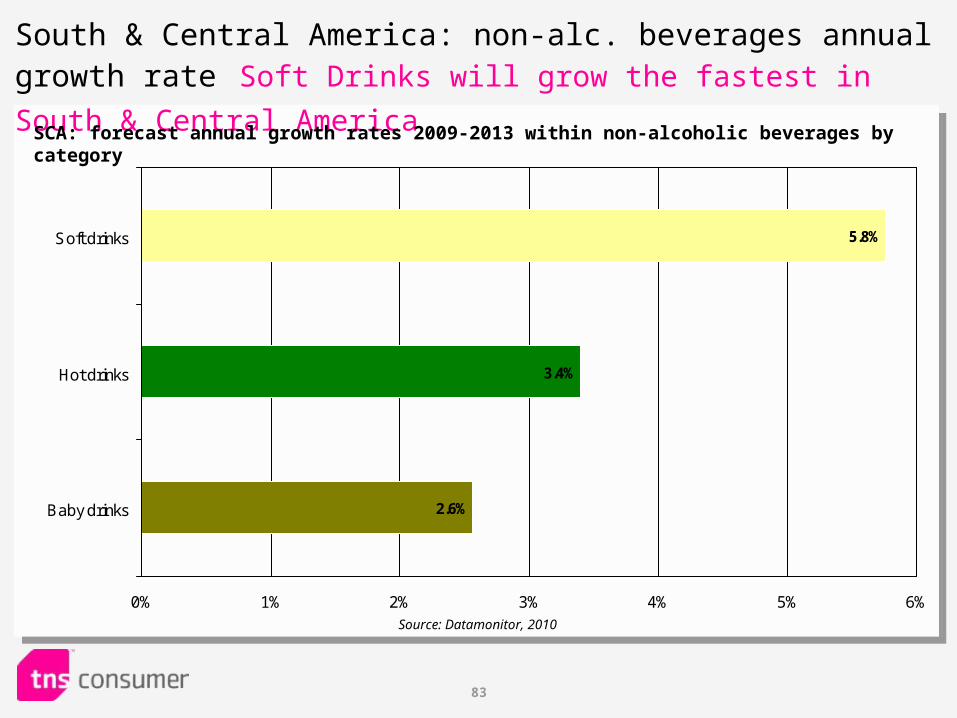
83
South & Central America: non-alc. beverages annual growth rate Soft Drinks will grow the fastest in South & Central America
2.6%
3.4%
5.8%
0% 1% 2% 3% 4% 5% 6%
Soft drinks
Hot drinks
Baby drinks
SCA: forecast annual growth rates 2009-2013 within non-alcoholic beverages by category
Source: Datamonitor, 2010
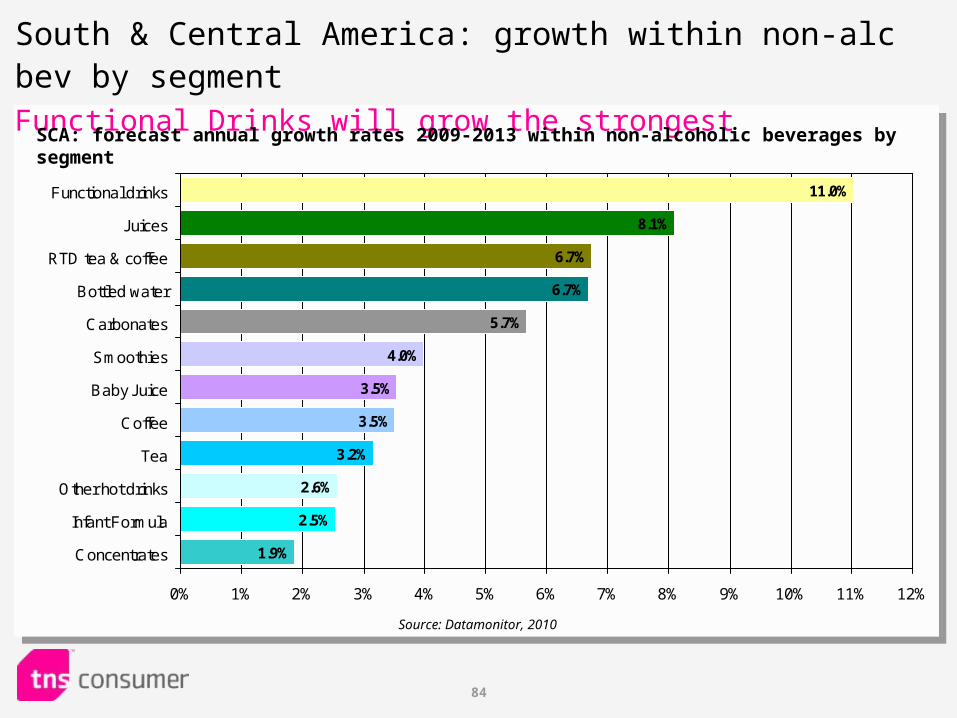
84
4.0%
3.5%
3.5%
3.2%
2.6%
2.5%
1.9%
5.7%
6.7%
6.7%
8.1%
11.0%
0% 1% 2% 3% 4% 5% 6% 7% 8% 9% 10% 11% 12%
Functional drinks
Juices
RTD tea & coffee
Bottled water
Carbonates
Smoothies
Baby Juice
Coffee
Tea
Other hot drinks
Infant Formula
Concentrates
South & Central America: growth within non-alc bev by segmentFunctional Drinks will grow the strongest
SCA: forecast annual growth rates 2009-2013 within non-alcoholic beverages by segment
Source: Datamonitor, 2010
85
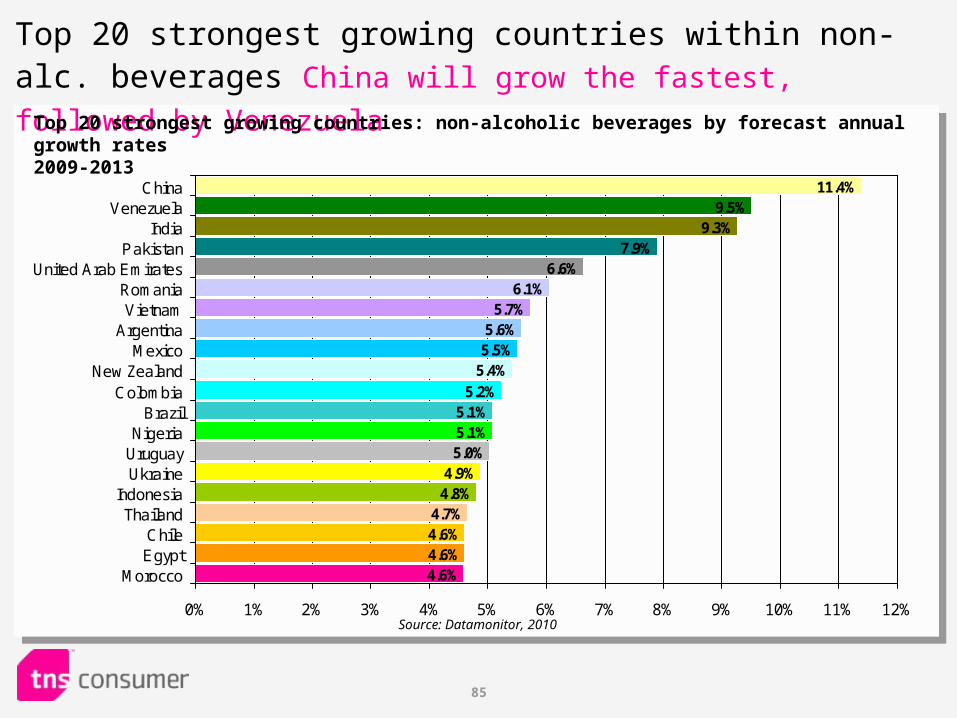
Top 20 strongest growing countries within non-alc. beverages China will grow the fastest, followed by Venezuela
6.1%5.7%
5.6%5.5%
5.4%
5.2%5.1%5.1%5.0%
4.9%4.8%
4.7%
4.6%
4.6%4.6%
6.6%7.9%
9.3%9.5%
11.4%
0% 1% 2% 3% 4% 5% 6% 7% 8% 9% 10% 11% 12%
ChinaVenezuela
IndiaPakistan
United Arab EmiratesRomaniaVietnam
ArgentinaMexico
New ZealandColombia
BrazilNigeria
UruguayUkraine
IndonesiaThailand
ChileEgypt
Morocco
Top 20 strongest growing countries: non-alcoholic beverages by forecast annual growth rates 2009-2013
Source: Datamonitor, 2010
86
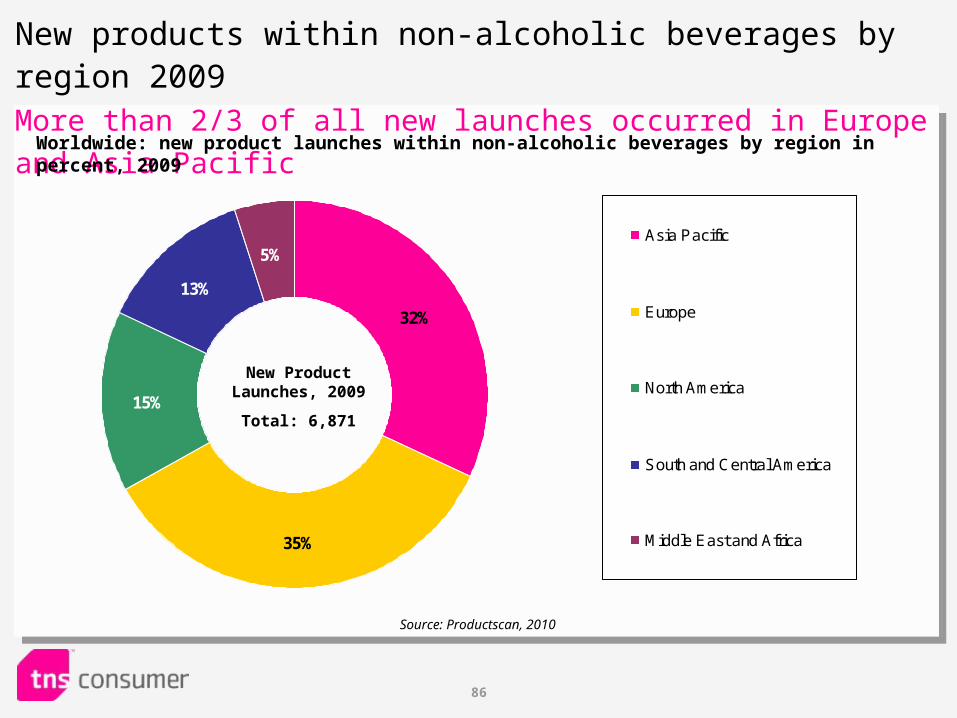
32%
35%
15%
13%
5%Asia Pacific
Europe
North America
South and Central America
Middle East and Africa
New products within non-alcoholic beverages by region 2009More than 2/3 of all new launches occurred in Europe and Asia Pacific
Worldwide: new product launches within non-alcoholic beverages by region in percent, 2009
New Product Launches, 2009
Total: 6,871
Source: Productscan, 2010
87
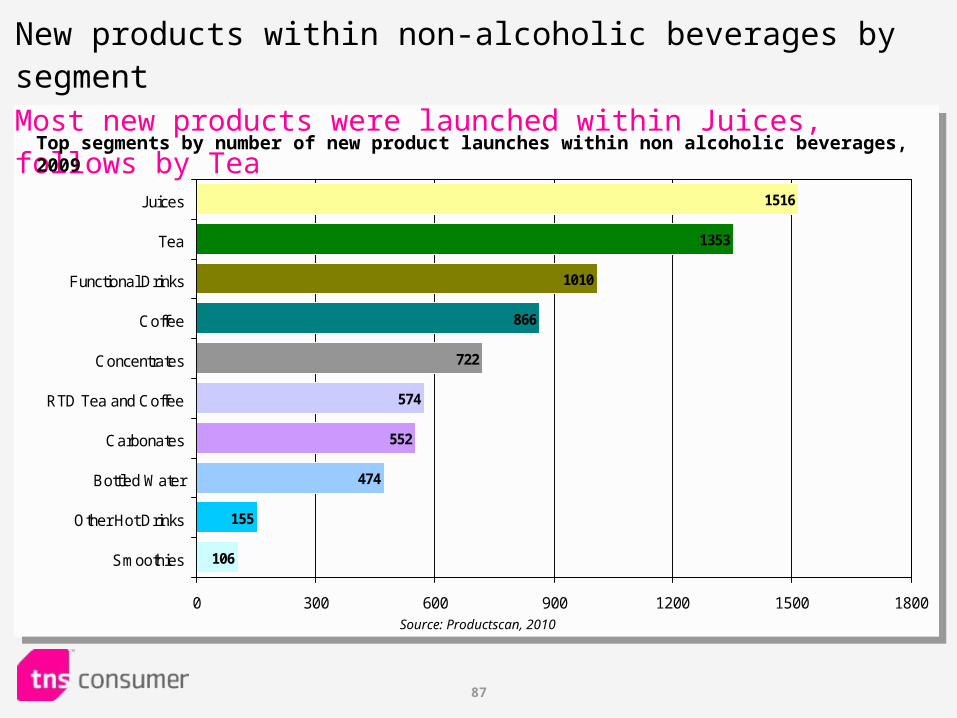
1516
1353
1010
866
722
106
155
474
552
574
0 300 600 900 1200 1500 1800
Juices
Tea
Functional Drinks
Coffee
Concentrates
RTD Tea and Coffee
Carbonates
Bottled Water
Other Hot Drinks
Smoothies
New products within non-alcoholic beverages by segmentMost new products were launched within Juices, follows by Tea
Top segments by number of new product launches within non alcoholic beverages, 2009
Source: Productscan, 2010
88
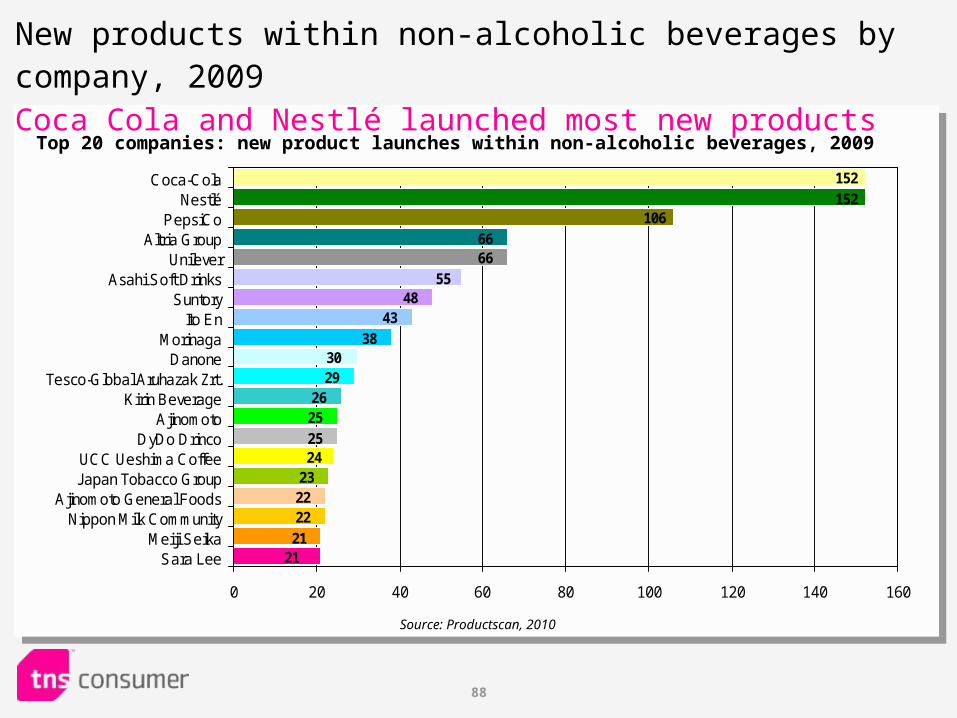
New products within non-alcoholic beverages by company, 2009Coca Cola and Nestlé launched most new products
152152
1066666
2122
21
222324252526
2930
3843
4855
0 20 40 60 80 100 120 140 160
Coca-ColaNestlé
PepsiCoAltria Group
UnileverAsahi Soft Drinks
SuntoryIto En
MorinagaDanone
Tesco-Global Aruhazak Zrt.Kirin Beverage
AjinomotoDyDo Drinco
UCC Ueshima CoffeeJapan Tobacco Group
Ajinomoto General FoodsNippon Milk Community
Meiji SeikaSara Lee
Top 20 companies: new product launches within non-alcoholic beverages, 2009
Source: Productscan, 2010
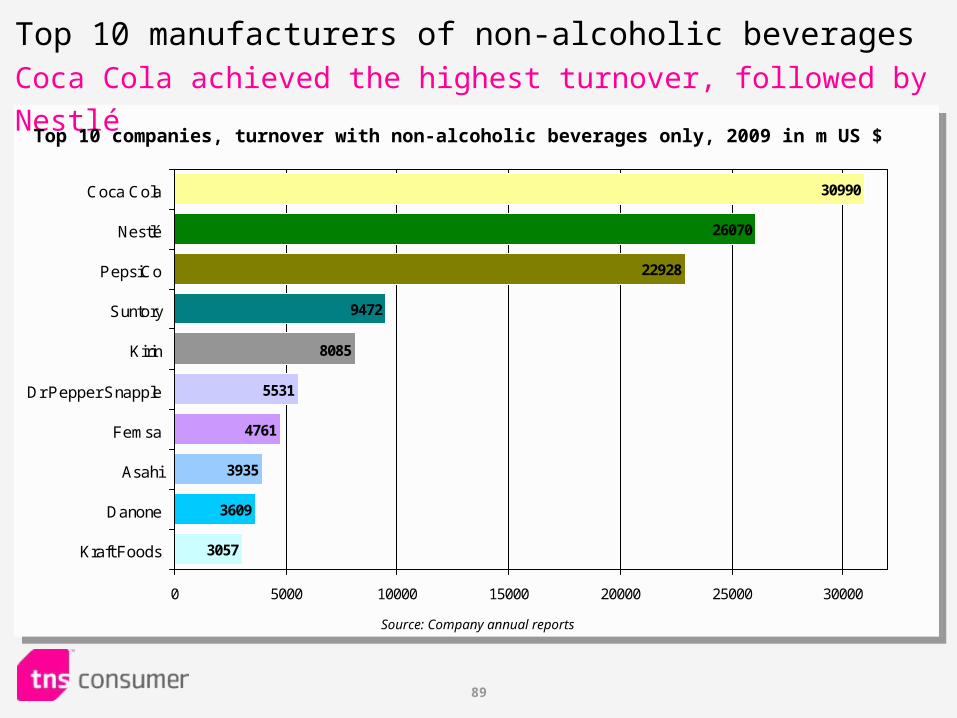
89
5531
4761
3935
3609
3057
8085
9472
22928
26070
30990
0 5000 10000 15000 20000 25000 30000
Coca Cola
Nestlé
PepsiCo
Suntory
Kirin
Dr Pepper Snapple
Femsa
Asahi
Danone
Kraft Foods
Top 10 manufacturers of non-alcoholic beveragesCoca Cola achieved the highest turnover, followed by Nestlé
Top 10 companies, turnover with non-alcoholic beverages only, 2009 in m US $
Source: Company annual reports

90
Market for Tobacco
91
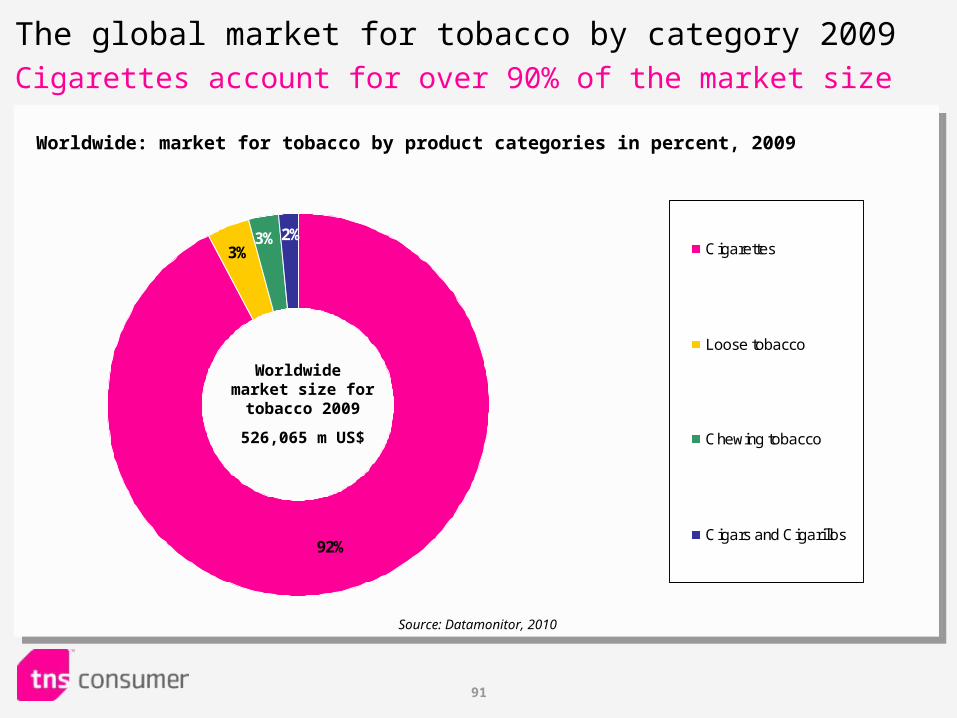
92%
3%2%3%
Cigarettes
Loose tobacco
Chewing tobacco
Cigars and Cigarillos
The global market for tobacco by category 2009Cigarettes account for over 90% of the market size
Worldwide: market for tobacco by product categories in percent, 2009
Source: Datamonitor, 2010
Worldwide market size for tobacco 2009
526,065 m US$
92
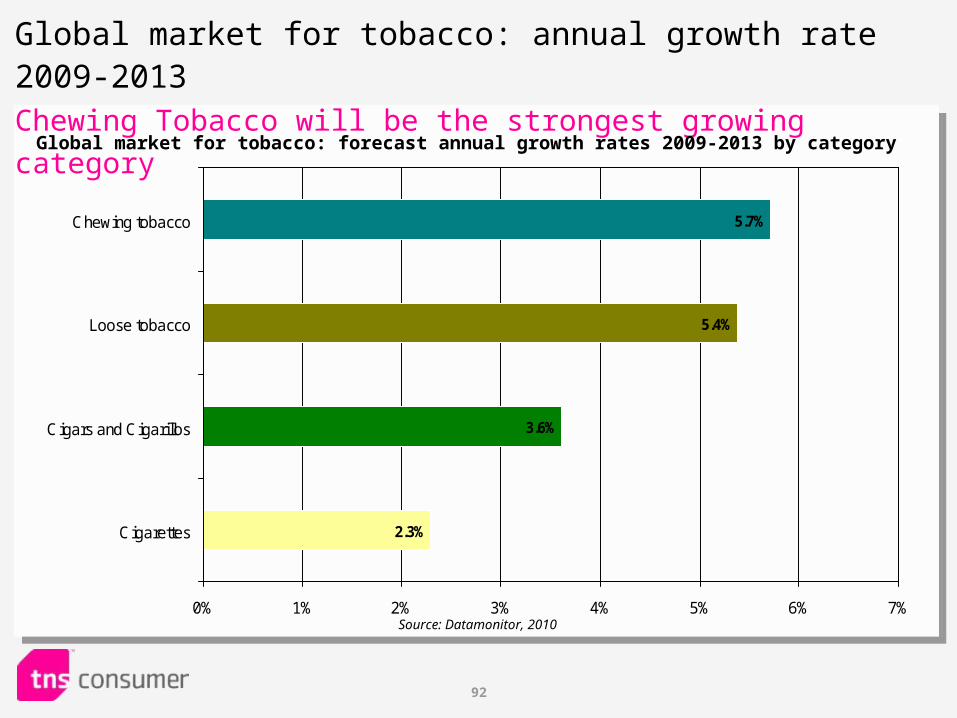
Global market for tobacco: annual growth rate 2009-2013Chewing Tobacco will be the strongest growing category
5.7%
5.4%
3.6%
2.3%
0% 1% 2% 3% 4% 5% 6% 7%
Cigarettes
Cigars and Cigarillos
Loose tobacco
Chewing tobacco
Global market for tobacco: forecast annual growth rates 2009-2013 by category
Source: Datamonitor, 2010
93
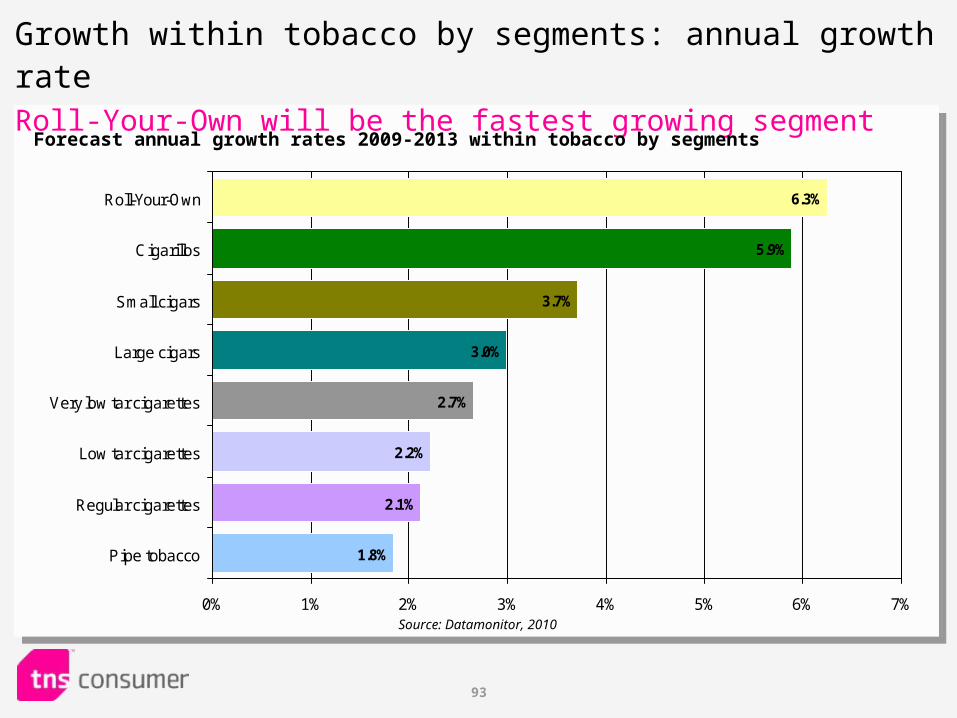
Growth within tobacco by segments: annual growth rate Roll-Your-Own will be the fastest growing segment
2.2%
2.1%
1.8%
2.7%
3.0%
3.7%
5.9%
6.3%
0% 1% 2% 3% 4% 5% 6% 7%
Roll-Your-Own
Cigarillos
Small cigars
Large cigars
Very low tar cigarettes
Low tar cigarettes
Regular cigarettes
Pipe tobacco
Source: Datamonitor, 2010
Forecast annual growth rates 2009-2013 within tobacco by segments
94
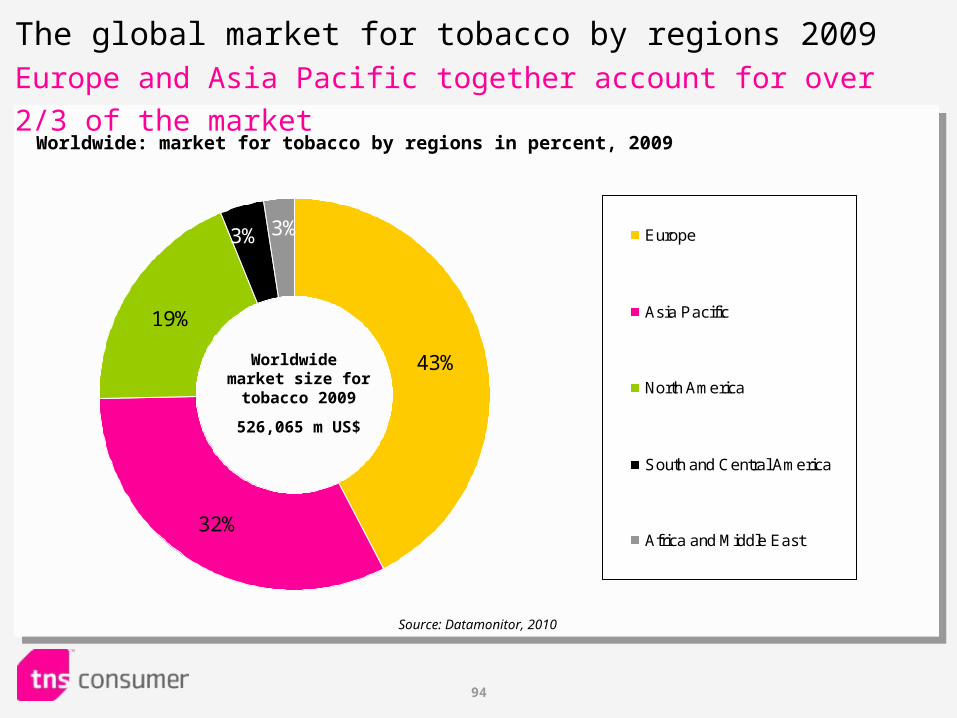
43%
32%
19%
3%3% Europe
Asia Pacific
North America
South and Central America
Africa and Middle East
The global market for tobacco by regions 2009Europe and Asia Pacific together account for over 2/3 of the market
Worldwide: market for tobacco by regions in percent, 2009
Source: Datamonitor, 2010
Worldwide market size for tobacco 2009
526,065 m US$
95
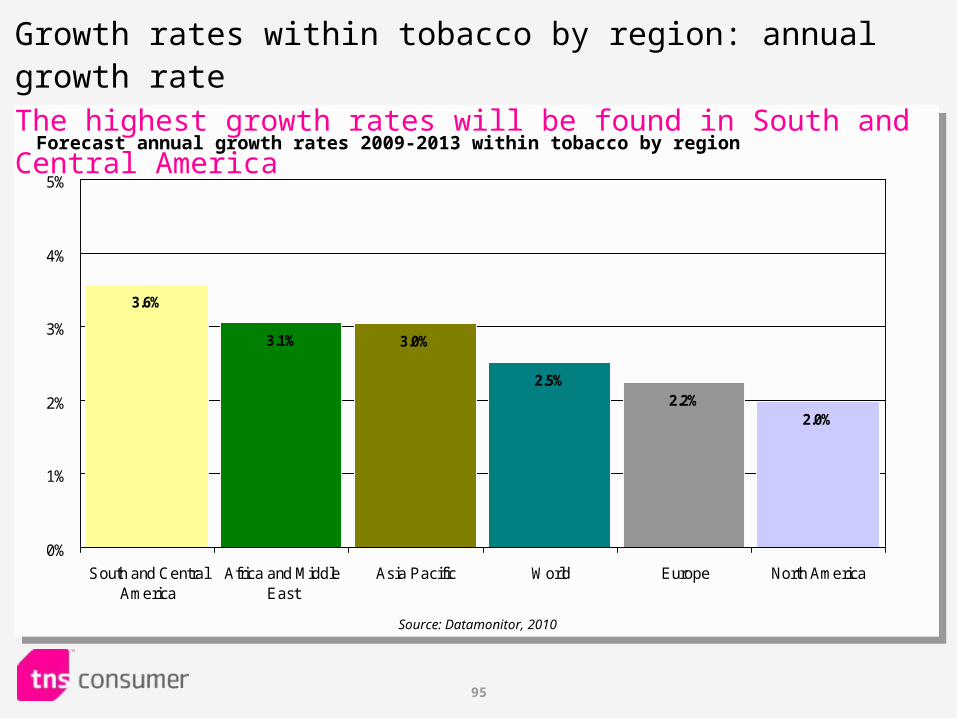
Growth rates within tobacco by region: annual growth rate The highest growth rates will be found in South and Central America
2.0%2.2%
2.5%
3.0%3.1%
3.6%
0%
1%
2%
3%
4%
5%
South and CentralAmerica
Africa and MiddleEast
Asia Pacific World Europe North America
Forecast annual growth rates 2009-2013 within tobacco by region
Source: Datamonitor, 2010
96
Source: Datamonitor, 2010
Middle East & Africa
South & Central AmericaAsia-PacificNorth AmericaEurope
Loose tobacco
Cigars and Cigarillos
Chewing tobacco
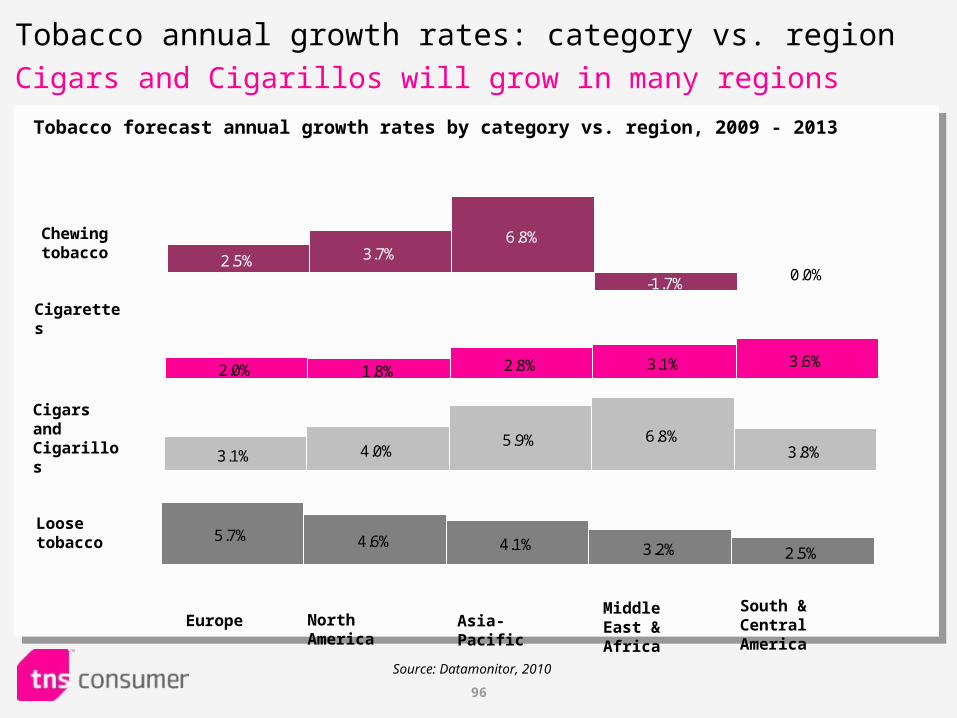
Tobacco forecast annual growth rates by category vs. region, 2009 - 2013
5.7% 4.6% 4.1% 3.2% 2.5%
Tobacco annual growth rates: category vs. region
Cigars and Cigarillos will grow in many regions
3.1% 4.0%5.9% 6.8%
3.8%
Cigarettes
2.0% 1.8% 2.8% 3.1% 3.6%
2.5% 3.7%6.8%
-1.7%0.0%
97
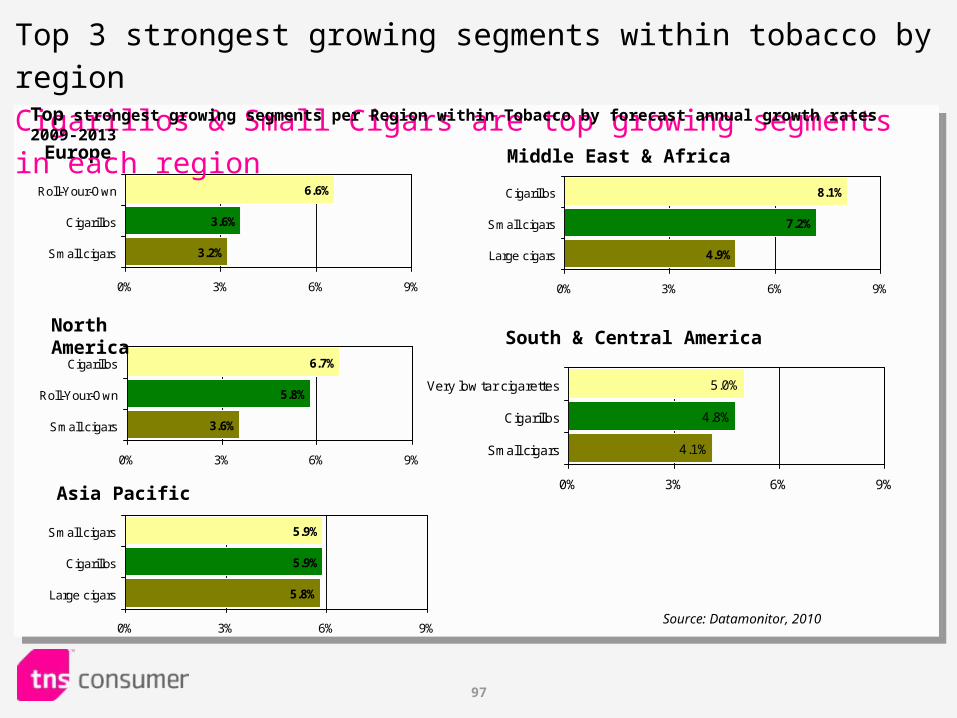
3.2%
3.6%
6.6%
0% 3% 6% 9%
Roll-Your-Own
Cigarillos
Small cigars
Source: Datamonitor, 2010
3.6%
5.8%
6.7%
0% 3% 6% 9%
Cigarillos
Roll-Your-Own
Small cigars
5.8%
5.9%
5.9%
0% 3% 6% 9%
Small cigars
Cigarillos
Large cigars
Europe
North America
Asia Pacific
4.9%
7.2%
8.1%
0% 3% 6% 9%
Cigarillos
Small cigars
Large cigars
South & Central America
4.1%
4.8%
5.0%
0% 3% 6% 9%
Very low tar cigarettes
Cigarillos
Small cigars
Middle East & Africa
Top 3 strongest growing segments within tobacco by region
Cigarillos & Small Cigars are top growing segments in each regionTop strongest growing segments per Region within Tobacco by forecast annual growth rates 2009-2013
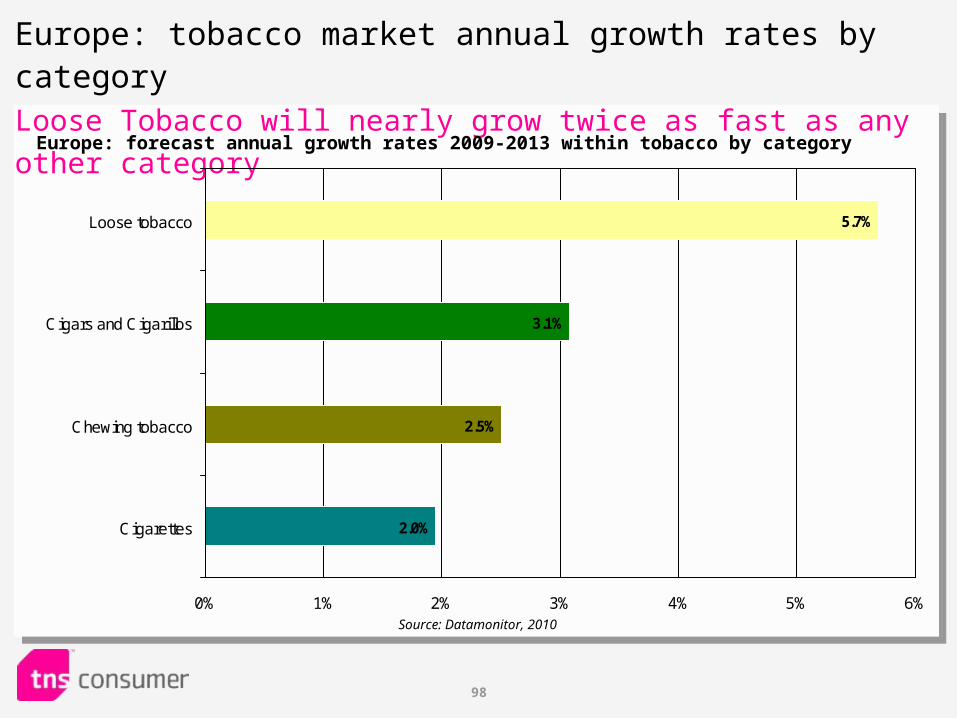
98
Europe: tobacco market annual growth rates by category Loose Tobacco will nearly grow twice as fast as any other category
2.0%
2.5%
3.1%
5.7%
0% 1% 2% 3% 4% 5% 6%
Loose tobacco
Cigars and Cigarillos
Chewing tobacco
Cigarettes
Europe: forecast annual growth rates 2009-2013 within tobacco by category
Source: Datamonitor, 2010
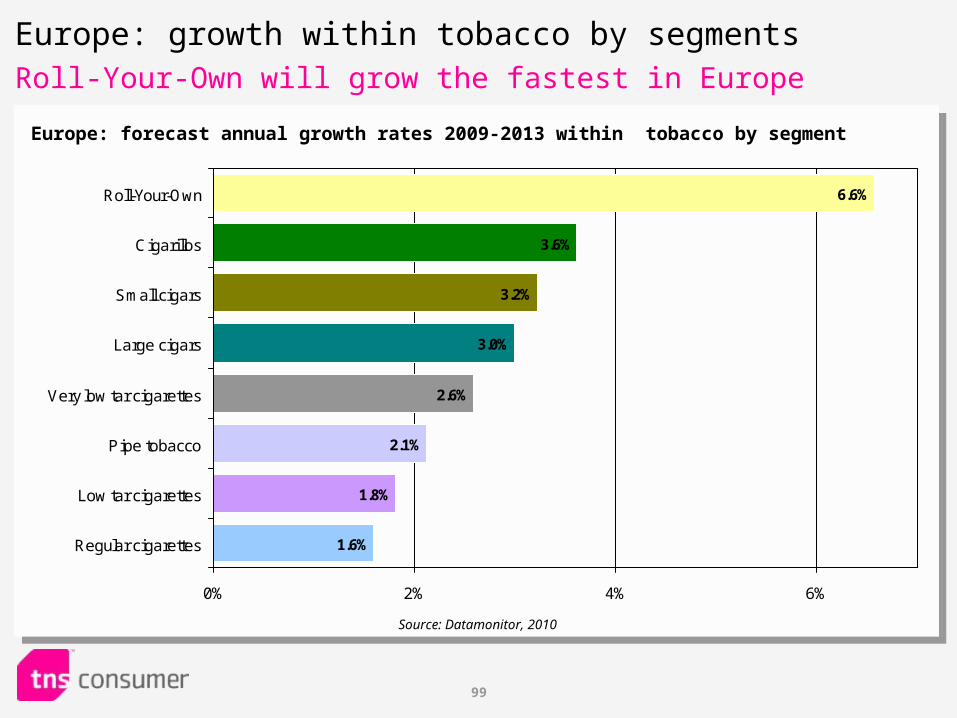
99
2.1%
1.8%
1.6%
2.6%
3.0%
3.2%
3.6%
6.6%
0% 2% 4% 6%
Roll-Your-Own
Cigarillos
Small cigars
Large cigars
Very low tar cigarettes
Pipe tobacco
Low tar cigarettes
Regular cigarettes
Europe: growth within tobacco by segments Roll-Your-Own will grow the fastest in Europe
Europe: forecast annual growth rates 2009-2013 within tobacco by segment
Source: Datamonitor, 2010
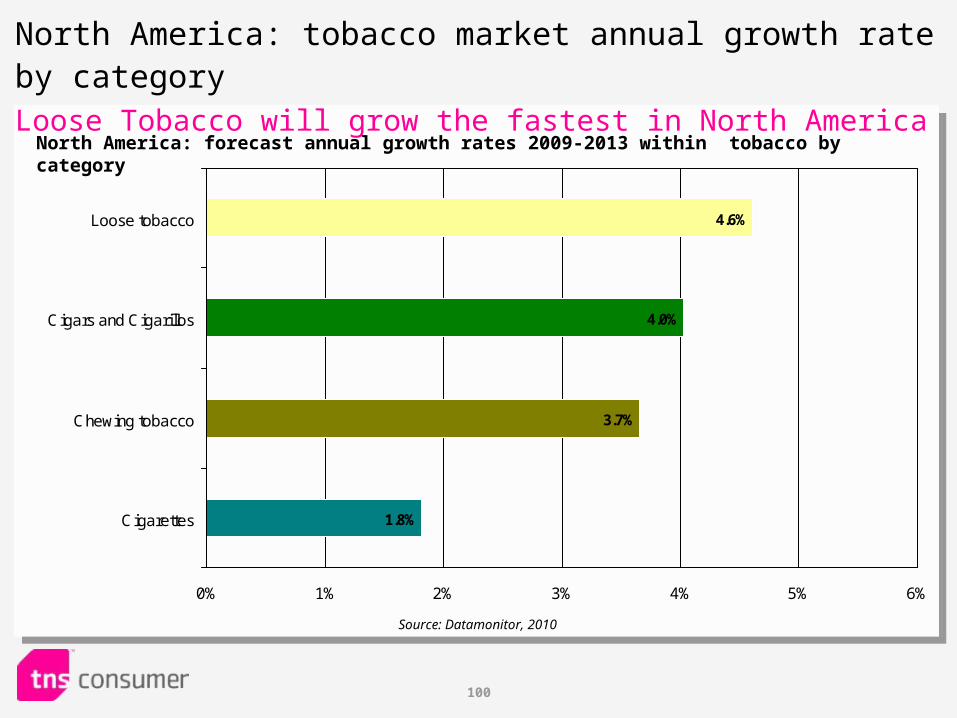
100
1.8%
3.7%
4.0%
4.6%
0% 1% 2% 3% 4% 5% 6%
Loose tobacco
Cigars and Cigarillos
Chewing tobacco
Cigarettes
North America: tobacco market annual growth rate by category Loose Tobacco will grow the fastest in North America
North America: forecast annual growth rates 2009-2013 within tobacco by category
Source: Datamonitor, 2010
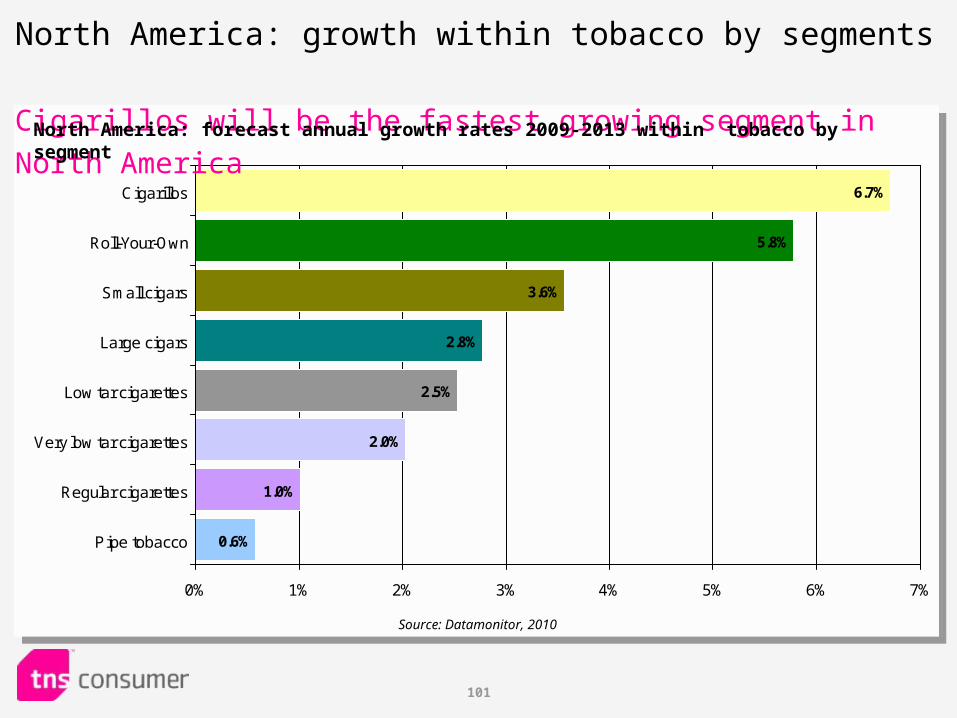
101
2.0%
1.0%
0.6%
2.5%
2.8%
3.6%
5.8%
6.7%
0% 1% 2% 3% 4% 5% 6% 7%
Cigarillos
Roll-Your-Own
Small cigars
Large cigars
Low tar cigarettes
Very low tar cigarettes
Regular cigarettes
Pipe tobacco
North America: growth within tobacco by segments Cigarillos will be the fastest growing segment in North America
North America: forecast annual growth rates 2009-2013 within tobacco by segment
Source: Datamonitor, 2010
102
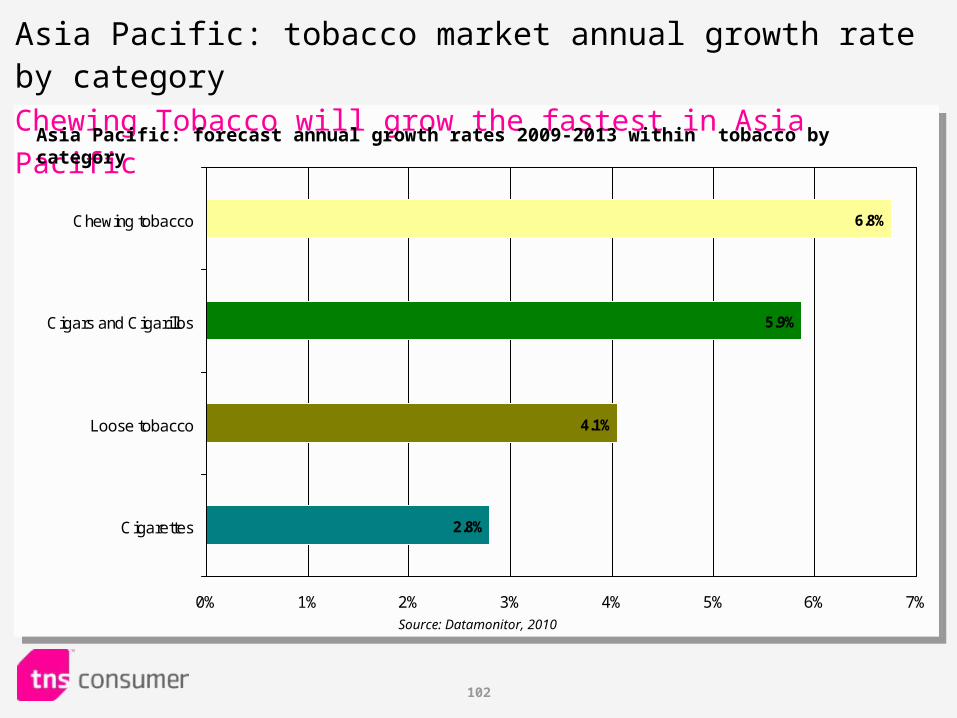
Asia Pacific: tobacco market annual growth rate by category Chewing Tobacco will grow the fastest in Asia Pacific
2.8%
4.1%
5.9%
6.8%
0% 1% 2% 3% 4% 5% 6% 7%
Chewing tobacco
Cigars and Cigarillos
Loose tobacco
Cigarettes
Asia Pacific: forecast annual growth rates 2009-2013 within tobacco by category
Source: Datamonitor, 2010
103
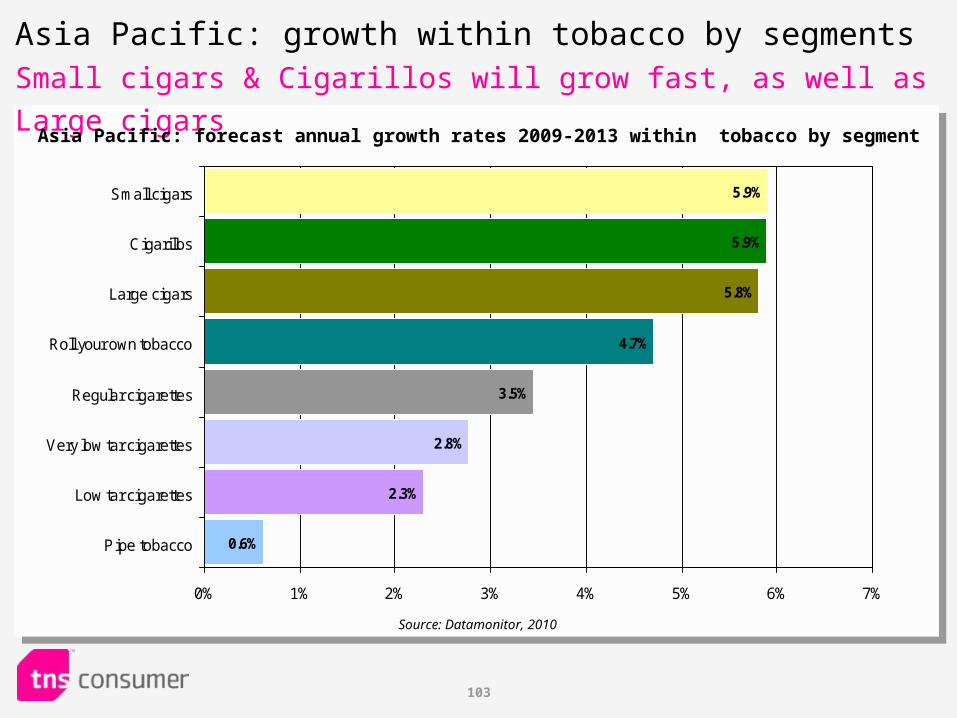
Asia Pacific: growth within tobacco by segmentsSmall cigars & Cigarillos will grow fast, as well as Large cigars
2.8%
2.3%
0.6%
3.5%
4.7%
5.8%
5.9%
5.9%
0% 1% 2% 3% 4% 5% 6% 7%
Small cigars
Cigarillos
Large cigars
Roll your own tobacco
Regular cigarettes
Very low tar cigarettes
Low tar cigarettes
Pipe tobacco
Asia Pacific: forecast annual growth rates 2009-2013 within tobacco by segment
Source: Datamonitor, 2010
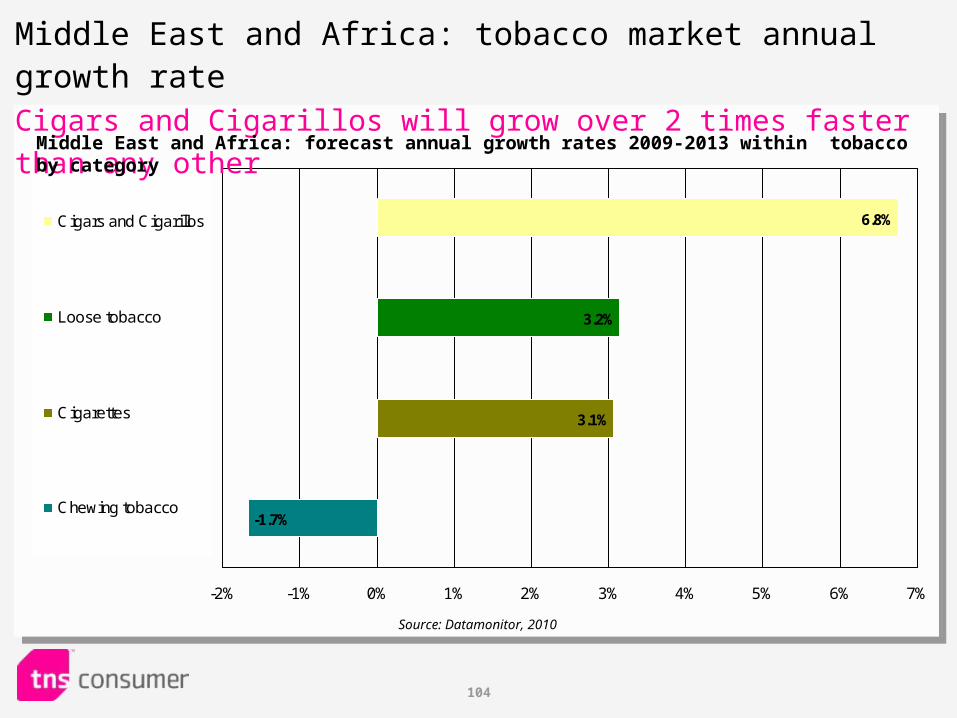
104
-1.7%
3.1%
3.2%
6.8%
-2% -1% 0% 1% 2% 3% 4% 5% 6% 7%
Cigars and Cigarillos
Loose tobacco
Cigarettes
Chewing tobacco
Middle East and Africa: tobacco market annual growth rate Cigars and Cigarillos will grow over 2 times faster than any other
Middle East and Africa: forecast annual growth rates 2009-2013 within tobacco by category
Source: Datamonitor, 2010
105
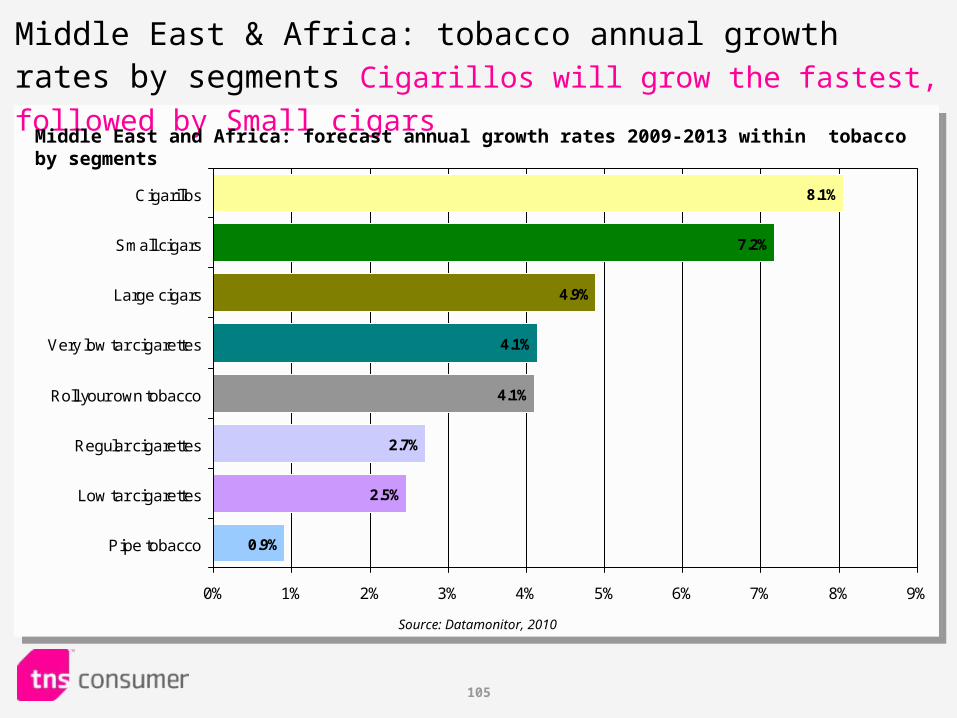
2.7%
2.5%
0.9%
4.1%
4.1%
4.9%
7.2%
8.1%
0% 1% 2% 3% 4% 5% 6% 7% 8% 9%
Cigarillos
Small cigars
Large cigars
Very low tar cigarettes
Roll your own tobacco
Regular cigarettes
Low tar cigarettes
Pipe tobacco
Middle East & Africa: tobacco annual growth rates by segments Cigarillos will grow the fastest, followed by Small cigars
Middle East and Africa: forecast annual growth rates 2009-2013 within tobacco by segments
Source: Datamonitor, 2010
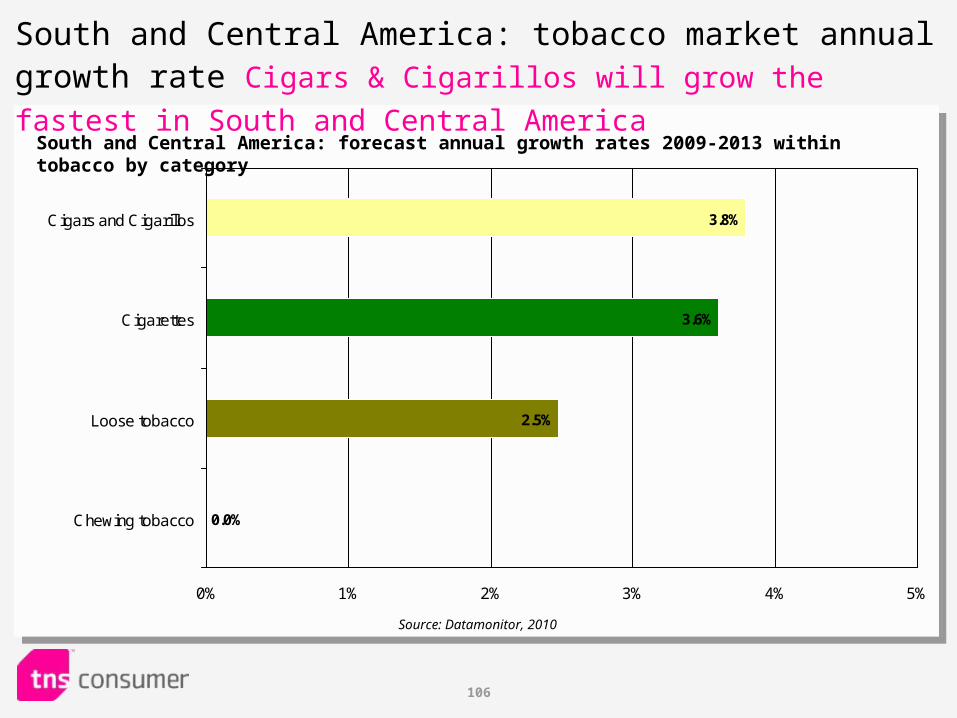
106
3.8%
3.6%
2.5%
0.0%
0% 1% 2% 3% 4% 5%
Cigars and Cigarillos
Cigarettes
Loose tobacco
Chewing tobacco
South and Central America: tobacco market annual growth rate Cigars & Cigarillos will grow the fastest in South and Central America
South and Central America: forecast annual growth rates 2009-2013 within tobacco by category
Source: Datamonitor, 2010
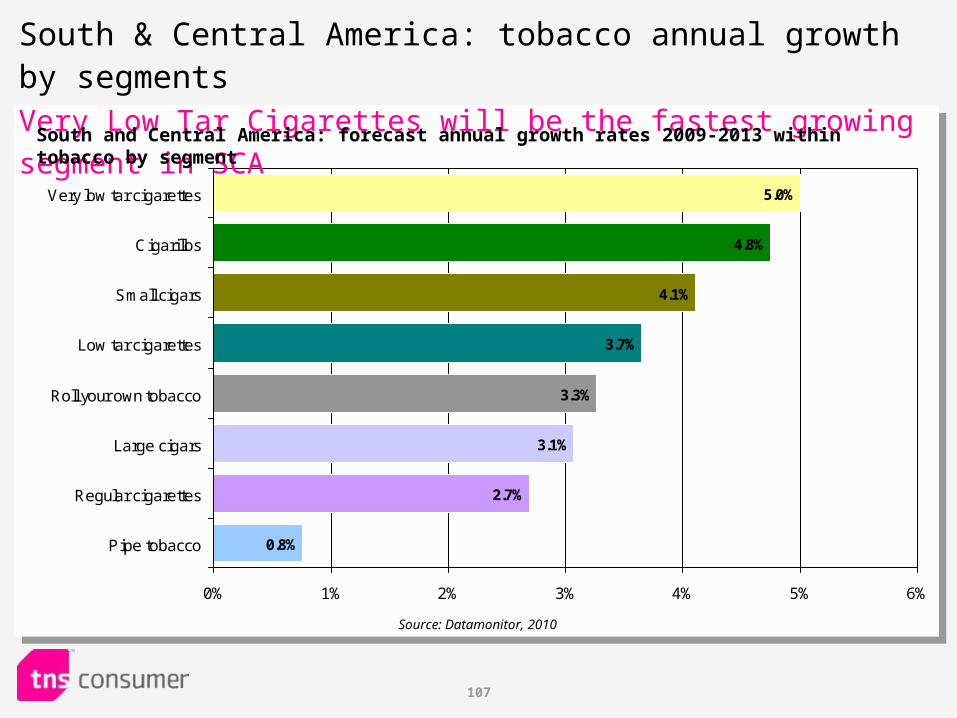
107
3.1%
2.7%
0.8%
3.3%
3.7%
4.1%
4.8%
5.0%
0% 1% 2% 3% 4% 5% 6%
Very low tar cigarettes
Cigarillos
Small cigars
Low tar cigarettes
Roll your own tobacco
Large cigars
Regular cigarettes
Pipe tobacco
South & Central America: tobacco annual growth by segments Very Low Tar Cigarettes will be the fastest growing segment in SCA
South and Central America: forecast annual growth rates 2009-2013 within tobacco by segment
Source: Datamonitor, 2010
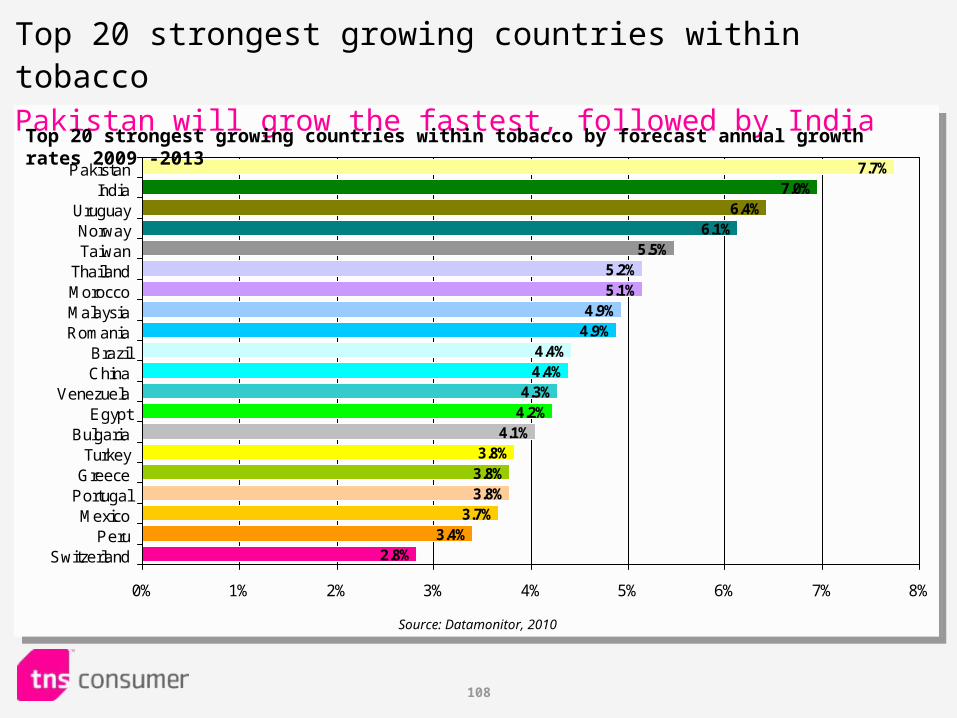
108
Top 20 strongest growing countries within tobaccoPakistan will grow the fastest, followed by India
5.2%5.1%
4.9%4.9%
4.4%4.4%
4.3%4.2%
4.1%3.8%
3.8%3.8%
2.8%
3.7%3.4%
5.5%6.1%
6.4%7.0%
7.7%
0% 1% 2% 3% 4% 5% 6% 7% 8%
PakistanIndia
UruguayNorwayTaiwan
ThailandMoroccoMalaysiaRomania
BrazilChina
VenezuelaEgypt
BulgariaTurkey
GreecePortugalMexico
PeruSwitzerland
Top 20 strongest growing countries within tobacco by forecast annual growth rates 2009 -2013
Source: Datamonitor, 2010
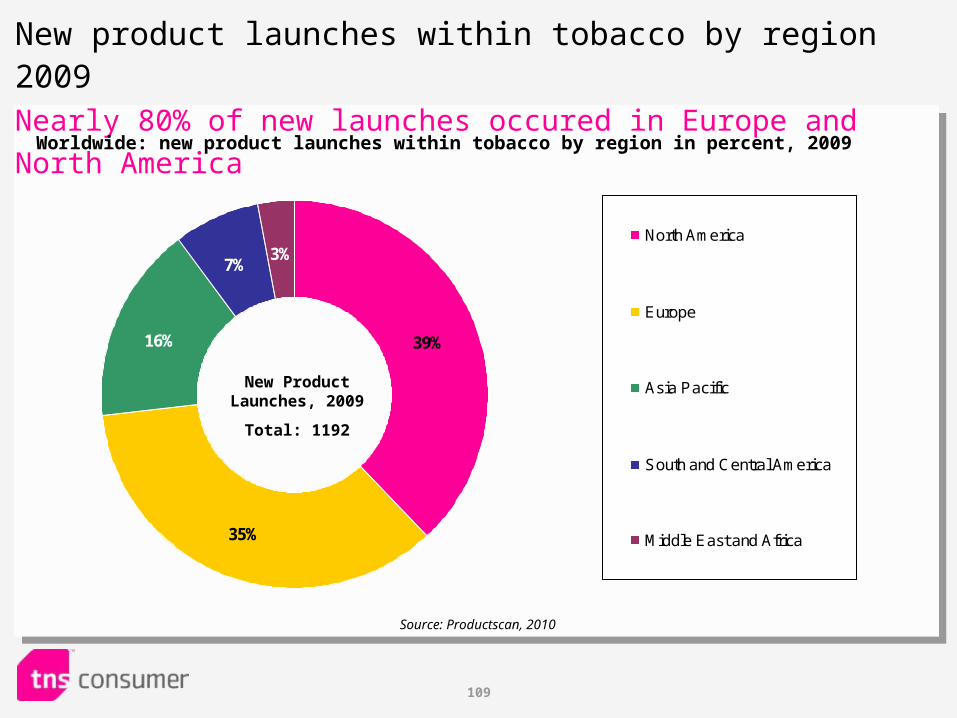
109
39%
35%
16%
7%3%
North America
Europe
Asia Pacific
South and Central America
Middle East and Africa
New product launches within tobacco by region 2009Nearly 80% of new launches occured in Europe and North America
Worldwide: new product launches within tobacco by region in percent, 2009
New Product Launches, 2009
Total: 1192
Source: Productscan, 2010
110
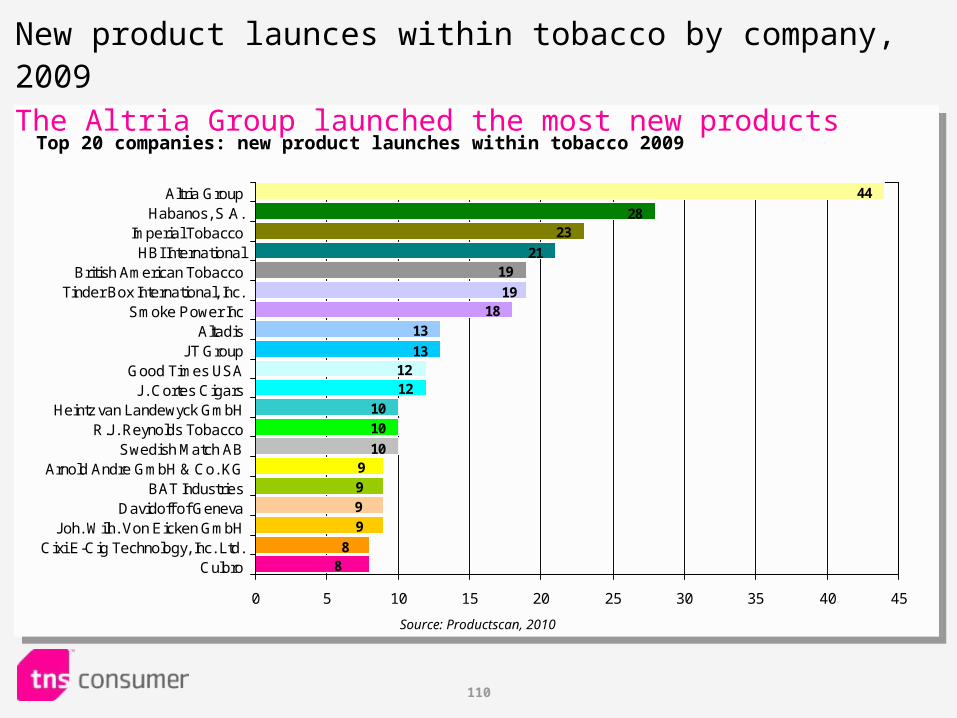
New product launces within tobacco by company, 2009The Altria Group launched the most new products
44
2823
2119
8
9
8
9
9
910
10
10
1212
13
13
1819
0 5 10 15 20 25 30 35 40 45
Altria GroupHabanos, S.A.
Imperial TobaccoHBI International
British American TobaccoTinder Box International, Inc.
Smoke Power IncAltadis
JT GroupGood Times USA
J. Cortes CigarsHeintz van Landewyck GmbH
R.J. Reynolds TobaccoSwedish Match AB
Arnold Andre GmbH & Co. KGBAT Industries
Davidoff of GenevaJoh. Wilh. Von Eicken GmbH
Cixi E-Cig Technology, Inc. Ltd.Culbro
Top 20 companies: new product launches within tobacco 2009
Source: Productscan, 2010
111
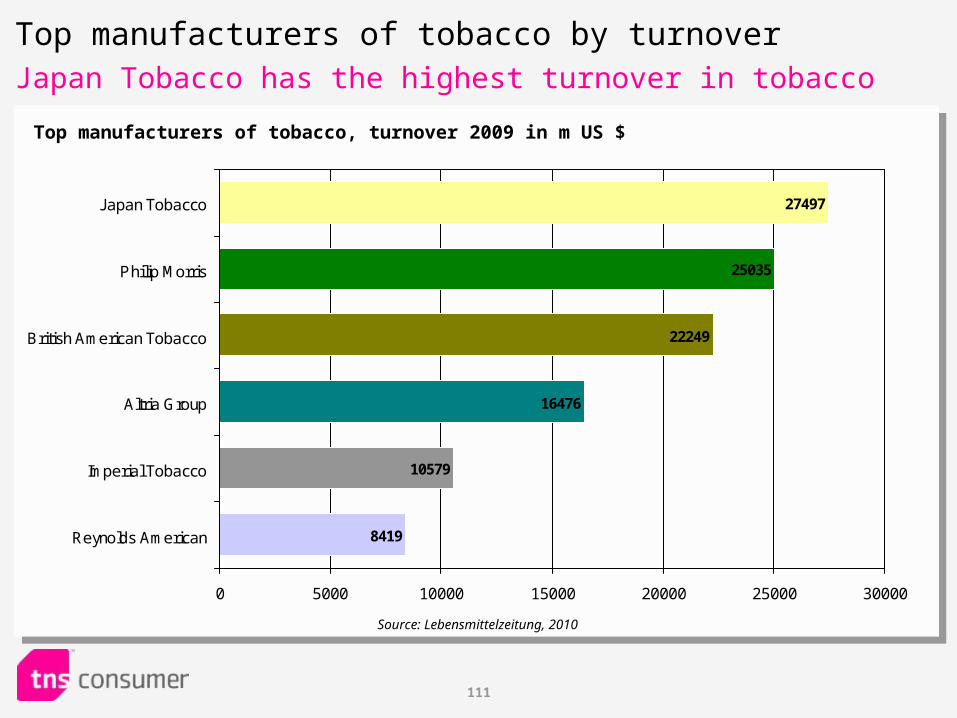
27497
25035
22249
16476
10579
8419
0 5000 10000 15000 20000 25000 30000
Japan Tobacco
Philip Morris
British American Tobacco
Altria Group
Imperial Tobacco
Reynolds American
Top manufacturers of tobacco by turnoverJapan Tobacco has the highest turnover in tobacco
Top manufacturers of tobacco, turnover 2009 in m US $
Source: Lebensmittelzeitung, 2010

TNS Infratest Business Intelligence112112
Market for Personal Care
113
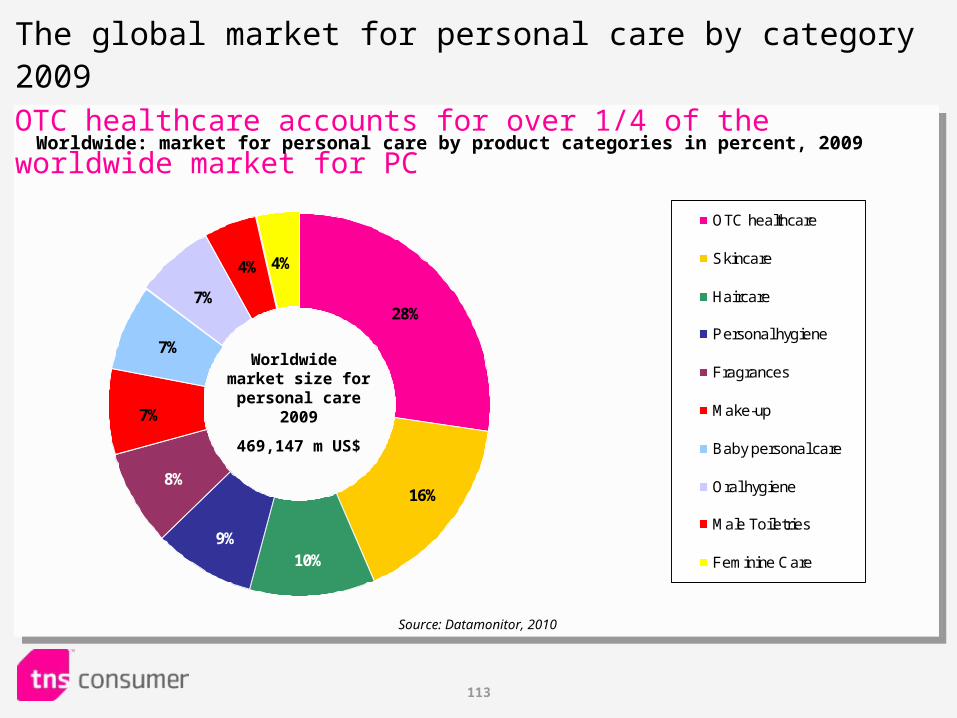
28%7%
4%4%
16%
7%
7%
8%
9%10%
OTC healthcare
Skincare
Haircare
Personal hygiene
Fragrances
Make-up
Baby personal care
Oral hygiene
Male Toiletries
Feminine Care
The global market for personal care by category 2009OTC healthcare accounts for over 1/4 of the worldwide market for PC
Worldwide: market for personal care by product categories in percent, 2009
Source: Datamonitor, 2010
Worldwide market size for
personal care 2009
469,147 m US$
114
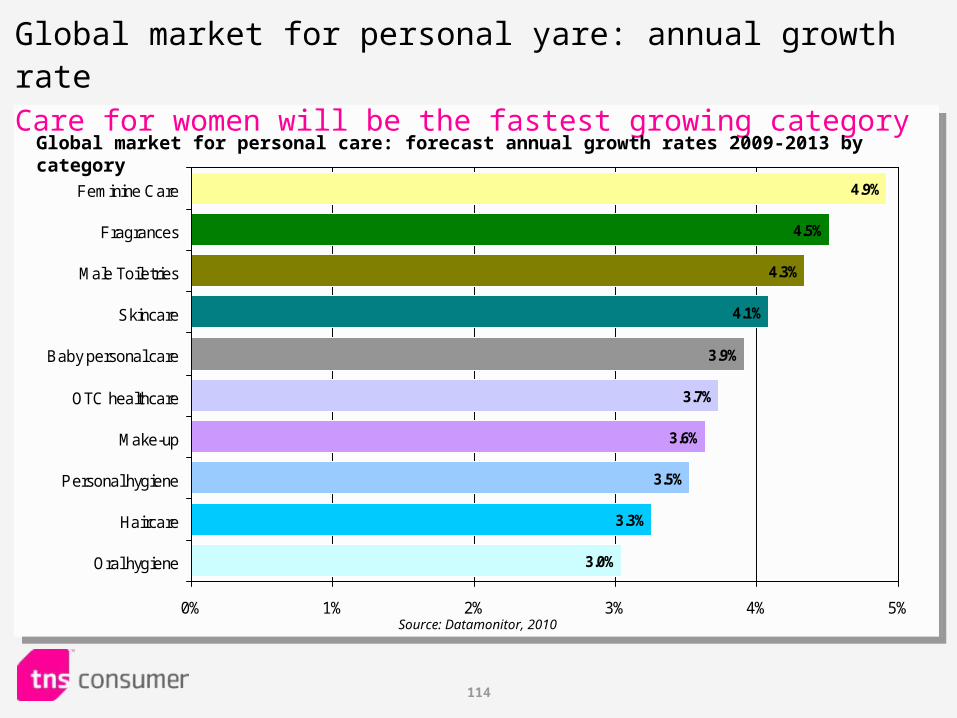
Global market for personal yare: annual growth rate Care for women will be the fastest growing category
3.7%
3.6%
3.5%
3.3%
3.0%
3.9%
4.1%
4.3%
4.5%
4.9%
0% 1% 2% 3% 4% 5%
Feminine Care
Fragrances
Male Toiletries
Skincare
Baby personal care
OTC healthcare
Make-up
Personal hygiene
Haircare
Oral hygiene
Global market for personal care: forecast annual growth rates 2009-2013 by category
Source: Datamonitor, 2010
115
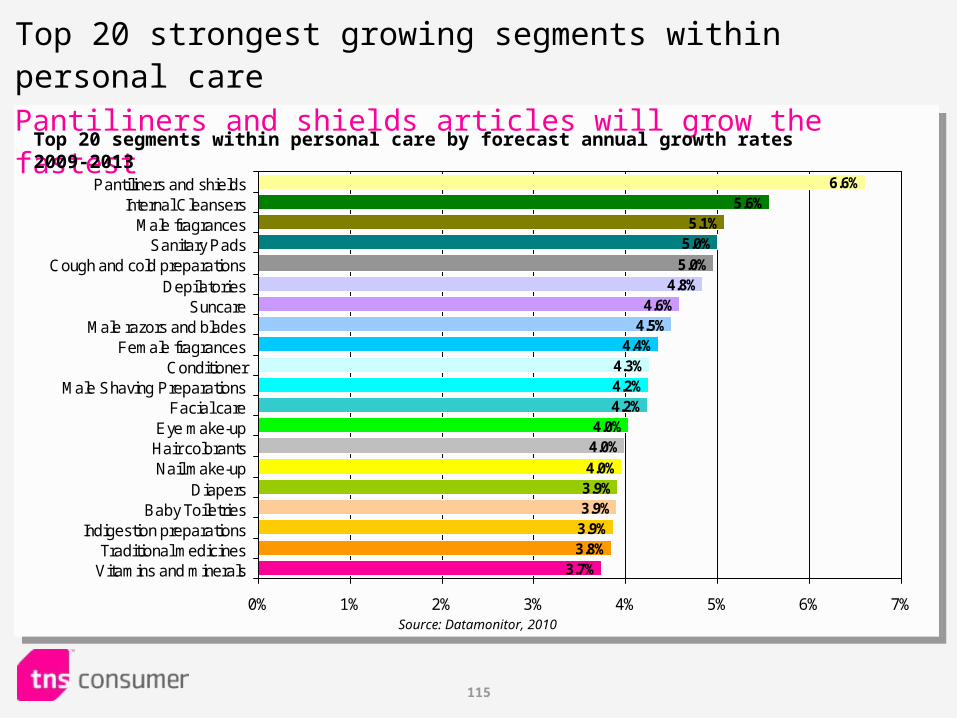
Top 20 strongest growing segments within personal carePantiliners and shields articles will grow the fastest
4.8%4.6%
4.5%4.4%
4.3%4.2%4.2%
4.0%4.0%
4.0%3.9%3.9%
3.7%
3.9%3.8%
5.0%
5.0%5.1%
5.6%6.6%
0% 1% 2% 3% 4% 5% 6% 7%
Pantiliners and shieldsInternal Cleansers
Male fragrancesSanitary Pads
Cough and cold preparationsDepilatories
SuncareMale razors and blades
Female fragrancesConditioner
Male Shaving PreparationsFacial care
Eye make-upHair colorantsNail make-up
DiapersBaby Toiletries
Indigestion preparationsTraditional medicines
Vitamins and minerals
Source: Datamonitor, 2010
Top 20 segments within personal care by forecast annual growth rates 2009-2013
116
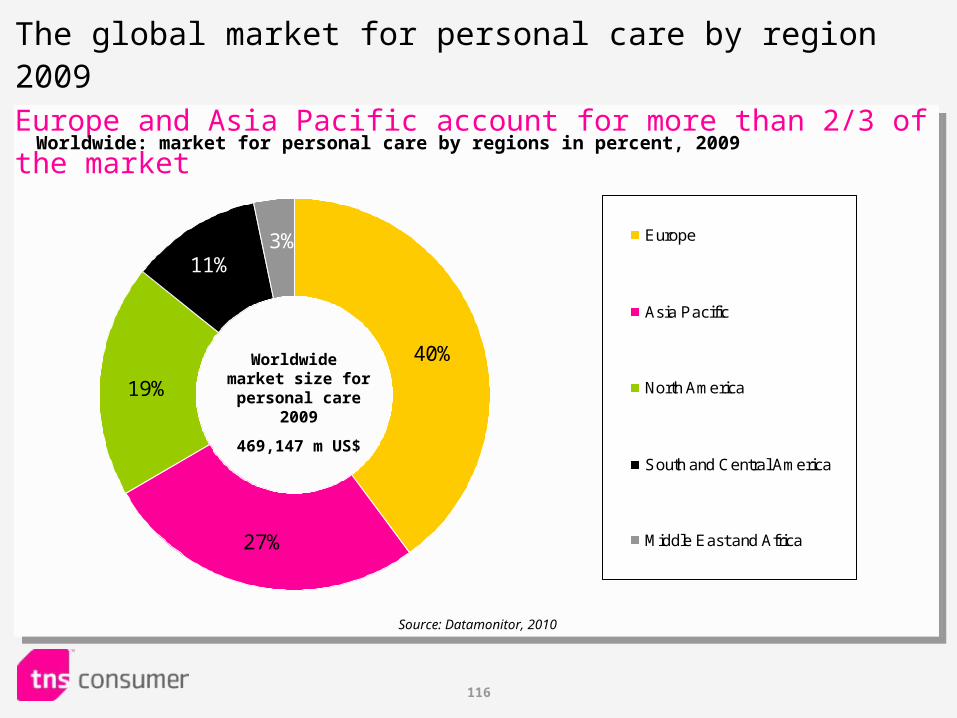
40%
27%
19%
3%11%
Europe
Asia Pacific
North America
South and Central America
Middle East and Africa
The global market for personal care by region 2009Europe and Asia Pacific account for more than 2/3 of the market
Worldwide: market for personal care by regions in percent, 2009
Source: Datamonitor, 2010
Worldwide market size for
personal care 2009
469,147 m US$
117
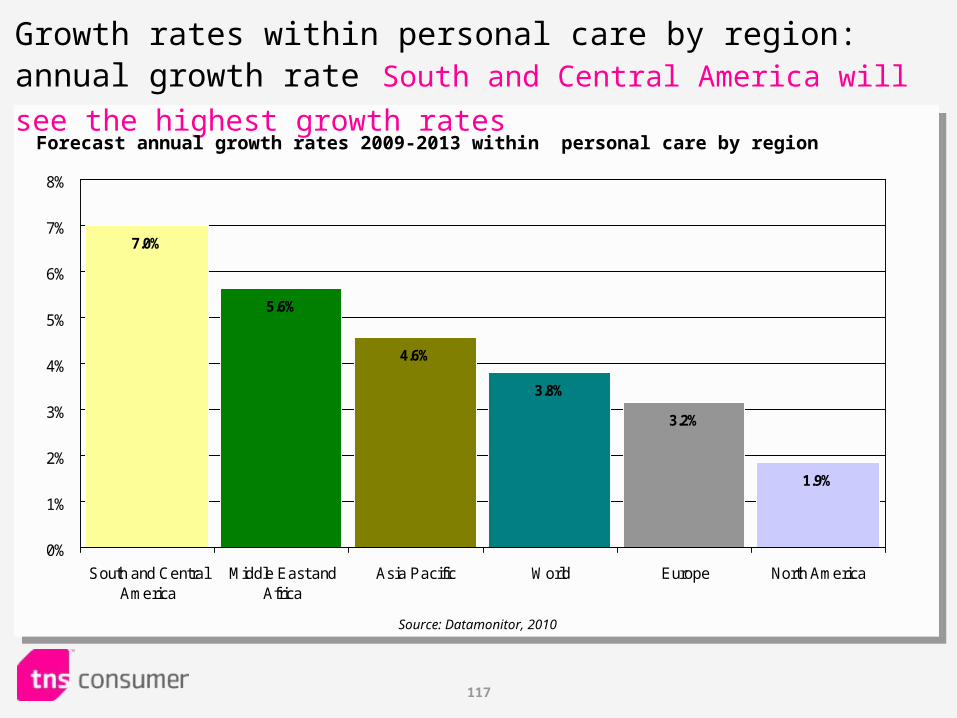
Growth rates within personal care by region: annual growth rate South and Central America will see the highest growth rates
1.9%
3.2%
3.8%
4.6%
5.6%
7.0%
0%
1%
2%
3%
4%
5%
6%
7%
8%
South and CentralAmerica
Middle East andAfrica
Asia Pacific World Europe North America
Forecast annual growth rates 2009-2013 within personal care by region
Source: Datamonitor, 2010
118
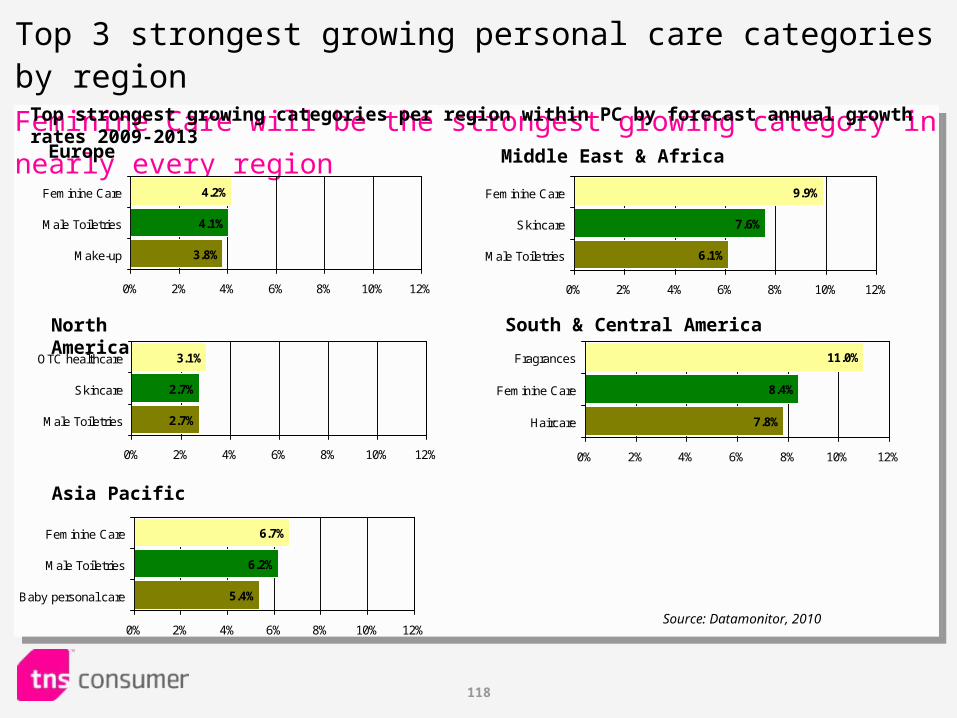
Top 3 strongest growing personal care categories by regionFeminine Care will be the strongest growing category in nearly every region
3.8%
4.1%
4.2%
0% 2% 4% 6% 8% 10% 12%
Feminine Care
Male Toiletries
Make-up
Top strongest growing categories per region within PC by forecast annual growth rates 2009-2013
Source: Datamonitor, 2010
2.7%
2.7%
3.1%
0% 2% 4% 6% 8% 10% 12%
OTC healthcare
Skincare
Male Toiletries
5.4%
6.2%
6.7%
0% 2% 4% 6% 8% 10% 12%
Feminine Care
Male Toiletries
Baby personal care
Europe
North America
Asia Pacific
6.1%
7.6%
9.9%
0% 2% 4% 6% 8% 10% 12%
Feminine Care
Skincare
Male Toiletries
South & Central America
7.8%
8.4%
11.0%
0% 2% 4% 6% 8% 10% 12%
Fragrances
Feminine Care
Haircare
Middle East & Africa
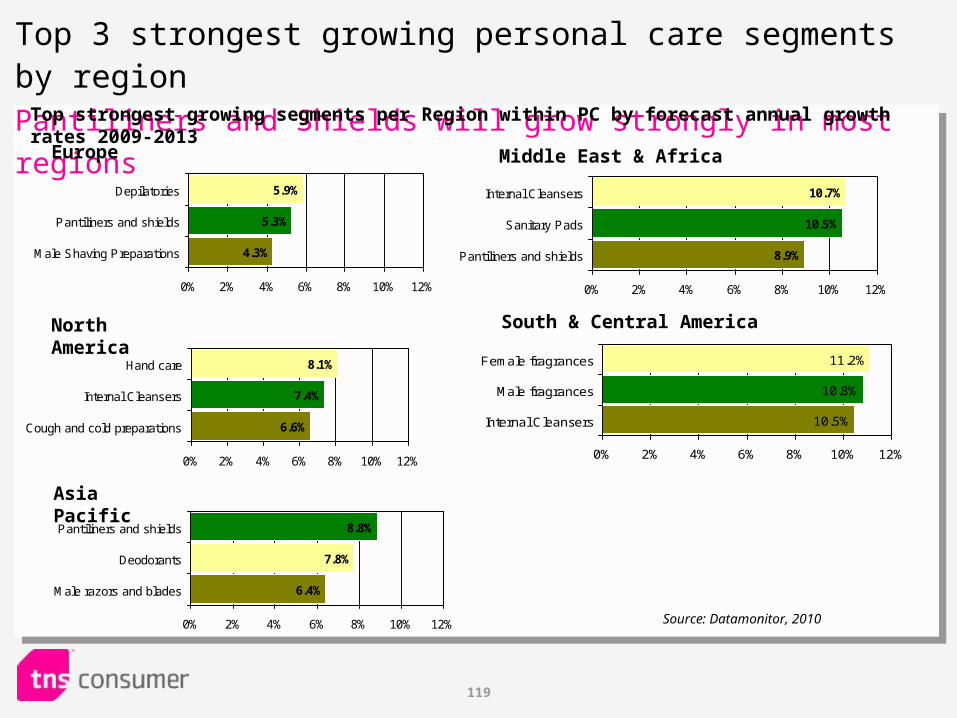
119
Top 3 strongest growing personal care segments by regionPantiliners and Shields will grow strongly in most regions
4.3%
5.3%
5.9%
0% 2% 4% 6% 8% 10% 12%
Depilatories
Pantiliners and shields
Male Shaving Preparations
Top strongest growing segments per Region within PC by forecast annual growth rates 2009-2013
Source: Datamonitor, 2010
6.6%
7.4%
8.1%
0% 2% 4% 6% 8% 10% 12%
Hand care
Internal Cleansers
Cough and cold preparations
6.4%
7.8%
8.8%
0% 2% 4% 6% 8% 10% 12%
Pantiliners and shields
Deodorants
Male razors and blades
Europe
North America
Asia Pacific
8.9%
10.5%
10.7%
0% 2% 4% 6% 8% 10% 12%
Internal Cleansers
Sanitary Pads
Pantiliners and shields
South & Central America
10.5%
10.8%
11.2%
0% 2% 4% 6% 8% 10% 12%
Female fragrances
Male fragrances
Internal Cleansers
Middle East & Africa
120
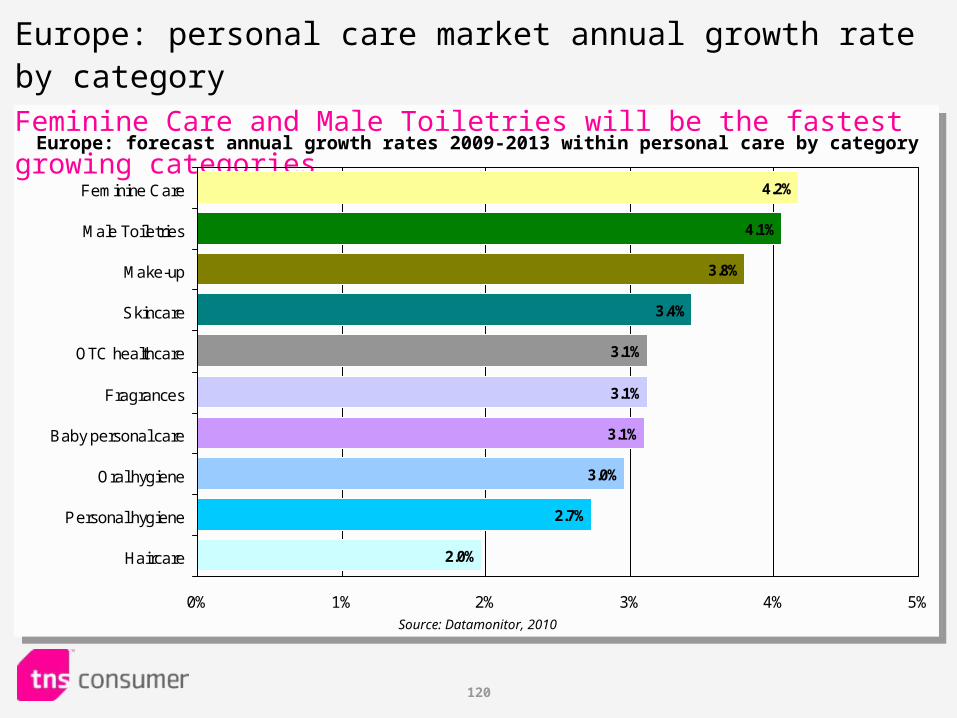
Europe: personal care market annual growth rate by category Feminine Care and Male Toiletries will be the fastest growing categories
3.1%
3.1%
3.0%
2.7%
2.0%
3.1%
3.4%
3.8%
4.1%
4.2%
0% 1% 2% 3% 4% 5%
Feminine Care
Male Toiletries
Make-up
Skincare
OTC healthcare
Fragrances
Baby personal care
Oral hygiene
Personal hygiene
Haircare
Europe: forecast annual growth rates 2009-2013 within personal care by category
Source: Datamonitor, 2010
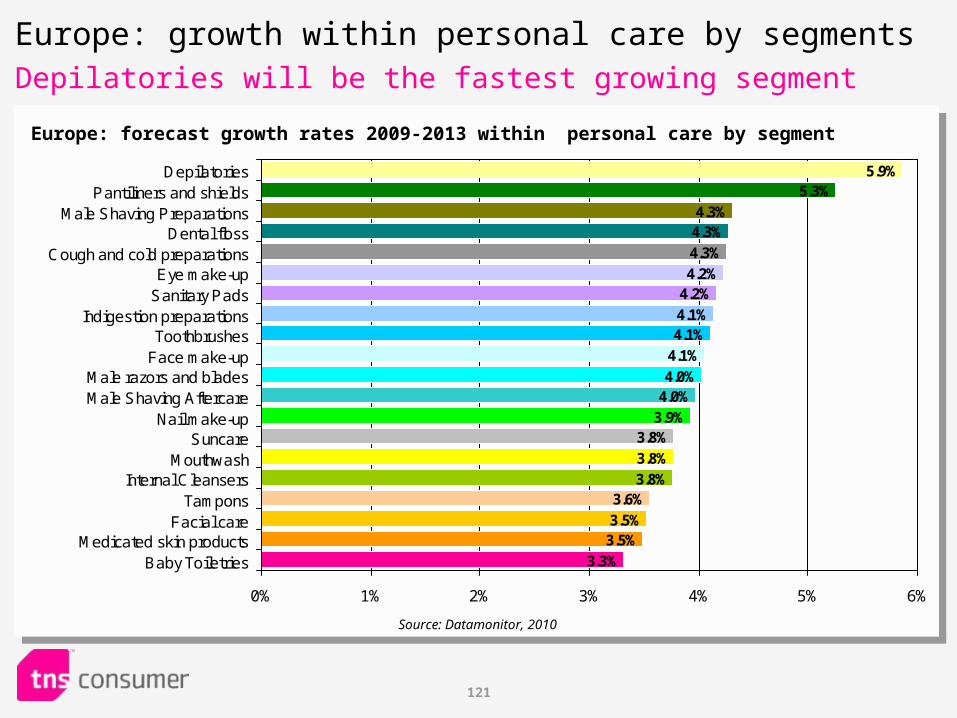
121
Europe: growth within personal care by segmentsDepilatories will be the fastest growing segment
Europe: forecast growth rates 2009-2013 within personal care by segment
Source: Datamonitor, 2010
4.2%4.2%
4.1%4.1%
4.1%
4.0%4.0%
3.9%3.8%
3.8%
3.8%3.6%
3.3%
3.5%3.5%
4.3%
4.3%4.3%
5.3%5.9%
0% 1% 2% 3% 4% 5% 6%
DepilatoriesPantiliners and shields
Male Shaving PreparationsDental floss
Cough and cold preparationsEye make-up
Sanitary PadsIndigestion preparations
ToothbrushesFace make-up
Male razors and bladesMale Shaving Aftercare
Nail make-upSuncare
MouthwashInternal Cleansers
TamponsFacial care
Medicated skin productsBaby Toiletries
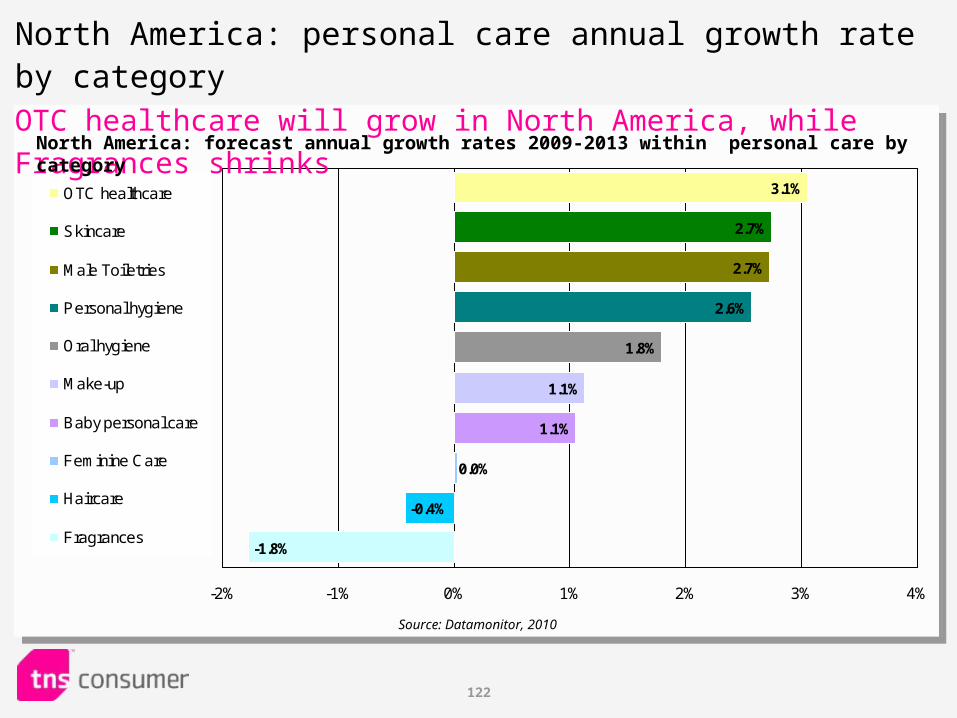
122
3.1%
2.7%
2.7%
2.6%
1.8%
-1.8%
-0.4%
0.0%
1.1%
1.1%
-2% -1% 0% 1% 2% 3% 4%
OTC healthcare
Skincare
Male Toiletries
Personal hygiene
Oral hygiene
Make-up
Baby personal care
Feminine Care
Haircare
Fragrances
North America: personal care annual growth rate by category OTC healthcare will grow in North America, while Fragrances shrinks
North America: forecast annual growth rates 2009-2013 within personal care by category
Source: Datamonitor, 2010
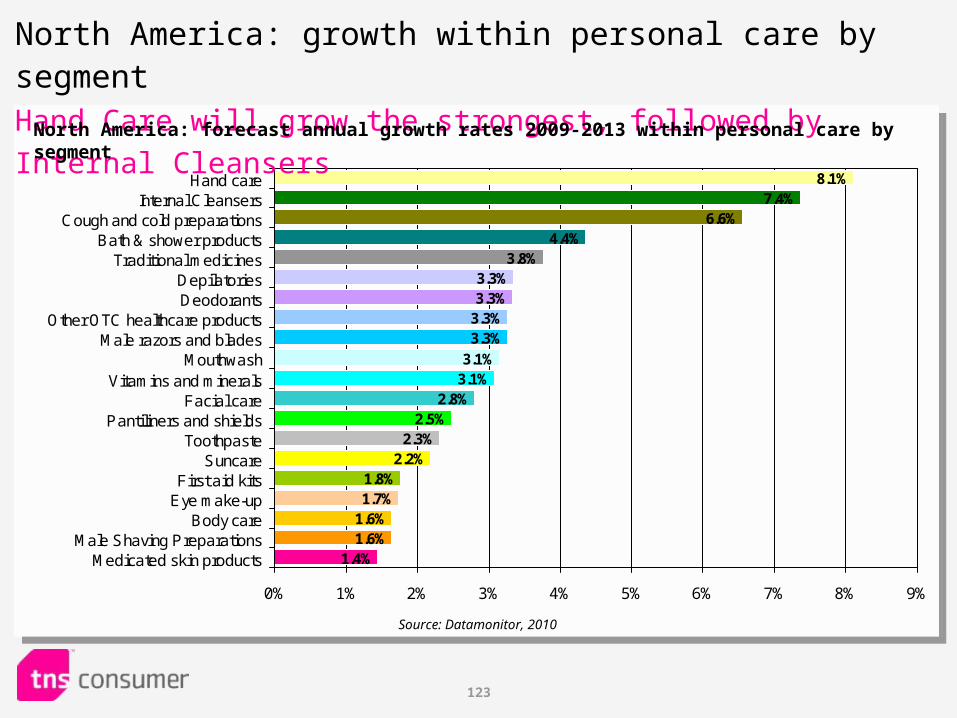
123
3.3%3.3%
3.3%3.3%
3.1%3.1%
2.8%2.5%
2.3%2.2%
1.8%1.7%
1.4%
1.6%1.6%
3.8%4.4%
6.6%7.4%
8.1%
0% 1% 2% 3% 4% 5% 6% 7% 8% 9%
Hand careInternal Cleansers
Cough and cold preparationsBath & shower products
Traditional medicinesDepilatoriesDeodorants
Other OTC healthcare productsMale razors and blades
MouthwashVitamins and minerals
Facial carePantiliners and shields
ToothpasteSuncare
First aid kitsEye make-up
Body careMale Shaving Preparations
Medicated skin products
North America: growth within personal care by segmentHand Care will grow the strongest, followed by Internal Cleansers
North America: forecast annual growth rates 2009-2013 within personal care by segment
Source: Datamonitor, 2010
124
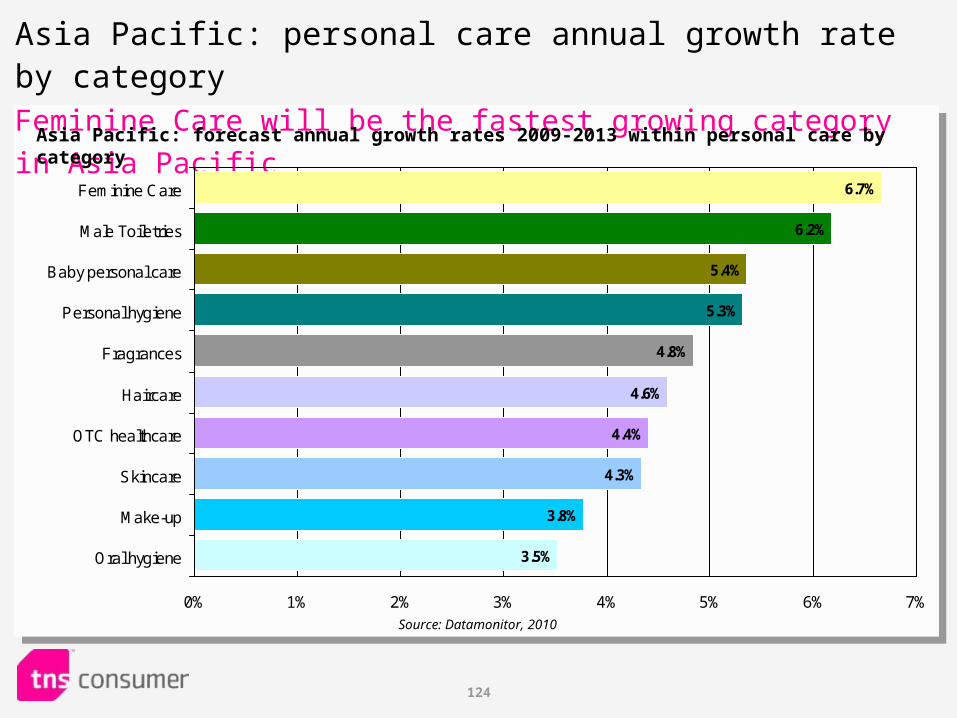
Asia Pacific: personal care annual growth rate by category Feminine Care will be the fastest growing category in Asia Pacific
4.6%
4.4%
4.3%
3.8%
3.5%
4.8%
5.3%
5.4%
6.2%
6.7%
0% 1% 2% 3% 4% 5% 6% 7%
Feminine Care
Male Toiletries
Baby personal care
Personal hygiene
Fragrances
Haircare
OTC healthcare
Skincare
Make-up
Oral hygiene
Asia Pacific: forecast annual growth rates 2009-2013 within personal care by category
Source: Datamonitor, 2010
125
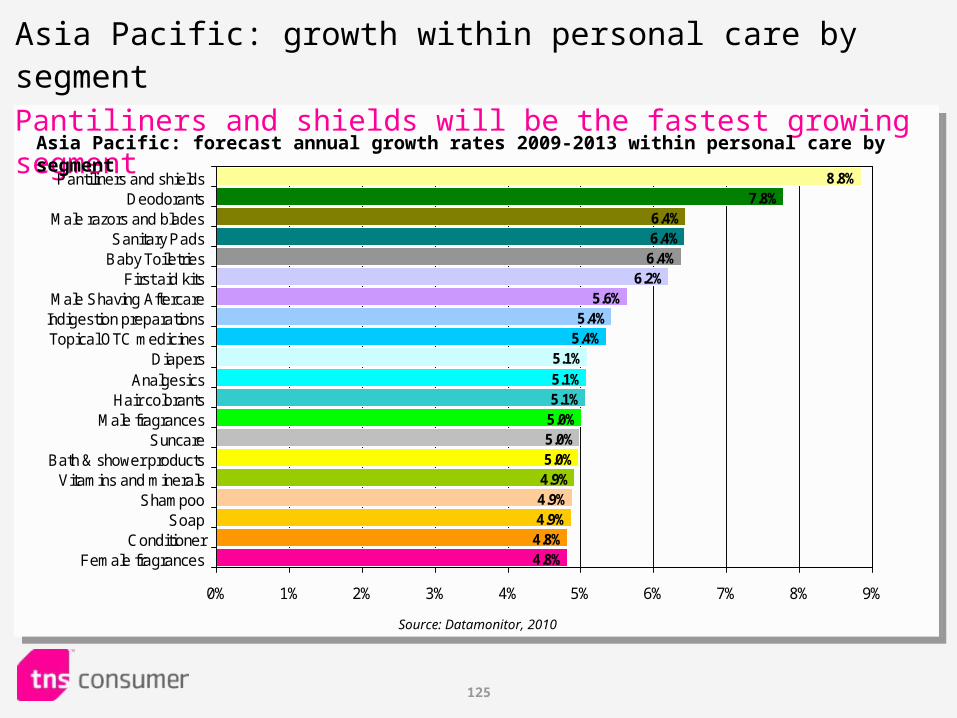
Asia Pacific: growth within personal care by segmentPantiliners and shields will be the fastest growing segment
6.2%5.6%
5.4%5.4%
5.1%
5.1%5.1%5.0%5.0%5.0%4.9%4.9%
4.8%
4.9%4.8%
6.4%6.4%6.4%
7.8%8.8%
0% 1% 2% 3% 4% 5% 6% 7% 8% 9%
Pantiliners and shieldsDeodorants
Male razors and bladesSanitary Pads
Baby ToiletriesFirst aid kits
Male Shaving AftercareIndigestion preparationsTopical OTC medicines
DiapersAnalgesics
Hair colorantsMale fragrances
SuncareBath & shower products
Vitamins and mineralsShampoo
SoapConditioner
Female fragrances
Asia Pacific: forecast annual growth rates 2009-2013 within personal care by segment
Source: Datamonitor, 2010
126
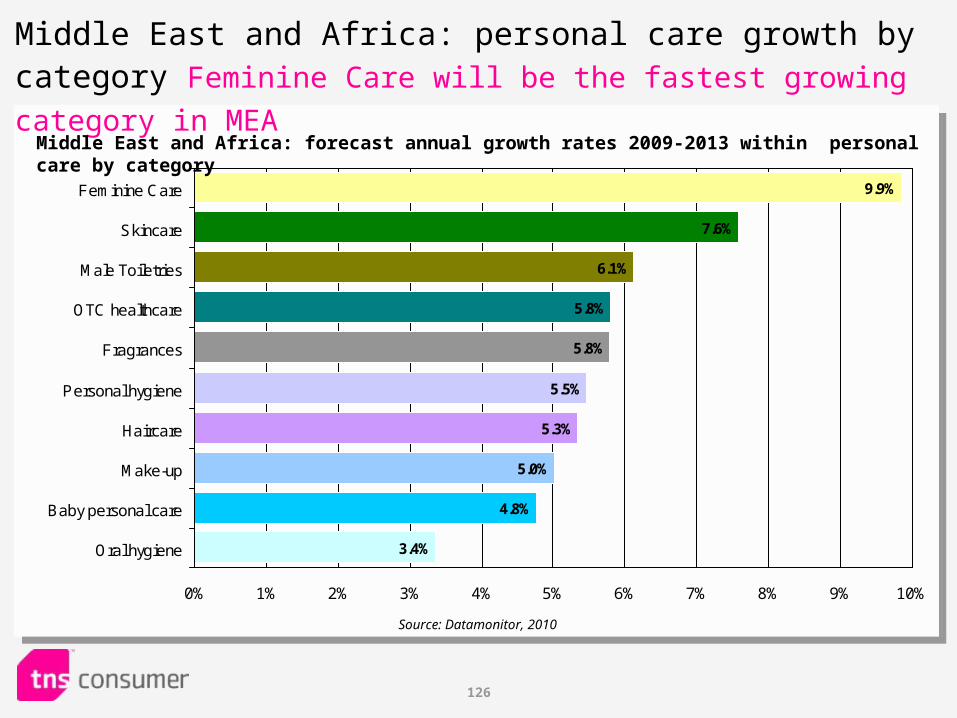
5.5%
5.3%
5.0%
4.8%
3.4%
5.8%
5.8%
6.1%
7.6%
9.9%
0% 1% 2% 3% 4% 5% 6% 7% 8% 9% 10%
Feminine Care
Skincare
Male Toiletries
OTC healthcare
Fragrances
Personal hygiene
Haircare
Make-up
Baby personal care
Oral hygiene
Middle East and Africa: personal care growth by category Feminine Care will be the fastest growing category in MEA
Middle East and Africa: forecast annual growth rates 2009-2013 within personal care by category
Source: Datamonitor, 2010
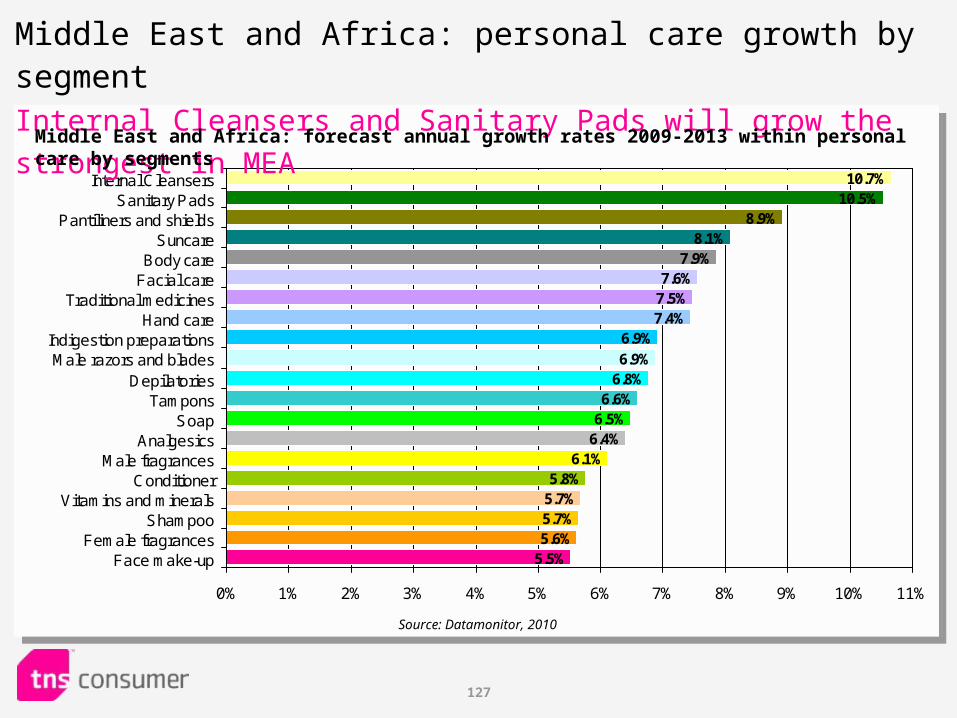
127
7.6%7.5%7.4%
6.9%
6.9%6.8%
6.6%6.5%
6.4%6.1%
5.8%5.7%
5.5%
5.7%5.6%
7.9%8.1%
8.9%10.5%10.7%
0% 1% 2% 3% 4% 5% 6% 7% 8% 9% 10% 11%
Internal CleansersSanitary Pads
Pantiliners and shieldsSuncare
Body careFacial care
Traditional medicinesHand care
Indigestion preparationsMale razors and blades
DepilatoriesTampons
SoapAnalgesics
Male fragrancesConditioner
Vitamins and mineralsShampoo
Female fragrancesFace make-up
Middle East and Africa: personal care growth by segmentInternal Cleansers and Sanitary Pads will grow the strongest in MEA
Middle East and Africa: forecast annual growth rates 2009-2013 within personal care by segments
Source: Datamonitor, 2010
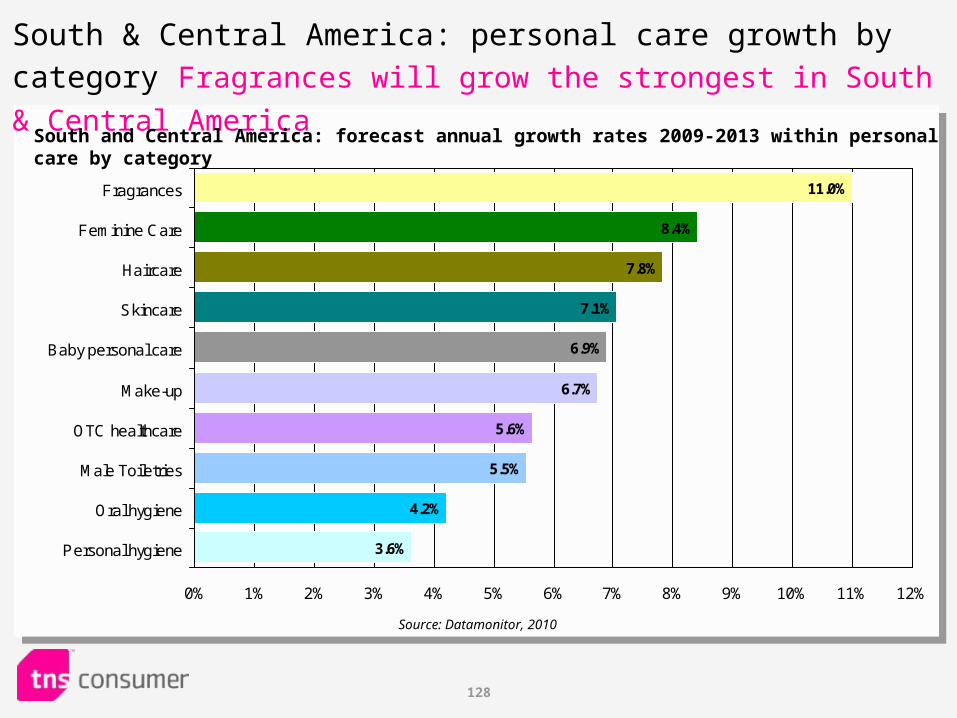
128
11.0%
8.4%
7.8%
7.1%
6.9%
3.6%
4.2%
5.5%
5.6%
6.7%
0% 1% 2% 3% 4% 5% 6% 7% 8% 9% 10% 11% 12%
Fragrances
Feminine Care
Haircare
Skincare
Baby personal care
Make-up
OTC healthcare
Male Toiletries
Oral hygiene
Personal hygiene
South & Central America: personal care growth by category Fragrances will grow the strongest in South & Central America
South and Central America: forecast annual growth rates 2009-2013 within personal care by category
Source: Datamonitor, 2010
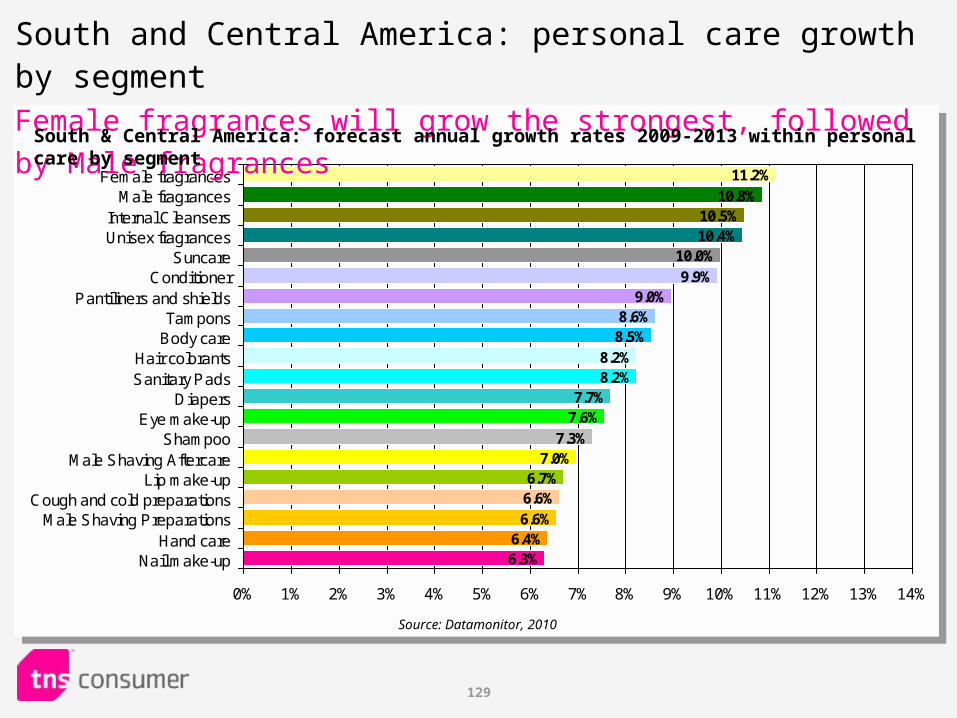
129
9.9%9.0%
8.6%8.5%
8.2%8.2%
7.7%7.6%
7.3%7.0%
6.7%6.6%
6.3%
6.6%6.4%
10.0%10.4%10.5%
10.8%
11.2%
0% 1% 2% 3% 4% 5% 6% 7% 8% 9% 10% 11% 12% 13% 14%
Female fragrancesMale fragrances
Internal CleansersUnisex fragrances
SuncareConditioner
Pantiliners and shieldsTampons
Body careHair colorantsSanitary Pads
DiapersEye make-up
ShampooMale Shaving Aftercare
Lip make-upCough and cold preparations
Male Shaving PreparationsHand care
Nail make-up
South and Central America: personal care growth by segmentFemale fragrances will grow the strongest, followed by Male fragrances
South & Central America: forecast annual growth rates 2009-2013 within personal care by segment
Source: Datamonitor, 2010
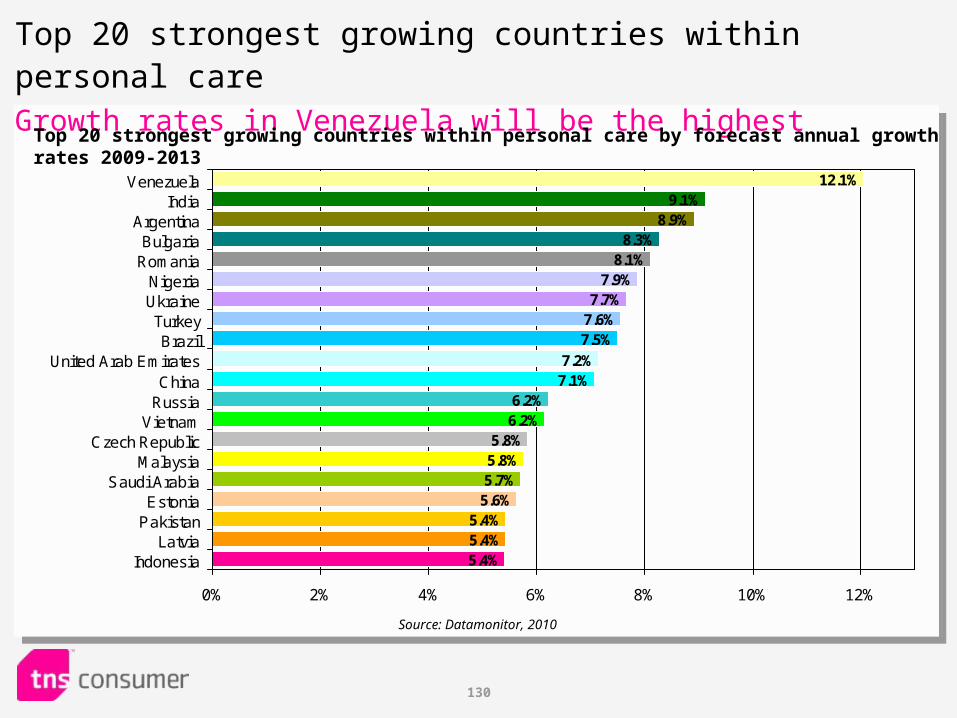
130
Top 20 strongest growing countries within personal careGrowth rates in Venezuela will be the highest
7.9%7.7%
7.6%7.5%
7.2%7.1%
6.2%6.2%
5.8%5.8%5.7%5.6%
5.4%
5.4%5.4%
8.1%8.3%
8.9%9.1%
12.1%
0% 2% 4% 6% 8% 10% 12%
VenezuelaIndia
ArgentinaBulgaria
RomaniaNigeriaUkraineTurkeyBrazil
United Arab EmiratesChina
RussiaVietnam
Czech RepublicMalaysia
Saudi ArabiaEstonia
PakistanLatvia
Indonesia
Top 20 strongest growing countries within personal care by forecast annual growth rates 2009-2013
Source: Datamonitor, 2010
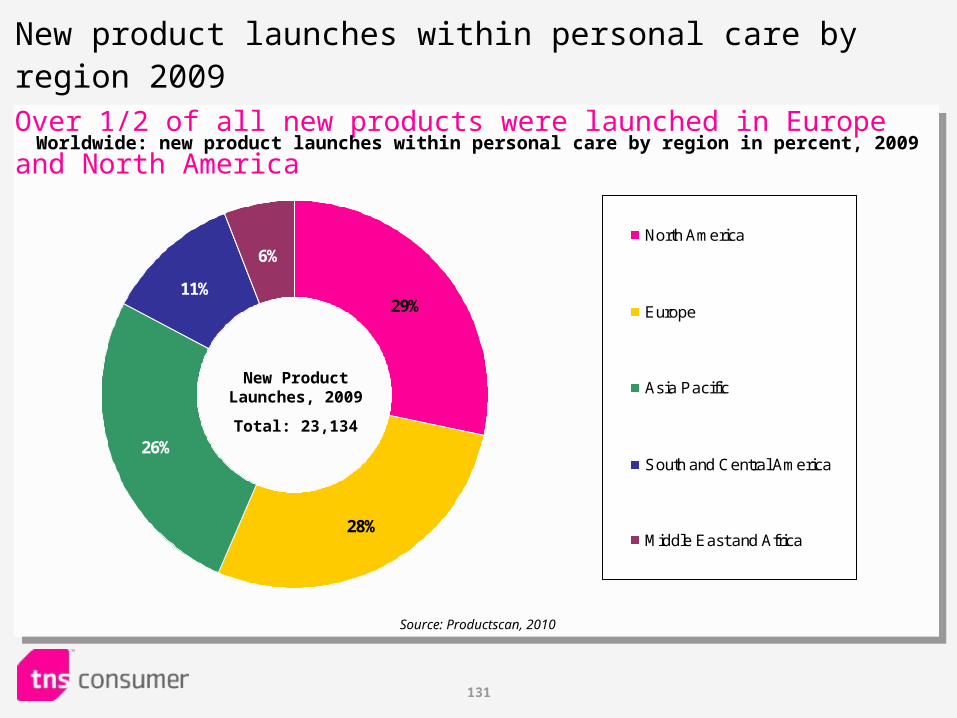
131
29%
28%
26%
11%
6%North America
Europe
Asia Pacific
South and Central America
Middle East and Africa
New product launches within personal care by region 2009Over 1/2 of all new products were launched in Europe and North America
Worldwide: new product launches within personal care by region in percent, 2009
New Product Launches, 2009
Total: 23,134
Source: Productscan, 2010
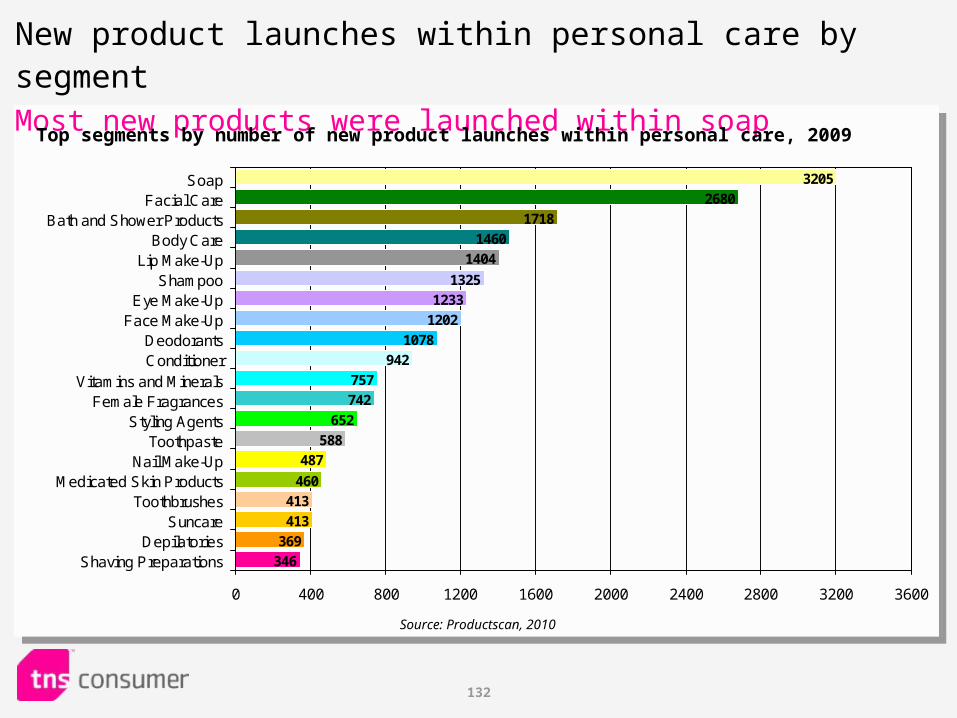
132
13251233
12021078
942757742
652588
487
460413
346
413369
14041460
17182680
3205
0 400 800 1200 1600 2000 2400 2800 3200 3600
SoapFacial Care
Bath and Shower ProductsBody Care
Lip Make-UpShampoo
Eye Make-UpFace Make-Up
DeodorantsConditioner
Vitamins and MineralsFemale Fragrances
Styling AgentsToothpaste
Nail Make-UpMedicated Skin Products
ToothbrushesSuncare
DepilatoriesShaving Preparations
New product launches within personal care by segmentMost new products were launched within soap
Top segments by number of new product launches within personal care, 2009
Source: Productscan, 2010
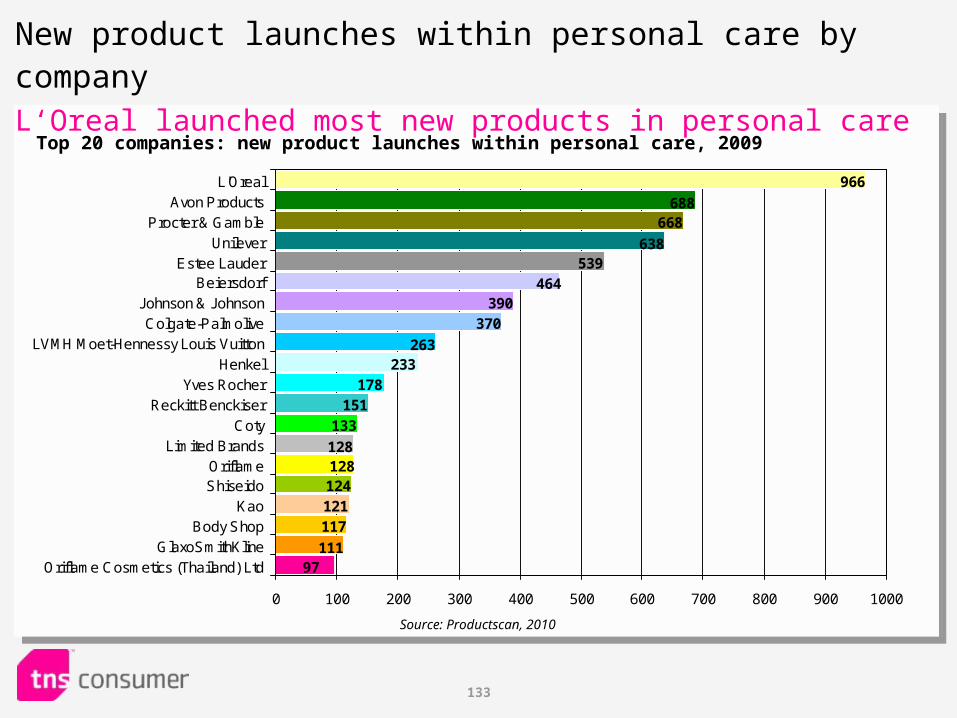
133
New product launches within personal care by companyL‘Oreal launched most new products in personal care
464390
370
263233
178151
133
128128124121
97
117
111
539638
668688
966
0 100 200 300 400 500 600 700 800 900 1000
L'OrealAvon Products
Procter & GambleUnilever
Estee LauderBeiersdorf
Johnson & JohnsonColgate-Palmolive
LVMH Moet-Hennessy Louis VuittonHenkel
Yves RocherReckitt Benckiser
CotyLimited Brands
OriflameShiseido
KaoBody Shop
GlaxoSmithKlineOriflame Cosmetics (Thailand) Ltd
Top 20 companies: new product launches within personal care, 2009
Source: Productscan, 2010
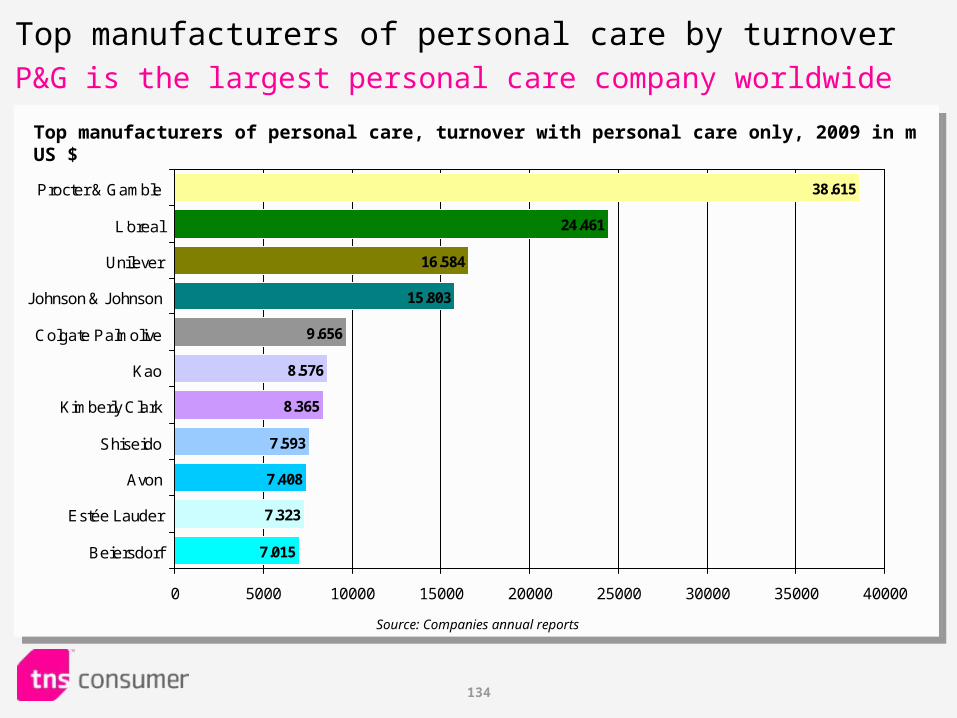
134
38.615
24.461
16.584
15.803
9.656
7.015
7.323
7.408
7.593
8.365
8.576
0 5000 10000 15000 20000 25000 30000 35000 40000
Procter & Gamble
L'oreal
Unilever
Johnson & Johnson
Colgate Palmolive
Kao
Kimberly Clark
Shiseido
Avon
Estée Lauder
Beiersdorf
Top manufacturers of personal care by turnoverP&G is the largest personal care company worldwide
Top manufacturers of personal care, turnover with personal care only, 2009 in m US $
Source: Companies annual reports

135
Market for Household Products
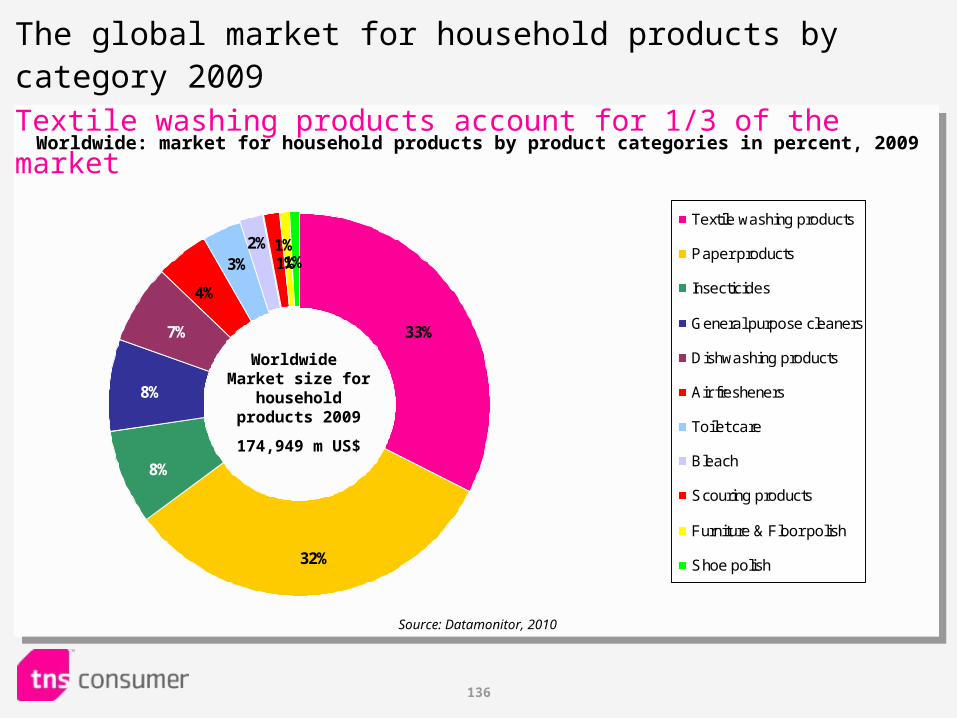
136
33%
1%1%2% 1%
32%
4%
3%
7%
8%
8%
Textile washing products
Paper products
Insecticides
General purpose cleaners
Dishwashing products
Air fresheners
Toilet care
Bleach
Scouring products
Furniture & Floor polish
Shoe polish
The global market for household products by category 2009Textile washing products account for 1/3 of the market
Worldwide: market for household products by product categories in percent, 2009
Source: Datamonitor, 2010
Worldwide Market size for
household products 2009
174,949 m US$
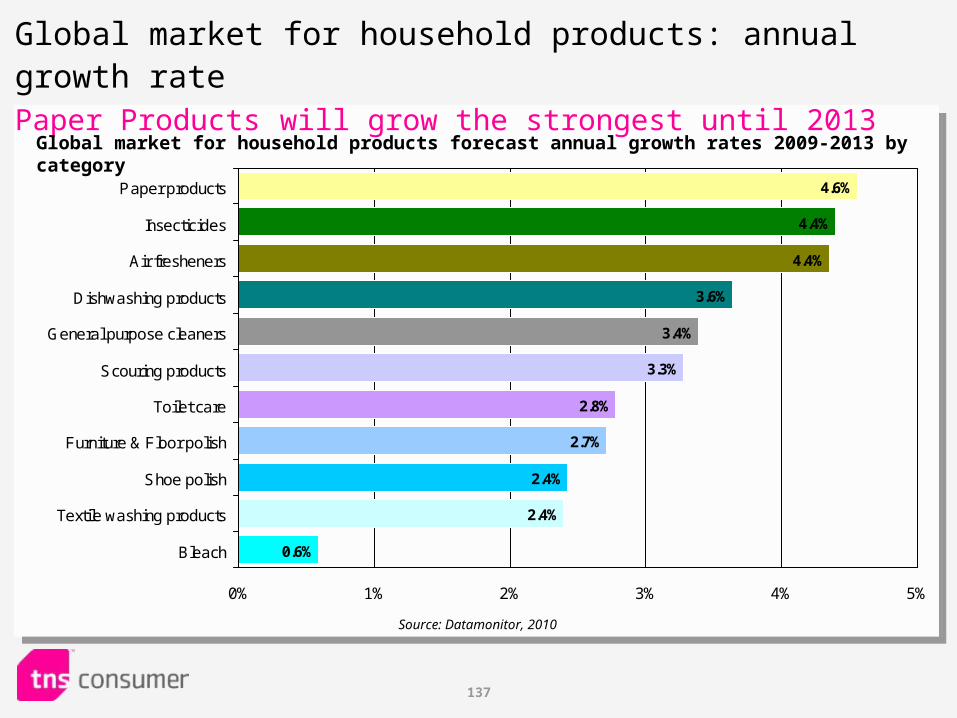
137
4.6%
4.4%
4.4%
3.6%
3.4%
0.6%
2.4%
2.4%
2.7%
2.8%
3.3%
0% 1% 2% 3% 4% 5%
Paper products
Insecticides
Air fresheners
Dishwashing products
General purpose cleaners
Scouring products
Toilet care
Furniture & Floor polish
Shoe polish
Textile washing products
Bleach
Global market for household products: annual growth rate Paper Products will grow the strongest until 2013
Global market for household products forecast annual growth rates 2009-2013 by category
Source: Datamonitor, 2010
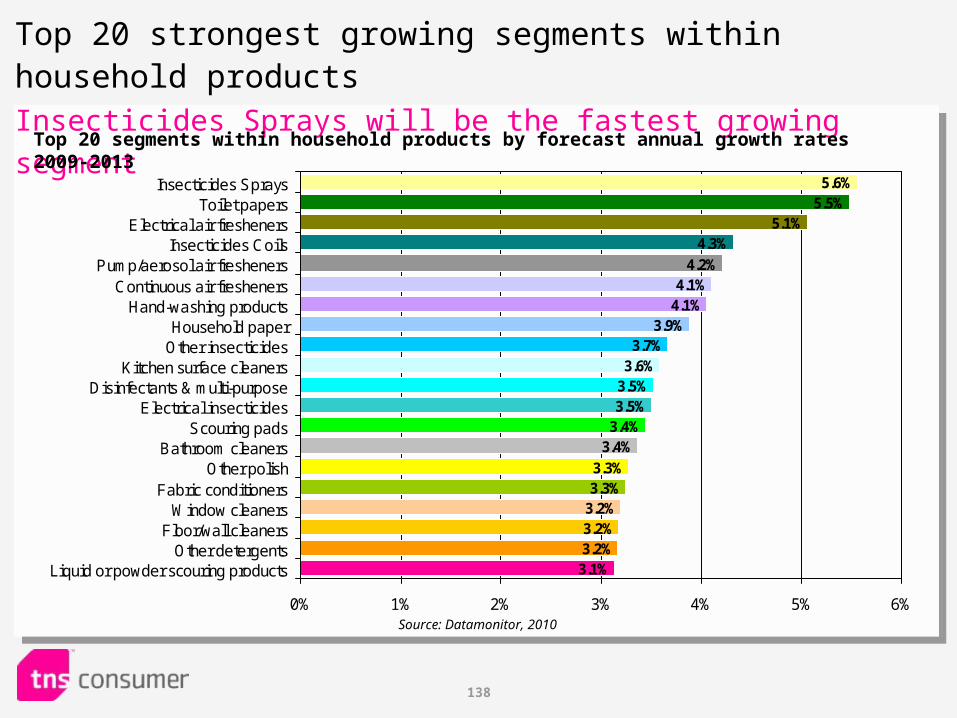
138
Top 20 strongest growing segments within household productsInsecticides Sprays will be the fastest growing segment
4.1%4.1%
3.9%3.7%
3.6%3.5%3.5%
3.4%3.4%
3.3%3.3%
3.2%
3.1%
3.2%3.2%
4.2%
4.3%5.1%
5.5%5.6%
0% 1% 2% 3% 4% 5% 6%
Insecticides SpraysToilet papers
Electrical air freshenersInsecticides Coils
Pump/aerosol air freshenersContinuous air fresheners
Hand-washing productsHousehold paper
Other insecticidesKitchen surface cleaners
Disinfectants & multi-purposeElectrical insecticides
Scouring padsBathroom cleaners
Other polishFabric conditioners
Window cleanersFloor/wall cleaners
Other detergentsLiquid or powder scouring products
Source: Datamonitor, 2010
Top 20 segments within household products by forecast annual growth rates 2009-2013
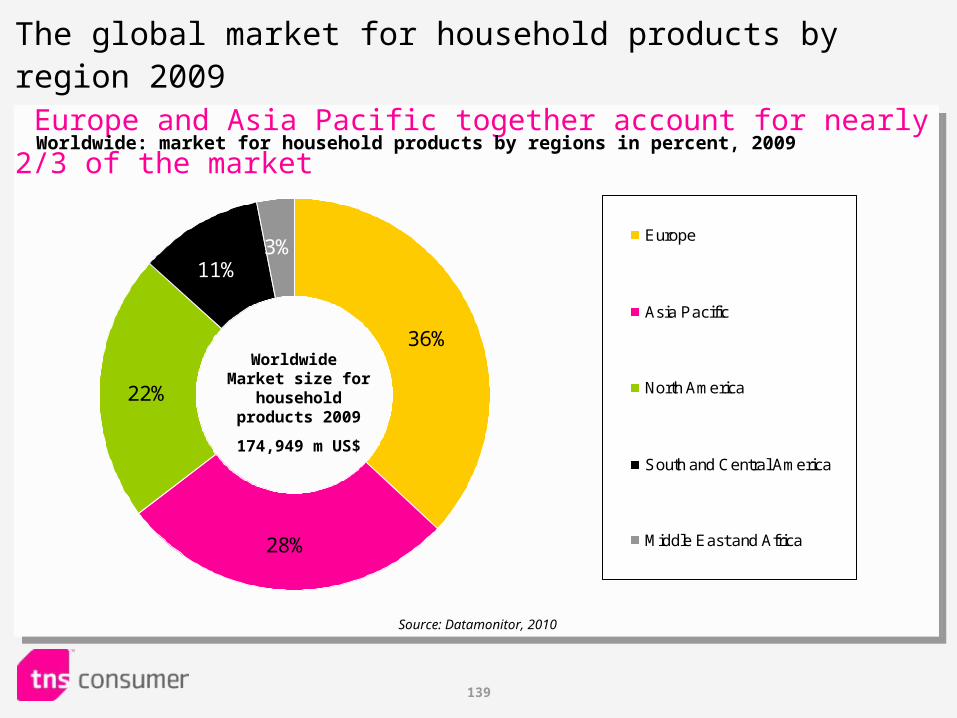
139
36%
28%
22%
3%11%
Europe
Asia Pacific
North America
South and Central America
Middle East and Africa
The global market for household products by region 2009 Europe and Asia Pacific together account for nearly 2/3 of the market
Worldwide: market for household products by regions in percent, 2009
Source: Datamonitor, 2010
Worldwide Market size for
household products 2009
174,949 m US$
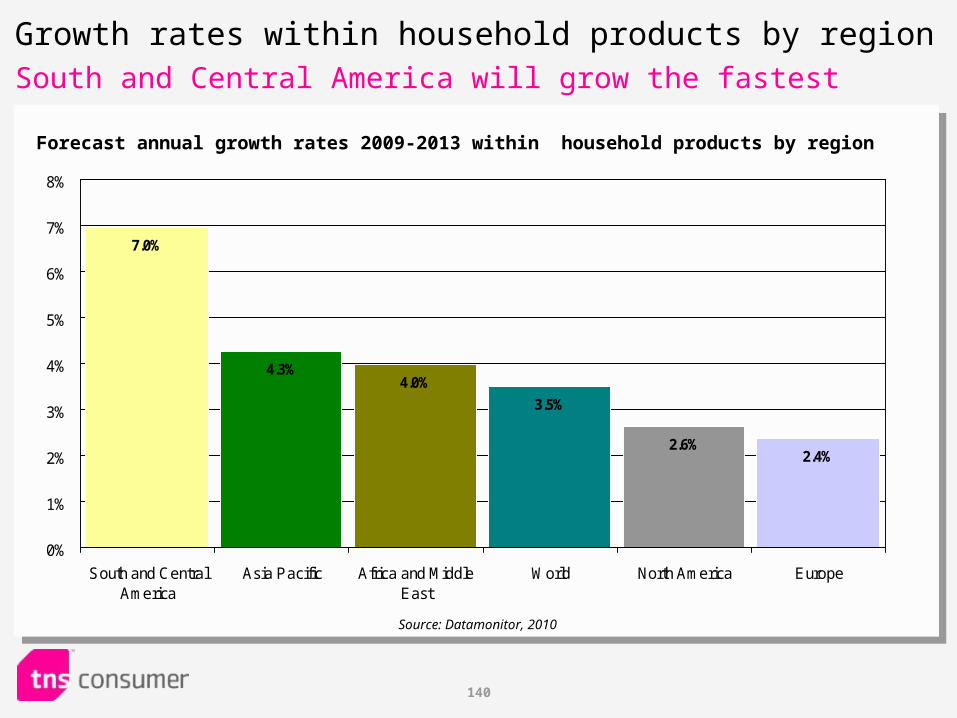
140
Growth rates within household products by regionSouth and Central America will grow the fastest
2.4%2.6%
3.5%
4.0%4.3%
7.0%
0%
1%
2%
3%
4%
5%
6%
7%
8%
South and CentralAmerica
Asia Pacific Africa and MiddleEast
World North America Europe
Forecast annual growth rates 2009-2013 within household products by region
Source: Datamonitor, 2010
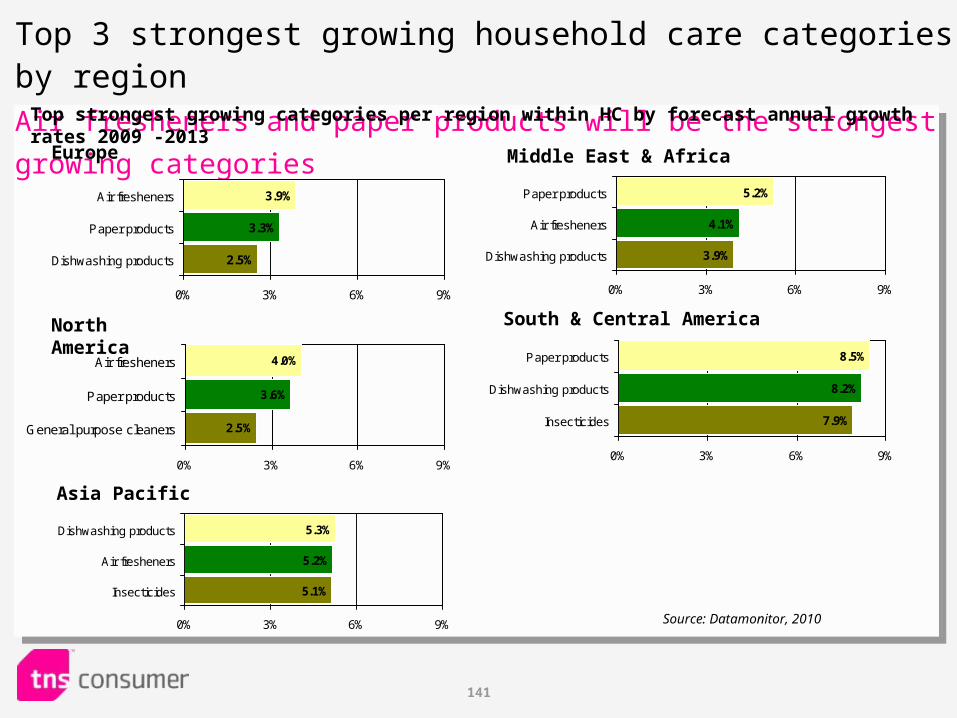
141
Top 3 strongest growing household care categories by regionAir fresheners and paper products will be the strongest growing categories
2.5%
3.3%
3.9%
0% 3% 6% 9%
Air fresheners
Paper products
Dishwashing products
Top strongest growing categories per region within HC by forecast annual growth rates 2009 -2013
Source: Datamonitor, 2010
4.0%
3.6%
2.5%
0% 3% 6% 9%
Air fresheners
Paper products
General purpose cleaners
5.1%
5.2%
5.3%
0% 3% 6% 9%
Dishwashing products
Air fresheners
Insecticides
Europe
North America
Asia Pacific
3.9%
4.1%
5.2%
0% 3% 6% 9%
Paper products
Air fresheners
Dishwashing products
South & Central America
7.9%
8.2%
8.5%
0% 3% 6% 9%
Paper products
Dishwashing products
Insecticides
Middle East & Africa
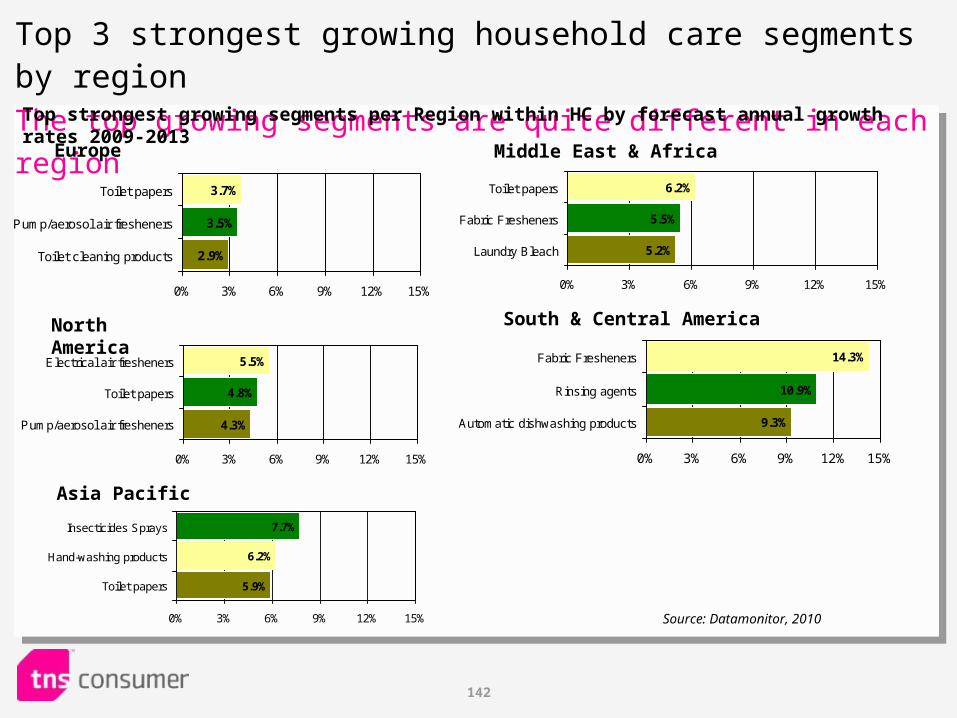
142
Top 3 strongest growing household care segments by regionThe top growing segments are quite different in each region
2.9%
3.5%
3.7%
0% 3% 6% 9% 12% 15%
Toilet papers
Pump/aerosol air fresheners
Toilet cleaning products
Top strongest growing segments per Region within HC by forecast annual growth rates 2009-2013
Source: Datamonitor, 2010
4.3%
4.8%
5.5%
0% 3% 6% 9% 12% 15%
Electrical air fresheners
Toilet papers
Pump/aerosol air fresheners
5.9%
6.2%
7.7%
0% 3% 6% 9% 12% 15%
Insecticides Sprays
Hand-washing products
Toilet papers
Europe
North America
Asia Pacific
5.2%
5.5%
6.2%
0% 3% 6% 9% 12% 15%
Toilet papers
Fabric Fresheners
Laundry Bleach
South & Central America
9.3%
10.9%
14.3%
0% 3% 6% 9% 12% 15%
Fabric Fresheners
Rinsing agents
Automatic dishwashing products
Middle East & Africa
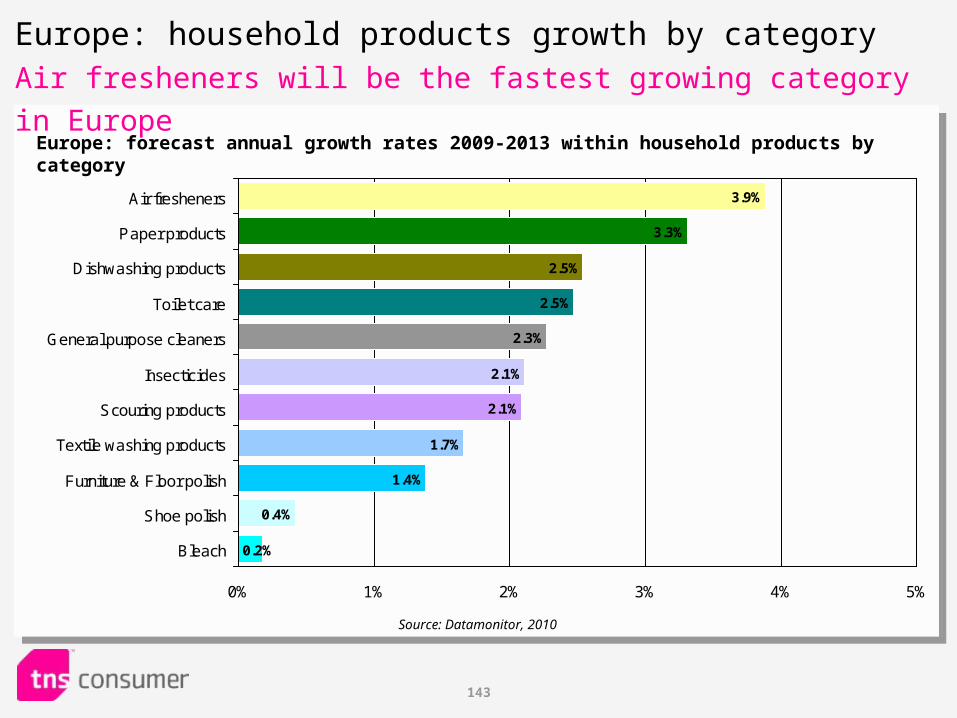
143
Europe: household products growth by categoryAir fresheners will be the fastest growing category in Europe
2.1%
2.1%
1.7%
1.4%
0.4%
0.2%
2.3%
2.5%
2.5%
3.3%
3.9%
0% 1% 2% 3% 4% 5%
Air fresheners
Paper products
Dishwashing products
Toilet care
General purpose cleaners
Insecticides
Scouring products
Textile washing products
Furniture & Floor polish
Shoe polish
Bleach
Europe: forecast annual growth rates 2009-2013 within household products by category
Source: Datamonitor, 2010
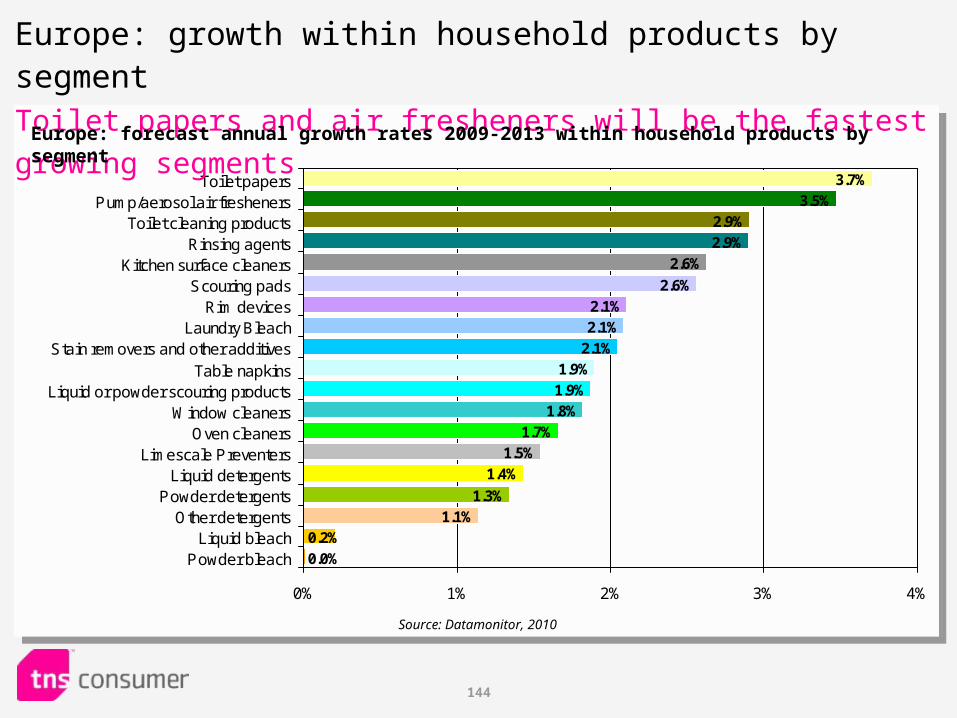
144
2.6%
2.1%
2.1%
2.1%
1.9%
1.9%
1.8%
1.7%
1.5%
1.4%
1.3%
1.1%
0.2%
0.0%
2.6%
2.9%
2.9%
3.5%
3.7%
0% 1% 2% 3% 4%
Toilet papersPump/aerosol air fresheners
Toilet cleaning productsRinsing agents
Kitchen surface cleanersScouring pads
Rim devicesLaundry Bleach
Stain removers and other additivesTable napkins
Liquid or powder scouring productsWindow cleaners
Oven cleanersLimescale Preventers
Liquid detergentsPowder detergents
Other detergentsLiquid bleach
Powder bleach
Europe: growth within household products by segmentToilet papers and air fresheners will be the fastest growing segments
Europe: forecast annual growth rates 2009-2013 within household products by segment
Source: Datamonitor, 2010
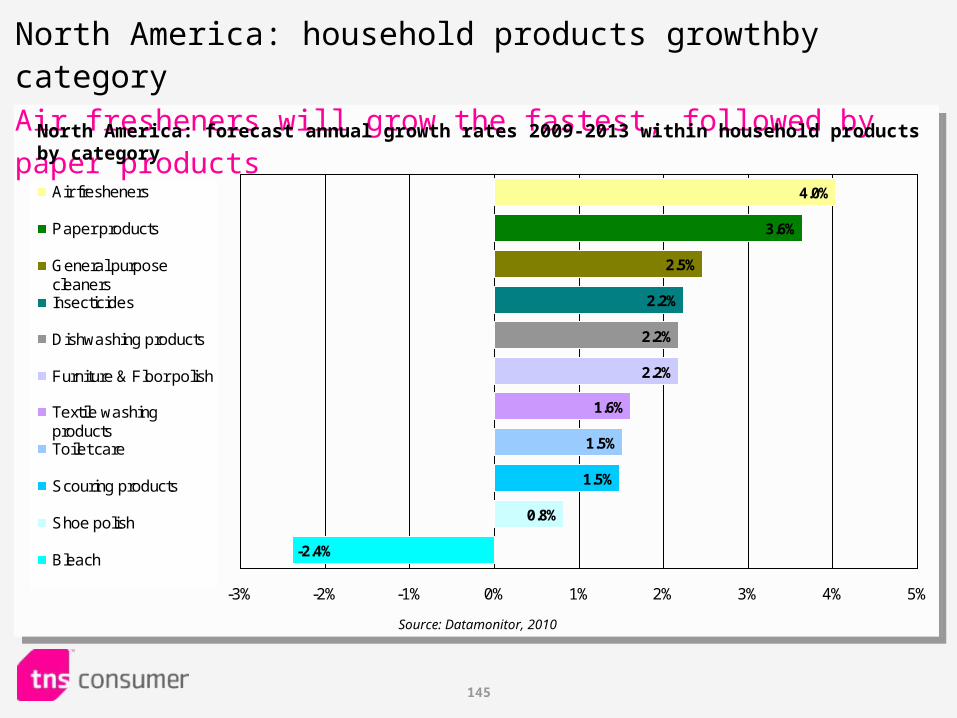
145
2.2%
1.6%
1.5%
1.5%
0.8%
-2.4%
2.2%
2.2%
2.5%
3.6%
4.0%
-3% -2% -1% 0% 1% 2% 3% 4% 5%
Air fresheners
Paper products
General purposecleanersInsecticides
Dishwashing products
Furniture & Floor polish
Textile washingproductsToilet care
Scouring products
Shoe polish
Bleach
North America: household products growthby category Air fresheners will grow the fastest, followed by paper products
North America: forecast annual growth rates 2009-2013 within household products by category
Source: Datamonitor, 2010
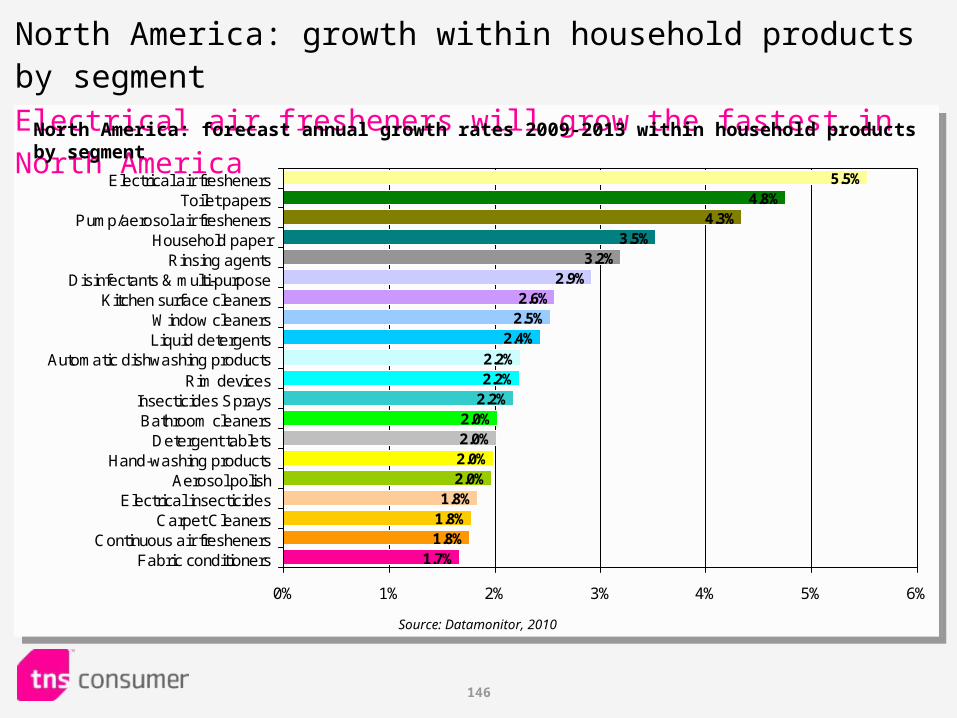
146
2.9%2.6%
2.5%2.4%
2.2%2.2%
2.2%2.0%2.0%2.0%2.0%
1.8%
1.7%
1.8%1.8%
3.2%3.5%
4.3%4.8%
5.5%
0% 1% 2% 3% 4% 5% 6%
Electrical air freshenersToilet papers
Pump/aerosol air freshenersHousehold paper
Rinsing agentsDisinfectants & multi-purpose
Kitchen surface cleanersWindow cleanersLiquid detergents
Automatic dishwashing productsRim devices
Insecticides SpraysBathroom cleaners
Detergent tabletsHand-washing products
Aerosol polishElectrical insecticides
Carpet CleanersContinuous air fresheners
Fabric conditioners
North America: growth within household products by segmentElectrical air fresheners will grow the fastest in North America
North America: forecast annual growth rates 2009-2013 within household products by segment
Source: Datamonitor, 2010
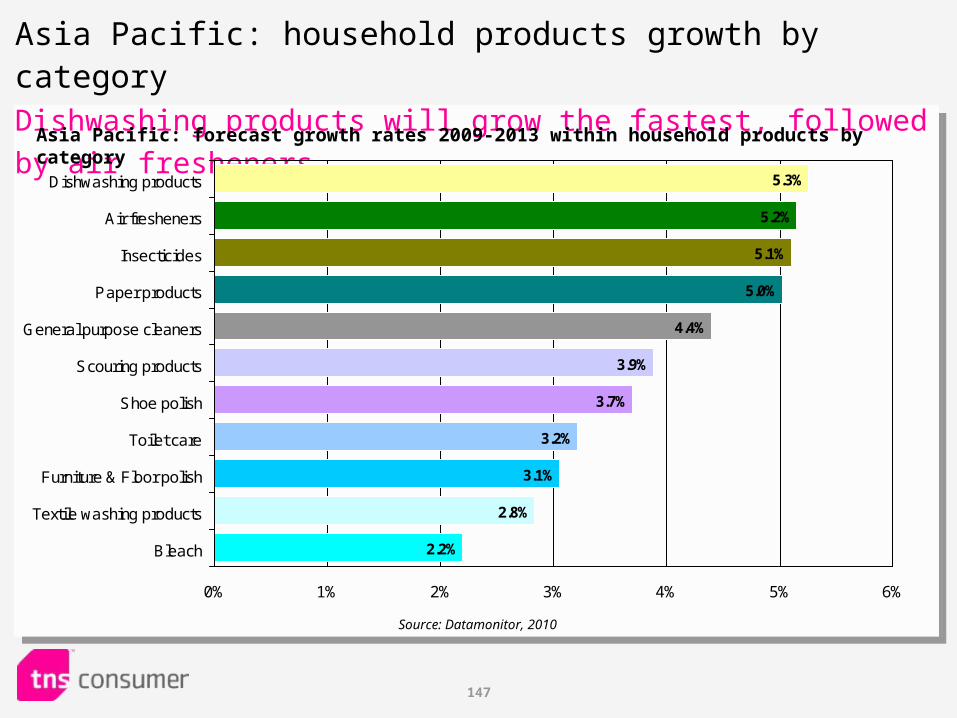
147
Asia Pacific: household products growth by category Dishwashing products will grow the fastest, followed by air fresheners
5.3%
5.2%
5.1%
5.0%
4.4%
2.2%
2.8%
3.1%
3.2%
3.7%
3.9%
0% 1% 2% 3% 4% 5% 6%
Dishwashing products
Air fresheners
Insecticides
Paper products
General purpose cleaners
Scouring products
Shoe polish
Toilet care
Furniture & Floor polish
Textile washing products
Bleach
Asia Pacific: forecast growth rates 2009-2013 within household products by category
Source: Datamonitor, 2010
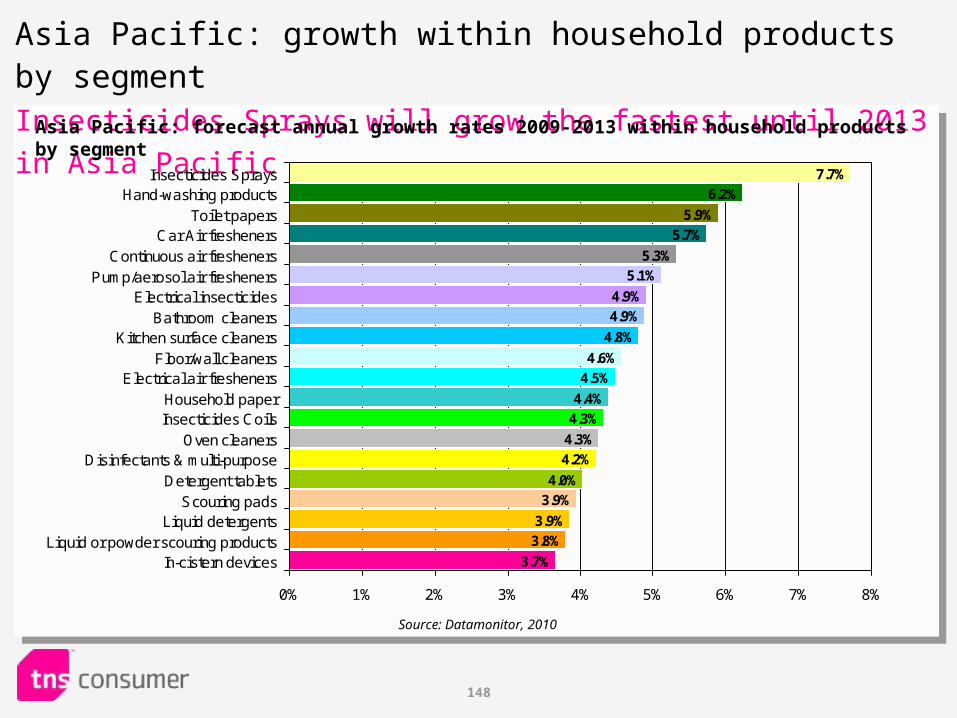
148
Asia Pacific: growth within household products by segment Insecticides Sprays will grow the fastest until 2013 in Asia Pacific
5.1%
4.9%
4.9%
4.8%
4.6%
4.5%
4.4%
4.3%
4.3%
4.2%
4.0%
3.9%
3.7%
3.9%
3.8%
5.3%
5.7%
5.9%
6.2%
7.7%
0% 1% 2% 3% 4% 5% 6% 7% 8%
Insecticides SpraysHand-washing products
Toilet papersCar Air fresheners
Continuous air freshenersPump/aerosol air fresheners
Electrical insecticidesBathroom cleaners
Kitchen surface cleanersFloor/wall cleaners
Electrical air freshenersHousehold paperInsecticides Coils
Oven cleanersDisinfectants & multi-purpose
Detergent tabletsScouring pads
Liquid detergentsLiquid or powder scouring products
In-cistern devices
Asia Pacific: forecast annual growth rates 2009-2013 within household products by segment
Source: Datamonitor, 2010
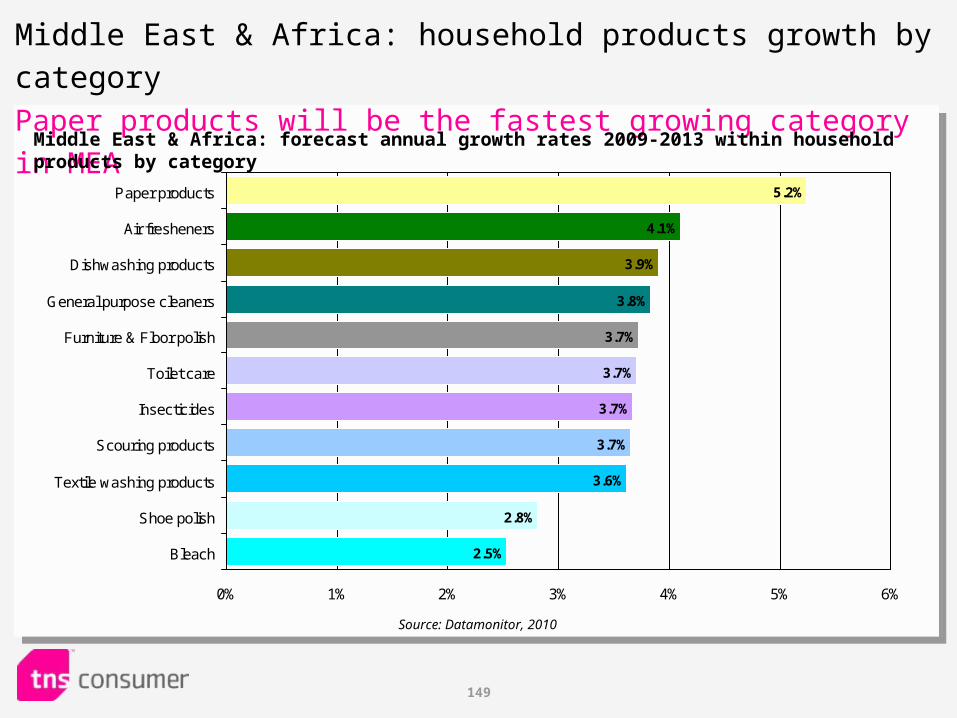
149
3.7%
3.7%
3.7%
3.6%
2.8%
2.5%
3.7%
3.8%
3.9%
4.1%
5.2%
0% 1% 2% 3% 4% 5% 6%
Paper products
Air fresheners
Dishwashing products
General purpose cleaners
Furniture & Floor polish
Toilet care
Insecticides
Scouring products
Textile washing products
Shoe polish
Bleach
Middle East & Africa: household products growth by category
Paper products will be the fastest growing category in MEA
Middle East & Africa: forecast annual growth rates 2009-2013 within household products by category
Source: Datamonitor, 2010
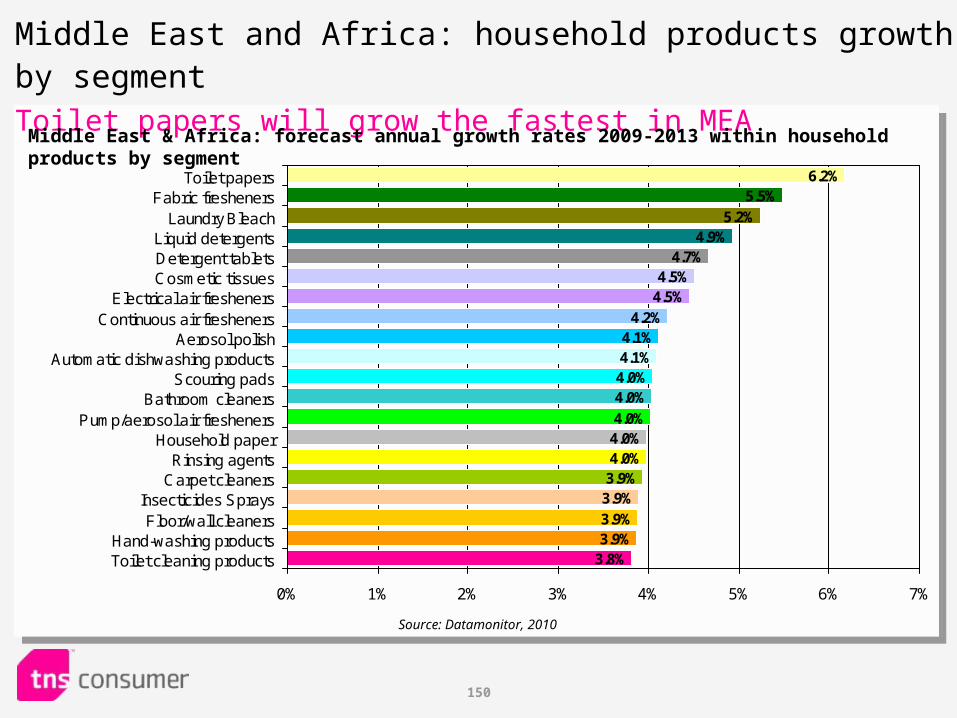
150
4.5%4.5%
4.2%4.1%4.1%4.0%4.0%4.0%4.0%4.0%3.9%3.9%
3.8%
3.9%3.9%
4.7%4.9%
5.2%5.5%
6.2%
0% 1% 2% 3% 4% 5% 6% 7%
Toilet papersFabric fresheners
Laundry BleachLiquid detergentsDetergent tabletsCosmetic tissues
Electrical air freshenersContinuous air fresheners
Aerosol polishAutomatic dishwashing products
Scouring padsBathroom cleaners
Pump/aerosol air freshenersHousehold paper
Rinsing agentsCarpet cleaners
Insecticides SpraysFloor/wall cleaners
Hand-washing productsToilet cleaning products
Middle East and Africa: household products growth by segmentToilet papers will grow the fastest in MEA
Middle East & Africa: forecast annual growth rates 2009-2013 within household products by segment
Source: Datamonitor, 2010
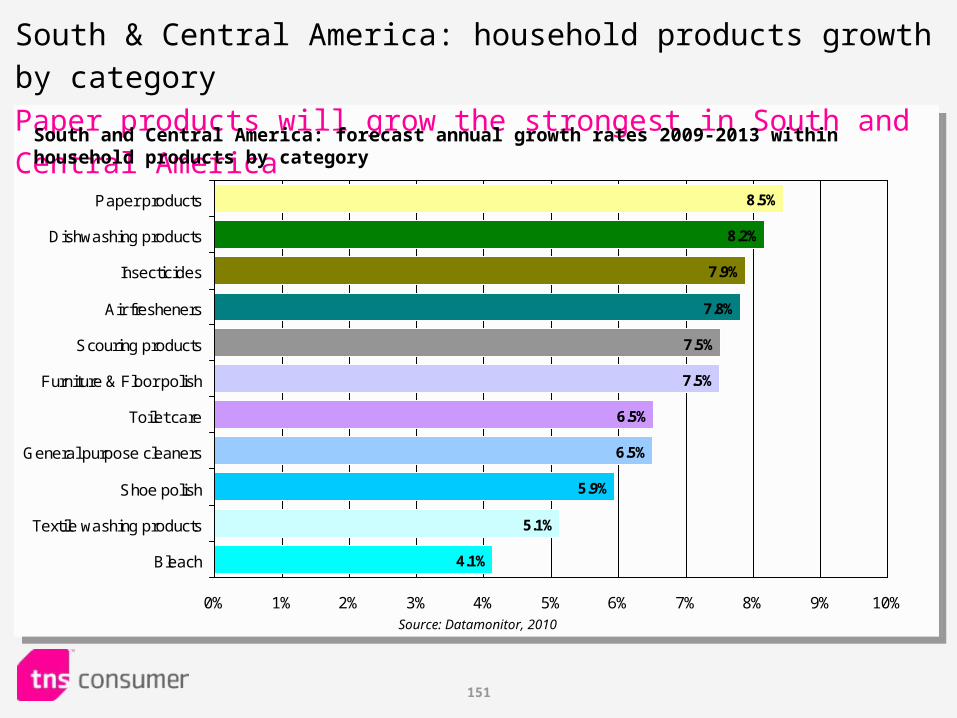
151
8.5%
8.2%
7.9%
7.8%
7.5%
4.1%
5.1%
5.9%
6.5%
6.5%
7.5%
0% 1% 2% 3% 4% 5% 6% 7% 8% 9% 10%
Paper products
Dishwashing products
Insecticides
Air fresheners
Scouring products
Furniture & Floor polish
Toilet care
General purpose cleaners
Shoe polish
Textile washing products
Bleach
South & Central America: household products growth by category
Paper products will grow the strongest in South and Central America
South and Central America: forecast annual growth rates 2009-2013 within household products by category
Source: Datamonitor, 2010
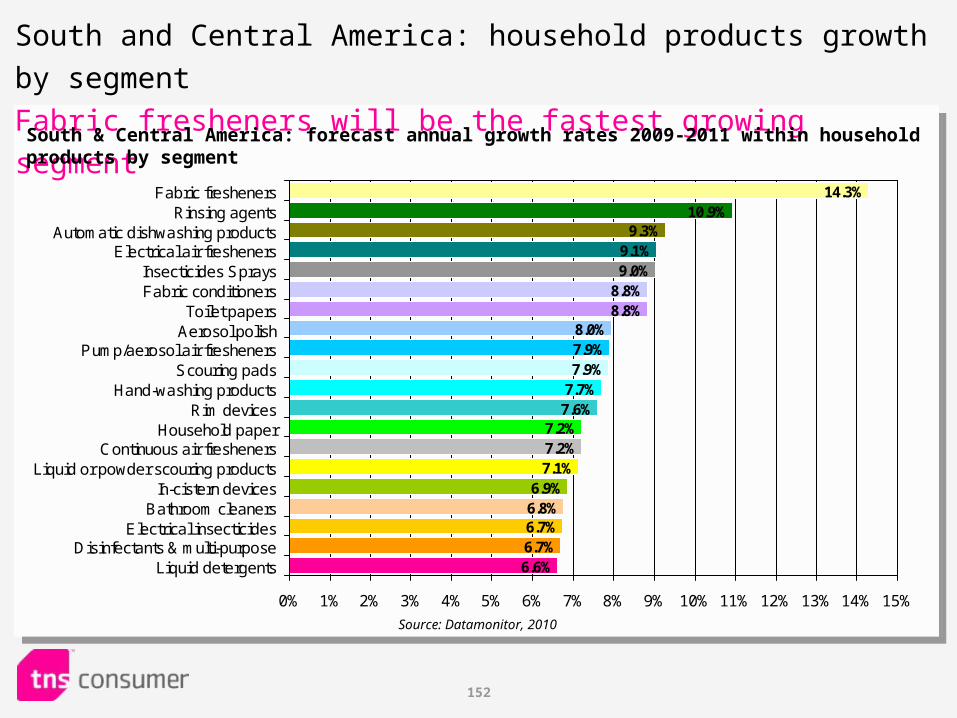
152
8.8%8.8%
8.0%7.9%7.9%
7.7%7.6%
7.2%7.2%7.1%
6.9%6.8%
6.6%
6.7%6.7%
9.0%9.1%
9.3%10.9%
14.3%
0% 1% 2% 3% 4% 5% 6% 7% 8% 9% 10% 11% 12% 13% 14% 15%
Fabric freshenersRinsing agents
Automatic dishwashing productsElectrical air fresheners
Insecticides SpraysFabric conditioners
Toilet papersAerosol polish
Pump/aerosol air freshenersScouring pads
Hand-washing productsRim devices
Household paperContinuous air fresheners
Liquid or powder scouring productsIn-cistern devices
Bathroom cleanersElectrical insecticides
Disinfectants & multi-purposeLiquid detergents
South and Central America: household products growth by segment
Fabric fresheners will be the fastest growing segment
South & Central America: forecast annual growth rates 2009-2011 within household products by segment
Source: Datamonitor, 2010
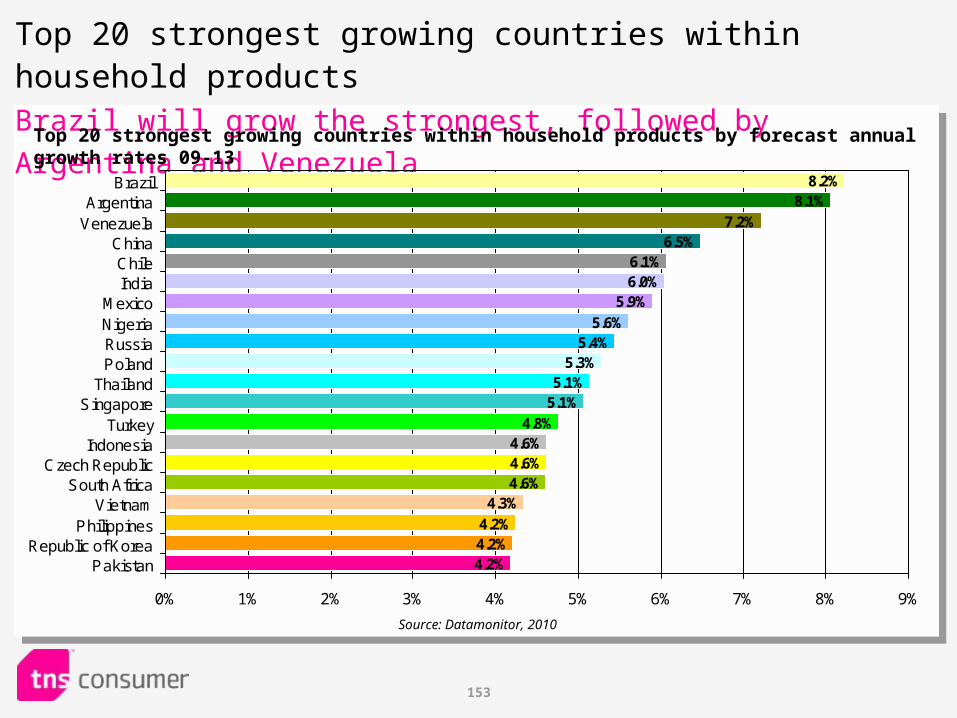
153
Top 20 strongest growing countries within household productsBrazil will grow the strongest, followed by Argentina and Venezuela
6.0%5.9%
5.6%5.4%
5.3%5.1%
5.1%
4.8%4.6%4.6%4.6%
4.3%
4.2%
4.2%4.2%
6.1%6.5%
7.2%
8.1%8.2%
0% 1% 2% 3% 4% 5% 6% 7% 8% 9%
BrazilArgentina
VenezuelaChinaChileIndia
MexicoNigeriaRussiaPoland
ThailandSingapore
TurkeyIndonesia
Czech RepublicSouth Africa
VietnamPhilippines
Republic of KoreaPakistan
Top 20 strongest growing countries within household products by forecast annual growth rates 09-13
Source: Datamonitor, 2010
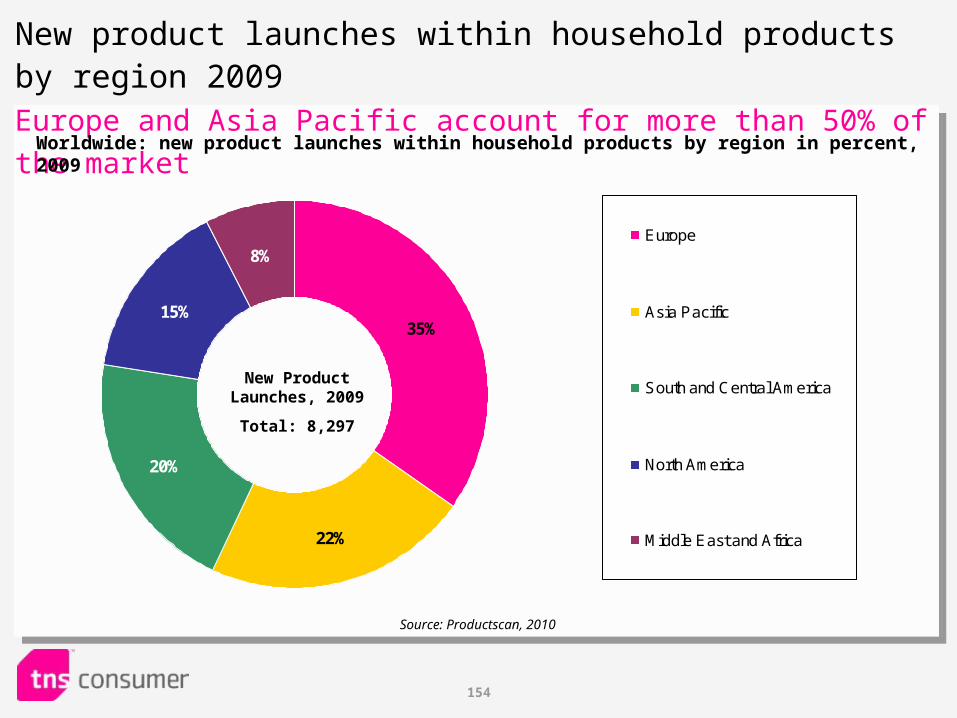
154
35%
22%
20%
15%
8%Europe
Asia Pacific
South and Central America
North America
Middle East and Africa
New product launches within household products by region 2009Europe and Asia Pacific account for more than 50% of the market
Worldwide: new product launches within household products by region in percent, 2009
New Product Launches, 2009
Total: 8,297
Source: Productscan, 2010
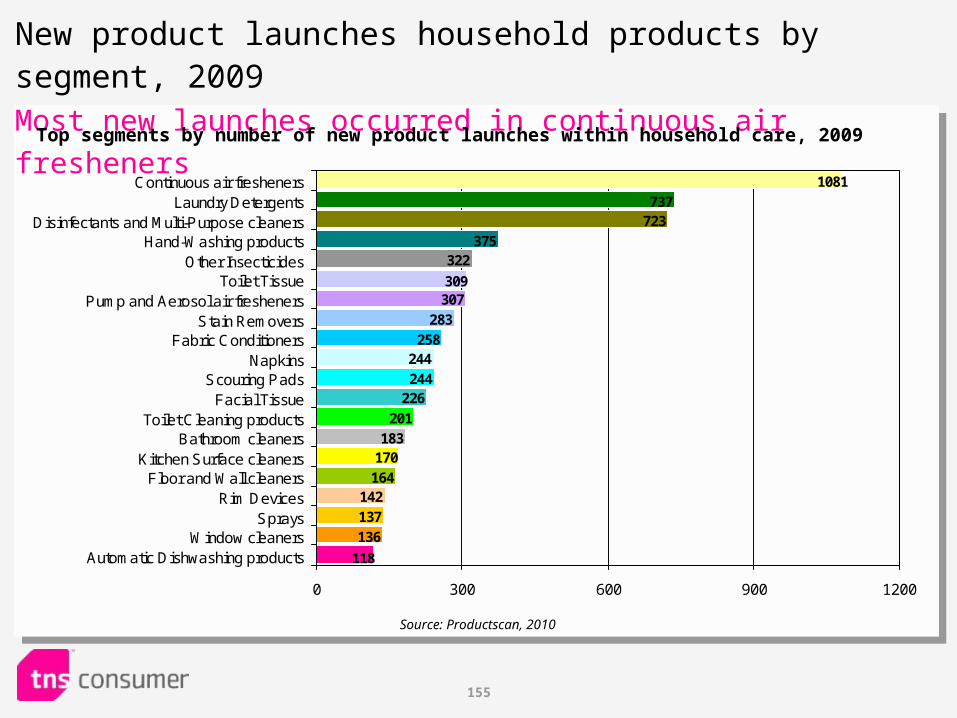
155
1081
737723
375322
136
137
118
142164
170183
201
226244
244258
283
307309
0 300 600 900 1200
Continuous air freshenersLaundry Detergents
Disinfectants and Multi-Purpose cleanersHand-Washing products
Other InsecticidesToilet Tissue
Pump and Aerosol air freshenersStain Removers
Fabric ConditionersNapkins
Scouring PadsFacial Tissue
Toilet Cleaning productsBathroom cleaners
Kitchen Surface cleanersFloor and Wall cleaners
Rim DevicesSprays
Window cleanersAutomatic Dishwashing products
New product launches household products by segment, 2009Most new launches occurred in continuous air fresheners
Top segments by number of new product launches within household care, 2009
Source: Productscan, 2010
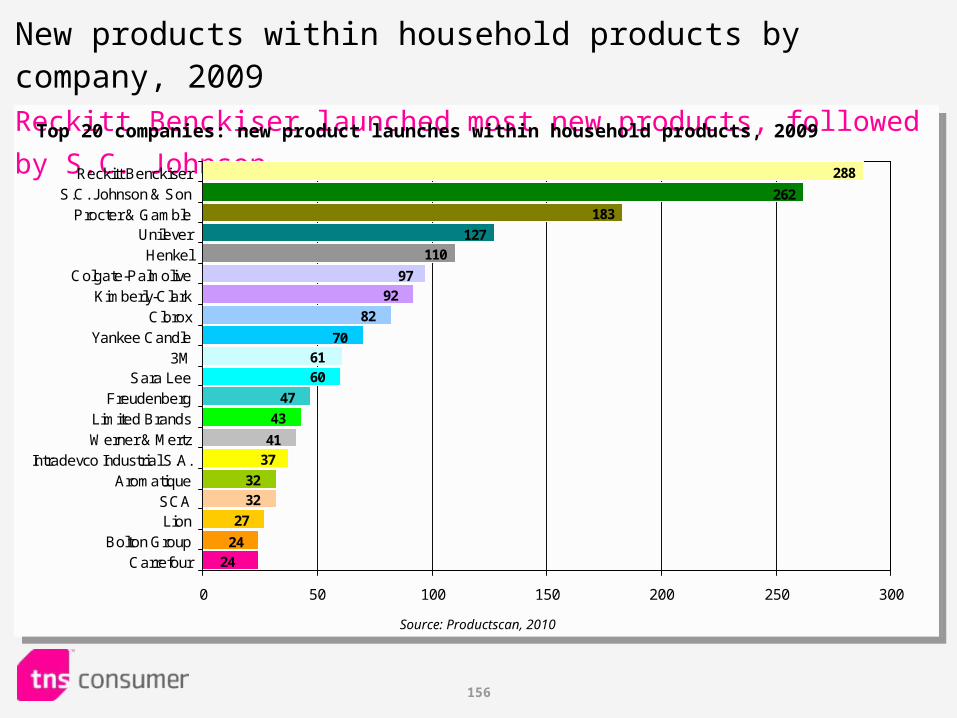
156
New products within household products by company, 2009Reckitt Benckiser launched most new products, followed by S.C. Johnson
288
262
183
127
110
24
27
24
32
32
37
41
43
47
60
61
70
82
92
97
0 50 100 150 200 250 300
Reckitt BenckiserS.C. Johnson & Son
Procter & GambleUnileverHenkel
Colgate-PalmoliveKimberly-Clark
CloroxYankee Candle
3MSara Lee
FreudenbergLimited BrandsWerner & Mertz
Intradevco Industrial S.A.Aromatique
SCALion
Bolton GroupCarrefour
Top 20 companies: new product launches within household products, 2009
Source: Productscan, 2010
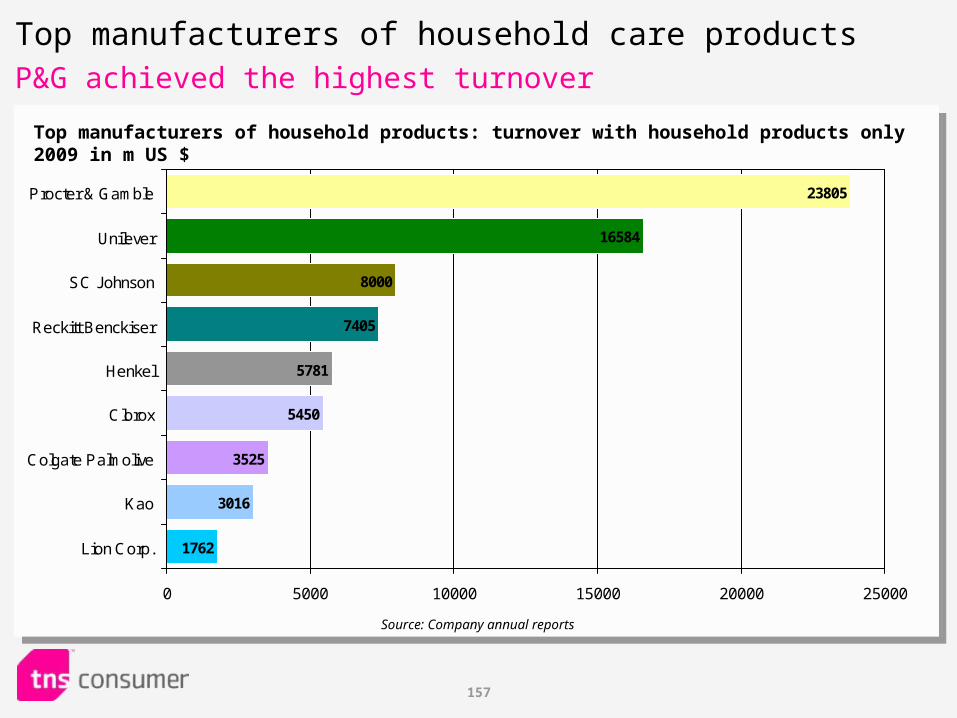
157
23805
16584
8000
7405
5781
1762
3016
3525
5450
0 5000 10000 15000 20000 25000
Procter & Gamble
Unilever
SC Johnson
Reckitt Benckiser
Henkel
Clorox
Colgate Palmolive
Kao
Lion Corp.
Top manufacturers of household care productsP&G achieved the highest turnover
Top manufacturers of household products: turnover with household products only 2009 in m US $
Source: Company annual reports

158
Market for Pet Care
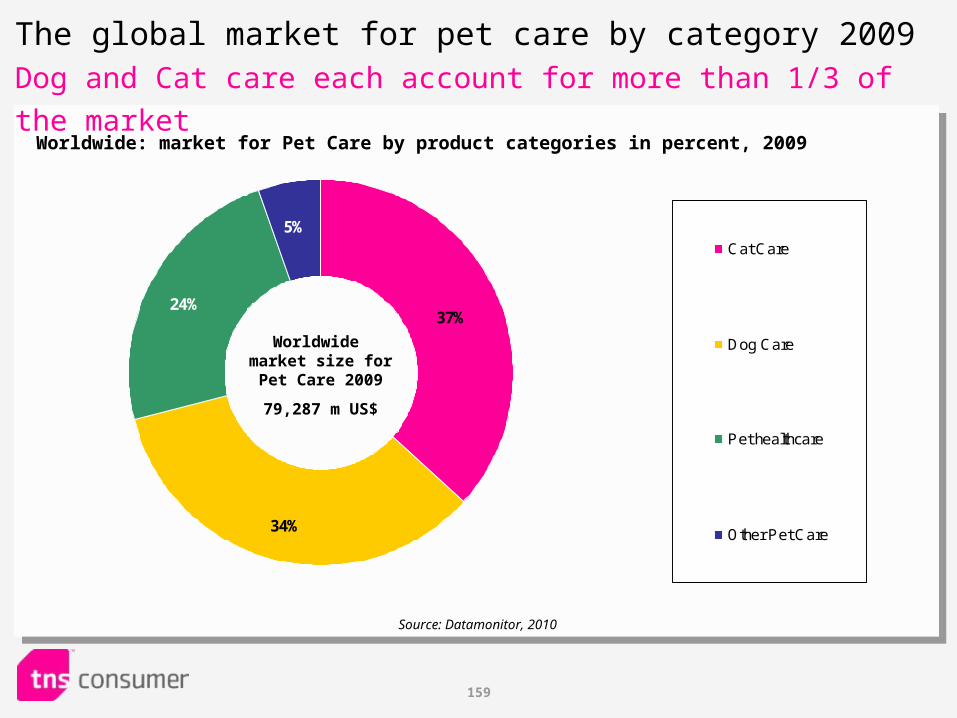
159
37%
34%
5%
24%
Cat Care
Dog Care
Pet healthcare
Other Pet Care
The global market for pet care by category 2009Dog and Cat care each account for more than 1/3 of the market
Worldwide: market for Pet Care by product categories in percent, 2009
Source: Datamonitor, 2010
Worldwide market size for Pet
Care 2009
79,287 m US$
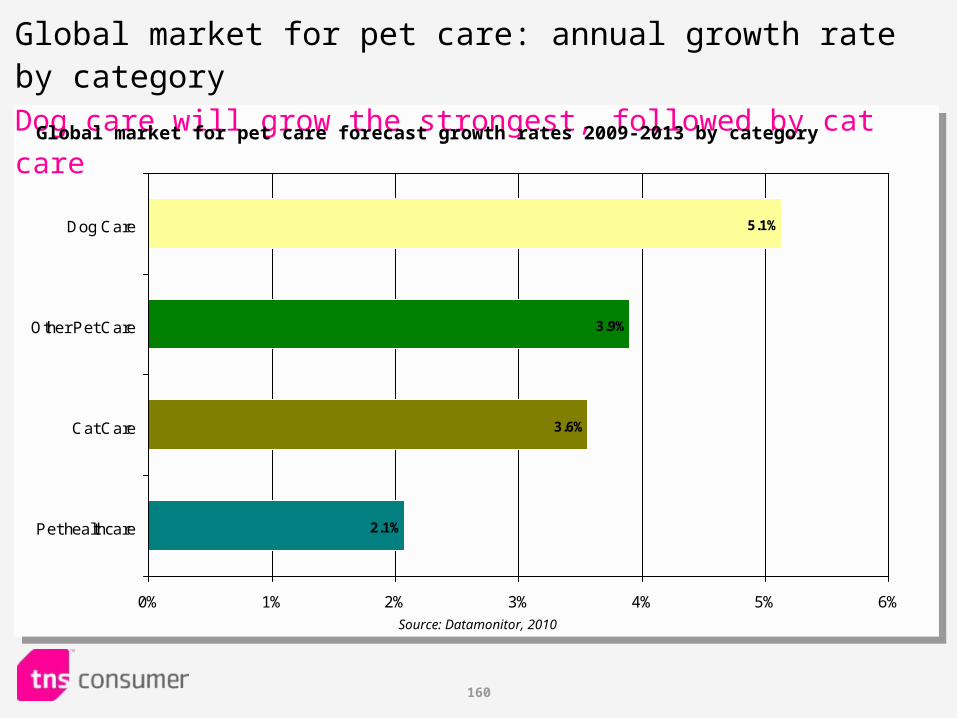
160
Global market for pet care: annual growth rate by categoryDog care will grow the strongest, followed by cat care
Global market for pet care forecast growth rates 2009-2013 by category
Source: Datamonitor, 2010
2.1%
3.6%
3.9%
5.1%
0% 1% 2% 3% 4% 5% 6%
Dog Care
Other Pet Care
Cat Care
Pet healthcare
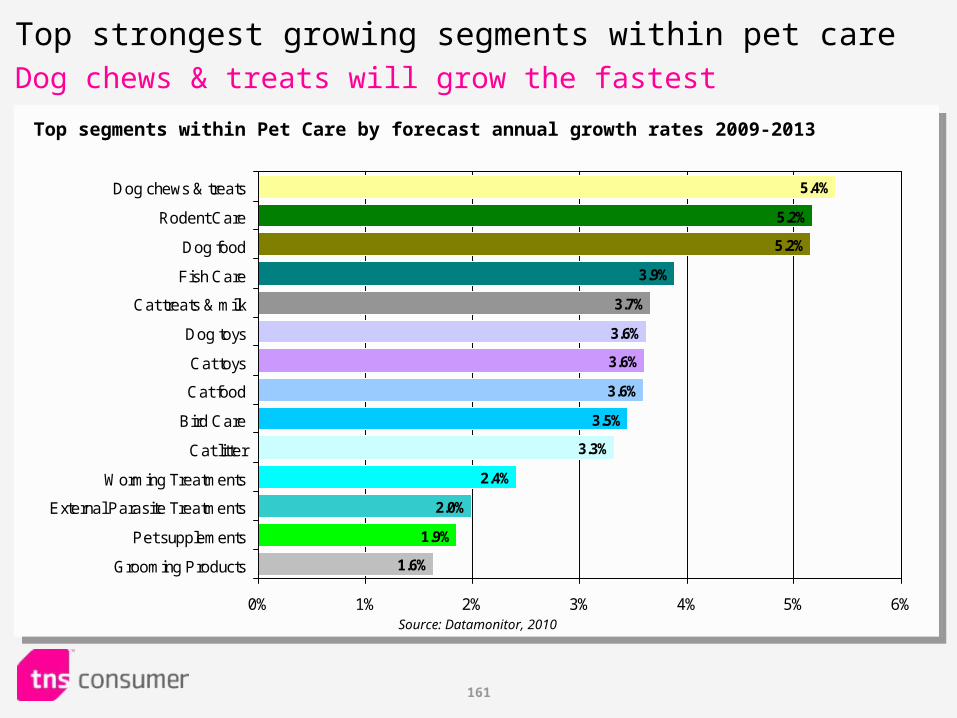
161
Top strongest growing segments within pet careDog chews & treats will grow the fastest
3.6%
3.6%
3.6%
3.5%
3.3%
2.4%
2.0%
1.9%
1.6%
3.7%
3.9%
5.2%
5.2%
5.4%
0% 1% 2% 3% 4% 5% 6%
Dog chews & treats
Rodent Care
Dog food
Fish Care
Cat treats & milk
Dog toys
Cat toys
Cat food
Bird Care
Cat litter
Worming Treatments
External Parasite Treatments
Pet supplements
Grooming Products
Source: Datamonitor, 2010
Top segments within Pet Care by forecast annual growth rates 2009-2013
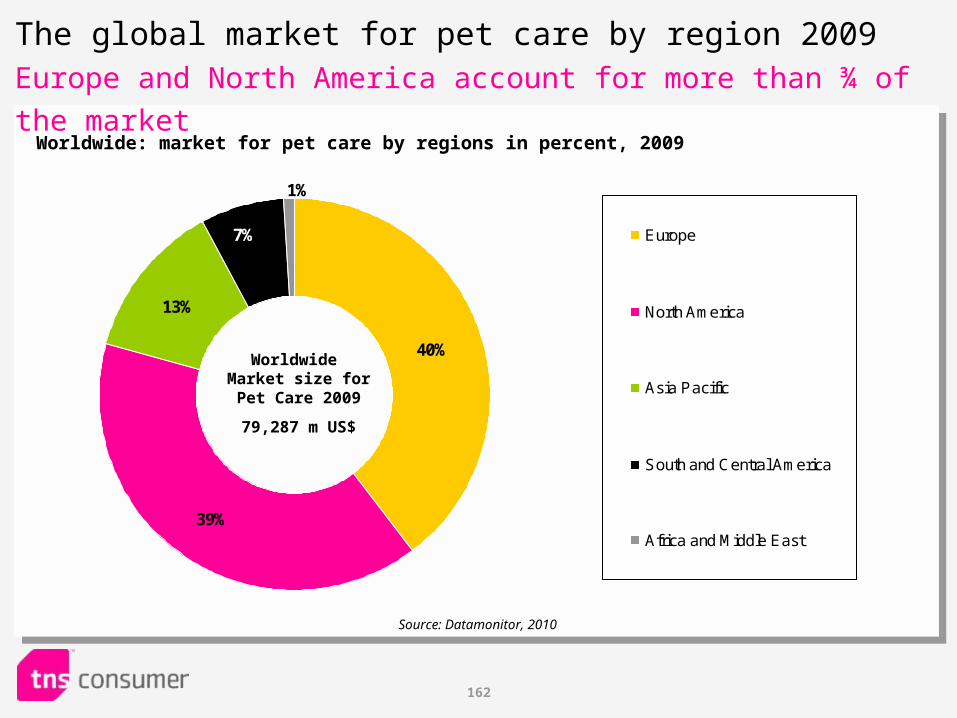
162
40%
39%
13%
1%
7% Europe
North America
Asia Pacific
South and Central America
Africa and Middle East
The global market for pet care by region 2009Europe and North America account for more than ¾ of the market
Worldwide: market for pet care by regions in percent, 2009
Source: Datamonitor, 2010
Worldwide Market size for Pet
Care 2009
79,287 m US$
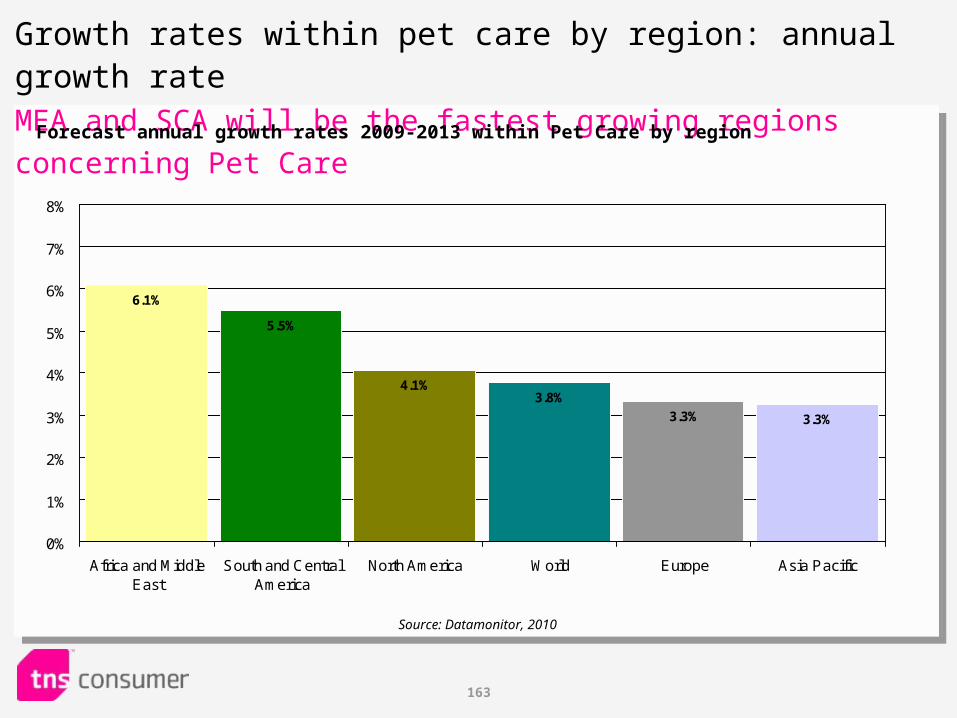
163
Growth rates within pet care by region: annual growth rate MEA and SCA will be the fastest growing regions concerning Pet Care
3.3%3.3%
3.8%4.1%
5.5%
6.1%
0%
1%
2%
3%
4%
5%
6%
7%
8%
Africa and MiddleEast
South and CentralAmerica
North America World Europe Asia Pacific
Forecast annual growth rates 2009-2013 within Pet Care by region
Source: Datamonitor, 2010
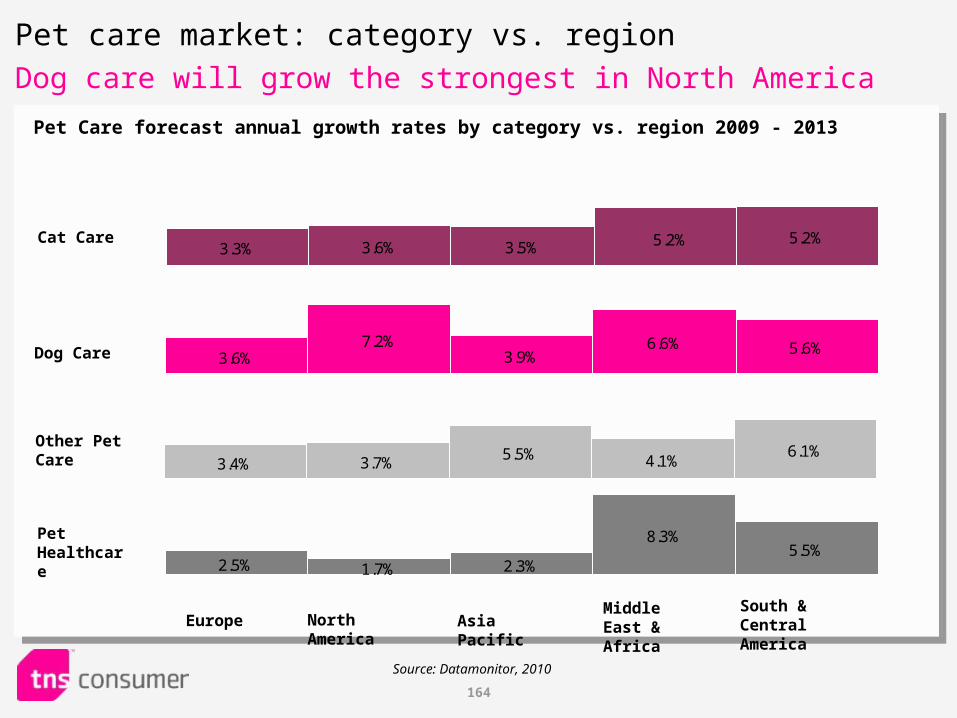
164
Source: Datamonitor, 2010
Middle East & Africa
South & Central AmericaAsia PacificNorth AmericaEurope
Pet Healthcare
Other Pet Care
Cat Care
Pet Care forecast annual growth rates by category vs. region 2009 - 2013
2.5% 1.7% 2.3%
8.3%5.5%
Pet care market: category vs. region
Dog care will grow the strongest in North America
3.4% 3.7%5.5% 4.1%
6.1%
Dog Care 3.6%7.2%
3.9%6.6% 5.6%
3.3% 3.6% 3.5%5.2%5.2%
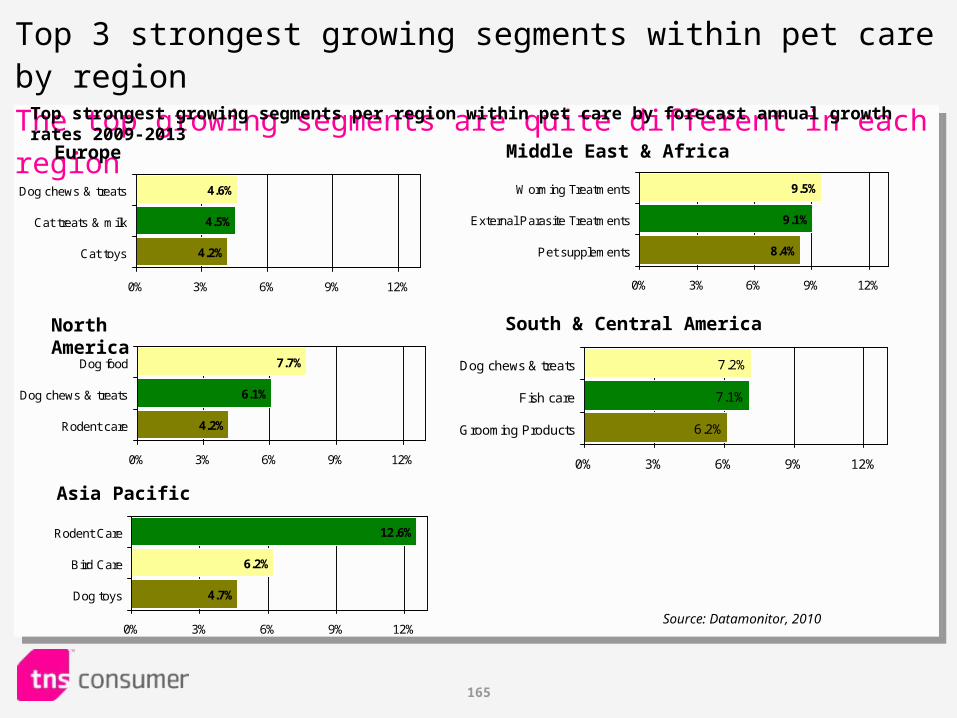
165
Top 3 strongest growing segments within pet care by regionThe top growing segments are quite different in each region
4.2%
4.5%
4.6%
0% 3% 6% 9% 12%
Dog chews & treats
Cat treats & milk
Cat toys
Top strongest growing segments per region within pet care by forecast annual growth rates 2009-2013
Source: Datamonitor, 2010
4.2%
6.1%
7.7%
0% 3% 6% 9% 12%
Dog food
Dog chews & treats
Rodent care
4.7%
6.2%
12.6%
0% 3% 6% 9% 12%
Rodent Care
Bird Care
Dog toys
Europe
North America
Asia Pacific
8.4%
9.1%
9.5%
0% 3% 6% 9% 12%
Worming Treatments
External Parasite Treatments
Pet supplements
South & Central America
6.2%
7.1%
7.2%
0% 3% 6% 9% 12%
Dog chews & treats
Fish care
Grooming Products
Middle East & Africa
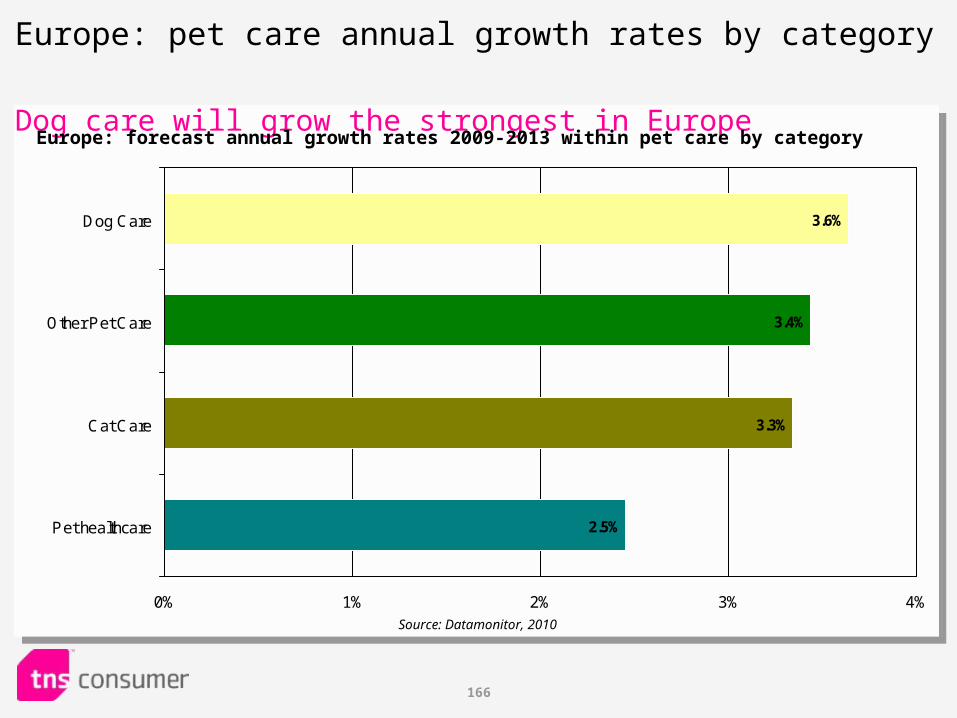
166
Europe: pet care annual growth rates by category Dog care will grow the strongest in Europe
2.5%
3.3%
3.4%
3.6%
0% 1% 2% 3% 4%
Dog Care
Other Pet Care
Cat Care
Pet healthcare
Europe: forecast annual growth rates 2009-2013 within pet care by category
Source: Datamonitor, 2010
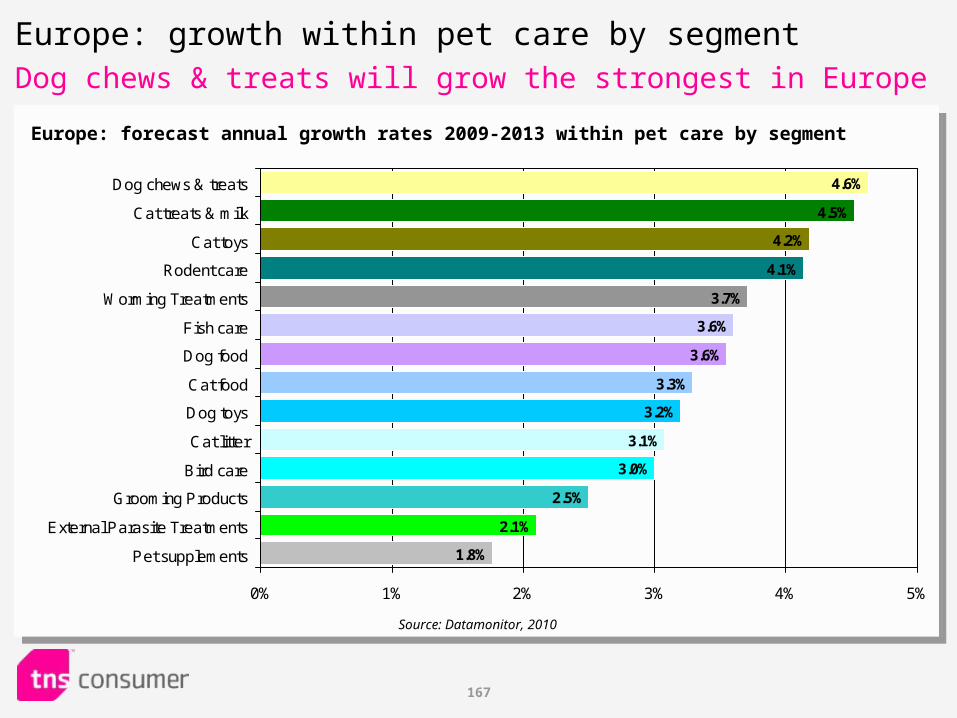
167
3.6%
3.6%
3.3%
3.2%
3.1%
3.0%
2.5%
2.1%
1.8%
3.7%
4.1%
4.2%
4.5%
4.6%
0% 1% 2% 3% 4% 5%
Dog chews & treats
Cat treats & milk
Cat toys
Rodent care
Worming Treatments
Fish care
Dog food
Cat food
Dog toys
Cat litter
Bird care
Grooming Products
External Parasite Treatments
Pet supplements
Europe: growth within pet care by segmentDog chews & treats will grow the strongest in Europe
Europe: forecast annual growth rates 2009-2013 within pet care by segment
Source: Datamonitor, 2010
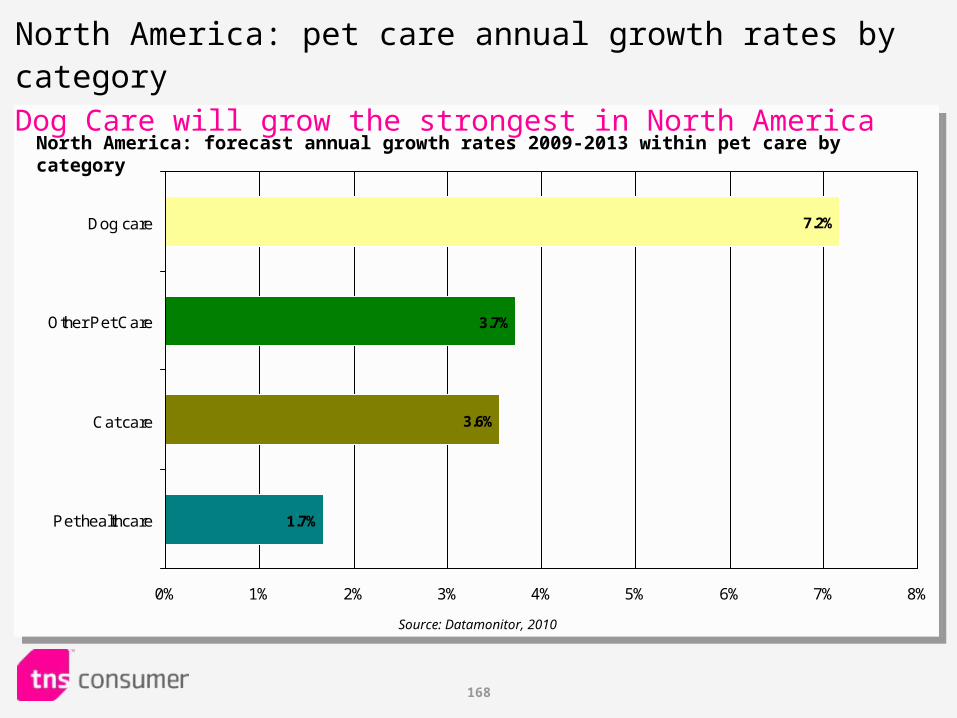
168
1.7%
3.6%
3.7%
7.2%
0% 1% 2% 3% 4% 5% 6% 7% 8%
Dog care
Other Pet Care
Cat care
Pet healthcare
North America: pet care annual growth rates by categoryDog Care will grow the strongest in North America
North America: forecast annual growth rates 2009-2013 within pet care by category
Source: Datamonitor, 2010
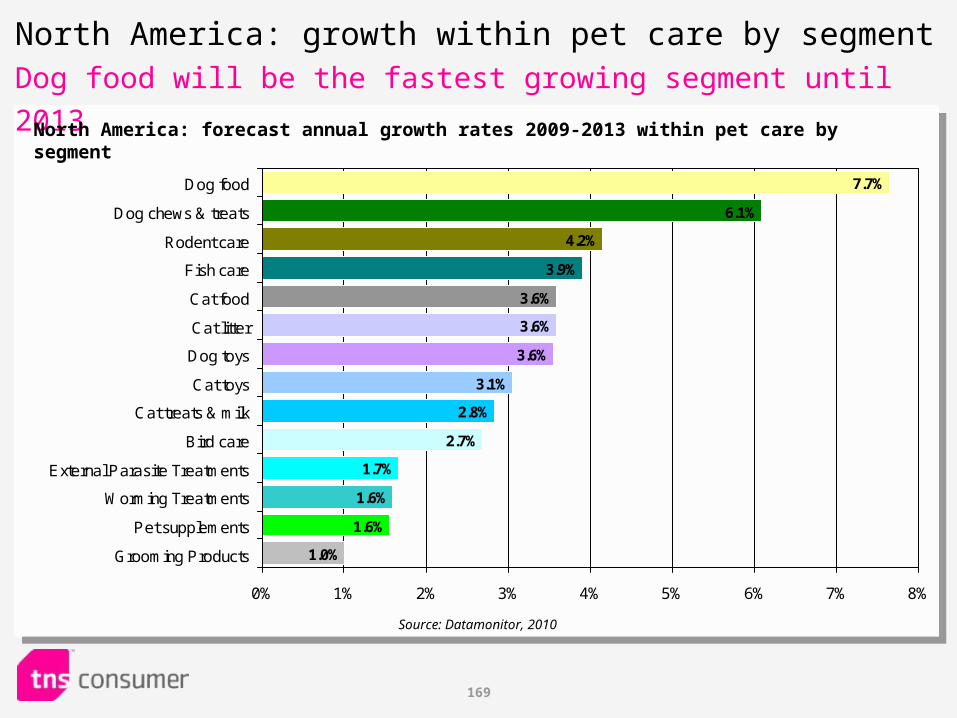
169
3.6%
3.6%
3.1%
2.8%
2.7%
1.7%
1.6%
1.6%
1.0%
3.6%
3.9%
4.2%
6.1%
7.7%
0% 1% 2% 3% 4% 5% 6% 7% 8%
Dog food
Dog chews & treats
Rodent care
Fish care
Cat food
Cat litter
Dog toys
Cat toys
Cat treats & milk
Bird care
External Parasite Treatments
Worming Treatments
Pet supplements
Grooming Products
North America: growth within pet care by segmentDog food will be the fastest growing segment until 2013
North America: forecast annual growth rates 2009-2013 within pet care by segment
Source: Datamonitor, 2010
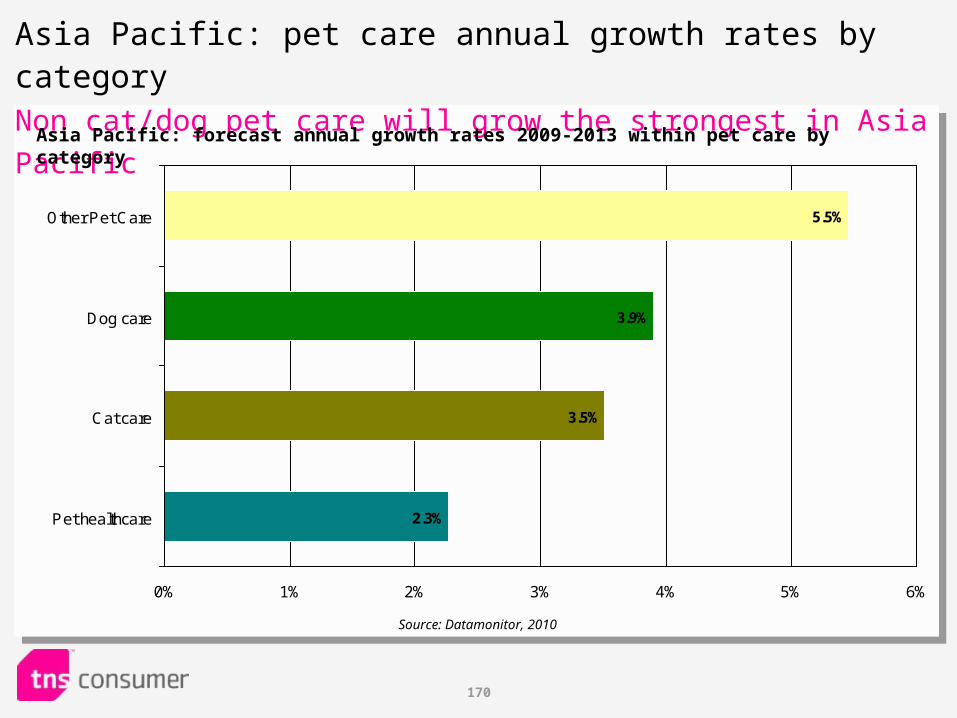
170
Asia Pacific: pet care annual growth rates by category Non cat/dog pet care will grow the strongest in Asia Pacific
2.3%
3.5%
3.9%
5.5%
0% 1% 2% 3% 4% 5% 6%
Other Pet Care
Dog care
Cat care
Pet healthcare
Asia Pacific: forecast annual growth rates 2009-2013 within pet care by category
Source: Datamonitor, 2010
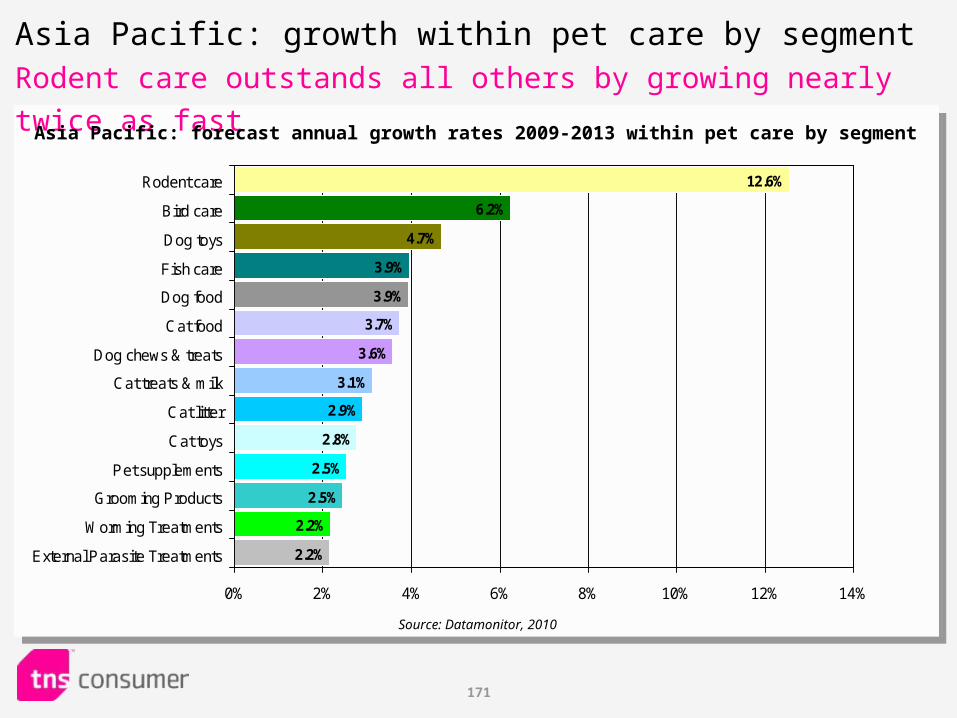
171
Asia Pacific: growth within pet care by segmentRodent care outstands all others by growing nearly twice as fast
3.7%
3.6%
3.1%
2.9%
2.8%
2.5%
2.5%
2.2%
2.2%
3.9%
3.9%
4.7%
6.2%
12.6%
0% 2% 4% 6% 8% 10% 12% 14%
Rodent care
Bird care
Dog toys
Fish care
Dog food
Cat food
Dog chews & treats
Cat treats & milk
Cat litter
Cat toys
Pet supplements
Grooming Products
Worming Treatments
External Parasite Treatments
Asia Pacific: forecast annual growth rates 2009-2013 within pet care by segment
Source: Datamonitor, 2010
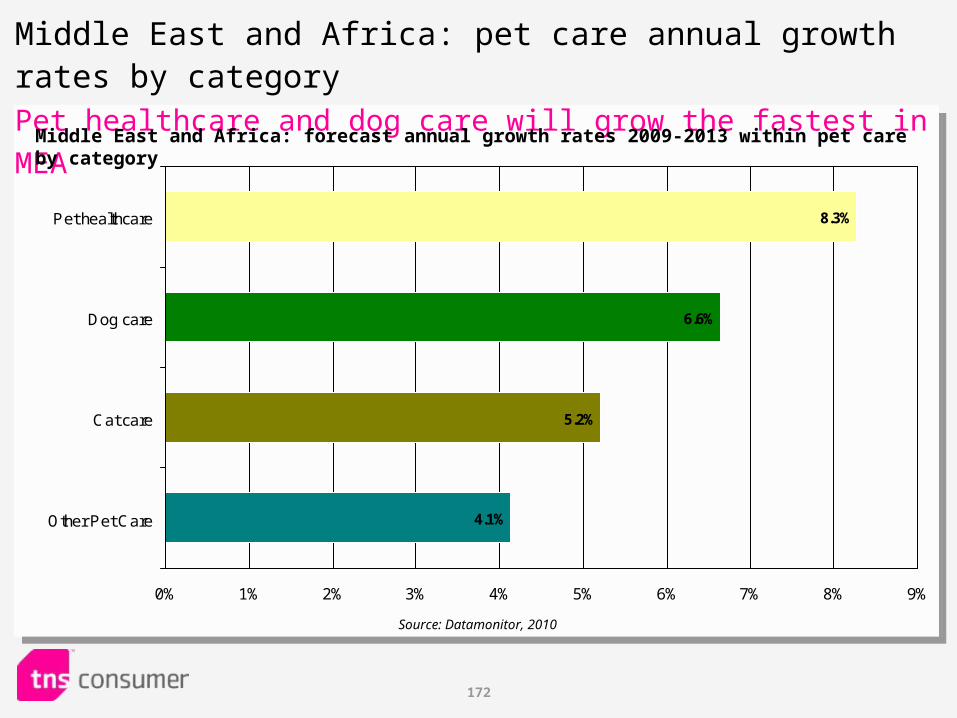
172
4.1%
5.2%
6.6%
8.3%
0% 1% 2% 3% 4% 5% 6% 7% 8% 9%
Pet healthcare
Dog care
Cat care
Other Pet Care
Middle East and Africa: pet care annual growth rates by category
Pet healthcare and dog care will grow the fastest in MEAMiddle East and Africa: forecast annual growth rates 2009-2013 within pet care by category
Source: Datamonitor, 2010
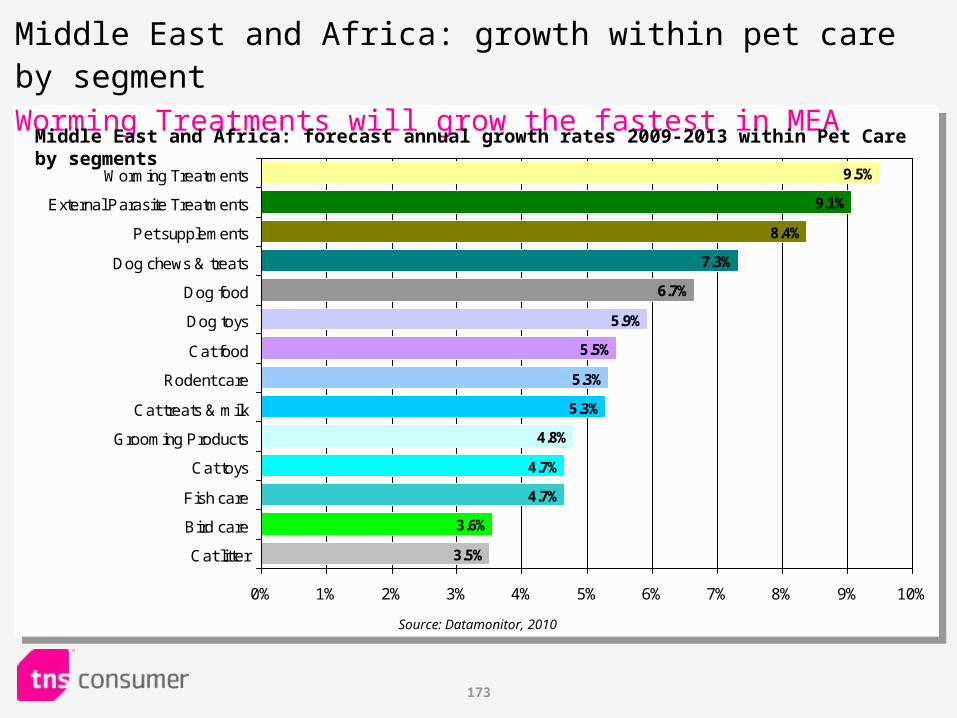
173
5.9%
5.5%
5.3%
5.3%
4.8%
4.7%
4.7%
3.6%
3.5%
6.7%
7.3%
8.4%
9.1%
9.5%
0% 1% 2% 3% 4% 5% 6% 7% 8% 9% 10%
Worming Treatments
External Parasite Treatments
Pet supplements
Dog chews & treats
Dog food
Dog toys
Cat food
Rodent care
Cat treats & milk
Grooming Products
Cat toys
Fish care
Bird care
Cat litter
Middle East and Africa: growth within pet care by segmentWorming Treatments will grow the fastest in MEA
Middle East and Africa: forecast annual growth rates 2009-2013 within Pet Care by segments
Source: Datamonitor, 2010
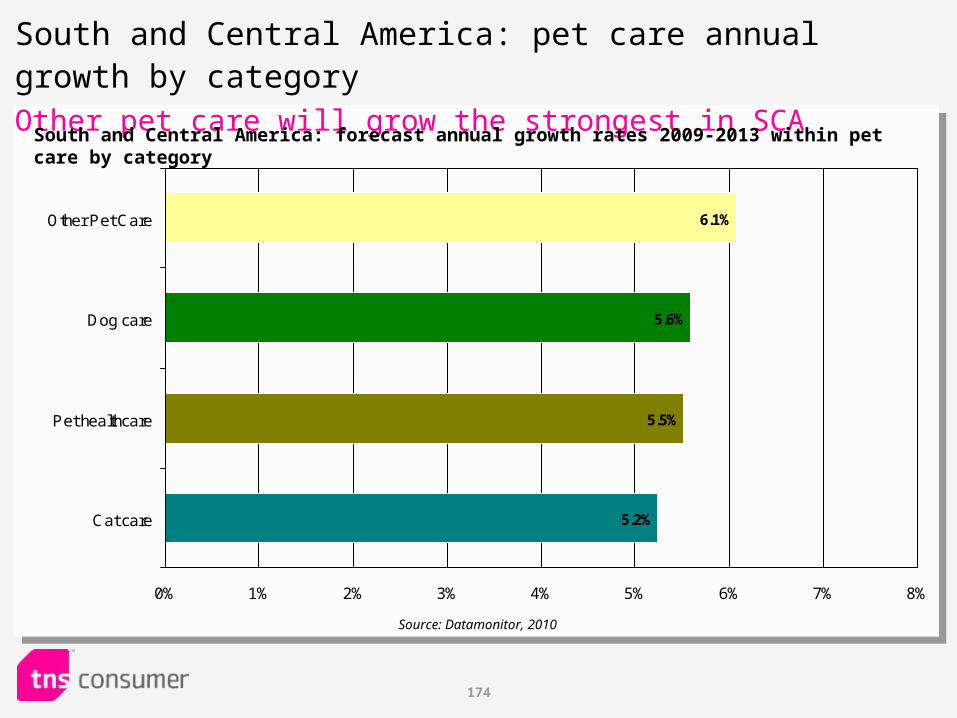
174
6.1%
5.6%
5.5%
5.2%
0% 1% 2% 3% 4% 5% 6% 7% 8%
Other Pet Care
Dog care
Pet healthcare
Cat care
South and Central America: pet care annual growth by category Other pet care will grow the strongest in SCA
South and Central America: forecast annual growth rates 2009-2013 within pet care by category
Source: Datamonitor, 2010

175
5.5%
5.3%
5.0%
5.0%
4.7%
4.6%
4.4%
4.3%
3.9%
6.0%
6.1%
6.2%
7.1%
7.2%
0% 1% 2% 3% 4% 5% 6% 7% 8%
Dog chews & treats
Fish care
Grooming Products
Worming Treatments
Rodent care
Dog food
Cat food
Dog toys
Bird care
External Parasite Treatments
Cat treats & milk
Cat litter
Pet supplements
Cat toys
South and Central America: growth within pet care by segmentDog chews & treats as well as fish care will grow the strongest
South and Central America: forecast annual growth rates 2009-2013 within pet care by segment
Source: Datamonitor, 2010
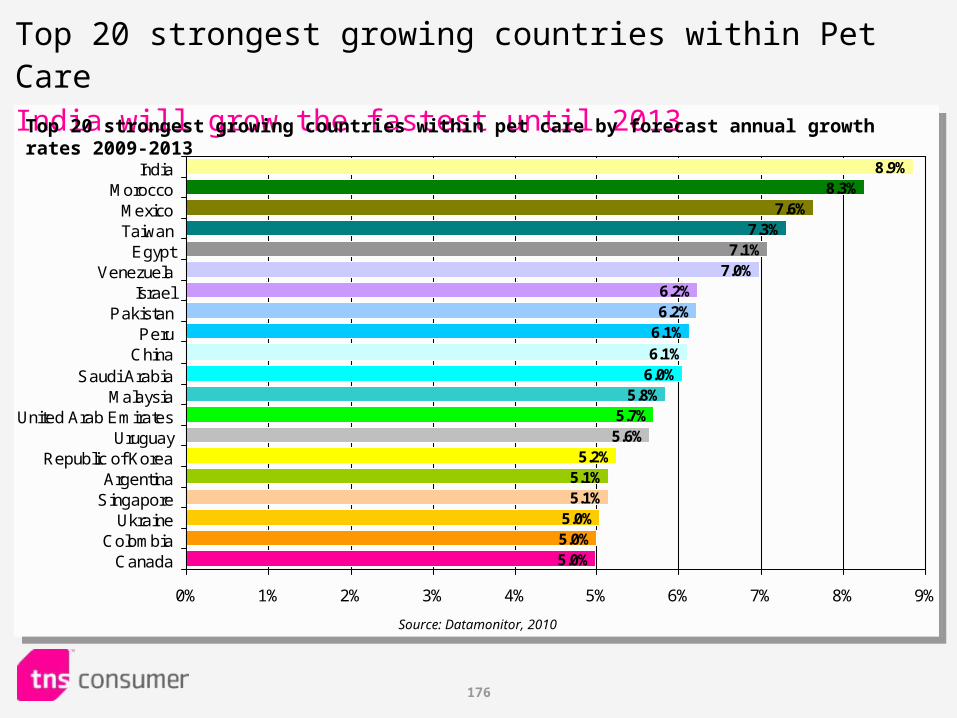
176
Top 20 strongest growing countries within Pet Care India will grow the fastest until 2013
7.0%6.2%6.2%
6.1%
6.1%6.0%
5.8%5.7%5.6%
5.2%5.1%5.1%
5.0%
5.0%5.0%
7.1%7.3%
7.6%8.3%
8.9%
0% 1% 2% 3% 4% 5% 6% 7% 8% 9%
IndiaMorocco
MexicoTaiwan
EgyptVenezuela
IsraelPakistan
PeruChina
Saudi ArabiaMalaysia
United Arab EmiratesUruguay
Republic of KoreaArgentina
SingaporeUkraine
ColombiaCanada
Top 20 strongest growing countries within pet care by forecast annual growth rates 2009-2013
Source: Datamonitor, 2010
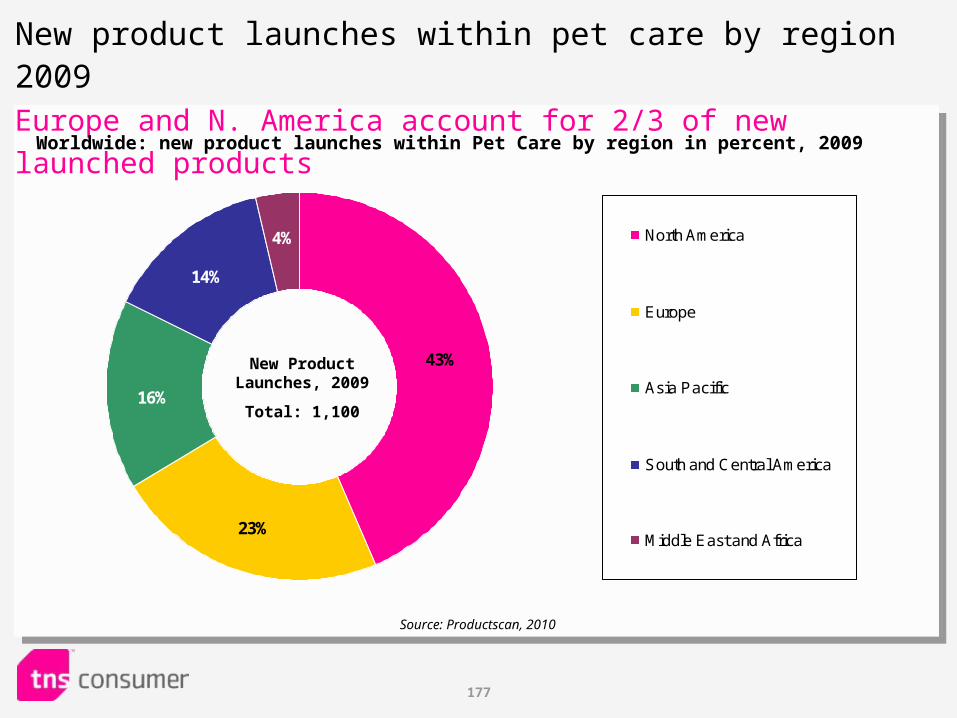
177
43%
23%
16%
14%
4% North America
Europe
Asia Pacific
South and Central America
Middle East and Africa
New product launches within pet care by region 2009Europe and N. America account for 2/3 of new launched products
Worldwide: new product launches within Pet Care by region in percent, 2009
New Product Launches, 2009
Total: 1,100
Source: Productscan, 2010
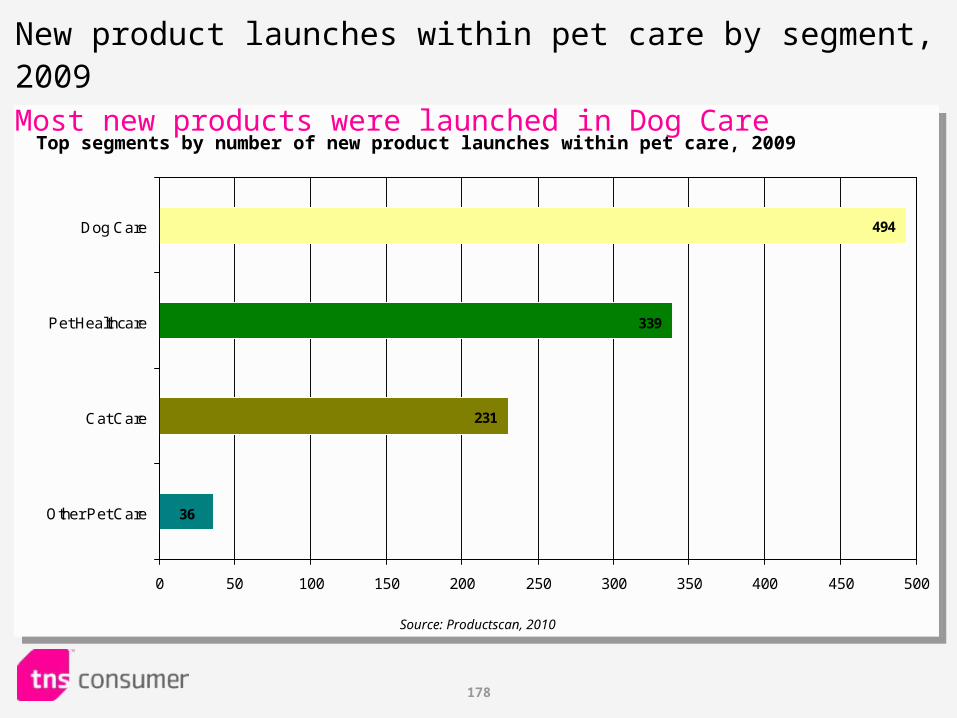
178
494
339
231
36
0 50 100 150 200 250 300 350 400 450 500
Dog Care
Pet Healthcare
Cat Care
Other Pet Care
New product launches within pet care by segment, 2009Most new products were launched in Dog Care
Top segments by number of new product launches within pet care, 2009
Source: Productscan, 2010
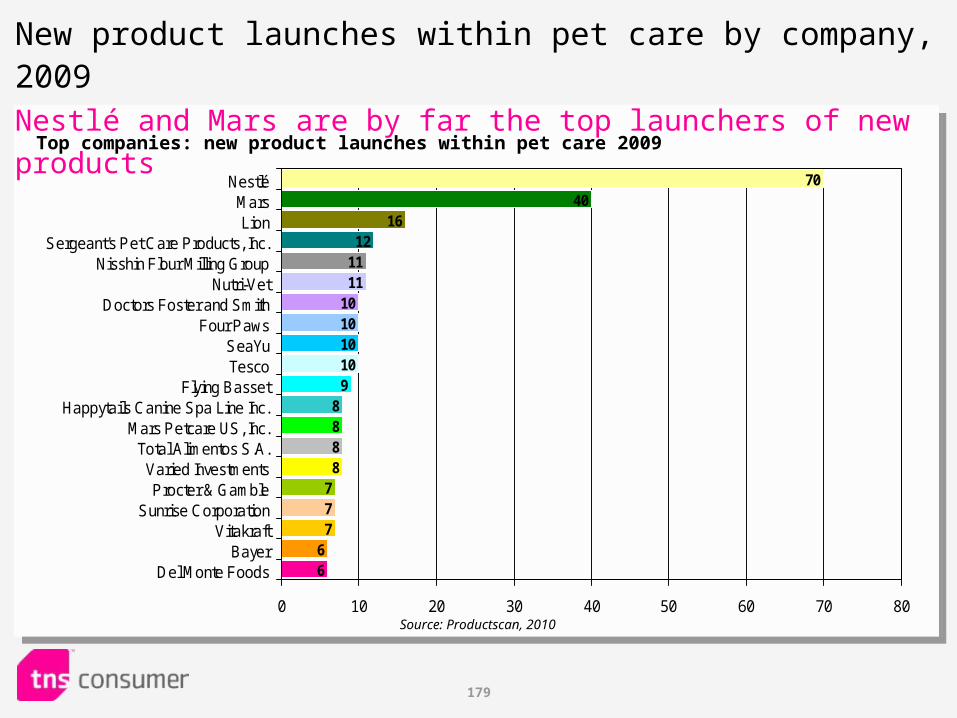
179
New product launches within pet care by company, 2009Nestlé and Mars are by far the top launchers of new products
7040
1612
11
67
6
778888
91010101011
0 10 20 30 40 50 60 70 80
NestléMarsLion
Sergeant's Pet Care Products, Inc.Nisshin Flour Milling Group
Nutri-VetDoctors Foster and Smith
Four PawsSeaYuTesco
Flying BassetHappytails Canine Spa Line Inc.
Mars Petcare US, Inc.Total Alimentos S.A.
Varied InvestmentsProcter & Gamble
Sunrise CorporationVitakraft
BayerDel Monte Foods
Top companies: new product launches within pet care 2009
Source: Productscan, 2010
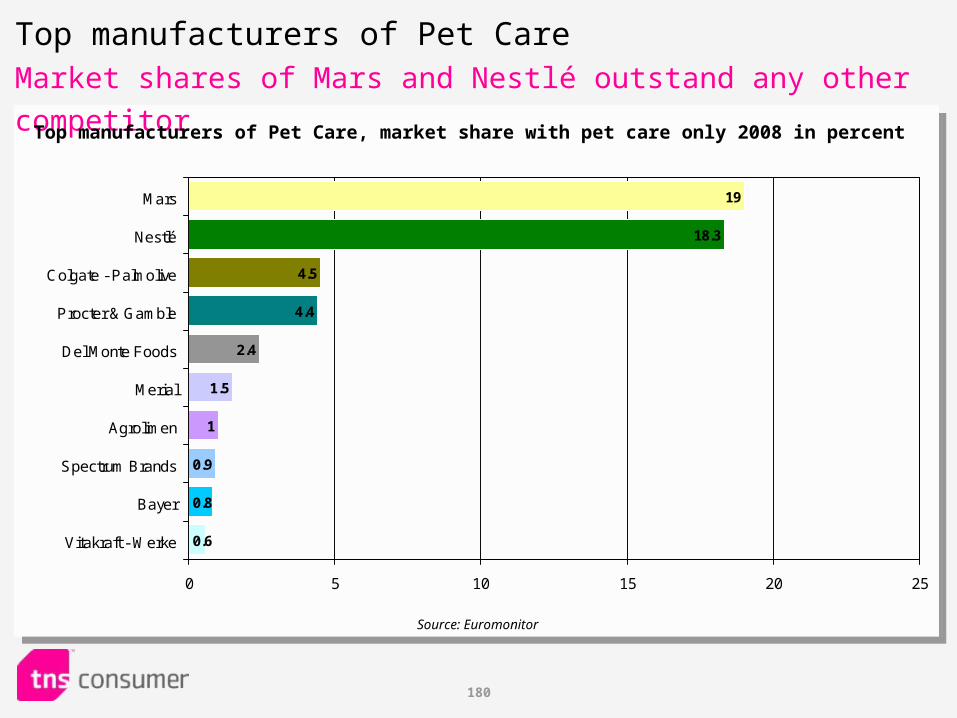
180
19
18.3
4.5
4.4
2.4
0.6
0.8
0.9
1
1.5
0 5 10 15 20 25
Mars
Nestlé
Colgate - Palmolive
Procter & Gamble
Del Monte Foods
Merial
Agrolimen
Spectrum Brands
Bayer
Vitakraft - Werke
Top manufacturers of Pet CareMarket shares of Mars and Nestlé outstand any other competitor
Top manufacturers of Pet Care, market share with pet care only 2008 in percent
Source: Euromonitor