Embed Size (px)
Citation preview
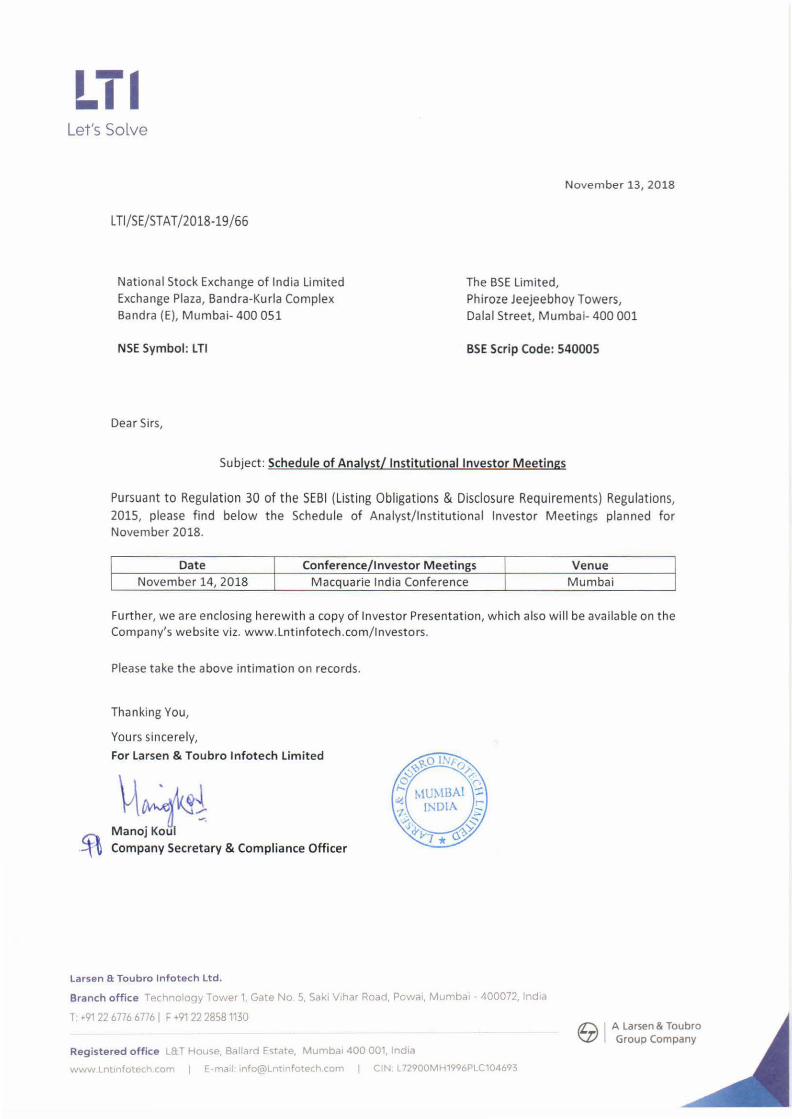
1-1 -1 Let's Solve
LTl/ SE/ STAT / 2018-19/ 66
November 13, 2018
The BSE Limited, National Stock Exchange of India Limited Exchange Plaza, Bandra-Kurla Complex Sandra (E), Mumbai- 400 OSl
Phiroze Jeejeebhoy Towers, Dalal Street, Mumbai- 400 001
NSE Symbol: LTI BSE Scrip Code: 540005
Dear Sirs,
Subject: Schedule of Analyst/ Institutional Investor Meetings
Pursuant to Regulation 30 of t he SEBI (Listing Obligations & Disclosure Requirements ) Regulations, 2015, please find below the Schedu le of Analyst/ Institutional Investor Meetings planned for November 2018.
Date Conference/Investor Meetings Venue November 14, 2018 Macquarie India Conference Mumbai
Further, we are enclosing herewith a copy of Investor Presentat ion, which also will be available on the Company's website viz. www.Lntinfotech.com/ lnvestors.
Please take the above intimation on records.
Thanking You,
Yours sincere ly,
For Larsen & Toubro lnfotech Limited
~\~~ Manoj Koul
~ Company Secretary & Compliance Officer
Larsen a Toubro lnfotech Ltd.
Branch office Technolo.:iy Tower 1, Gate No 5, Saki V1har Road, Powa1, Mumbai - 400072, India
T 91 22 6776 67 6 I F +91 22 28581130
Registered office aT House, Ballard Estate, Mumbai 400 001, India
WWW nfo ('< m I E-mail 1nfo@Lnt1nfotec:h com I CIN ~72900MH1996PLC104693
A Larsen & Toubro Group Company

Sanjay Jalona
Amplifying Outcomes
Investor Presentation
Amplifying OutcomesInvestor PresentationNovember 2018

Safe Harbor
2
Certain statements in this release concerning our future growth prospects are forward-looking statements, whichinvolve a number of risks, and uncertainties that could cause our actual results to differ materially from those insuch forward-looking statements. LTI does not undertake to update any forward-looking statement that may bemade from time to time by us or on our behalf.
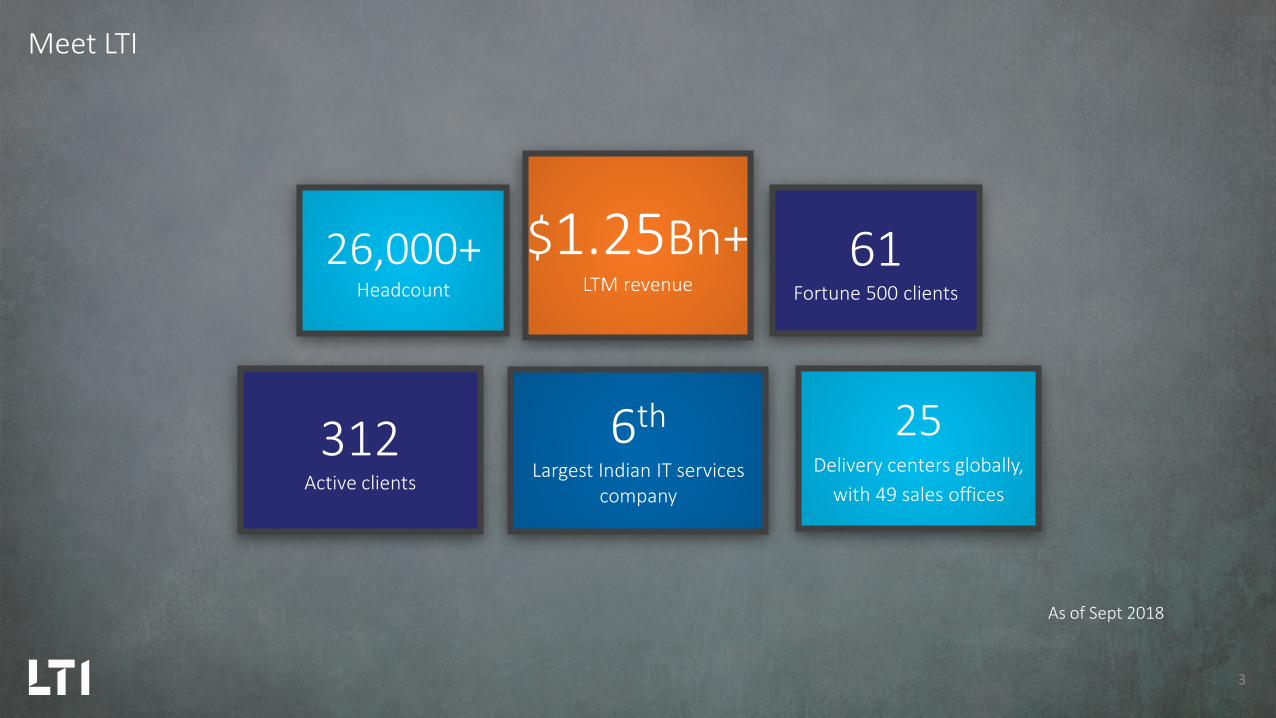
61Fortune 500 clients
$1.25Bn+LTM revenue
26,000+Headcount
6thLargest Indian IT services
company
312Active clients
25Delivery centers globally,
with 49 sales offices
Meet LTI
3
As of Sept 2018

Consistently delivering industry leading revenue growth
4
810887
970
1,132
8.5%9.5%
9.3%
16.7%
FY15 FY16 FY17 FY18
Revenue (USD Mn) YoY growth
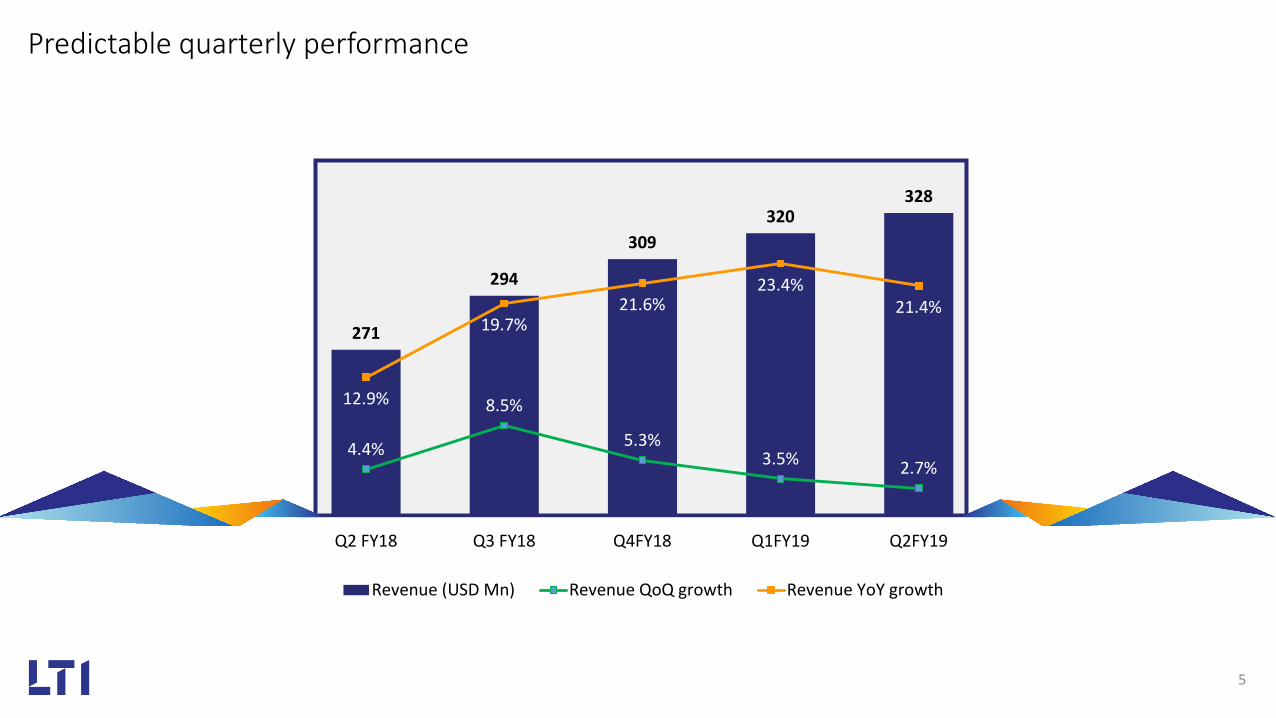
271
294
309320
328
4.4%
8.5%
5.3%3.5% 2.7%
12.9%
19.7%21.6%
23.4%21.4%
Q2 FY18 Q3 FY18 Q4FY18 Q1FY19 Q2FY19
Revenue (USD Mn) Revenue QoQ growth Revenue YoY growth
Predictable quarterly performance
5

87
96102
109
122
Q2 FY18 Q3 FY18 Q4FY18 Q1FY19 Q2FY19
Amplifying outcomes with Digital | Analytics | IoT | Automation | Cloud
6
Transformed experience -customers, partners,
employeesNext gen operationsEnabling new business
models Enabling revenue growth
37%Digital Revenues
Quarterly Digital Revenue (USD Mn)

Enviable client profile
7
US based global bank$100 Million + 1
Large P&C insurer | A professional services giant | Global O&G major$50 Million + 4
EU based reinsurer | African bank | Big M&E company | Nordic bank$20 Million + 14
Manufacturing giant | Global Automotive OEM | CPG giant | US tech major$10 Million + 25
European shipping major | French utility | US based M&E company$5 Million + 44

8
Industry focus and resilient portfolio
Banking Banking 30.4%Financial Services
Insurance 18.0%Insurance Healthcare
EnergyProcess ManufacturingIndustrial Manufacturing
26.0%Energy & Manufacturing
Engineering & ConstructionAutomotive & Aerospace
Media & EntertainmentHigh-TechPharma
25.6%Consumer, Media & Technology
UtilitiesRetail & CPG
9
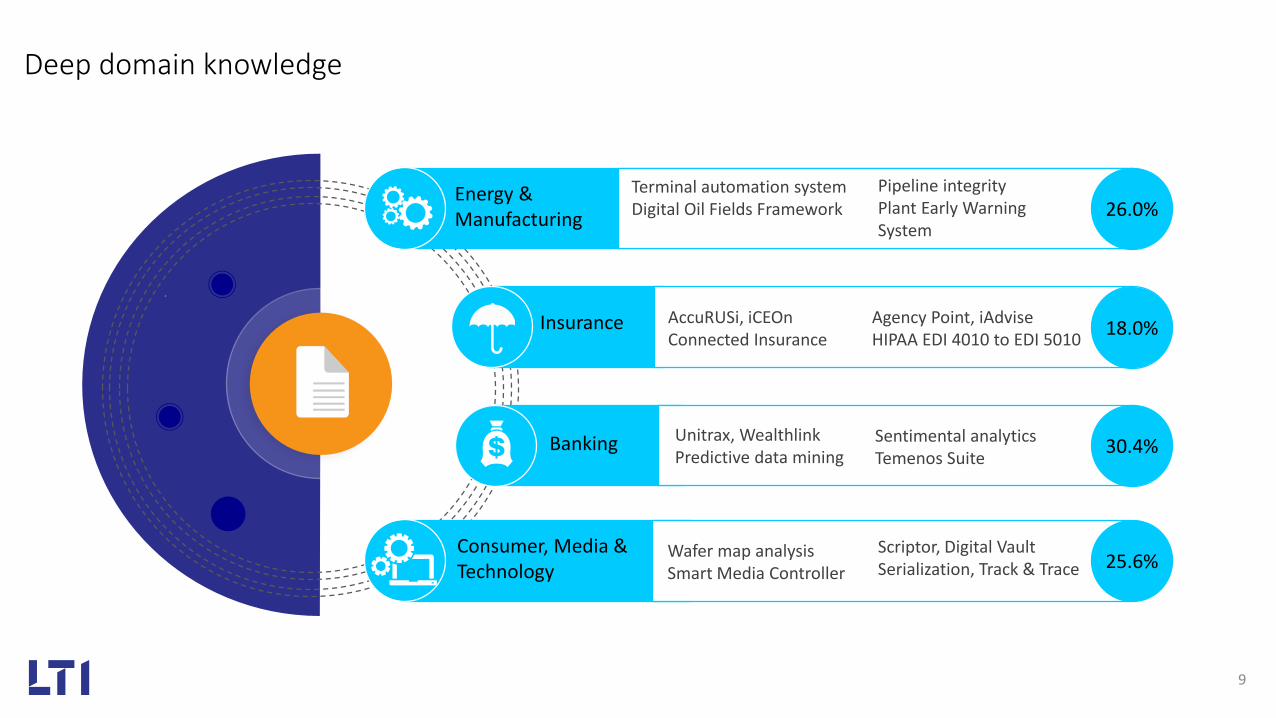
Deep domain knowledge
Insurance
Energy & Manufacturing
Consumer, Media & Technology
Terminal automation systemDigital Oil Fields Framework
Pipeline integrityPlant Early Warning System
26.0%
18.0%AccuRUSi, iCEOnConnected Insurance
Agency Point, iAdviseHIPAA EDI 4010 to EDI 5010
30.4%Unitrax, WealthlinkPredictive data mining
Sentimental analyticsTemenos Suite
25.6%Wafer map analysisSmart Media Controller
Scriptor, Digital VaultSerialization, Track & Trace
Banking

AWS, AzureFacebook Workplace
S4/HANA
REDAxisMosaic Security
DiCE
AugmentIQSyncordis
Cloud & SaaS LTI Solutions
Acquisitions
Change begins within
10
Blue PrismAutomation Anywhere
Duck Creek
Partnerships
ADEAGlobal sales expansionOracle Marketing Cloud
Sales & MarketingBeyond
Hackathons with clientsRewarding curiosity
Customer centricity
11
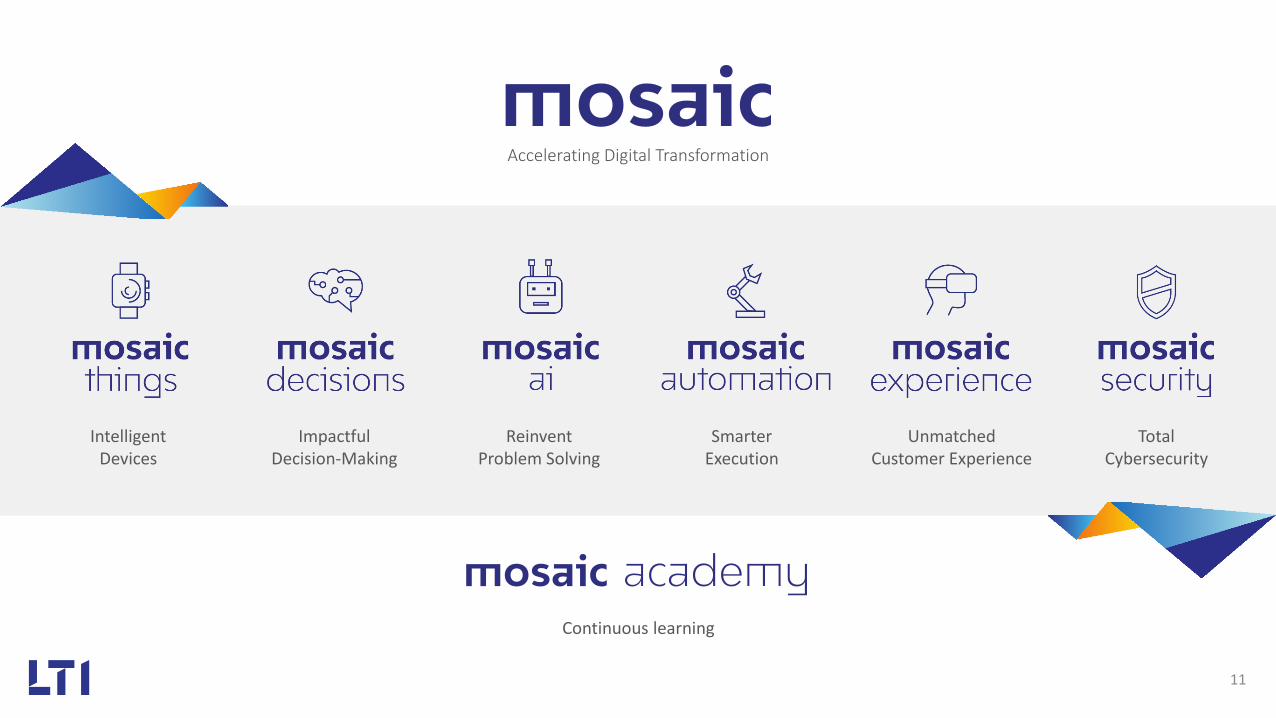
Intelligent Devices
Impactful Decision-Making
Reinvent Problem Solving
Smarter Execution
Unmatched Customer Experience
Total Cybersecurity
Continuous learning
Accelerating Digital Transformation

$325 Mn+ TCV in 6 quarters
We’re winning
12
Global Pharma Major
Fortune 100 Consumer & Pharma giant
Leading African Bank
Multi-year, multi-million managed services deal to transform global manufacturing facilities using IoT
ExxonMobil
Multi-year engagement on ERP, Data and Analytics based on AI and automation
Digitizing Geoscience content using MOSAIC for maximizing asset utilization and reduce total cost of ownership
Multi-year deal to provide end-to-end ADM services
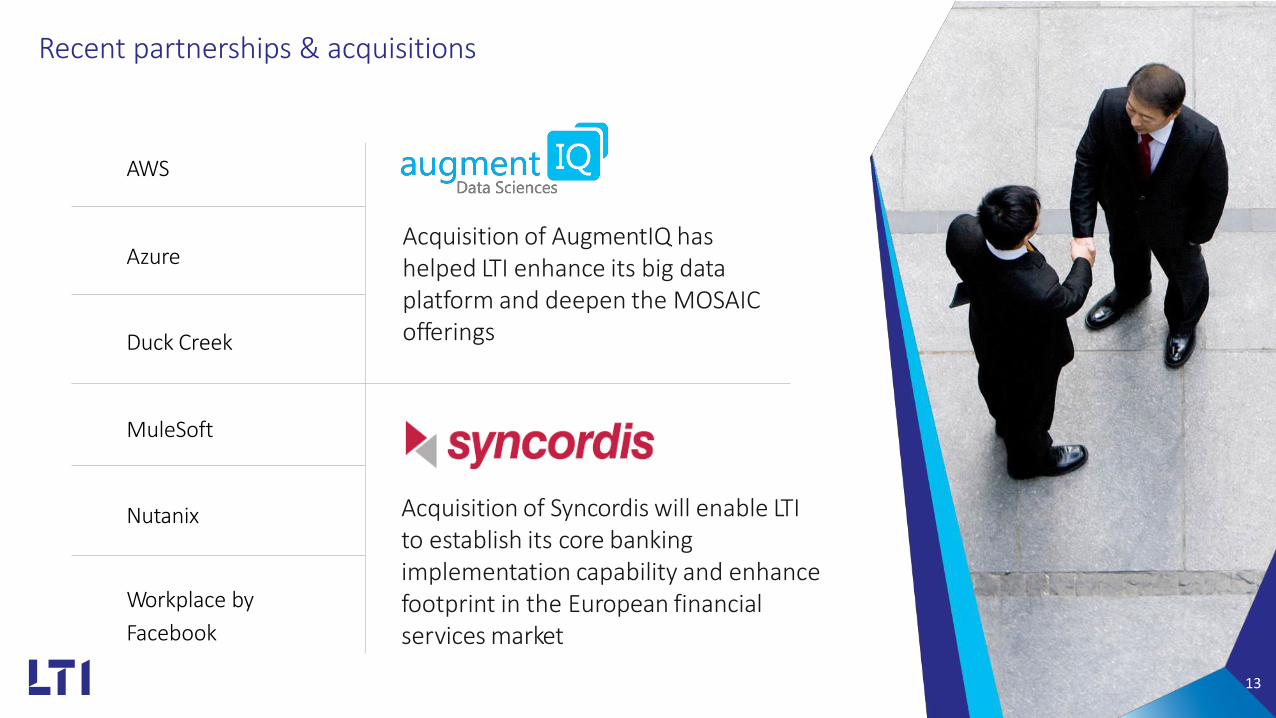
Acquisition of Syncordis will enable LTIto establish its core bankingimplementation capability and enhancefootprint in the European financialservices market
Acquisition of AugmentIQ hashelped LTI enhance its big dataplatform and deepen the MOSAICofferings
AWS
MuleSoft
Azure
Duck Creek
Nutanix
Workplace byFacebook
Recent partnerships & acquisitions
13
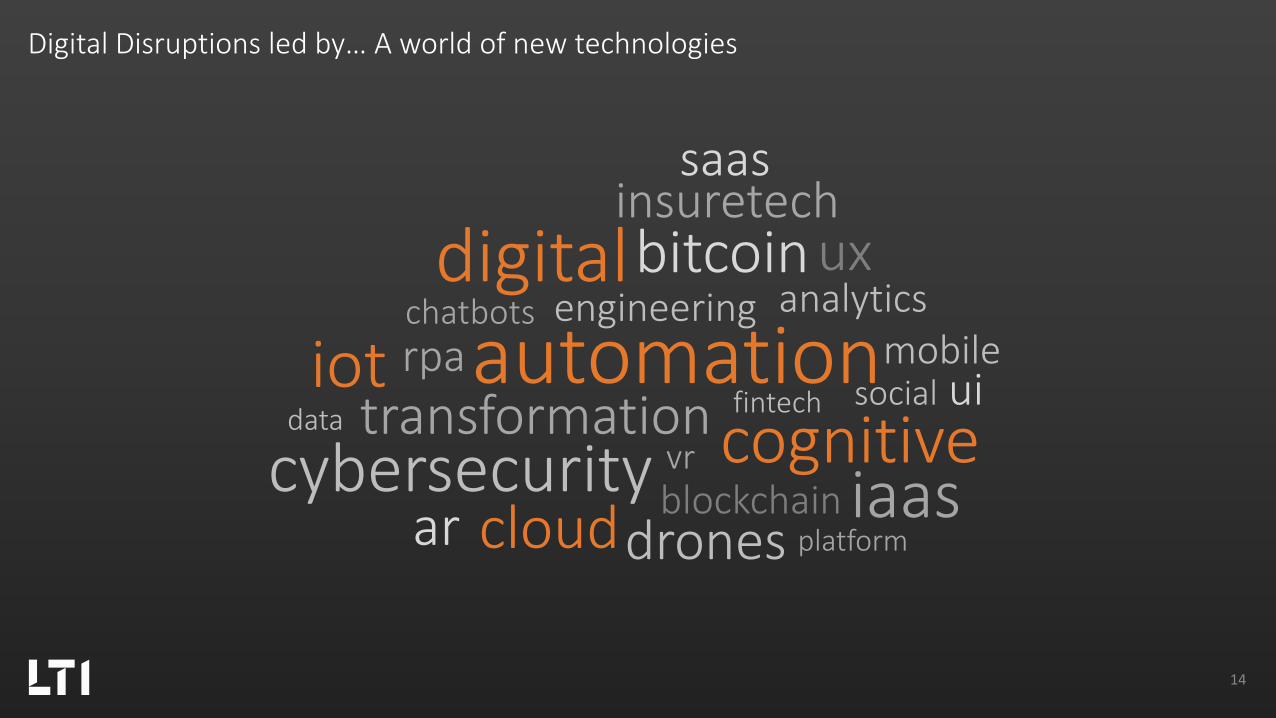
analytics
automationbitcoin
blockchain
chatbots
cognitivecybersecuritydata
digital
drones
engineering
fintech
iaas
insuretech
iot mobile
platform
rpa
saas
socialtransformation ui
ux
vr
cloudar
Digital Disruptions led by… A world of new technologies
14

• Decluttering of technologies• IT+OT experience
Customers need…
15
Shoshin
In the beginner’s mind there are many possibilities, in the expert’s mind there are few.
- Shunryu Suzuki
Learning Company
16

Shoshin
17
Learning company
Capabilities Acquisitions
Sales & marketing excellence
Ecosystem & alliances
Learn & grow
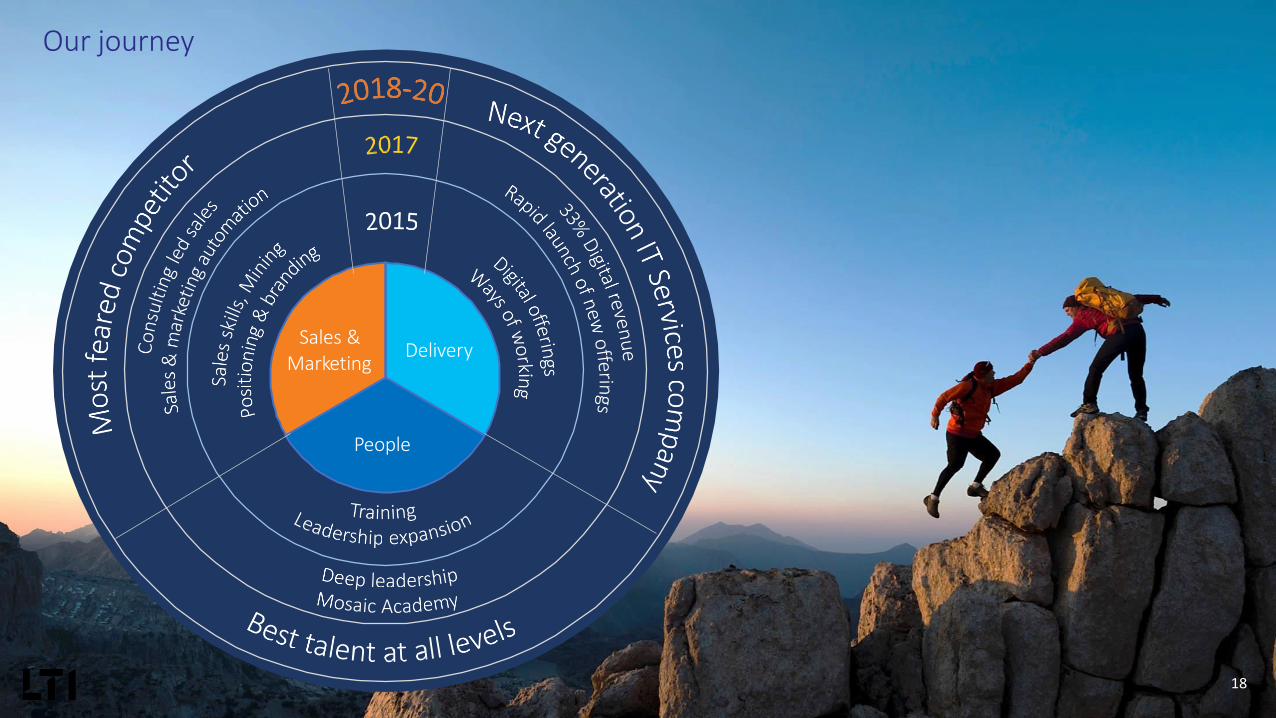
Delivery
People
Sales &Marketing
Our journey
18

Performancewith scale Winning Team
The
LTI Edge
19
Focus &Micro-segmentation
Amplifying outcomes

Well diversified portfolio
20
4
14
25
44
05
101520253035404550
50 Million dollar + 20 Million dollar + 10 Million dollar + 5 Million dollar +
FY17 FY18 YTDFY19
30.4%
18.0%15.6%
10.4% 9.7% 11.3%
4.6%
0%
5%
10%
15%
20%
25%
30%
35%
BFS INS MFG E&U CRP Hi-Tech,M&E
Others
FY17 FY18 YTDFY19
33.0%
25.8%
11.6%8.0%
11.3%7.2%
3.1%
0%
10%
20%
30%
40%
ADM EnterpriseSolutions
IMS Testing Analytics,AI &
Cognitive
EI/Mobility Products &Platforms
FY17 FY18 YTDFY19
67.0%
17.5% 15.5%
0%10%20%30%40%50%60%70%80%
North America Europe Others
FY17 FY18 YTDFY19

Headcount Utilization Effort Mix
EBIT Operating cash flow % to Net Profit
Operational Excellence leading to Healthy Financial Performance
21
Net Profit
Note: Latest operational metrics for Q2FY19 and financial metrics for LTM
24.3% 23.4% 22.6%
75.7% 76.6% 77.4%
FY17 FY18 Q2FY19
Onsite Offshore
78.1%
79.4%
80.4%
79.6%80.4%
82.3%
FY17 FY18 Q2FY19
Utilization (including Trainees) Utilization (excluding Trainees)
93.4% 93.9% 94.4%
FY17 FY18 Q2FY19
Delivery Support Delivery %
26,41424,139
21,023
10,525 10,314 13,606
16.2%14.1%
16.3%
FY17 FY18 LTM
EBIT (INR Mn) EBIT %
9,709 11,124 13,337
14.9%15.2%
15.9%
FY17 FY18 LTM
PAT (INR Mn) PAT %
120.4%
75.9% 87.4%
FY17 FY18 LTM
22