Embed Size (px)
Citation preview

2008 2008 vs vs 20092009

!! Half year 2008 Half year 2008 vs vs half year 2009half year 2009!! WealthWealth!! Inflation / ConsumptionInflation / Consumption!! Consumer concernsConsumer concerns!! BrandingBranding!! MediaMedia!! EnvironmentEnvironment
Consumer Trends AgendaConsumer Trends Agenda

GDP growth = 8.5% - OctFDI (US Billion) = $45 B - OctInflation (CPI) = 22% - OctExports** = $48 B - SeptOverseas remittance = $8 B - DecConsumer confidence = 94%
(economy same/ better in next 12 months)Ad expenditure growth = 16%FMCG growth* = 20%Modern trade growth* = 27%Internet users growth = 23%Car sales^ = 30%
2009200920082008
Half year 2008 Half year 2008 vs vs half year 2009 Comparisonhalf year 2009 Comparison
Source: GSO /TNS * Value growth / TNS Worldpanel ^VAMA – end of August
Overall growth spend at half year is down by 25% compared to 2008While economic indices show a decline of over 50% in growth
" GDP growth = 4.5% - Oct" FDI (US Billion) = $23 B - Oct" Inflation (CPI) = 4.5% - Oct" Exports** = $42 B - Sept" Overseas remittance = 6.7 B - Dec" Consumer confidence = 86%
(economy same /better in next 12 months)" Ad expenditure growth= 23%" FMCG growth* = 8%" Modern trade growth* = 10%" Internet user Growth = 25%" Car sales^ = -19%
**Exports = End of September 09

Vietnam by the numbers - half year 2008 Vietnam by the numbers - half year 2008 vs vs 20092009Inflation down by 80%
Ad spend growth up by 23%
Internet growth up by 20%
GDP down by half
FDI down by half
Exports down by 15%
FMCG growth down 12%
Modern trade growth down by 17%
Car sales are down by 19%
As FDI & Exports accounted for US $120 Billion of the VN economy in 2008, VN will struggle moving forward, with only US $80 Billion in 2009 (est.)
Half year comparison

Wealth TrendsWealth Trends

Vietnam’s GDP has doubled in 4 years, but only by 5% in 2009
GDP per capita evolution - USDGDP per capita evolution - USD
Source: GSOVN
289
402 440
552
725
835
1,024 1,075
0
200
400
600
800
1,000
1,200
1995 2000 2002 2004 2006 2007 2008 2009 Est.
In USD
1,024

5
7
20
24
30
14
27
37
34
27
26
31
20
20
23
12
11
5
6
12
32
18
12
11
5
3
2
4
5
3
8
4
2
0% 20% 40% 60% 80% 100%
2008
2006
2004
2001
1999
SEC F SEC E SEC D SEC C SEC B SEC A SEC A+
HCMC Declared Monthly Household IncomeHCMC Declared Monthly Household Income
Source: TNS VietCycle: 1999-2008Base: N = 1,000
SEC Income Scale A1 = US $1,200 + A = US $801 -1,200 B = US $401 - 800 C = US $400 - 276 D = US $181 - 275 E = US $126 - 180 F = US $ 45 - 125
A-B-C SEC has more than doubled in the last 4 years (+59%)

1
6
26
46
40
7
26
44
36
37
35
38
20
11
14
23
10
4
3
5
31
18
5
3
3
1
0
1
1
1
2
2
0% 20% 40% 60% 80% 100%
2008
2006
2004
2001
1999
SEC F SEC E SEC D SEC C SEC B SEC A SEC A+
Hanoi Declared Monthly Household IncomeHanoi Declared Monthly Household Income
SEC Income Scale A1 = US $1,200 + A = US $801 -1,200 B = US $401 - 800 C = US $400 - 276 D = US $181 - 275 E = US $126 - 180 F = US $ 45 - 125
Source: TNS VietCycle: 1999-2008Base: N = 1,000
A-B-C SEC has almost doubled in the last 2 years

Consumer ConcernsConsumer Concerns

Quality of product and value for moneyQuality of product and value for money
The Chinese Milk scare could be felt for years &will make consumers more quality conscious

64%
48%
39%
35%
17%
Health of my family
Personal health
Unemployment
Financial stability
Global recession TNS Consumer Poll - Jan. 09
Vietnamese main fears in life - 2009Vietnamese main fears in life - 2009
Health still tops consumers main fears, followed by money matters

My personal standard of living forecastMy personal standard of living forecast
Source: TNS VietCycle 2006 / 2008 & TNS Consumer Confidence Poll – Jan. 09
Vietnamese personal standard of living forecast for the next 12 months has dropped from 70% forecasting a better living standard
in September 2008 to only 36% in January 2009
9
16
18
27
54
48
46
25
32
16
4
2
1
1
0
0
0
TNS Consumer Poll -Jan. 09
TNS VietCycle - Sept. 08
TNS VietCycle - Nov. 06
Far better A little better Same A little worse Far worse Don't know

Will you reduce spending in 2009?Will you reduce spending in 2009?
Yes
52%
No
46%
Don’t
know
2%
Source: TNS Consumer Confidence Poll – Jan. 09
Over half of consumers shall reduce their monthly spending in 2009

44
29
28
28
25
23
23
23
16
12
4
54
69
70
69
71
73
73
74
81
76
72
2
2
2
3
4
4
4
3
4
12
23
0
0
0
0
0
0
1
1
Entertainment & dining out
Home appliances (Wash machine, TV Hifi, etc)
Household utilities
Personal equipment (mobile phone, laptop ,Etc)
Communications telephone/ fax/ email
Personal care products
Transportation
House hold care products
Food & beverages products
Health care products/ services
Education
Less Same More Don't know
Consumers spending reduction in 2009?Consumers spending reduction in 2009?
Source: TNS Consumer Confidence Poll – Jan. 09
MajorDecrease
Less than25%
Stable
Base: All n = 500
Only education and healthcare seem to be unaffectedby the Global economic recession

Brand impactBrand impact
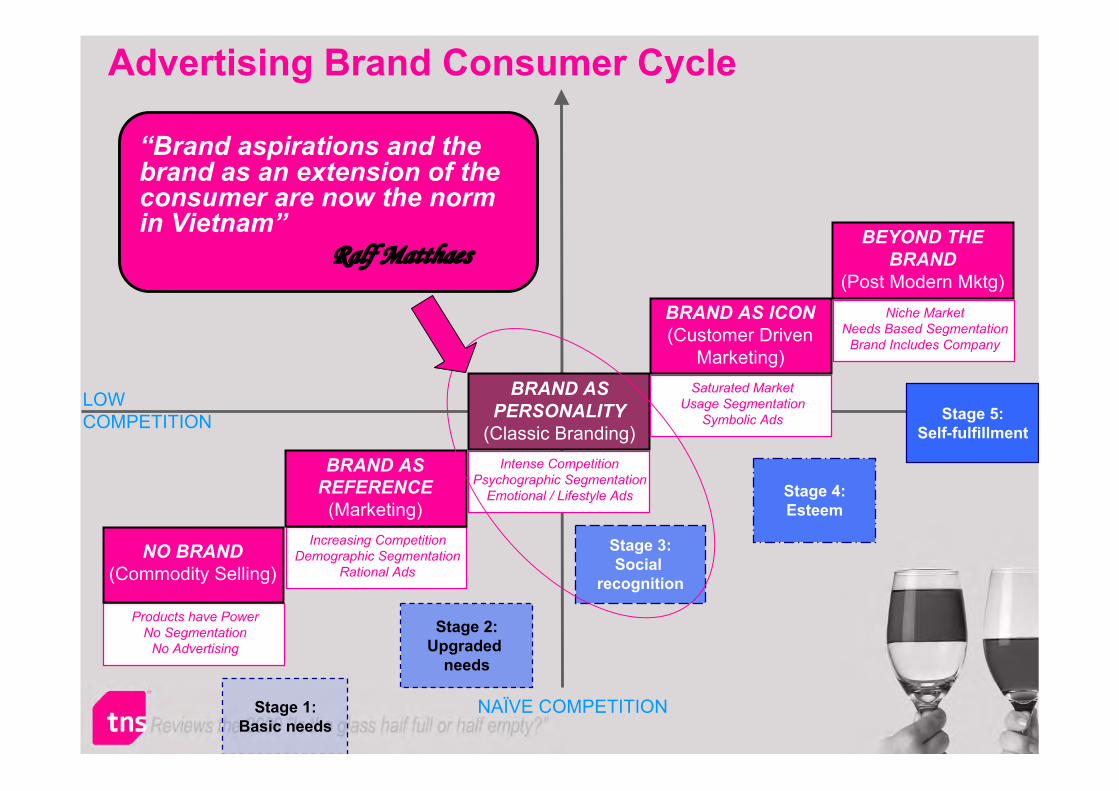
BRAND ASPERSONALITY
(Classic Branding)Intense Competition
Psychographic SegmentationEmotional / Lifestyle Ads
Saturated MarketUsage Segmentation
Symbolic Ads
BRAND AS ICON(Customer Driven
Marketing)
BEYOND THEBRAND
(Post Modern Mktg)Niche Market
Needs Based SegmentationBrand Includes Company
Increasing CompetitionDemographic Segmentation
Rational Ads
BRAND ASREFERENCE
(Marketing)
Products have PowerNo Segmentation
No Advertising
NO BRAND(Commodity Selling)
Stage 1:Basic needs
Stage 2:Upgraded
needs
Stage 3:Social
recognition
Stage 5:Self-fulfillment
Stage 4:Esteem
Advertising Brand Consumer CycleAdvertising Brand Consumer Cycle
LOWCOMPETITION
NAÏVE COMPETITION
“Brand aspirations and thebrand as an extension of theconsumer are now the normin Vietnam”
Ralf Matthaes

Vietnamese Brand PerceptionsVietnamese Brand Perceptions
International / healthy / badge value brands and brands ofhigh quality are still much more preferred by VN consumers
Source: VietCycle 2008- September 2008
32
39
50
56
56
71
73
81
0 10 20 30 40 50 60 70 80 90
There are no real differences between the brands available in the market
I prefer local Vietnamese brands
Vietnamese brands are as good as international brands
I prefer to buy well-know brands
I like to use the brand which shows my success
I’m willing to pay more for higher quality brands
I prefer brands with a health / environmental focus
I am equally concerned about Price and quality

Vietnamese brand perceptions are changingVietnamese brand perceptions are changing“My children will be veryintelligent and grow-up fasteras I feed her by a good qualitypowder milk. I feel that I am agood mother”
“I always choose the most expensivedetergent which I think it has the bestquality and good for my families clothes.I feel happy when my husband says toothers that I am a good housewife”
Source: TNS 2007-2008 FGD’s
“People say that I am a modernmother because I choose goodquality brands for my baby. It shows
my great love for my children”
RECOGNITIONRECOGNITION
SocialSocial

10 fastest growing brands 10 fastest growing brands –– Half year - 2009 Half year - 2009
Source: TNS Worldpanel
In 2007, 2 of the fastest growing brands were, Vietnamese, in 2008 = 4 and thus far in 2009 = 8 were Vietnamese Thus, meaning thatVietnamese brands and the Gov’t initiative to buy local is working
Value Share change%Market share movement
25%
22%
15%
12%
10% 10% 9% 9%8% 7%
VFRESH(Soya milk)
CHINSU(NAM NGU)
KOTEX(Pantyliner)
VFRESH(Fruit juice)
STING TRANGTIEN
TUONG AN(Margarine)
FAMI (Soyamilk)
DIELACANPHA 1
VINAMILK(UHT)
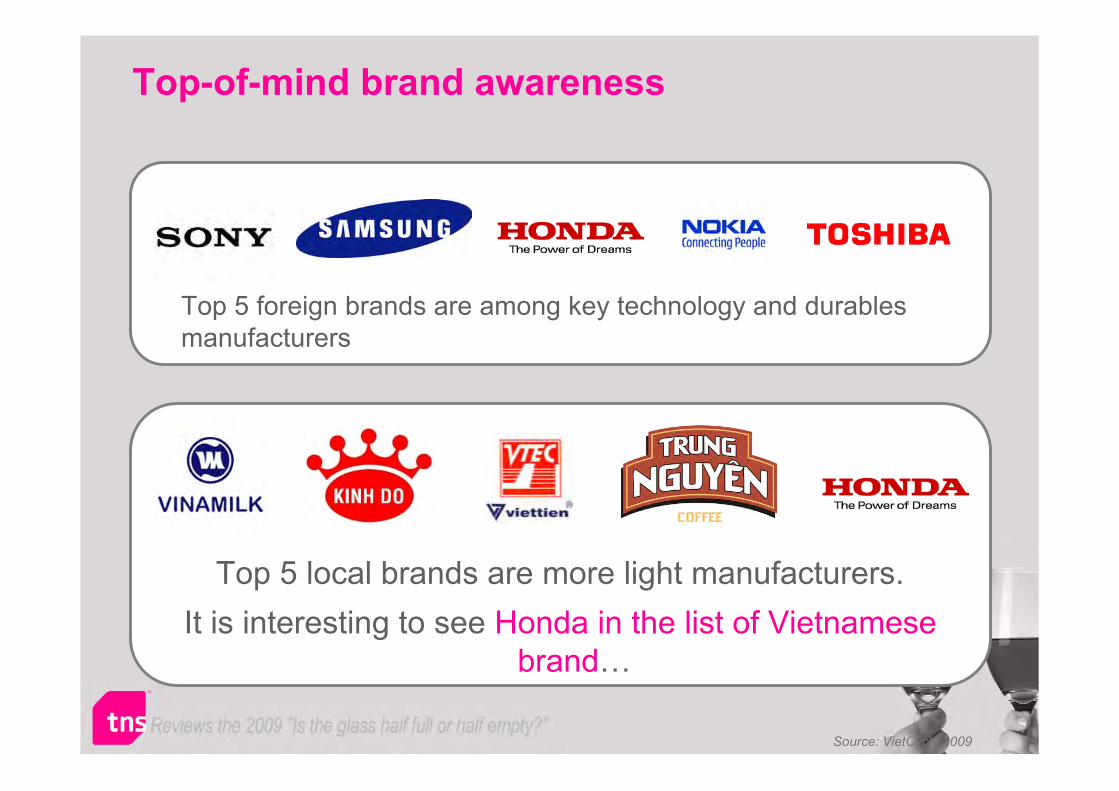
Top-of-mind brand awareness
Top 5 foreign brands are among key technology and durablesmanufacturers
Top 5 local brands are more light manufacturers.It is interesting to see Honda in the list of Vietnamese
brand…
Source: VietCycle 2009

Perception of luxury - 2009
Car Car 54%54%
Diamond Diamond 31%31%
LaptopLaptop9%9%
Home Home theatretheatre
9%9%
Overseas Overseas holidayholiday
11%11%
HouseHouse7%7%
Plasma Plasma TVTV
13%13%
Security Security 9%9%
Dish washerDish washer15%15%
Gold Gold JewelryJewelry
8%8%
Cars and Diamonds areseem as true luxury items
Source: VietCycle 2009

Internet Internet usus@@gege

Top 20 countries - internet usersTop 20 countries - internet users
Source: WorldInternetstats.com – July 2009
@
Vietnam is now the 18th most active user of the internet globally.
20
20.02
21.53
23
23.99
25
26.50
27.40
28.63
29.14
37.47
38
42.05
48.76
55.22
67.51
81
94
227.63
338
Argentina
Poland
Vietnam
Iran
Canada
Indonesia
Turkey
Mexico
Spain
Italy
Korea South
Russia
France
United Kingdom
Germany
Brazil
India
Japan
United States
China

3
8 9
21
34
0
10
20
30
40
1999 2001 2004 2006 2008
In-home Internet penetration In-home Internet penetration (Hanoi & HCMC)(Hanoi & HCMC)
Source: TNS VietCyle – 1999-2008 – HCMC & Hanoi
With 1 in 3 urban homes connected to internet, Internet based advertising will experience steady growth

Base: Past month internet users aged 15+ across all 4 major citieswho have home internet access
Source: Yahoo!-TNS Net Index 2008
174,071
191,145
155,155
133,258
115,475
Total (4 cities)
Ho Chi Minh City
Hanoi
Da Nang
Can Tho
Monthly Personal Spending on the Internet (VND)
US$36Mmonthly
Monthly Internet ExpenditureMonthly Internet Expenditure
Net users spend an average VND174,000or US $10 per month on the Internet

Online User ProfileOnline User Profile
26%14%
24%14%
12%
10%
12%
8%35%
15%
14%
18%
General Netizen*
40+
35-39
30-34
25-29
20-24
15-19
Age
56%
52% 44%
48%
General Netizen*
Female
Male
Gender
63%
64%
37%
36%
General Netizen*
Married &Others
Single
Marital Status
Skewed towards young (68% <29 years), Male (56%) and Single (63%)

A Shift in AdvertisingA Shift in Advertising

,
TV 75%
Radio0.6%
Newspapers16%
Magazines8 %
Internet (est.)0.4%
TV Radio Newspapers Magazines Internet (est.)
Advertising spend breakdown - 2008Advertising spend breakdown - 2008
Source: TNS Media Co.
TV is King and has grown to 80% in 2009, asadvertisers are returning to the tried and trusted

66%66%7%7%
4%4%7%7%
7%7%
Top 4 Daily Home activities
TV dominates followed by reading, using the computerand watching movies and listening to music
Source: VietCycle 1999-2008

99
83
73
62 62
51
11
27
99
8576
60 64
52
11
33
100
8477
6257
44
15
42
TV (Past Week) Outdoor (PastWeek)
Newspaper(Past Week)
Magazine (PastWeek)
DVD/VCD/Tape(Past Week)
Radio (PastWeek)
Cinema (Past 3Months)
Internet (PastWeek)
2006 2007 2008(%)
Base: Males and Females aged 15+ across all 4 major cities (HoChi Minh City, Hanoi, Da Nang and Can Tho)
Source: TNS Media Habits Survey (2006-2008)
Media ReachMedia Reach
TV is still King… but Internet is by far thefastest-growing medium

295
46
922 22
253
45
1024 30
233
46
8 2143
TV Newspaper Magazine Radio Internet
2006 2007 2008
Base: Males and Females aged 15+ across all 4 major cities (Ho Chi Minh City,Hanoi, Da Nang and Can Tho)
Source: TNS Media Habits Survey (2006-2008)
Time Spent Per Day (Mins)
Media Exposure Trends
Time spend watching TV has decreased by 1 hour per day since 2006,while Internet is the only medium growing (21 minutes / day)

230,000
937
42,050
828
20,500
36,980
20,429
171,000
0
50,000
100,000
150,000
200,000
250,000
TV Newspapers Magazines Radio
2008
2009
Ad spend half year 2008 Ad spend half year 2008 vsvs half year 2009 half year 2009
TV ad spend has increased by 26% andNewspaper increased by 12%, while both
Magazine & Radio have dropped.Total ad spend is up by 23% compared to 2008
(,000)
20092008

Top 6 Growth Sectors ad spend Half yr 2008 vs half yr 2009
The Beverage sector, followed byTelecoms has experienced the highestgrowth in Ad spend, followed by Foods,
Beauty Care, etc. Ironically, sectorspend does not necessarily translateinto category growth in terms of sales
-
10,000,000
20,000,000
30,000,000
40,000,000
50,000,000
60,000,000
70,000,000
Telecoms Food Hygiene &
beauty care
Beverages Pharmaceuticals Household
products
2008 2009
66%+
35%+
34%+
93%+
15%+42%+
Source: TNS Media - June 2008-June 2009
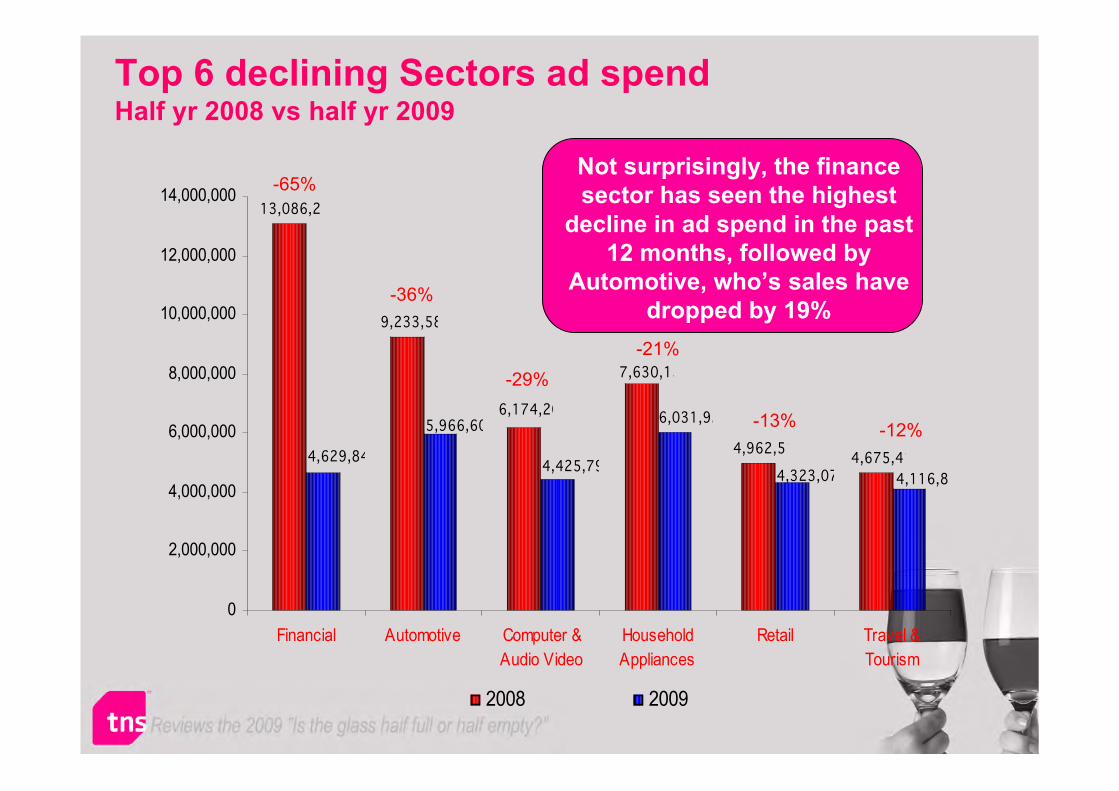
13,086,280
9,233,583
4,962,5124,675,415
7,630,154
6,174,207
4,629,849
5,966,609
4,425,797
6,031,925
4,323,077 4,116,805
0
2,000,000
4,000,000
6,000,000
8,000,000
10,000,000
12,000,000
14,000,000
Financial Automotive Computer &
Audio Video
Household
Appliances
Retail Travel &
Tourism
2008 2009
-65%
-36%
-29%-21%
-13% -12%
Top 6 declining Sectors ad spend Top 6 declining Sectors ad spend Half yr 2008 Half yr 2008 vsvs half yr 2009 half yr 2009
Not surprisingly, the financesector has seen the highest
decline in ad spend in the past12 months, followed by
Automotive, who’s sales havedropped by 19%

EnvironmentEnvironment

I would be willing to pay 10% more for groceries/products that are more environmentally friendly
15
10
15
15
22
26
28
41
44
38
51
38
54
54
55
58
56
55
47
46
55
42
34
33
27
27
18
17
14
11
9
6
5
13
4
3
2
1
3
1
1
1
2
3
New Zealand
Japan
Hong Kong
Singapore
South Korea
Thailand
Malaysia
Indonesia
Philippines
Chinese mainland
India
Strongly agree Somewhat agree
Somewhat disagree Strongly disagreeAve
Source: Grey Group study
3.3
3.3
3.3
3.1
3.1
3.0
2.8
2.8
2.7
2.6
3.4
Environmental awarenessEnvironmental awareness
Evidence of increasing concern across Asia…

Forecast in the next 12 monthsForecast in the next 12 monthsEnvironmental PollutionEnvironmental Pollution
5
5
7
22
17
22
9
27
23
27
40
37
36
12
9
0
0
0
TNS Consumer Poll -Jan. 09
TNS VietCycle - Sept. 08
TNS VietCycle - Nov. 06
Far better A little better Same A little worse Far worse Don't know
Source: TNS VietCycle 2006 / 2008 & TNS Consumer Confidence Poll – Jan. 09
In a short time consumer sentiment towards the worseningof Vietnam’s polluted environment has increased by 300%!

How do we rate VietnamHow do we rate Vietnam’’s environment?s environment?By SEC, age group and genderBy SEC, age group and gender
Base: All respondents
We can see the next generation of adults (teens)are quite skeptical of the environmentalsituation.
Quality of Vietnam environment
25
25
28
18
32
21
29
2624
52
57
47
60
53
54
51
5355
20
16
22
20
14
23
17
1918
3
1
2
2
1
2
2
13
AB (n=283)
CD (n=539)
EF (n=173)
Teenagers (n=195)
Young Adults (n=185)
Mature (n=296)
Older (n=324)
Male (n=503)
Female (n=497)
Very bad Fairly bad Fairly good Very good

13
17
20
26
34
39
45
51
69
45
2
3
4
13
5
7
13
4
Less use of motorbike / take more
public transport
Use more public transport
Walk or use more bicycle / electric
bicycle
Use energy saving bulbs / solar
pow er lights
Recycle / separate w aste items for
recycling
Less use plastic bags
Use less w ater
Use less energy (gas, electriccity)
Not littering
Most important Actions
What are we doing to look after the environment?Current actions vs Perceived most important action
Stopping littering isconsidered the #1 actionto fight environmentalpollution
Source: VietCycle 2009

Environmental Brand PerceptionsEnvironmental Brand Perceptions
Source: TNS VietCycle
“I can use my mobile
to show my social
status & personality”
“7 out of 10 consumers “say” theyprefer to buy environmentallyfriendly products, …but do they?
No brand in VietnamNo brand in Vietnamhas an image of beinghas an image of being
environmentally friendlyenvironmentally friendly,but lots of companies
have the opposite image!
Feeding hungry Feeding hungry mouths and buying mouths and buying aspirationalaspirational brands, brands,
rules in Vietnamrules in Vietnam
Environmentally
Environmentally
Friendly?Friendly?

So letSo let’’s smarten ups smarten up&&
start to clean up!start to clean up!

Is the glass half full or half empty - Synopsis
Overall spend has continued to increase on almost allconsumer categories, but growth has declined by 15% to 50%compared to 2008.
Not all sectors have been impacted the same…Telecoms / Food / Beverages / Pharmaceuticals / Household Products /Education have all maintained steady if not staggering growth
Electronics / Automotive / Travel-tourism, Computer-Audio video /Finance-banking, beauty-personal care and real estate have all seen amild to steep drop off

Is the glass half full or half empty - SynopsisInversely, big ticket items such as cars and computers,banking and real estate products have all been relegated to alater date, during these times of uncertainty.
Bottom-line:Glass is half empty due impact of global recession (EXORTS/ FDI/ MR)Glass is half full due to strong performance of domesticmarketGlass is full compared to the rest of Asia as Vietnam is 1 ofonly 5 Growth economies in the region