Embed Size (px)
Citation preview
Reliability Lessons From The Automotive Industry
Larry Edson
Larry Edson Consulting Inc.
Cell: 248-207-2187
Home: 248-347-6212
The Evolution of Automotive Reliability YOU The Evolution of
Wind Turbine Reliability
A Special ½ Hour Presentation For The Danish Wind Turbine Industry
10/6/2009 1Copyright 2009 - Larry Edson Consulting Inc.

• Use Reliability Allocation to translate the big “I Want This Wind
Turbine To Be Reliable” into reliability requirements for devices.
• At the device level - Use the three step AQQ process shown below
to develop a mature device on time:
1. Analysis
2. Qualitative Testing
3. Quantitative Testing
• Define the “severe customer” or “severe environment” and use this to
quantify “one-life of damage” for each failure mechanism.
• Develop and Demonstrate the needed level of reliability relative
to the “severe level of damage” for each critical failure mechanism for
each device. Combine statistical rigor with engineering physics.
• You should define the requirements and the tests to be conducted by
your suppliers… do not assume that your supplier is the expert and
will do your job for you.
The “Lessons” In a Nutshell
10/6/2009 2Copyright 2009 - Larry Edson Consulting Inc.
Develop
Demonstrate and Validate
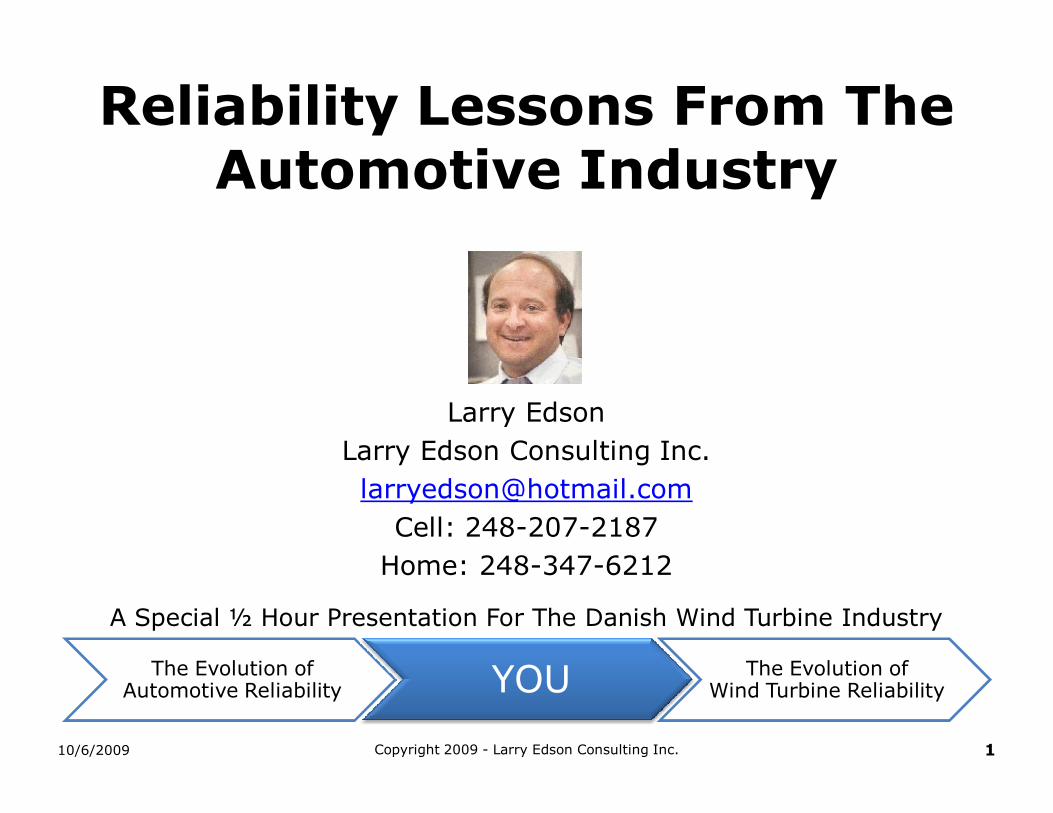
• We see “Reliability” as three phenomena that are often lumped together to form a “bathtub” curve:
Starting Point - The Three “Faces”of Reliability
Quality Issues –
Failure Rate Improves With
Time
Failure Rate
Reliability Issues – Failure
Rate Gets Worse With
Time
Random Chance Failure
We Control This With SPC Or Screening We Must Engineer
Robustness Into The Product To Move This
To The Right
Stress Exceeds Strength – An Umbrella May Help But May Not Be Sufficient…Difficult To Engineer A Solution To The
Un-Predictable
10/6/2009 3Copyright 2009 - Larry Edson Consulting Inc.

• The product starts to wear out as soon as you get the quality issues sorted out….not fair to the customer!
The Problem Addressed by The Reliability Engineer is…
Failure Rate
Random Chance Failure
We Must Engineer Robustness Into The Product
To Move The Wear Out Curve To The Right
When Do I Get The Chance To See The Falling
Piano?
Lets Focus On Moving The Wear Out Curve To The
Right!
10/6/2009 4Copyright 2009 - Larry Edson Consulting Inc.
10/6/2009 Copyright 2009 - Larry Edson Consulting Inc. 5
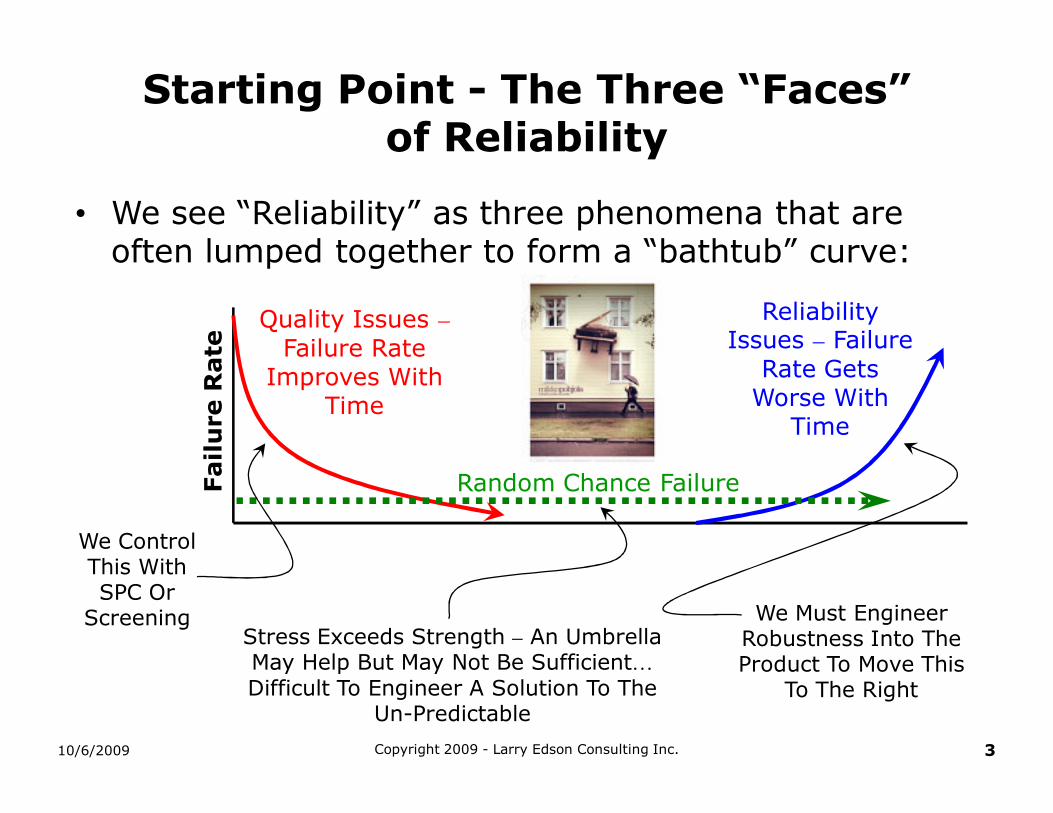
The Basic Concept of Stress-StrengthInterference
The World Of Stress
Product Strength
The World Of Stress
Product Degrades From Fatigue or Similar
Beginning Of One Life
End Of One Life
I Am The Extreme User
Valid for Cumulative and Non-Cumulative
Damage
Valid for Cumulative Damage
“One Life”= 20 Yrs.
Reliability and Failure
Mechanisms
Stress-Strength
Interference
Targeting The Severe User
Analytical Activities
“A”
Qualitative Activities
“Q”
Quantitative Activities
“Q”

Legend
Distribution of Usage Stress
Reliability is good for the below average user…. but not for anyone more severe
than average.
Unreliability for the Average User
Nominal Design Point and Variation in Product Strength
Stress or Strength
How Much Overlap is There When We Demonstrate Reliability For The Average User?
Severe User
Average User
Not Good!
10/6/2009 6Copyright 2009 - Larry Edson Consulting Inc.
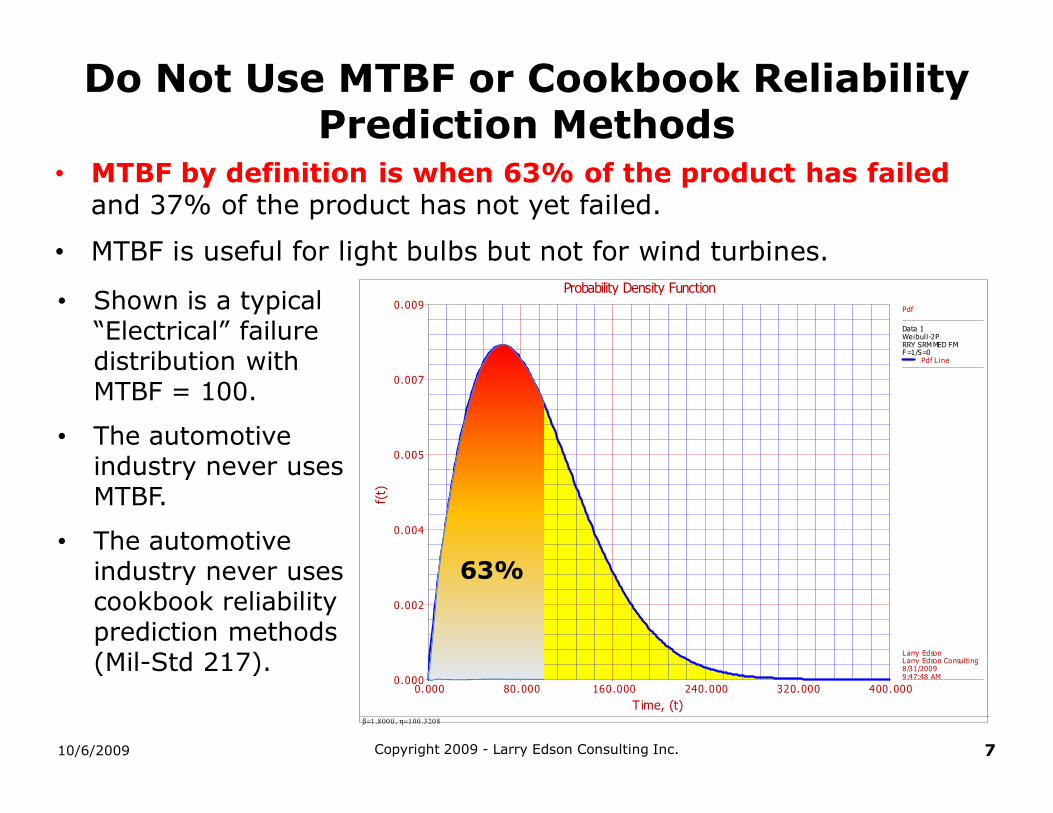
• MTBF by definition is when 63% of the product has failed and 37% of the product has not yet failed.
• MTBF is useful for light bulbs but not for wind turbines.
Do Not Use MTBF or Cookbook Reliability Prediction Methods
10/6/2009 7Copyright 2009 - Larry Edson Consulting Inc.
Probability Density Function
β=1 .8000 , η=100 .3208
Time, (t)
f(t)
0.000 400.00080.000 160.000 240.000 320.0000.000
0.009
0.002
0.004
0.005
0.007
Data 1Weibull-2PRRY SRM MED FMF=1/S=0
Pdf L ine
Larry EdsonLarry Edson Consulting8/31/20099:47:48 AM
63%
• Shown is a typical “Electrical” failure distribution with MTBF = 100.
• The automotive industry never uses MTBF.
• The automotive industry never uses cookbook reliability prediction methods (Mil-Std 217).
10/6/2009 8Copyright 2009 - Larry Edson Consulting Inc.
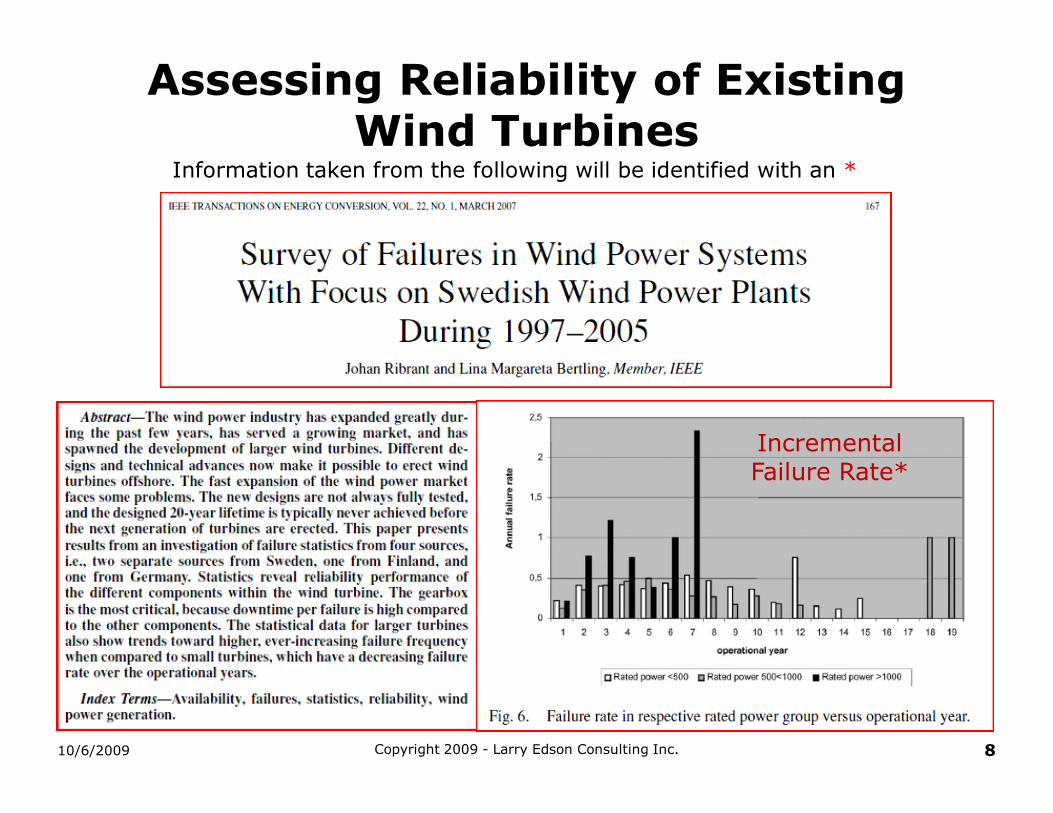
Assessing Reliability of ExistingWind Turbines
Information taken from the following will be identified with an *
Incremental Failure Rate*
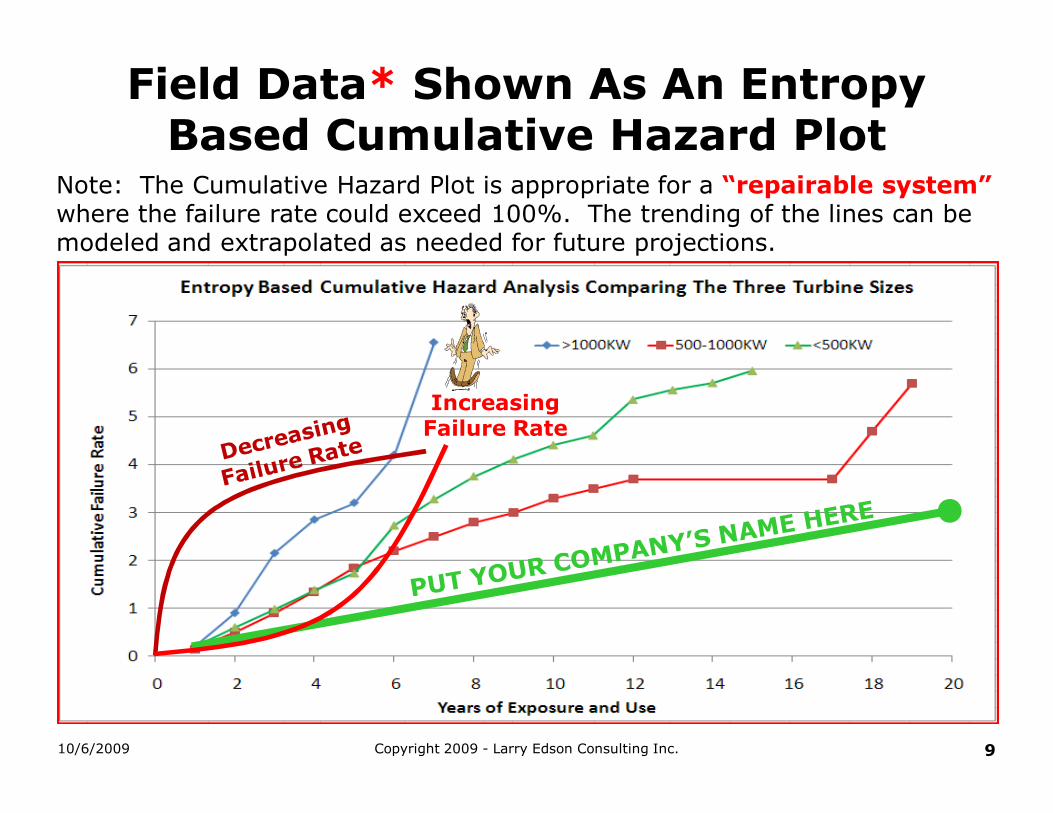
Field Data* Shown As An Entropy Based Cumulative Hazard Plot
10/6/2009 Copyright 2009 - Larry Edson Consulting Inc. 9
Note: The Cumulative Hazard Plot is appropriate for a “repairable system” where the failure rate could exceed 100%. The trending of the lines can be modeled and extrapolated as needed for future projections.
Increasing Failure Rate
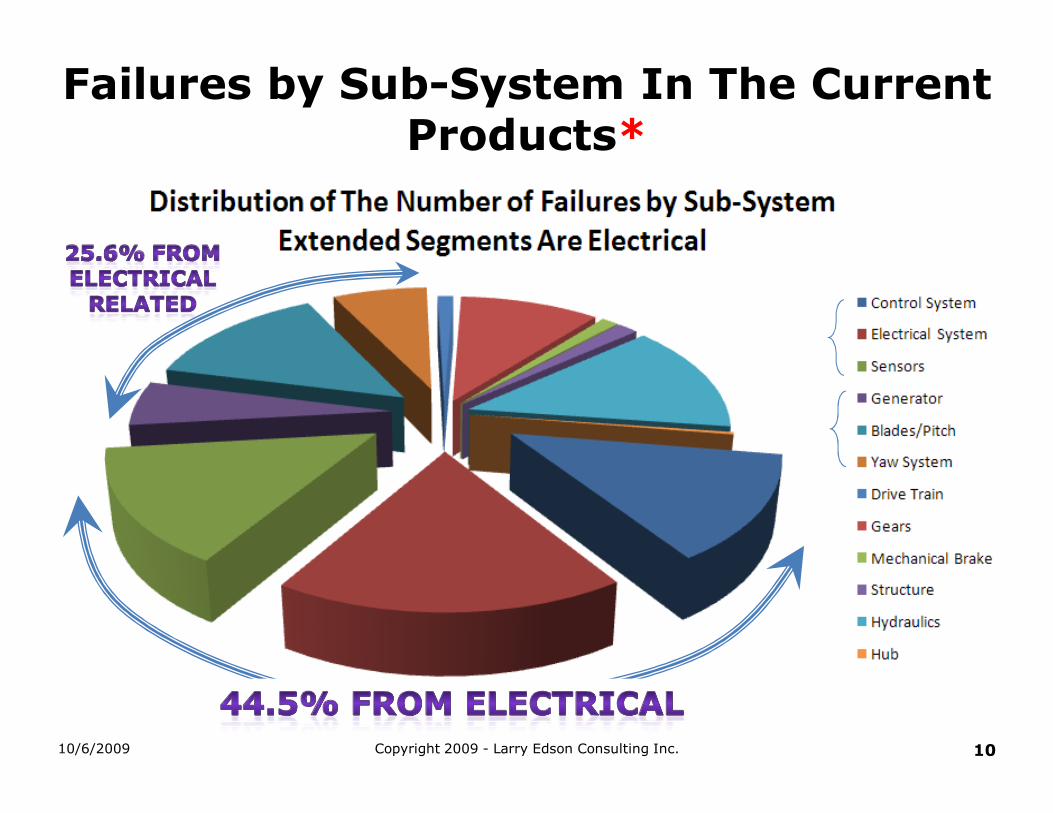
Failures by Sub-System In The Current Products*
10/6/2009 Copyright 2009 - Larry Edson Consulting Inc. 10
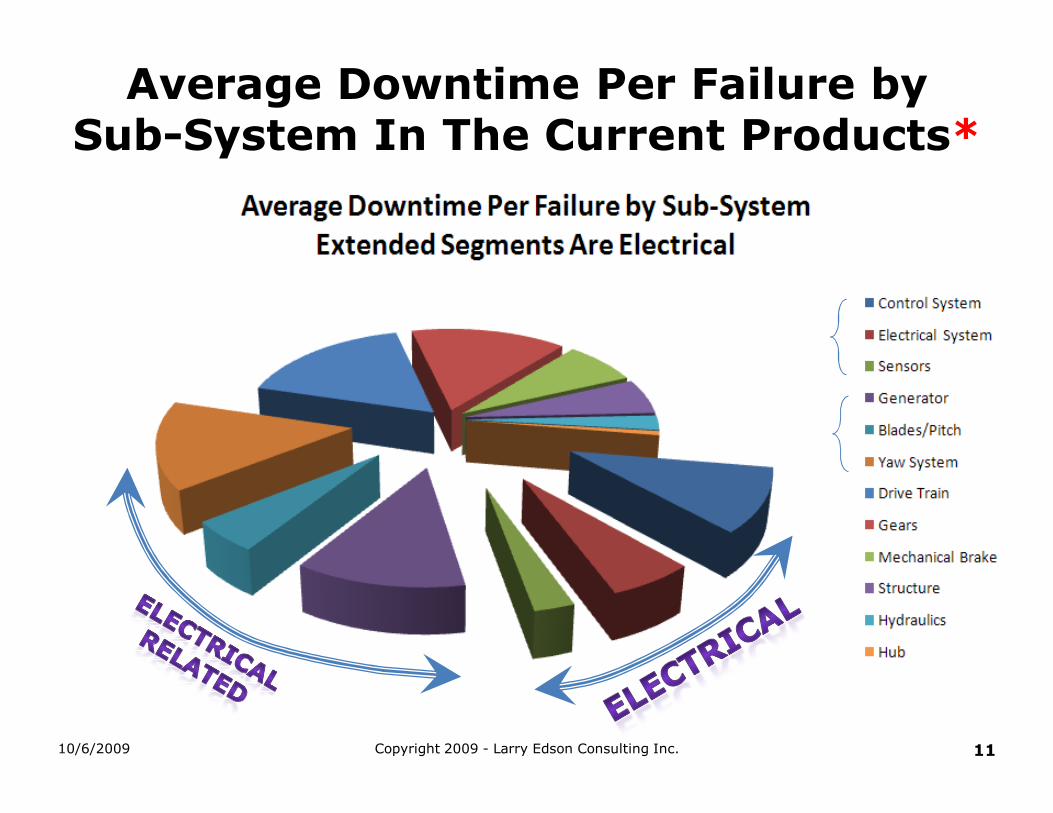
Average Downtime Per Failure bySub-System In The Current Products*
10/6/2009 Copyright 2009 - Larry Edson Consulting Inc. 11

• Strategy of Solution:
– You cannot jump from today’s biggest problem to tomorrow’s biggest problem as an effective strategy.
– You must have good reliability requirements for all of the components in a wind turbine as they are all interconnected.
– Electrical is a major contributor
• Electrical devices fail for mechanical reasons.
• The Electrical Engineering community has historically not been trained in dealing with mechanical issues.
– Reliability Apportionment, AQQ, and Accelerated Testing for “Quick Learning Cycles” is a good strategy……
10/6/2009 12Copyright 2009 - Larry Edson Consulting Inc.
OK… So We See That Things Could be Better…and Electrical is a Big Contributor

10/6/2009 Copyright 2009 - Larry Edson Consulting Inc. 13
We Look to One of The Greatest Engineers In History For Guidance – Leonardo Da Vinci
• What would Da Vinci tell us to do? (Draw The Big Picture)
From the book: “How To Think Like Leonardo da Vinci” by Michael J. Gelb
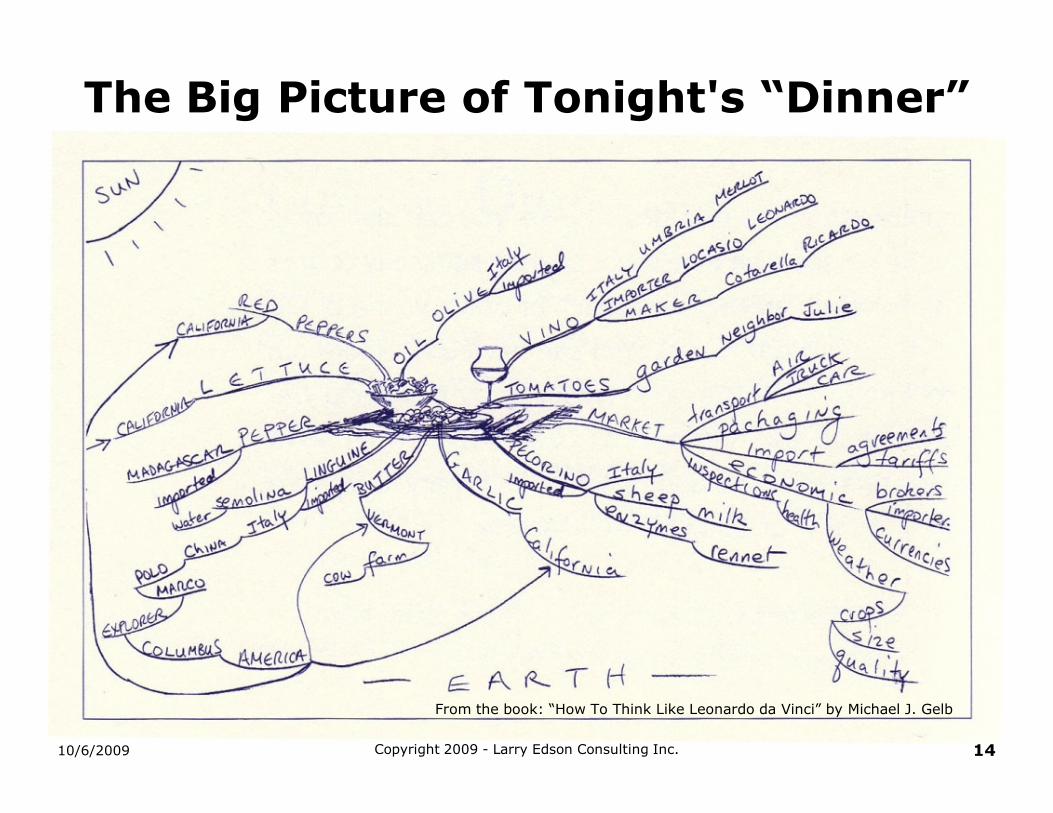
The Big Picture of Tonight's “Dinner”
10/6/2009 14Copyright 2009 - Larry Edson Consulting Inc.
From the book: “How To Think Like Leonardo da Vinci” by Michael J. Gelb
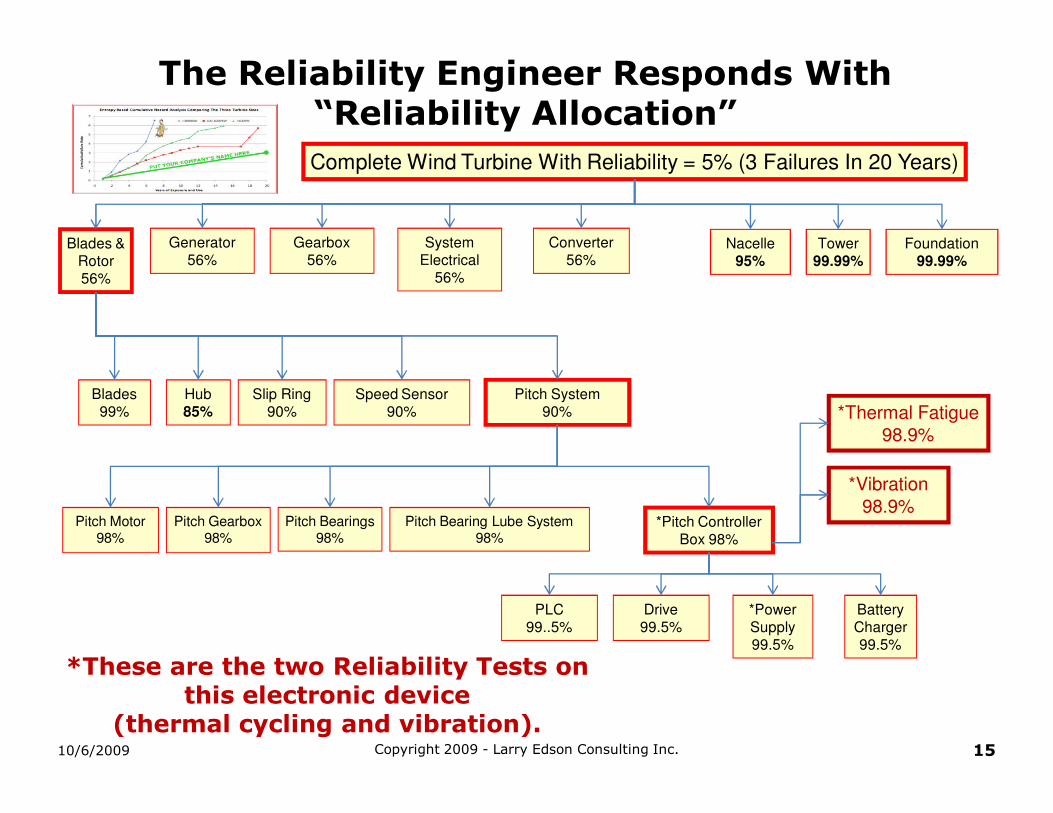
The Reliability Engineer Responds With “Reliability Allocation”
Complete Wind Turbine With Reliability = 5% (3 Failures In 20 Years)
Tower99.99%
Generator56%
Blades &Rotor56%
Converter56%
Nacelle95%
Foundation99.99%
Pitch System90%
Hub85%
Blades99%
Speed Sensor90%
Slip Ring90%
Pitch Gearbox98%
Pitch Bearings98%
Pitch Motor98%
Pitch Bearing Lube System98%
System Electrical
56%
*Pitch Controller Box 98%
PLC99..5%
Drive99.5%
*Power Supply99.5%
Battery Charger99.5%
Gearbox56%
*These are the two Reliability Tests on this electronic device
(thermal cycling and vibration).
*Thermal Fatigue
98.9%
*Vibration
98.9%
1510/6/2009 Copyright 2009 - Larry Edson Consulting Inc.

Improved Reliability At The System Level
10/6/2009 16Copyright 2009 - Larry Edson Consulting Inc.
Complete Wind TurbineR = 63.7% at 20 years (1/2 of a Failure In 20 Years)
Tower99.99%
Generator90%
Blades &Rotor
and Main Shaft99%
Converter90%
Nacelle Cover & Structure99%
Foundation99.99%
System Electrical90%
Gearbox90%
High Voltage
Transformer99%
OK…So Now That I Have A Reliability Requirement For a Device…What’s Next?
10/6/2009 Copyright 2009 - Larry Edson Consulting Inc. 17
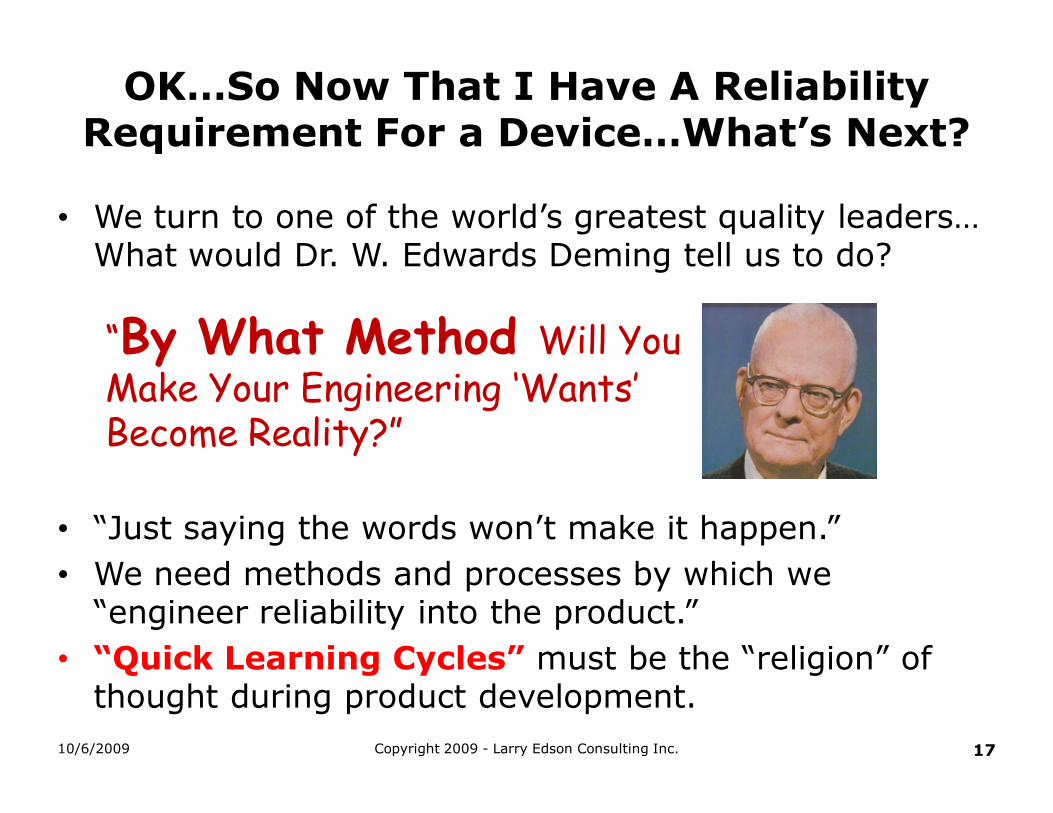
• We turn to one of the world’s greatest quality leaders… What would Dr. W. Edwards Deming tell us to do?
“By What Method Will You Make Your Engineering ‘Wants’ Become Reality?”
• “Just saying the words won’t make it happen.”
• We need methods and processes by which we “engineer reliability into the product.”
• “Quick Learning Cycles” must be the “religion” of thought during product development.
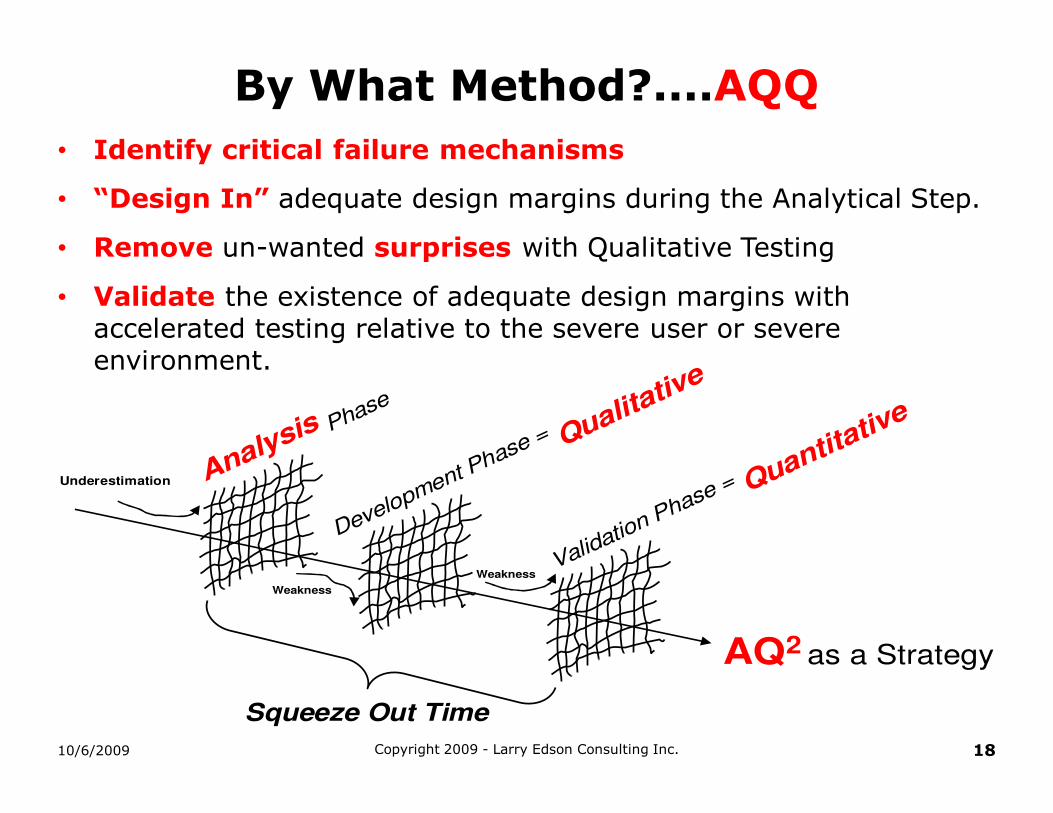
By What Method?....AQQ
10/6/2009 18Copyright 2009 - Larry Edson Consulting Inc.
Analysis Phase
Development Phase = Qualita
tive
Validation Phase = Quantita
tive
Squeeze Out Time
AQ2 as a Strategy
Weakness
Underestimation
Weakness
• Identify critical failure mechanisms
• “Design In” adequate design margins during the Analytical Step.
• Remove un-wanted surprises with Qualitative Testing
• Validate the existence of adequate design margins with accelerated testing relative to the severe user or severe environment.
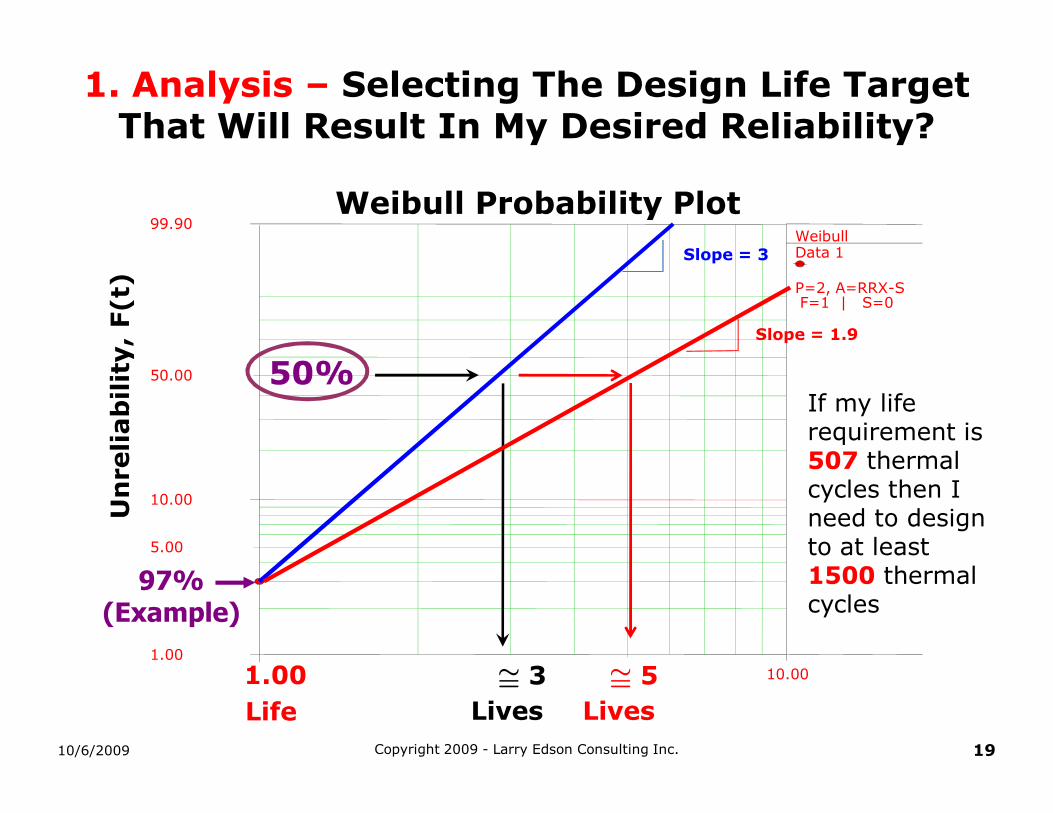
1.00
5.00
10.00
50.00
99.90
1.00 10.00
Weibull Probability Plot
Unreliability, F(t)
WeibullData 1
P=2, A=RRX-SF=1 | S=0
≅ 3
LivesLife
1. Analysis – Selecting The Design Life Target That Will Result In My Desired Reliability?
97%
(Example)
50%
10/6/2009 19Copyright 2009 - Larry Edson Consulting Inc.
≅ 5
Lives
Slope = 3
Slope = 1.9
If my life requirement is 507 thermal cycles then I need to design to at least 1500 thermal cycles
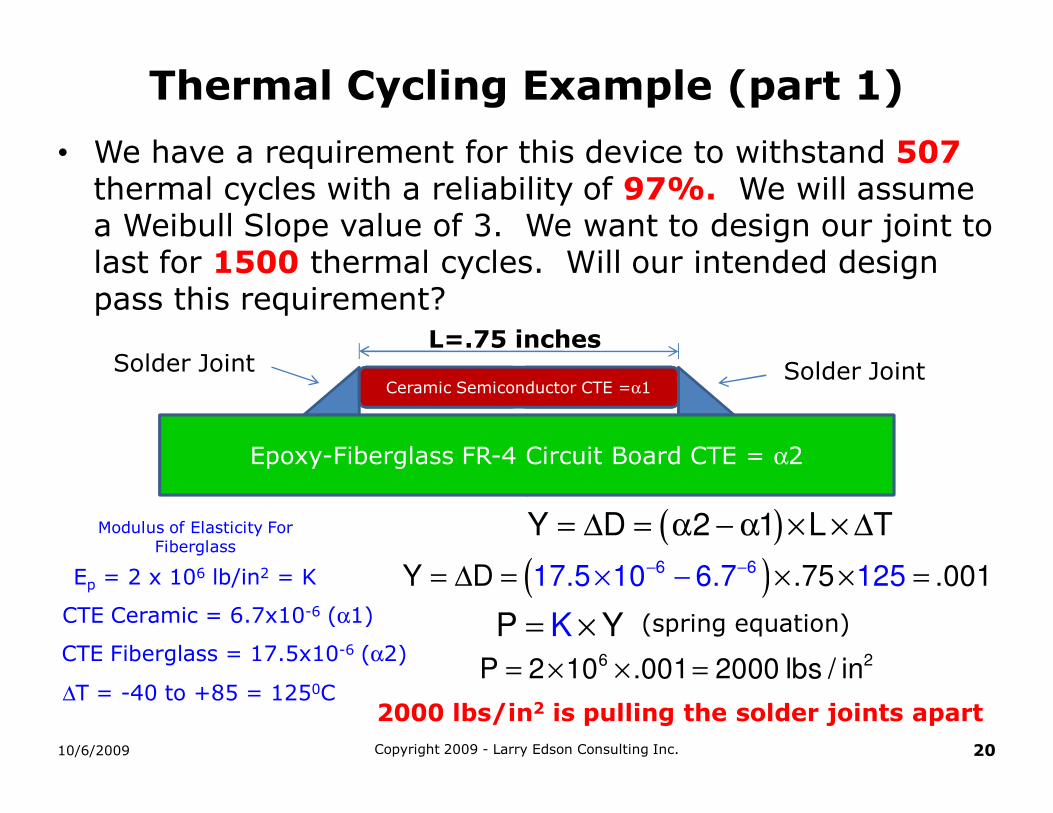
• We have a requirement for this device to withstand 507thermal cycles with a reliability of 97%. We will assume a Weibull Slope value of 3. We want to design our joint to last for 1500 thermal cycles. Will our intended design pass this requirement?
Thermal Cycling Example (part 1)
10/6/2009 20Copyright 2009 - Larry Edson Consulting Inc.
Epoxy-Fiberglass FR-4 Circuit Board CTE = α2
Ceramic Semiconductor CTE =α1
Modulus of Elasticity For Fiberglass
L=.75 inches
Solder JointSolder Joint
( )Y D 2 1 L T= ∆ = α − α × × ∆
CTE Ceramic = 6.7x10⁻⁶ (α1)
CTE Fiberglass = 17.5x10⁻⁶ (α2)
( )6 617.5 10 6.Y D .75 .00125 17− −= ∆ = × × =× −
∆T = -40 to +85 = 1250C
P YK= ×6 2P 2 10 .001 2000 lbs / in= × × =
(spring equation)
2000 lbs/in2 is pulling the solder joints apart
Ep = 2 x 10⁶ lb/in2 = K
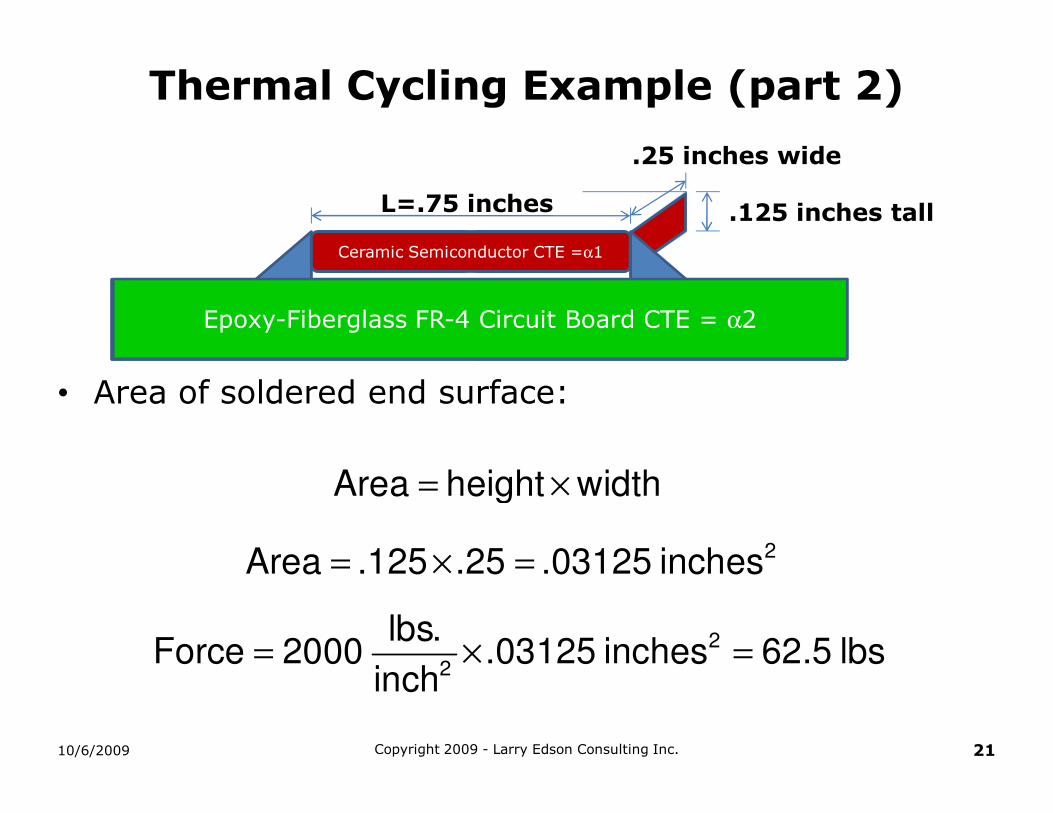
• Area of soldered end surface:
Thermal Cycling Example (part 2)
10/6/2009 21Copyright 2009 - Larry Edson Consulting Inc.
Ceramic Semiconductor CTE =α1
L=.75 inches
.25 inches wide
.125 inches tall
Epoxy-Fiberglass FR-4 Circuit Board CTE = α2
Area height width= ×
2Area .125 .25 .03125 inches= × =
2
2
lbs.Force 2000 .03125 inches 62.5 lbs
inch= × =
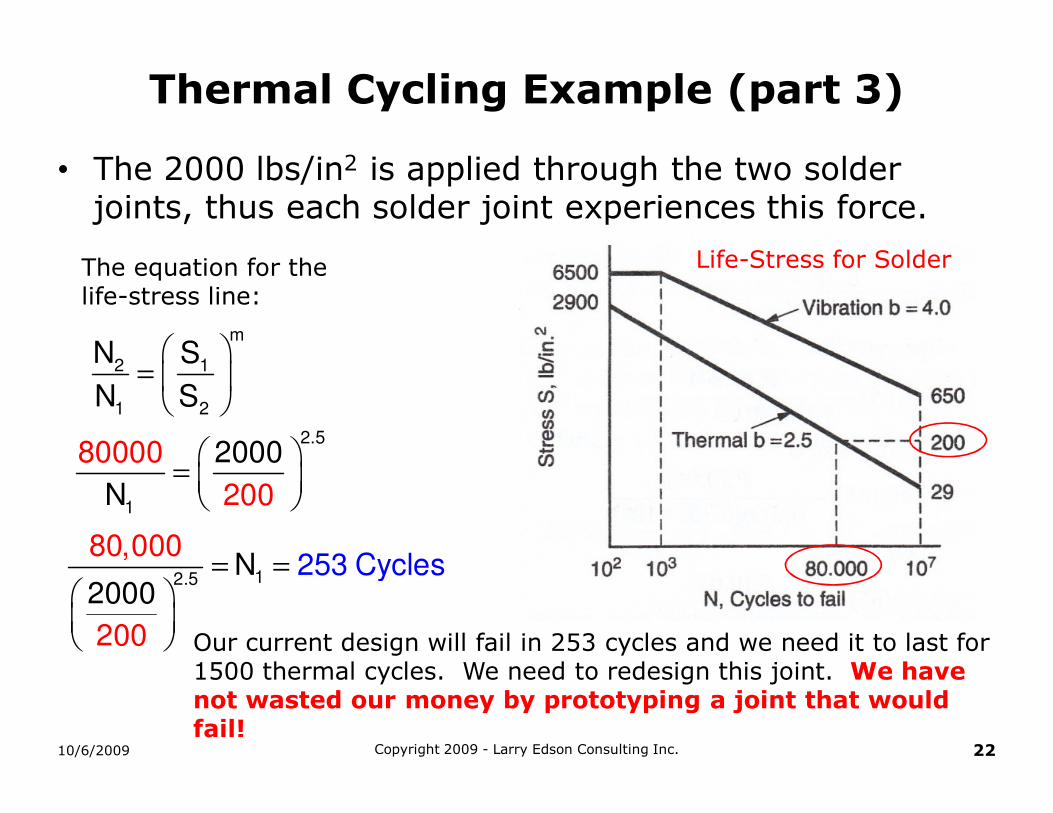
• The 2000 lbs/in2 is applied through the two solder joints, thus each solder joint experiences this force.
Thermal Cycling Example (part 3)
10/6/2009 22Copyright 2009 - Larry Edson Consulting Inc.
m
2 1
1 2
N S
N S
=
2.5
1
80000
2
000
00
2
N
=
12.5
80,00N
20
0
20
00253 C es
0
ycl= =
Life-Stress for SolderThe equation for the life-stress line:
Our current design will fail in 253 cycles and we need it to last for 1500 thermal cycles. We need to redesign this joint. We have not wasted our money by prototyping a joint that would fail!
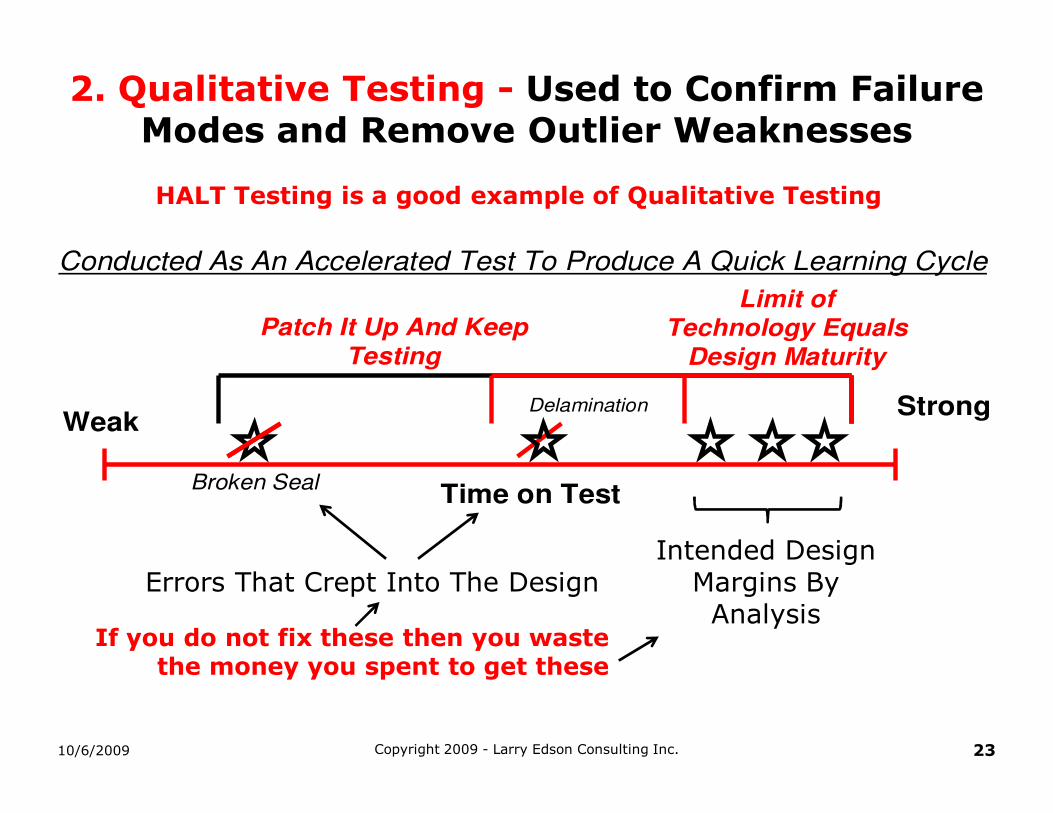
2. Qualitative Testing - Used to Confirm Failure Modes and Remove Outlier Weaknesses
Time on Test
WeakStrong
Patch It Up And Keep
Testing
Limit of Technology Equals
Design Maturity
Broken Seal
Delamination
Conducted As An Accelerated Test To Produce A Quick Learning Cycle
Intended Design Margins By Analysis
Errors That Crept Into The Design
If you do not fix these then you waste the money you spent to get these
10/6/2009 23Copyright 2009 - Larry Edson Consulting Inc.
HALT Testing is a good example of Qualitative Testing
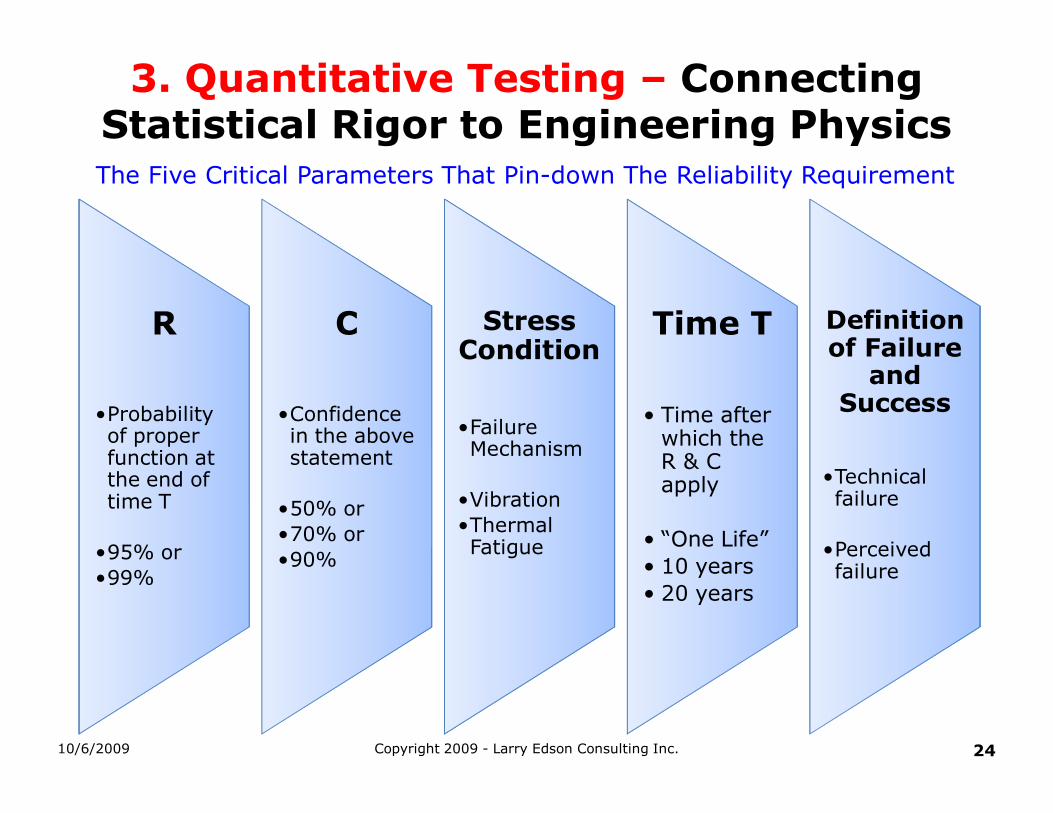
R
•Probability of proper function at the end of time T
•95% or
•99%
C
•Confidence in the above statement
•50% or
•70% or
•90%
Stress Condition
•Failure Mechanism
•Vibration
•Thermal Fatigue
Time T
• Time after which the R & C apply
• “One Life”
• 10 years
• 20 years
Definition of Failure
and Success
•Technical failure
•Perceived failure
The Five Critical Parameters That Pin-down The Reliability Requirement
3. Quantitative Testing – Connecting Statistical Rigor to Engineering Physics
10/6/2009 Copyright 2009 - Larry Edson Consulting Inc. 24

Sudden Death TestingReduced
Sample Size With
Extended Test Duration
Normal Sample Size and Normal Test Duration
Test To Failure At Normal Stress With
Weibull Plotting
Success-Run
Road Map of Reliability Statistical Methods
10/6/2009 25Copyright 2009 - Larry Edson Consulting Inc.
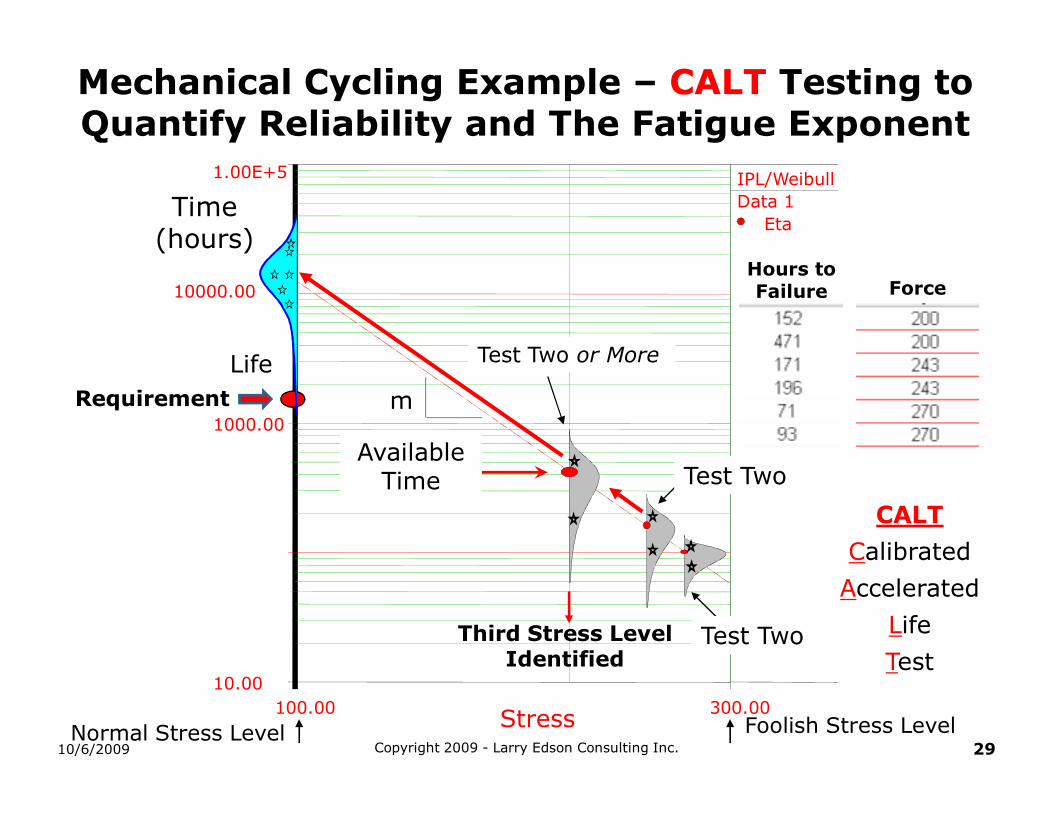
CALT
Degradation Analysis
Not Traditional
Testing To Failure
No Failures Permitted!Failures Are Required!
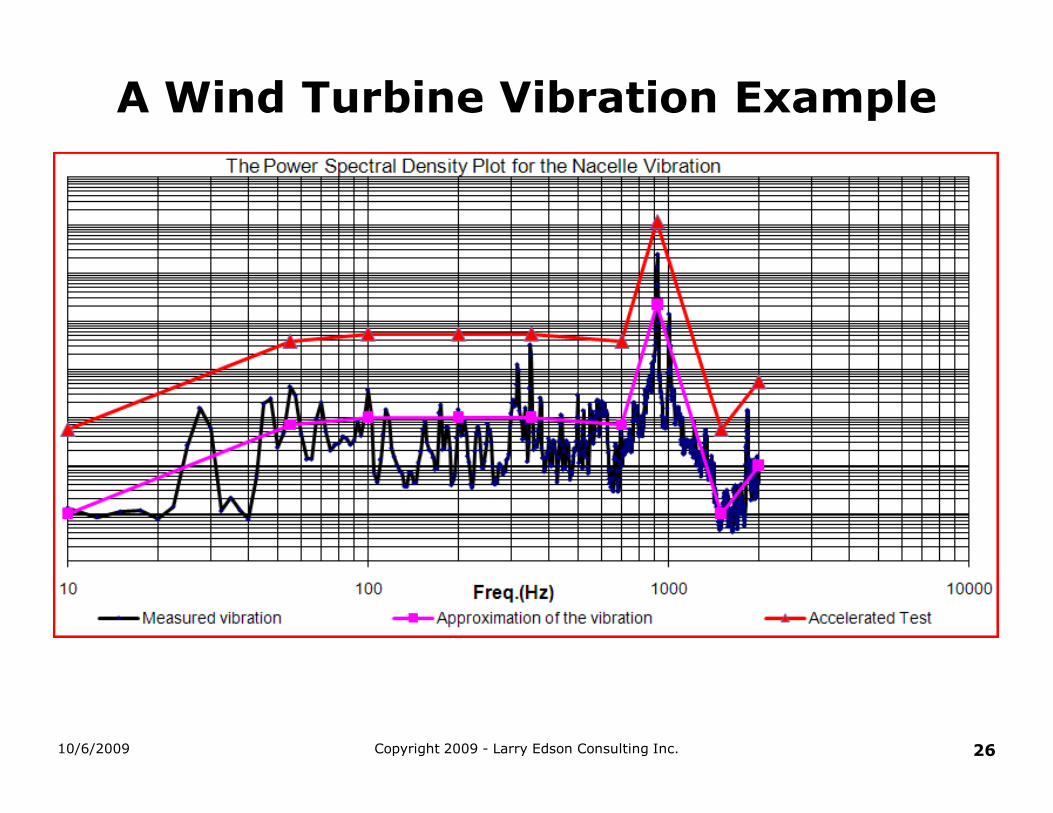
A Wind Turbine Vibration Example
10/6/2009 Copyright 2009 - Larry Edson Consulting Inc. 26

• The damaging energy is obtained by integration under the blue curve = .45 Grms
• This level of vibration will occur for 175,200 hours
• The fatigue exponent used is based upon the material being stressed (a value of 5 is used for steel)
• The “damage” from this is calculated below:
• An “equivalent-damage test” is 8 hours at 3.31 Grms:
Quantify 20 Years Worth of Damage
10/6/2009 27Copyright 2009 - Larry Edson Consulting Inc.
( )m
Damage N Stress= ×
( )5
175,203191.27 0 .45= ×
( )5
3191.27 8 3.31= ×
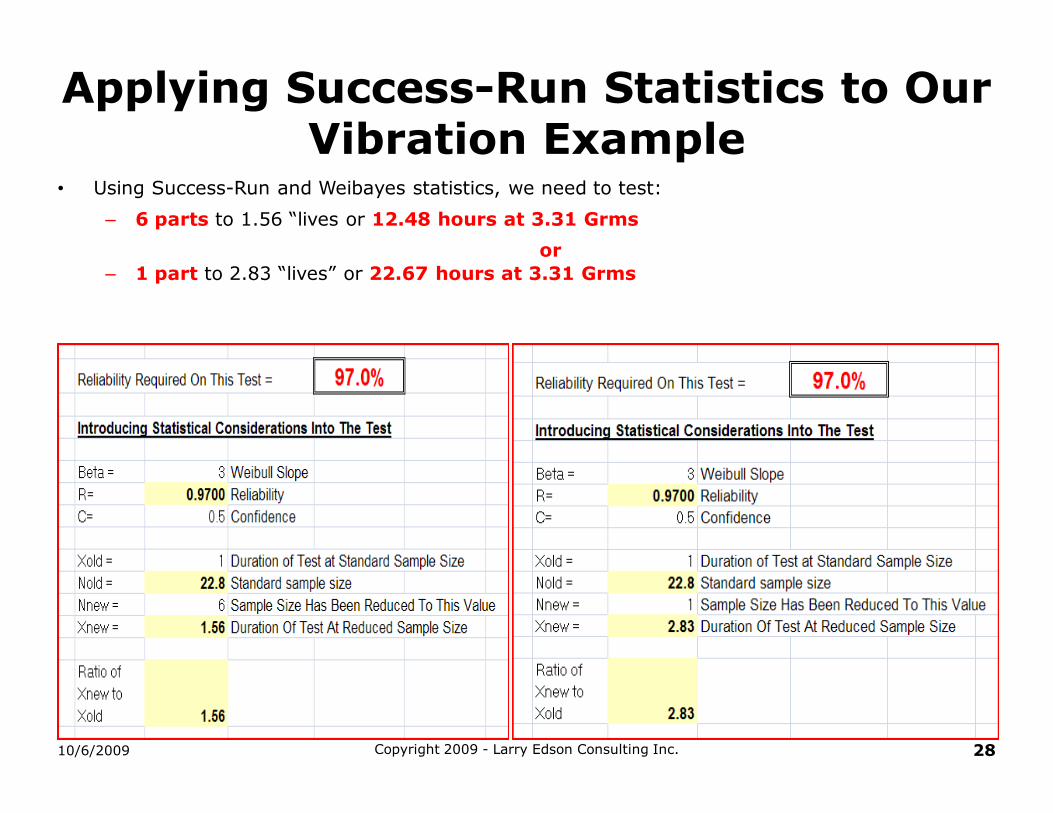
• Using Success-Run and Weibayes statistics, we need to test:
– 6 parts to 1.56 “lives or 12.48 hours at 3.31 Grms
or
– 1 part to 2.83 “lives” or 22.67 hours at 3.31 Grms
Applying Success-Run Statistics to Our Vibration Example
10/6/2009 28Copyright 2009 - Larry Edson Consulting Inc.
100.00 300.00
10.00
1.00E+5
1000.00
10000.00
Mechanical Cycling Example – CALT Testing to Quantify Reliability and The Fatigue Exponent
Stress
IPL/Weibull
Data 1
Eta
Requirement
Life
Time (hours)
Normal Stress Level Foolish Stress Level
Available Time
Third Stress Level Identified
Test Two
Test Two or More
Test Two
29Copyright 2009 - Larry Edson Consulting Inc.
CALT
Calibrated
Accelerated
Life
Test
Hours to Failure Force
m
10/6/2009
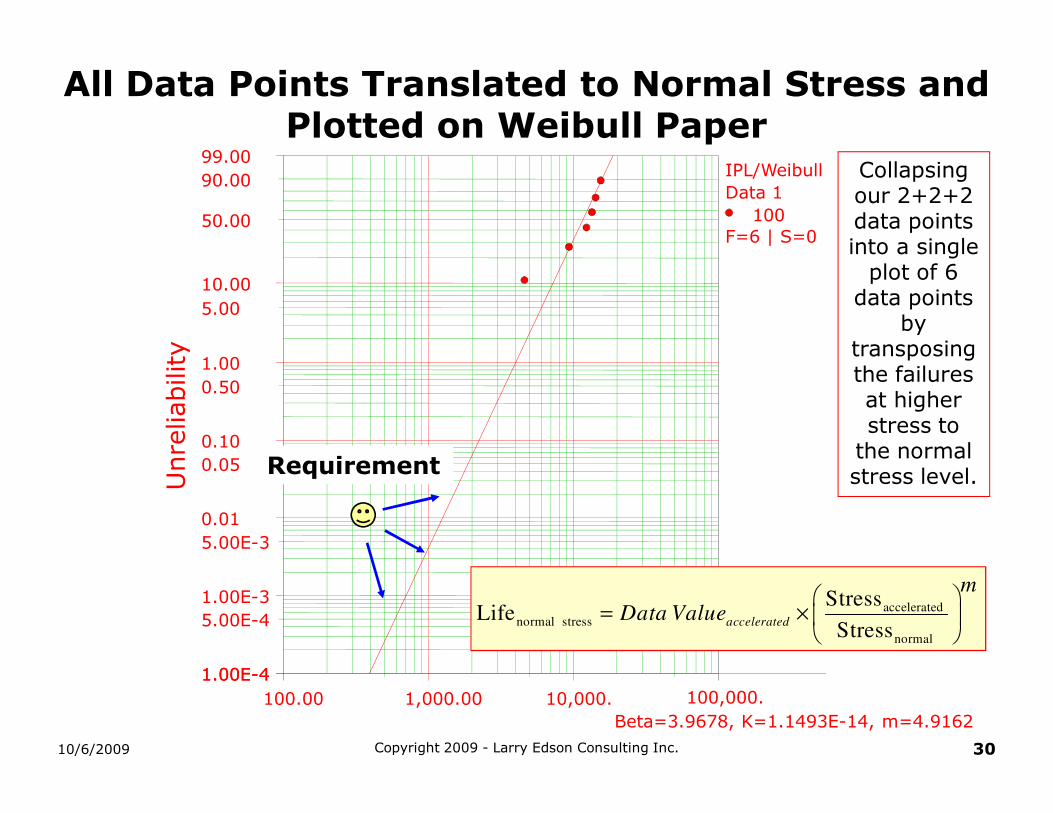
Collapsing our 2+2+2 data points into a single plot of 6 data points
by transposing the failures at higher stress to the normal stress level.
1.00E-4
5.00E-4
1.00E-3
5.00E-3
0.01
0.05
0.10
0.50
1.00
5.00
10.00
50.00
90.00
99.00
1.00E-4
100.00 1,000.00 10,000.
Unreliability
IPL/Weibull
Data 1
100
F=6 | S=0
Beta=3.9678, K=1.1493E-14, m=4.9162
Requirement
All Data Points Translated to Normal Stress and Plotted on Weibull Paper
30
100,000.
accelerated
normal stress
normal
StressLife
Stress
= ×
accelerated
m
Data Value
10/6/2009 Copyright 2009 - Larry Edson Consulting Inc.

• “Reliability” is just another form of engineering made consistent through a process. No magic here.
• The AQQ process is well proven and effective…most people only make use of the last letter.
• Learn to focus on the concept of defining “one-life.”
• Focus on the “severe user” or “severe environment.”
• Design accelerated tests based upon the concept of “Damage equals Damage.”
• Apply the right kind of statistical methods to best fit the needs of the situation.
• Reliability Apportionment can help rationalize the reliability requirements being used (sanity check).
Summary – Coaching The Supplier
10/6/2009 31Copyright 2009 - Larry Edson Consulting Inc.