Embed Size (px)
Citation preview

1
Lehman Brothers CEO Energy Conference
New YorkSeptember 3, 2008
NYSE: DVN www.devonenergy.com page 2
Investor Notices
Safe HarborInformation provided in this presentation includes “forward-looking statements” as defined bythe Securities and Exchange Commission. Forward-looking statements are identified as“forecasts, projections, estimates, plans, expectations, targets, etc.” and are subject to avariety of risk factors. For representative risk factors that could cause Devon’s actual results todiffer materially from the forward-looking statements contained herein, see Form 8-K filedAugust 6, 2008.
Cautionary Note to U.S. InvestorsThe United States Securities and Exchange Commission permits oil and gas companies, in theirfilings with the SEC, to disclose only proved reserves that a company has demonstrated byactual production or conclusive formation tests to be economically and legally producible underexisting economic and operating conditions. In this presentation we may use certain terms,such as resource potential, reserve potential, probable resources, possible resources,contingent resources, prospective resources and exploration target size. The SEC guidelinesstrictly prohibit us from including these terms in filings with the SEC. U.S. Investors are urged toconsider closely the disclosure in our Form 8-K, File No. 001-32318, available from us at DevonEnergy Corporation, Attn. Investor Relations, 20 North Broadway, Oklahoma City, OK 73102. Youcan also obtain this form from the SEC by calling 1-800-SEC-0330.

2
NYSE: DVN www.devonenergy.com page 3
Devon Today
Proved reserves (12/31/07): ≈ 2.5 Billion BOE
Current production (Q2 2008): ≈ 643 MBOED
Oil & gas production (Q2 2008): 66% gas
34% oil & NGLs
Production profile (Q2 2008): 94% North America
Reserves / production ratio: ≈ 11 years
Enterprise value: ≈ $49 Billion
Largest U.S.-based independent oil and gas producer
NYSE: DVN www.devonenergy.com page 4Organizational focus on per share results
Capital Allocation Criteria
Optimize per share growth on a debt-adjusted basis through:
• E&P capital projects
• Share repurchases
• Debt reduction
• High-grading asset portfolio

3
NYSE: DVN www.devonenergy.com page 5
Property Divestitures2002-2007
$0.3Midstream
$3.9Total
$0.4 International
$1.4 Canada
$0.5 U.S. Offshore
$1.3 U.S. Onshore
Proceeds(In Billions)
Area
NYSE: DVN www.devonenergy.com page 6
African Divestitures
84$3,019Total
55$2,226ClosedEquatorial Guinea
8$375ClosedEgypt
2nd Half ‘08
2nd Half ‘08
Closed
Expected Closing
17
-
4
Reserves (MMBBL)
$205Cote d’Ivoire
$8 Angola & Ghana
$205Gabon
Proceeds(In Millions)

4
NYSE: DVN www.devonenergy.com page 7
10%
20%
30%
40%
50%
60%
70%
2002 2003 2004 2005 2006 2007 2008
Debt to Adjusted Capitalization
Notes: Excludes exchangeable debentures and 14.2 million shares of Chevron common stock owned by Devon. This is a non-GAAPmeasure, see appendix for required disclosures.
Through June 30, 2008
NYSE: DVN www.devonenergy.com page 8
Common Stock Repurchases
$102.561%6,4842008*
$55.4314%66,594Total
$79.801%4,0862007
$59.611%4,2412006
$48.2810%46,7832005
$37.781%5,0002004
Average Price Per
Share
Percent of Outstanding
Shares
Number of Shares
(In Thousands)
*Through August 2008.

5
NYSE: DVN www.devonenergy.com page 9
Potential Growth RatesProduction Per Debt-Adjusted Share
2007 2008 2009 2010 2011
Lower Case: 6% CAGR
Upper Case: 13% CAGR
Note: Production per debt-adjusted share converts annual average net debt into common shares outstanding based onannual average stock price.
$70 / 7.50$70 / 7.50$70 / 7.50$100 / 9.80Lower Case: Oil / Gas
$96 / 9.00$96 / 9.00$96 / 9.00$100 / 9.80Upper Case: Oil / Gas
NYSE: DVN www.devonenergy.com page 10
Operating Strategy
• Optimize near-term growth throughdevelopment of low-risk property base
– Large individually-significant projects
– Principally North America
• Provide long-term growth opportunitiesthrough investing in high-impact projects
Balanced investments yield sustainable growth

6
NYSE: DVN www.devonenergy.com page 11
2008 E&P Capital Forecast
Time Horizon
5%
68%
21%
6%
$7.3 – 7.6 Billion $5.8 - 6.0 Billion
Near-Term by Area
21%
79%
Long-Term
Near-Term
U.S.Onshore
Canada
InternationalGulf
NYSE: DVN www.devonenergy.com page 12
Existing Development Inventory
JackfishLloydminster
CANADA
PolvoBRAZIL
Development inventory of large, individually significant projects
Barnett ShaleCarthageGroesbeckWoodford ShalePowder RiverWashakieGulf of Mexico
UNITED STATES

7
NYSE: DVN www.devonenergy.com page 13
Barnett Shale Regional SettingLargest Gas Field in Texas
Ft. Worth DallasDenton
Barnett Shale
OKLAHOMA
TEXAS
HoustonAustin
Oklahoma CityCovers 10 counties
Play-wide production: 4 BCFED
> 9,000 producing wells
(horizontal and vertical)
Note: From PI/Dwight‘s as of March 2008.
NYSE: DVN www.devonenergy.com page 14
U.S. Shale ComparisonBest-In-Class
HighMediumMediumLowAbove ground risk(market, topography, regulatory environment)
726860147Total gas in-place(BCF/square mile)
6%7%6%6%Porosity
130’250’175’389’Net
150’275’175’433’Gross
Thickness
6,350’3,000’7,550’7,500’Depth
MarcellusFayettevilleWoodfordBarnett

8
NYSE: DVN www.devonenergy.com page 15
Defining the Barnett ShaleClassification of Acreage Based on Industry Results
0.90.7
2.2
Primary Emerging Speculative
430 591
4,859
Primary Emerging Speculative
Average EUR by Area (BCFE)
Producing Horizontal Wells by Area*
ParkerPalo Pinto
Hood JohnsonErath
Hill
JackWise Denton
Primary
Emerging
Speculative
HighlyUrbanized
0 – 1 BCFE 1 – 1.5 BCFE 1.5 – 15.0 BCFE
Estimated Ultimate Recovery (EUR)
* Producing wells as of March 2008.
NYSE: DVN www.devonenergy.com page 16
Barnett ShaleDevon’s Superior, First-Mover Position
527,300
78,600
ParkerPalo Pinto
Hood
Tarrant
JohnsonErath
Hill
JackWise Denton
Primary
Emerging
Speculative
Ft. Worth
HighlyUrbanized
Denton
Net Acreage
• Primary: 519,000 acres (73%)
• Emerging: 118,000 acres (16%)
• Speculative: 78,000 acres (11%)
• Total: 715,000 acres
Q2 ’08 net production: ≈ 1.1 BCFED
Producing wells: ≈ 3,500
2007 activity: Drilled 539 wells
2008 plans: Drill 630 - 660 wells

9
NYSE: DVN www.devonenergy.com page 17
Devon Barnett ShaleHistory of Firsts
1st mover in the play
2002 1st horizontal program (1st well: Veale Ranch #1H, August 2002)
2003 1st horizontal well (Sandefur #2H, February 2003) in Johnson County
2005 1st 1,000’ spaced horizontal infill
2005 1st to reach 1 TCFE of net cumulative production
2007 1st to drill 1,000 horizontal wells
Q2 2008 1st to achieve 1 BCFED net production
NYSE: DVN www.devonenergy.com page 18
Barnett Shale First-Mover Position Yields Superior Economics
$2,139
$1,181
$443
$0
$500
$1,000
$1,500
$2,000
$2,500
81% NRI, $2.8 M/acre 75% NRI, $10 M/acre 70% NRI, $15 M/acre
NRI% / Lease Cost
Befo
re-T
ax N
PV 1
0% (
In T
hous
ands
)
Note: Assumes EUR - 2.2 BFCE, drilling & completion costs - $3 MM, $7.50 per MCF, 80 surface acres per well (1,000’ apart).

10
NYSE: DVN www.devonenergy.com page 19
Devon Barnett Shale Net Production
0100200300400500600700800900
1,0001,100
MM
CFE
D
2002 2003 2004 2005 2006 2007 2008
Vertical Development De-Risking
Full Development
Through June 30, 2008
NYSE: DVN www.devonenergy.com page 20
Barnett ResourcesHistory of Growth
2.1
2002
1.88.3
4.35.7
Total: 3.9 TCFE
2008
Total: 18.3 TCFE Risked4.7x
1.3 TCFE Produced
Proved Probable & Possible Contingent

11
NYSE: DVN www.devonenergy.com page 21
Barnett Production Outlook Another Decade of Growth
> 7,500 risked undrilled locations
≈ 13 years of inventory
Rate potential: 1.6 – 2.0 BCFED
NYSE: DVN www.devonenergy.com page 22
Carthage Field
Waskom
Bethany
Angelina
SanAugustine
Sabine
Shelby
RuskPanola
GreggHarrison
MarionUpshur
Camp Cass
Texas
NET PRODUCTION
0
10
20
30
40
50
2003 2004 2005 2006 2007 2008e
MBO
ED
0
60
120
180
240
300
MM
CFE
D
Appleby
OK
TX
Net acreage: 150,000
Working interest: 85%
Q2 ’08 net production: 273 MMCFED
Potential horizontal locations: ≈ 100
2007 activity: Drilled 138 vertical wells
13 horizontal wells
2008 plans: Drill ≈ 140 vertical wells> 20 horizontal wells
Carthage
Stockman

12
NYSE: DVN www.devonenergy.com page 23
Haynesville ShaleDevon’s Position
• Approximately 483,000 net acres under lease– Royalty burden less than 20%
• Four wells currently on production and one well in the completion phase
• First horizontal well will be drilled in Q3’08
• Early estimates of > 70 TCF of gas in-place under Devon’s net acreage
• Continuing to evaluate acreage and working to optimize location selection and accelerate development
NYSE: DVN www.devonenergy.com page 24
Canada Oil SandsJackfish and Jackfish 2
Field characteristics:
• Low F&D
• Flat production profile (35 MBOD)
• Long reserve life > 20 years
• Working interest: 100%
Each project: 300 MMBO EUR
2008 Jackfish plans:• Ramp up production
2008 Jackfish 2 plans: • Expect regulatory approval (Q3 ‘08)
• Complete engineering and budgeting
• Sanction project
• Begin construction
Jackfish 2
Jackfish
B. C.
Alberta
Sask.
Q2 exit rate: ≈ 14,500 barrels per day

13
NYSE: DVN www.devonenergy.com page 25
Iron River
Manatokan
End Lake
Lloydminster
Lloydminster
Net acreage: 2.1 million
Q2 ’08 net production: ≈ 42 MBOED
Multi-year inventory ≈ 2,000 risked locations
Low-risk development
Manatokan plant expansion underway• Expected completion: Q4 ‘08
2007 activity: Drilled 429 wells
2008 plans: ≈ Drill 445 wells
NET PRODUCTION
0
10
20
30
40
50
2003 2004 2005 2006 2007 2008e
MBO
ED0
60
120
180
240
300
MM
CFE
D
B. C.
Alberta
Sask.
NYSE: DVN www.devonenergy.com page 26
North America Onshore Position
OK
TX
NM
WY
MT
Largest U.S.-based independent producer
Net acreage: ≈ 5,164,0002008 plans: Drill ≈ 740 wells
2nd Largest independent gas producer
Net acreage: ≈ 1,145,0002008 plans: Drill ≈ 50 wells
Net acreage: ≈ 623,0002008 plans: Drill ≈ 240 wells
Largest independent gas producer4th Largest independent oil producer
Net acreage: ≈ 316,0002008 plans: Drill ≈ 125 wells
Net acreage: ≈ 295,0002008 plans: Drill ≈ 200 wells
Largest independent gas producer
Net acreage: ≈ 1,863,0002008 plans: Drill ≈ 1,100 wells
Alberta / B.C.
Montana
Wyoming
New Mexico
Oklahoma
Texas
Major player throughout central / western U.S. and Canada
AlbertaB.C.
Rankings and drilling plans as of 8/5/2008. Acreage as of 12/31/2007.
14
NYSE: DVN www.devonenergy.com page 27
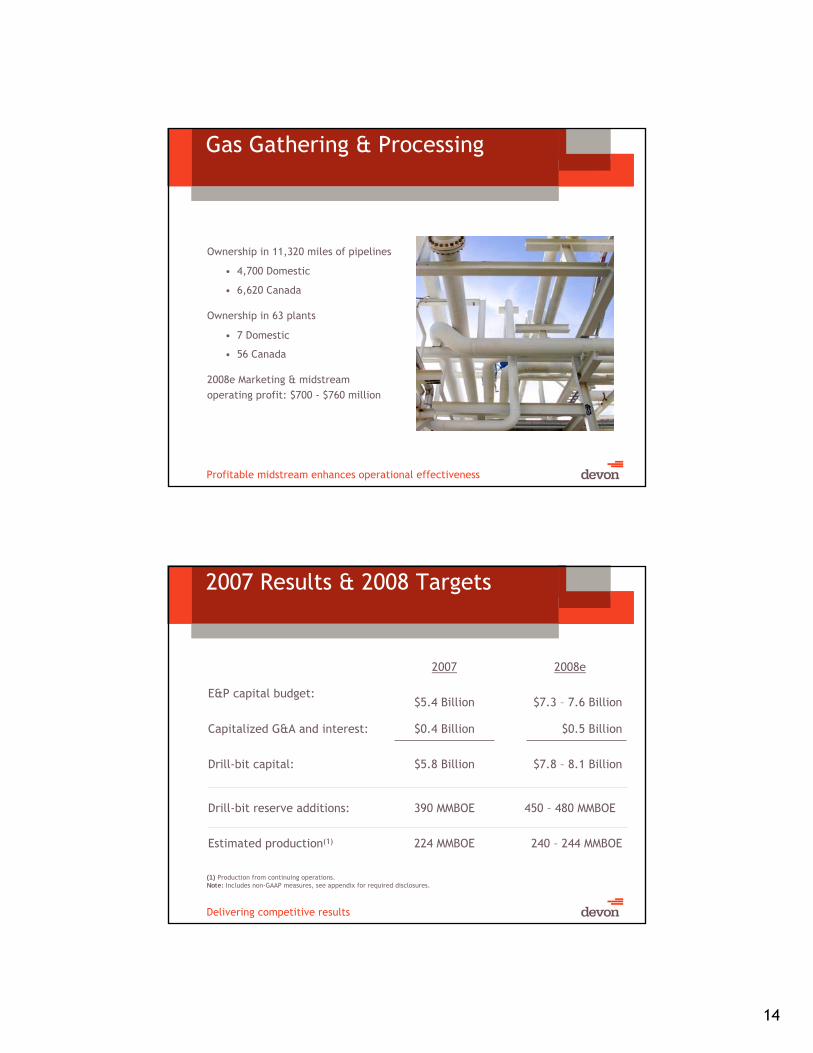
Gas Gathering & Processing
Profitable midstream enhances operational effectiveness
Ownership in 11,320 miles of pipelines
• 4,700 Domestic
• 6,620 Canada
Ownership in 63 plants
• 7 Domestic
• 56 Canada
2008e Marketing & midstream operating profit: $700 - $760 million
NYSE: DVN www.devonenergy.com page 28
2007 Results & 2008 Targets
Delivering competitive results
240 – 244 MMBOE224 MMBOEEstimated production(1)
450 – 480 MMBOE390 MMBOEDrill-bit reserve additions:
$7.8 – 8.1 Billion$5.8 BillionDrill-bit capital:
$0.5 Billion$0.4 BillionCapitalized G&A and interest:
$7.3 – 7.6 Billion$5.4 BillionE&P capital budget:
2008e2007
(1) Production from continuing operations. Note: Includes non-GAAP measures, see appendix for required disclosures.

15
NYSE: DVN www.devonenergy.com page 29
Low-Risk Production Growth
MMBOE
2006 2007 2008e 2009e
Note: Production from continuing operations.
200224
240 - 244265 - 280
CAGR ≈ 10 - 12%
Strong production growth from existing assets
NYSE: DVN www.devonenergy.com page 30
Operating Strategy
• Optimize near-term growth throughdevelopment of low-risk property base
– Large individually-significant projects
– Principally North America
• Provide long-term growth opportunitiesthrough investing in high-impact projects
Balanced investments yield sustainable growth

16
NYSE: DVN www.devonenergy.com page 31
2008 E&P Capital Forecast
9%
17%60%
14%21%
79%
$7.3 – 7.6 Billion $1.5 – 1.6 Billion
Long-Term by AreaTime Horizon
Long-Term
Near-Term U.S.Onshore
Canada
International
Gulf
NYSE: DVN www.devonenergy.com page 32
Exploration InventoryNet Unrisked Resource Potential
GULF OF MEXICO CHINA
4 – 7 BBOE40 Prospects
2 – 4 BBOE11 Prospects
BRAZIL
1 – 2 BBOE6 Prospects
Multi-year, high-impact

17
NYSE: DVN www.devonenergy.com page 33
Exploring on 4 licensed blocks
1 – 2 BBOE of net unrisked resource potential
2008 plans:
• 11/34: Drill in second half ‘08
• 42/05, 53/30 & 64/18: Acquire 2D
& 3D seismic to accelerate
evaluation programs
C H I N A
11/34100% WI
15/3424.5% WI
53/30100% WI
64/18100% WI
South ChinaSea
Yellow Sea
2008 Planned Exploration Activity
China Exploration
42/05100% WI
NYSE: DVN www.devonenergy.com page 34
BM-BAR-3100% WI
BM-CAL-13100% WI
BM-C-3025% WI
BM-C-3240% WI
BM-C-860% WI
BC-217.65% WI
Exploring on 9 licensed blocks(4 blocks with Petrobras)
2 – 4 BBOE of net unrisked resourcepotential
2008 plans:
• Finish 3-D seismic reprocessingover 4 concessions
• BM-C-30: Currently drilling
• Mobilize Deepwater Discovery drill ship to Brazil late 2008 / early2009
BM-C-3450% WI
2008 Planned Exploration Activity
BM-C-3535% WI
B R A Z I L
BarreirinhasBasin
CamamuBasin
Campos Basin
Brazil Exploration

18
NYSE: DVN www.devonenergy.com page 35
Texas
Louisiana
Deepwater Gulf of Mexico Exploration Trends
Lower Tertiary Trend196 Blocks
Miocene Trend160 Blocks
Block Ownership:• 2nd largest in trend• 1st among independents
Block Ownership:• 9th largest in trend• 3rd among independents
Lower Tertiary trend data for Alaminos Canyon, Keathley Canyon and Walker RidgeMiocene trend data for East Breaks, Garden Banks, Green Canyon, Atwater Valley, Mississippi Canyon
NYSE: DVN www.devonenergy.com page 36
Estimated Discovered Resource Net to Devon: 300 – 900 MMBOE
2≈ 800’26.7%2006Kaskida
2> 350’25.0%2004Jack
3> 450’22.5%2003St. Malo
2> 450’50.0%2002Cascade
Wells Drilled
Net Feet of Hydrocarbon Sands
Working Interest
Year DiscoveredProject
Devon’s Lower Tertiary Summary of Discoveries

19
NYSE: DVN www.devonenergy.com page 37
TertiaryLower Trend
Trend
Devon’s Lower Tertiary Prospect Inventory
• 4 significant discoveries to date
• 25 additional prospects
Devon Discovery
Devon Prospect
Cascade
Jack
Kaskida
St. Malo
Merope
Cherry Bomb
Capella
Sardinia West
Propus
Bottle Rocket
Gorgona
Navi
Knik
M80
Jericho
Vinita
Cypress West
Bass
Azha
Dart
Latigo
TertiaryLower Trend Ponza Deep
FistKampilan
Bolt
FuryWombat
Damascus
Cordoba
NYSE: DVN www.devonenergy.com page 38
Texas
Louisiana
Devon’s Miocene Prospect Inventory
Devon Miocene Prospect
Devon Miocene Discovery
Mission Deep
Sturgis
Impala
Colorado
Erie
Tuscany W
Sabre
Winter Park
Arbalest
Shelby Petard
ChapsKoala West
Sturgis North
Portage
Koala East
Comet

20
NYSE: DVN www.devonenergy.com page 39
3 – 5
300 - 500+
50%
25
Lower Tertiary
1 – 2
100 - 250
55%
15
Miocene Total
40Undrilled prospects identified:
50%Average working interest:
4 - 7 Devon’s net unrisked potential (BBOE):
100 - 500+ Gross potential per prospect (MMBOE):
Gulf of Mexico Deepwater
NYSE: DVN www.devonenergy.com page 40
Texas
Louisiana
Upcoming Deepwater Gulf Exploration Activity
Jack No. 3 AppraisalQ3 2007 Spud
Currently Drilling
Sturgis NorthQ1 2008 Spud
Currently Drilling
Cascade No. 3 Q4 2008 Spud
Deepwater Miocene
Deepwater Lower Tertiary
St. Malo No. 4 AppraisalQ4 2007 Spud
Currently Drilling
Kaskida Appraisal2nd Half 2008 Spud
BassQ3 2008 Spud
Currently Drilling
Mission Deep AppraisalQ3 2008 Spud
Currently Drilling
DamascusQ3 2008 Spud
Koala WestQ4 2008 Spud

21
NYSE: DVN www.devonenergy.com page 41
Resource Potential InventoryStrong Foundation for Growth
10,770
100
180
250
330
510
580
610
790
950
1,150
2,270
3,050
Risked Total Resources(MMBOE)
1,280890East Texas
530820Canada Unconventional
24,080
180
390
280
720
830
980
4,740
1,170
6,240
6,840
Total Unrisked Resources(MMBOE)
20,319Total
225South Texas
47Gulf of Mexico Shelf
500
1,570
3,550
2,230
480
2,260
67
7,500
Total Risked UndrilledLocations
Mid Continent
Permian Basin
Rocky Mountains
International
Canada Conventional
Canada Oil Sands
Gulf of Mexico Deepwater
Barnett Shale
NYSE: DVN www.devonenergy.com page 42
Emerging Play Exposure
8,5501,330Total
520East Texas Unconventional
110Mid Continent Unconventional
120Rocky Mountain Unconventional Gas #2
Unrisked Resource Potential
(MMBOE)Net Acreage (In Thousands)
160Canada Unconventional Gas
420Rocky Mountain Unconventional Gas #1
22
NYSE: DVN www.devonenergy.com page 43
Why Own Devon
• Assets: The best of North America
• Significant resource potential
– >20,000 risked undrilled locations
– 10.8 BBOE risked potential
• Focus on growth per share
Thank You.

23
Appendix A
Additional Low-Risk Development
NYSE: DVN www.devonenergy.com page 46
NET PRODUCTION
0
4
8
12
16
2001 2002 2003 2004 2005 2006 2007 2008e
MBO
ED
0
24
48
72
96
MM
CFE
DGroesbeck
OK
TX
Net acreage: 170,000
Working interest: 72%
Q2 ’08 net production: ≈ 90 MMCFED
Horizontal success at Nan-Su-Gail and Oaks
Potential horizontal locations: ≈ 125
2007 activity: Drilled 17 vertical wells4 horizontal wells
2008 plans: Drill ≈ 12 horizontal wells5 vertical wells
Nan-Su-Gail
Dew
Bald Prairie
Personville
Oaks
Limestone
Freestone
Leon
Robertson
Texas

24
NYSE: DVN www.devonenergy.com page 47
Net acreage: 54,000
Q2 ’08 net production: ≈ 38 MMCFD
6 operated rigs running
Constructing gas processing plant• Processing capacity: 200 MMCFD
• Completion expected: October 2008
2007 activity: Drilled 89 wells
2008 plans: Drill ≈ 110 wells
Woodford Shale
OK
TX
Hughes
Pittsburg
Atoka
Coal
Pushmataha
Oklahoma
NYSE: DVN www.devonenergy.com page 48
Washakie
Net acreage: 157,000
Working interest: 76%
Q2 ’08 net production: ≈ 111 MMCFED
Undrilled locations: > 300
Low-risk, tight sand gas
Initiated drilling on 1st horizontal well (Q2 2008)
2007 activity: Drilled 161 wells
2008 plans: Drill ≈ 110 wells
NET PRODUCTION
0
4
8
12
16
20
2003 2004 2005 2006 2007 2008e
MBO
ED
0
20
40
60
80
100
120
MM
CFE
D

25
NYSE: DVN www.devonenergy.com page 49
Net acreage: 252,000
Working interest: 75%
Q2 ’08 net production: ≈ 88 MMCFD
2007 activity: Drilled 193 wells
2008 plans: Drill > 110 wellsWY
COUT
NET PRODUCTION
0
5
10
15
20
2003 2004 2005 2006 2007 2008e
MBO
ED
0
30
60
90
120M
MC
FD
Powder River
Projected net production to exceed 100 MMCFD by the end of 2008
NatronaConverse
Johnson
Sheridan
Campbell
Wyoming
Montana
NYSE: DVN www.devonenergy.com page 50
Access Pipeline
EDMONTON
HARDISTYEnbridge P/L
To Midwest
Express P/LTo U.S. Rockies
Terasen P/LTo Pacific NW
ACCE
SS P
IPEL
INE
Atha
basc
a
Enbr
idge
P/L
IPF
Cold
Lak
e
IPF Cold Lake
AO
SPL
Sunc
orO
SPL
Rainbow P/L
Pembina P/L
Access BitumenBlend PipelineAccess DiluentPipelineOil Pipelines
From Edmonton, Alberta to Jackfish: ≈ 200 miles
Devon ownership: 50%
Bitumen Blend Pipeline:
• Jackfish to Sturgeon Terminal: 24” pipe
• Sturgeon Terminal to Edmonton: 30” pipe
Diluent Pipeline:• Edmonton to Jackfish: 16” pipe• Can access condensate, synthetic
crude and light oil markets in Edmonton
System designed for expansion to serviceadditional phases of Jackfish and/or thirdparty crude
JACKFISH
Flexibility enhances economics
Sturgeon Terminal

26
NYSE: DVN www.devonenergy.com page 51
Polvo Project
Working interest: 60%
1st production: July 2007
Expected peak production: 50 MBOED gross
B R A Z I L
Appendix B
Additional High-Impact Exploration

27
NYSE: DVN www.devonenergy.com page 53
TertiaryLower Trend
Tertiary
Lower
Trend
TertiaryLower Trend
Tertiary
Lower
Trend
Industry Discovery
Industry Non-Commercial
Results Unannounced
• 14 announced discoveries out of 23 wells drilled
• Trend data for Alaminos Canyon, Keathley Canyon and Walker Ridge only
• Additional penetrations along trend to the northeast
Cascade
Jack
Chinook
Stones
St. Malo
Kaskida
Tobago
Gotcha
Great White
Silvertip
Trident
Tiger
Toledo
Baha
Sardinia
HadrianDiamondbackDas Bump
Tucker
Julia
Lower Tertiary TrendIndustry Results to Date
Hal
Green Bay
Chuck
NYSE: DVN www.devonenergy.com page 54
Phased Development OptionLeased FPSO

28
NYSE: DVN www.devonenergy.com page 55
Phased Development OptionOwned FPSO
NYSE: DVN www.devonenergy.com page 56
Large Field Development Option

29
NYSE: DVN www.devonenergy.com page 57
Field 1
Field 2
Field 3
FSO
Multi-Field Development Option
NYSE: DVN www.devonenergy.com page 58
5th generation moored semi-submersibleowned by Diamond Offshore Drilling Inc.
4-year fixed term contractsecured by Devon followingrig conversion
Rig specs:
• Rated to 35,000’ drilling depth
• 8,000’ water depth rating
• Enhanced 12 pt. mooring
Ocean Endeavor

30
NYSE: DVN www.devonenergy.com page 59
New build 5th generation semi-submersibleowned by Seadrill Management AS
6-year fixed term contract securedby Devon following rig construction
July 2008 delivery
Rig specs:
• Rated to 37,500’ drilling depth
• 10,000’ water depth rating
• Designed and outfitted for subsea completions / development
• Dynamically positioned
West Sirius
NYSE: DVN www.devonenergy.com page 60
Sub-Salt Seismic Imaging
SALT
Time Migration Depth Migration
Source: TGS-NOPEC Geophysical Company

31
NYSE: DVN www.devonenergy.com page 61
Alaminos Canyon, Keathley Canyon & Walker Ridge
7790
245
196178
167 159
128 124
98
Chevron BP Statoil Anadarko Hess Shell Petrobras ConocoPhillips ExxonMobi
Lower Tertiary Block Ownership
Source: OWL Database ©1991-2007, Lexco Data Systems, Inc. – August 2008
NYSE: DVN www.devonenergy.com page 62
5,700’50%DVNKeathley CanyonFury
6,721’50%DevonWalker RidgeBolt
6,232’50%PetrobrasWalker RidgeCordoba
7,030’25%ChevronWalker RidgeDamascus
4,685’50%DevonKeathley CanyonDart
5,820’50%DevonWalker RidgeFist
6,237’12.5%ChevronKeathley CanyonCypress West
6,324’33.3%ChevronKeathley CanyonCherry Bomb
5,511’75%DevonKeathley CanyonCapella
6,475’50%DevonKeathley CanyonBass
4,189’16.7%AnadarkoKeathley CanyonBottle Rocket
5,583’100%DevonKeathley CanyonAzha
Prospect Water DepthDVN Block
W.I.OperatorArea
Lower Tertiary Prospect Inventory

32
NYSE: DVN www.devonenergy.com page 63
5,525’75%DevonKeathley CanyonVinita
6,059’25%ChevronKeathley CanyonGorgona
4,200’100%DevonGarden BanksJericho
6,500’50%PetrobrasKeathley CanyonKampilan
6,764’100%DevonWalker RidgeKnik
5,500’55%DevonAtwater ValleyWombat
6,062’35%ChevronKeathley CanyonSardinia West
6,219’25%ChevronKeathley CanyonPonza Deep
6,364’50%DevonKeathley CanyonNavi
3,422’100%DevonGarden BanksMerope
5,645’50%ChevronKeathley CanyonM80
4,094’50%DevonKeathley CanyonLatigo
Propus
Prospect
6,482’50%ChevronKeathley Canyon
Water DepthDVN Block
W.I.OperatorArea
Lower Tertiary Prospect Inventory - Continued