Embed Size (px)
Citation preview

This research study has been commissioned by the Consumer Council at the Austrian Standards Institute and was funded by the Austrian Ministry for Labour, Social Affairs and Consumer Protection.
Netherlands Institute for Safety Nibra P.O. Box 7010 6801 HA Arnhem The Netherlands T +31 (0)26 355 24 00 F +31 (0)26 351 50 51 [email protected]
Consumer fire safety: European statistics and
potential fire safety measures Versie: 431N8032/3.0, January 2009
This research study has been commissioned by the Consumer Council at the Austrian Standards Institute and was funded by the Austrian Ministry for Labour, Social Affairs and Consumer Protection.
Netherlands Institute for Safety Nibra:
We develop expertise, contribute towards the professional
development of the fire service, medical assistance in accidents and
disasters and crisis management, and thereby enhance physical
safety.
Consumer fire safety: European statistics and
potential fire safety measures

Consumer fire safety: European statistics and potential fire safety measures
NETHERLANDS INSTITUTE FOR SAFETY NIBRA 3
Colophon Client: Consumer Council, Austrian Standards Institute Heinestrasse 38, 1020 Vienna, Austria Contact: Dr. F. Fiala Title: Consumer fire safety: European statistics and potential
fire safety measures Date: January 2009 Status: Final report Version: 3.0 Project number: 431N8032 Authors: M. Kobes, MSc, BBE, MIFireE
K. Groenewegen - Ter Morsche, MSc Project leader: Dr. M.G. Duyvis Supervision: Dr. J.G. Post (Head of the Research Department NIFV)

Consumer fire safety: European statistics and potential fire safety measures
NETHERLANDS INSTITUTE FOR SAFETY NIBRA 4
Management summary The Consumer Council, Austrian Standards Institute, commissioned the Netherlands Institute for Safety (NIFV) to conduct a research study on consumer fire safety. The goals of the research project were:
1. to provide an overview of the relevance of domestic fires in terms of fatalities/injuries and damage, taking into account in particular the situation in European countries;
2. to identify major accident patterns (ignition and development) and articles involved, including fire causes and the role of relevant materials and products in smoke development and flame spread;
3. to assess the effectiveness of implemented or envisaged measures and potential benefits of measures with respect to products not subject to any regulation;
4. to establish recommendations concerning European regulatory measures for ignitability and flame spread.
European statistics
The NIFV used national fire statistics of several European countries. Comparing the fire statistics of one country with the statistics of another country should be carried out with great care, since there are no European standards for gathering, analyzing and publicizing data on fire statistics. Another limitation of fire statistics is that it only gives information about the fires that have been reported to the national statistical research bureau. It is likely that the national fire statistics only gives (partly factual and partly estimated) information about one quarter of all domestic fires. However, it gives a sufficient impression of the relevance of domestic fire safety concerns. Fire causes
Fire caused by human behavior occurs more than fires caused by technical failure. Sometimes it is hard to distinguish whether a fire cause is the consequence of human behavior or technical failure. Smoking proves to be the most common cause of domestic fires. Cooking is the second main cause. To prevent injuries and fatalities it is necessary to have information on the causes of fires and fatal fires in particular. However, to get an overview of fire causes in general per European country proved to be difficult, and to get insight in the causes of fatal fires specifically proved to be even more complicated of even impossible, because there are no data collected on a similar way in all European countries. Accident patterns
Smoking and cooking, in combination with the presence of upholstered furniture and textile, are the most common causes and accident patterns. Most fires occur in the weekends and especially at night. Men, children and elderly people are the most frequent victims of fatal fires. Many of the victims of fatal domestic fires show a low level of self efficacy. Use of alcohol is a major aspect in fatal domestic fires. Most fires start in the living room or bedroom, in (upholstered) furniture, textile, technical appliances or clothing.

Consumer fire safety: European statistics and potential fire safety measures
NETHERLANDS INSTITUTE FOR SAFETY NIBRA 5
Promising fire safety measures
A very promising fire safety measure is the use of noninflammable consumer products in dwellings. Therefore it is recommended to put effort in stimulation and/or legislation of the use of noninflammable consumer products, in particular (self-extinguishing) cigarettes, upholstered furniture and mattresses and electrical appliances with plastic coverings (i.e. televisions, computers and tumble dryers). Another very promising fire safety measure is the use of smoke detectors in dwellings, since most fatal fires occur in the night. However, the lack of maintenance of smoke alarms seems to be an overlooked aspect of fire safety. Therefore it is recommended to invest in measures that have a positive effect on the long-term operability of smoke alarms in dwellings. Other aspects of smoke alarms that need improvement are:
• averting the occurrence of false alarm and nuisance activations; • young children and elderly people have difficulties with wakening up by a
smoke alarm; • special attention is needed for the fire safety of people that have mobility
problems and for whom additional safety measures are needed; • smoke alarms need to be placed in bedrooms and should also be
interconnected. Residential sprinklers are expected to be a very promising fire safety measure. Given that sprinklers have not been implemented widely in dwellings, there is lack of reliable statistics that can underpin the potential effect on fire safety. However, theoretical studies using computer simulation methods suggest that sprinklers in dwellings can reduce the number of fire deaths by 66% and the number of non-fatal casualties by 45%. Results of a scenario-type study also suggest that about half of the fire deaths could be prevented by the use of sprinklers. In a case study on the effect of the implementation of residential sprinklers in Scottsdale (USA) it was found that, ten years after the implementation, the number of non-fatal casualties in fires had decreased 80% and that the 40 fires in houses equipped with a sprinkler caused no fatalities.

NETHERLANDS INSTITUTE FOR SAFETY NIBRA 6
Contents 1 Introduction 7
1.1 Consumer Fire Safety 7
1.2 Research design 7 2 The relevance of domestic fires in European countries 9
2.1 Introduction 9
2.2 Fire statistics in Europe 10
2.3 Fires in Europe 11
2.4 Fatalities and injuries 12 3 Fire causes and accident patterns 14
3.1 Introduction 14
3.2 Statistics of fire causes 15
3.3 Causes of domestic fires 17
3.4 Accident patterns 26
3.5 Conclusions 35 4 Assessment of fire safety measures 36
4.1 Introduction 36
4.2 Overview of fire safety measures 38
4.3 Criteria assessment 49
4.4 Conclusions 52
References 53 Abbreviations 57

Consumer fire safety: European statistics and potential fire safety measures
NETHERLANDS INSTITUTE FOR SAFETY NIBRA 7
1 Introduction
1.1 Consumer Fire Safety
Domestic fire safety is an area of concern. In Europe 2.0 – 2.5 million fires are reported per year, resulting in 20,000 – 25,000 fire deaths and 250,000 – 500,000 fire injuries in Europe per year [CTIF, 2006]. About 80% of the fatalities occur in private homes. Fire safety regulations cover residential buildings with respect to constructional fire safety. The interior, however, of the homes (in contrast to most commercial buildings) is full of materials that can easily be ignited and contribute to the fast spreading of fire. This area has been widely neglected in consumer protection legislation in Europe. Discussions on possible regulatory measures on domestic fire safety in Europe have not resulted in tangible legal provisions in the past. Recently the old debate about fire resistant upholstered furniture has been revived in the committee pertaining to the General Product Safety Directive as well as the debate about other subjects, such as fire safety of curtains and night dresses. However, the European Commission does not seem to have a clear policy in this area. Legitimate concerns have been expressed regarding the use of dangerous flame retardants. Often fire safety is weighed against chemical safety; lobbyists trying to prevent fire safety measures for commercial reasons (e.g. textile trade chains) on the one hand side and flame retardant manufacturers sometimes exaggerating facts on the other side, resulting in an ineffective blockade. It seems necessary to address these concerns by taking measures to improve fire safety and to eliminate dangerous substances simultaneously. Numbers of fatalities, accidents and property damage must be objectively assessed. The need for regulatory measures must be justified and well explained. The Netherlands Institute for Safety (NIFV) has been commissioned by the Consumer Council at the Austrian Standards Institute to conduct a research study on consumer fire safety; this research study was funded by the Austrian Ministry for Labour, Social Affairs and Consumer Protection,
1.2 Research design
The study is designed as a literature review. The literature was obtained primarily by search on the internet; also, data from earlier research by the NIFV was used. Because of the research design the study only gives a broad outline of existing information and does not present the result of an extensive study of the role of consumer products in domestic fires. Four goals for the research project have been determined:
1. to provide an overview of the relevance of domestic fires in terms of fatalities/injuries and damage, taking into account in particular the situation in European countries;
2. to identify major accident patterns (ignition and development) and articles involved, including fire causes and the role of relevant materials and products in smoke development and flame spread;

Consumer fire safety: European statistics and potential fire safety measures
NETHERLANDS INSTITUTE FOR SAFETY NIBRA 8
3. to assess the effectiveness of implemented or envisaged measures and potential benefits of measures with respect to products not subject to any regulation;
4. to establish recommendations concerning European regulatory measures for ignitability and flame spread.
Approach
To reach these goals the following approach was chosen: Ad 1: To provide an overview of the relevance of domestic fires in European
countries, we collected statistical data from internet databases and national statistical reports.
Ad 2: To identify major accident patterns and products involved, we collected and analyzed research reports on fire cause and fire development and reports on the role of consumer products in fire development.
Ad 3: To assess the (potential) effectiveness of fire safety measures we used the assessment tool 'Haddon Matrix'. Furthermore, we analyzed additional criteria to assess the (potential) effectiveness of safety interventions.
Ad 4: Based upon the results of the other research goals we have established underpinned recommendations concerning European regulatory measures for ignitability/flame spread.
Consumer fire safety: European statistics and potential fire safety measures
NETHERLANDS INSTITUTE FOR SAFETY NIBRA 9
2 The relevance of domestic fires in European
countries
2.1 Introduction
Fire and the effects of fire on escape possibilities constitute the type of danger involved in response in the event of fire. The critical factors affecting fire response performance in terms of fire characteristics are the perceptible characteristics of the fire, the velocity of the fire development, the toxicity of the evolving smoke, and the heat generated by the fire [Kobes, 2008]. The perceptible characteristics can be subdivided into characteristics that can be seen, smelt or heard. These characteristics influence the time it takes to discover a fire. The fire characteristics that can be heard have, apparently, little influence on the discovery of fire. Furthermore, various experiments have shown that even an evacuation signal is not regarded as a clear indication of fire [Proulx, 2003]. Smelling smoke or seeing flames and smoke are stronger indications of a fire and the need for escape [Tong and Canter, 1985; Proulx, 2003]. Nevertheless, even then people are found to continue their normal activities and wait for other people to respond first, before they take action [Fahy and Proulx, 2001; Tang and Beattie, 1997]. In many cases the degree of uncertainty concerning the danger of the situation delays the beginning of an evacuation. Therefore, eliminating uncertainty is an important factor in improving human behaviour in fires [Tong and Canter, 1985]. The rate of fire growth can be determined by a formula based on exponential growth, which varies depending on the fire growth coefficient of the burning material [Tang and Beattie, 1997; Chang and Huang, 2005]. Chang & Huang (2005) distinguish nine standard fire curves with different rates of fire growth. The fire curve of an ultra-fast fire growth would apply for example when synthetic materials such as polyurethane (PU) are burning. The fire growth rate is an important factor affecting fire fatality as many fatal fires are characterized by a rapid fire development after the fire has been discovered [Kobes, 2008; Sime, 2001]. Incident evaluations have shown that people are confronted with smoke during evacuation [Frantzich, 1994; Gwynne et al, 2001]. Several interviewed evacuees who tried to evacuate through smoke, declared that they had to change direction or even had to return because of breathing problems, vision reduction, fear or other reasons [Gwynne et al, 2001]. Reduction of sight and respiratory irritation as a result of smoke development, both have a negative influence on the occupant’s way finding performance. Most fire fatalities [Gann, 2004] are due to inhalation of smoke and toxic combustion gases [30]. Other effects of exposure to combustion gases and smoke are [ISO, 2004]:
• elimination of the ability to react; unconsciousness; • slower walking speed or modified behaviour, such as opting for a longer
escape route; • psychological limitation with respect to escape as a result of the individual in
question’s perception of danger; • long-term physical effects [ISO, 2004], such as cancer, lung damage and
impairment of the immune system [Blomqvist, 2005].

Consumer fire safety: European statistics and potential fire safety measures
NETHERLANDS INSTITUTE FOR SAFETY NIBRA 10
It is estimated that about 1% of the European people are confronted with burns each year (5 million people) [Viaene, year unknown]. In Europe, about 70.000 persons become severely injured (needing hospitalization) because of fire. Worldwide it is found that 30% of the injuries and fatalities concern children and 40% persons younger than 21 years; over 50% of the fire victims is reduced to poverty. A wide majority (more than 60% worldwide) of the fires are domestic fires [Viaene, year unknown]. Also, most of the casualties in fire occur in a domestic environment. Most of the fatalities occur at night in residential buildings [Vissers, 2004; Bruck, 2001; Irvine et al, 2000]. In the UK about 80% of the fatal fires occur in homes [Irvine et al, 2000] and in the Netherlands this number is about 50% [CBS, 2003].
2.2 Fire statistics in Europe
Each country collects fire statistics data using its own method. There are no European standards for gathering, analyzing and publicizing data on fire statistics. Subsequently, the methods that are used vary per country. Therefore, comparing fire statistics of one country with the statistics of another country should be considered with great care. Another limitation of fire statistics is that it only gives information about the fires that have been reported to the national statistical research bureau. Mostly, data are only reported in case a fire brigade was present at the fire scene. Besides the fact that not all fire brigades report to the national statistical research bureau1, it was found that in 78% of the domestic fires in the UK and in 75,2% of the fires in Australia the fire brigade was not called for [Barnett et al, 2007]. This indicates that national fire statistics probably only gives (partly factual and partly estimated) information about one quarter of all the domestic fires. On the other hand, these mostly are the fires that have large consequences in the sense of human losses and damage. Summarizing, it is important to note that the national fire statistics do not give the complete picture of fire casualty and fire damage in a country; however, it gives a sufficient impression of the relevance of domestic fire safety concerns. We used national fire statistics of several European countries. For most of the countries we found data on the number of fires and the number of fatalities in general. For just a few countries we found statistics specifically on domestic fires. Therefore, most of the data mentioned in this chapter concern fires in general. In some national statistics there are only data of fatal fires, in other national statistics data of non-fatal and fatal fire are presented and in other countries there has not been a distinction between fatal and non-fatal fires in statistics data. This makes it almost impossible to compare statistics of different countries. Secondly, not all national statistics are available on the internet. Only statistics that were available on the internet and/or in the NIFV library were used. For these two reasons comparable fire characteristics were not found for all European countries. Especially in the UK the fire statistics are extensive and well published. Therefore, we mostly used statistics from the UK and the Netherlands, because of earlier NIFV research on fatal and non-fatal fires and the availability of the data. On the subjects about which only a restricted quantity of information was found to be available, we also used statistics from non-European western countries, such as the USA, Canada, Australia and New Zealand.
1 For example, in the Netherlands about 80% of the fires have been reported, the data of the other 20% has been estimated based on the data of the reported 80% of the fires.
Consumer fire safety: European statistics and potential fire safety measures
NETHERLANDS INSTITUTE FOR SAFETY NIBRA 11
2.3 Fires in Europe
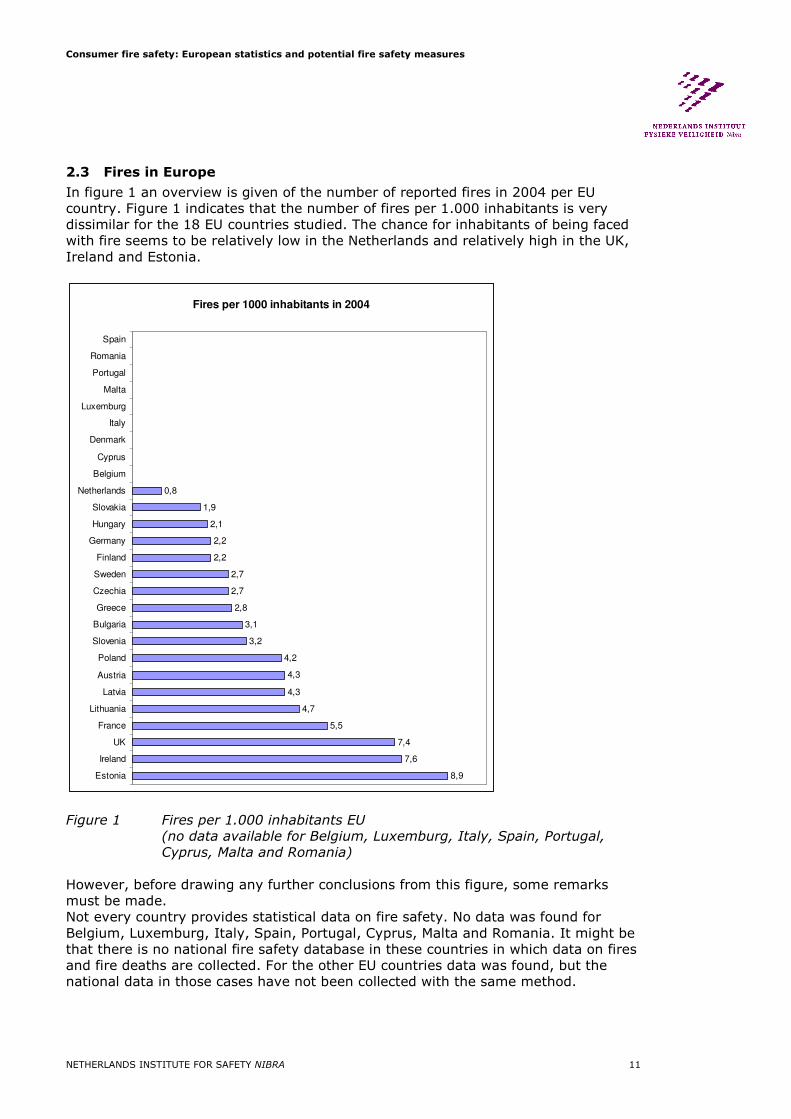
In figure 1 an overview is given of the number of reported fires in 2004 per EU country. Figure 1 indicates that the number of fires per 1.000 inhabitants is very dissimilar for the 18 EU countries studied. The chance for inhabitants of being faced with fire seems to be relatively low in the Netherlands and relatively high in the UK, Ireland and Estonia.
Fires per 1000 inhabitants in 2004
8,9
7,6
7,4
5,5
4,7
4,3
4,3
4,2
3,2
3,1
2,8
2,7
2,7
2,2
2,2
2,1
1,9
0,8
Estonia
Ireland
UK
France
Lithuania
Latvia
Austria
Poland
Slovenia
Bulgaria
Greece
Czechia
Sweden
Finland
Germany
Hungary
Slovakia
Netherlands
Belgium
Cyprus
Denmark
Italy
Luxemburg
Malta
Portugal
Romania
Spain
Figure 1 Fires per 1.000 inhabitants EU
(no data available for Belgium, Luxemburg, Italy, Spain, Portugal,
Cyprus, Malta and Romania)
However, before drawing any further conclusions from this figure, some remarks must be made. Not every country provides statistical data on fire safety. No data was found for Belgium, Luxemburg, Italy, Spain, Portugal, Cyprus, Malta and Romania. It might be that there is no national fire safety database in these countries in which data on fires and fire deaths are collected. For the other EU countries data was found, but the national data in those cases have not been collected with the same method.

Consumer fire safety: European statistics and potential fire safety measures
NETHERLANDS INSTITUTE FOR SAFETY NIBRA 12
Therefore it is hardly possible to compare the number of reported fires (per 1.000 inhabitants) of one EU country with the number from another EU country. Hence, besides that figure 1 is not complete the data is not collected in a homologous way.
2.4 Fatalities and injuries
Fires are a major cause of fatalities and injuries. It is estimated that in 2004 over 8.000 persons died in fires in the 27 countries of the Euopean Union. The CTIF reported in the ‘World Fire Statistics for 2004’ a total of 5.483 fire deaths in Estonia, Latvia, Lithuania, Slovakia, Hungary, Bulgaria, Poland, Czechia, Slovenia, Austria, Germany, France, Greece, Netherlands, Ireland, UK, Sweden and Finland [CTIF, 2006]. For Denmark, Belgium, Luxemburg, Italy, Spain, Portugal, Cyprus, Malta and Romania no data is available on the internet; however, the number is estimated to be about 2.665 persons2. In figure 2 an overview is given of the number of fire deaths and the fire death ratio (fire deaths per million) per EU country.
0
50
100
150
200
250
300
350
400
450
500
550
Latv
ia
Esto
nia
Lithuania
Fin
land
Hungary
Bulg
aria
Pola
nd
Gre
ece
Czechia
UK
Fra
nce
Irela
nd
Slo
vakia
Sw
eden
Slo
venia
Austr
ia
Germ
any
Neth
erlands
Belg
ium
Cypru
s
Denm
ark
Italy
Luxem
burg
Malta
Port
ugal
Rom
ania
Spain
Nu
mb
er
of
fire
death
s
0,0
5,0
10,0
15,0
20,0
25,0
30,0
35,0
40,0
45,0
50,0
55,0
60,0
65,0
Fir
e d
eath
s p
er
mil
lio
n i
nh
ab
itan
ts
Fire deaths per million inhabitants
Number of fire deaths
Figure 2 Number of fire deaths and fire death ratio per EU country
[CTIF, 2006]
(no data available for Belgium, Luxemburg, Italy, Spain, Portugal,
Cyprus, Malta and Romania
The (absolute) number of fatalities is relatively high in Poland, the UK, France and Germany; however, compared to the other EU countries the number of fire deaths per million inhabitants is not extremely high in these four countries.
2 Based on an average rate of 17,3 deaths per million inhabitants for the known data and a total of 154,4 million inhabitants for the unknown data, it is estimated that in the countries with no data on fire deaths the number of fire deaths is about 2.665 persons [CTIF, 2006].

Consumer fire safety: European statistics and potential fire safety measures
NETHERLANDS INSTITUTE FOR SAFETY NIBRA 13
The number of fire deaths per million inhabitants is relatively high in Latvia (58,7), Estonia (54,0) and Lithuania (52,4). The number of fire deaths per million inhabitants is relatively low for the Netherlands (4,3), Germany (5,3) and Austria (5,5). The average fire death ratio is 17,3 for the 18 EU countries studied.

Consumer fire safety: European statistics and potential fire safety measures
NETHERLANDS INSTITUTE FOR SAFETY NIBRA 14
3 Fire causes and accident patterns
3.1 Introduction
To set fire safety measures that reduce the occurrence of fire, it is necessary to obtain data about the causes of all domestic fires and fatal domestic fires in particular. The fire causes can be subdivided in two groups of causes in which consumer products are concerned. These two groups are: behavior related fire causes and product related fire causes. Behavior related fire causes are ignorance, imprudence, carelessness or incorrect use of consumer products. Product related fire causes concern a product failure. Sometimes it is hard to distinguish whether a fire cause is behavior related or product related. At the end of this chapter, we will discuss this. Not only knowing the cause of the fire is important for setting fire safety measures; it is also necessary to identify the accident patterns. Subjects of interest are the room of origin of the fire, the object of origin and the objects in the surroundings that contribute highly to smoke and/or heat development. Other subjects that give information on the accident pattern are the times of detection, alerting and arrival of the fire brigade, the presence and use of (automatic) fire extinguishers and the presence and functionality of smoke detectors. In this chapter the main results of the search for fire causes and the role of consumer products in fires are given. The statistics of fire causes in several European and other Western countries are presented. The classification of fire causes varies in the different reports. To make a comparison between countries more or less possible, in this report the following fire causes are distinguished:
• intentional fire; • smoking; • cooking; • use of candles; • electric appliance; • use of a heating appliance; • imprudence; • playing with fire; • other.
These categories are not strictly exclusive. For example, a fire can be caused by imprudence during cooking. However, the majority of national fire statistics roughly use this classification, which is why this classification was chosen. First an overview of the statistics will be given, in which the numbers of fire causes per country are given for all domestic fires (§ 3.2.1) and fatal domestic fires (§ 3.2.2). After that, the circumstances and characteristics of each cause are further analyzed (§ 3.3).

Consumer fire safety: European statistics and potential fire safety measures
NETHERLANDS INSTITUTE FOR SAFETY NIBRA 15
3.2 Statistics of fire causes
In this paragraph an overview of fire statistics of several European and other Western countries is given. 3.2.1 General overview of domestic fires
Cause UK3 the
Netherlands4
US5 Australia6
Intentional fire 9% 11% 6% 3%
Smoking 57% 3% 2% 4%
Cooking 4% 26% 44%
Use of candles 17% 5% 4%
Electrical appliances 6% 3% 12%
Use of heating appliance 11% 3%
Imprudence
31%
Playing with fire 4% 2% 0%7 3%
Other 2% 27% 9%
Unknown 36% 29%
Table 1 Causes of all domestic fires per country
As can be seen in table 1, most of the domestic fires start in electrical appliances, cooking, and other causes, except for smoking in the UK. 3.2.2 Overview of fatal domestic fires
In table 2 an overview of fire causes in fatal domestic fires is given. Cause UK3 London8 NL9 Sweden Denmark US5 Australia New
Zealand Intentional fire 35,4% n.d.10 9% 8,3% 11,7%
Smoking 16,7% 47% 31% 29,8% 51% 7,8% 42% 13,1%
Cooking 5,6% 14% 9% 5,8% 2,2% 16,9%
Use of candles 5,8% 8% 3% 5,0% 9% 5,6% 7% 10,0%
Electrical appliances 7,6% 3% 21% 12,4% 4% 3,4% 14% 13,1%
Use of heating appliance
8% 3% 5,8% 3,4% 6,9%
Imprudence 18% 12% 2,5% n.d. 4,6%
Playing with fire 3,3% 3% 6% 0,0% 1,5% 5% 9,2%
Other 23,5% 17% 6% 0,0% 6,8% 13,9%
Unknown 1% 0% 30,6% 57,8% 7.7%
Table 2 Causes of fatal domestic fires
3 www.odpm.gov.uk 4 CBS, 2003 5 Residential Structure Fire Causes, 2006 6 Miller, 2005 7 0,4% 8 1996-2000 9 Kobes et al, 2009 10 n.d.: no data

Consumer fire safety: European statistics and potential fire safety measures
NETHERLANDS INSTITUTE FOR SAFETY NIBRA 16
As can be seen in table 2, most fatal domestic fires are caused by smoking. Except for New Zealand, this is by far the most occurring cause of fatal domestic fires. Other often occurring causes are cooking and the use of electrical appliances. Figure 3 shows the relation between the number of fires per cause and the number of fire deaths per cause, in the USA. Fires caused by cooking occur relatively often in the USA, but are not very fatal. Intentional fires and fires caused by smoking cause a relatively high number of casualties.
Causes US of fires, and in relation to deaths
0,0%
20,0%
40,0%
60,0%
Inte
ntiona
l fire
Sm
oking
Coo
king
Use
of c
andl
es
Elect
r. App
l.
Hea
ting
Playing
with
fire
Oth
er
Unk
nown
Cause
%
Fires
Deaths
Figure 3 Causes of domestic fires related to fire deaths in US
Causes of UK fires (2003) in relation to deaths
0,0%
20,0%
40,0%
60,0%
Smoking Cooking Use of
candles
Electrical
appliances
Use of
heating
appliance
Other Unknown
Cause
%
All fires fatal fires
Figure 4 Causes of domestic fires related fire deaths in UK

Consumer fire safety: European statistics and potential fire safety measures
NETHERLANDS INSTITUTE FOR SAFETY NIBRA 17
3.3 Causes of domestic fires
In this paragraph, a further explanation per fire cause is given. Intentionally caused fire and imprudence as fire cause are not further discussed. It is very hard to prevent intentionally causing of fire. Imprudence can be related to (some) other fire causes, such as cooking or smoking, and will be described in the paragraphs concerned. In this paragraph the characteristics of fires caused by smoking, cooking, use of candles, electrical appliances, heating appliances, imprudence and playing with fire are further analyzed. 3.3.1 Smoking
From all fatal fires, a third started by smoking cigarettes, cigars and other such products. From all unintentional fatal domestic fires in London, nearly 50% started with smoking. Of the victims of the fires caused by smoking in London, 60% of was over 60 years old. Of all fatal fires that started in the living room, bedroom or bedsitting-room (73% of all fatal domestic fires), 50% was caused by smoking [Holborn et al, 2003]. In many countries smoking is a major fire cause. In Denmark for example, 51% of the fatal domestic fire victims died in a fire which was caused by smoking. The increase of fatal domestic fires in Denmark (2003), is mainly brought about by smoking [Holborn et al, 2003]. Also in the UK the most common cause of fatal domestic fires is smoking (41% of the fatal fires). In this UK study the combination of smoking and ignition of upholstery and soft furnishing and bedding material appears as a fatal combination. [www.odpm.gov.uk] In Australia, Brennan [1999, cited in Holborn et al, 2003] found that smoking is the most common cause of fatal domestic fires. The same has been found in the USA [Hall, 2000, cited in Holborn et al, 2003]. In Canada smoking is the leading cause of fire-related fatalities. This is the same for the USA, where one of four fire deaths is caused by smoking-caused fire. A study by Baker [cited in Holborn et al, 2003 ] shows that cigarettes were the most important cause of fatal domestic fires in the USA. Smoking caused twice as many deaths as the second leading fire cause, which is intentional igniting. Runyan et al [cited in Holborn et al, 2003] observed that smoking appeared as the cause of fire five times more often in fatal domestic fires than in non-fatal domestic fires (USA). Holborn et al (2003) give an explanation why smoking is the most common (fatal) fire cause. The authors argue that cigarettes are a ready fire source, especially when cigarettes are not handled carefully or if they are disposed of incorrectly; cigarettes can smolder a long time unnoticed and then make the transition into a flaming fire. In general, smoking is the most common cause of fatal fires.
3.3.2 Use of electrical appliances
In the statistics of domestic fires in general, the use of electrical appliances is a major fire cause; in fatal fires however, the percentage of fire caused by the use of electrical appliances is smaller. Research into unintentional domestic fires in London showed that only 3% of the fires was caused by a defect of an electrical apparatus. Leth [cited in Holborn et al, 2003] claims that only 4% of the fatal domestic fires in Denmark is caused by technical faults.

Consumer fire safety: European statistics and potential fire safety measures
NETHERLANDS INSTITUTE FOR SAFETY NIBRA 18
In other studies however, for example that of Brennan [cited in Holborn et al, 2003] higher percentages are found for the amount of fires caused by electrical defects of appliances (in the state of Victoria, Australia). In the UK, according to Geering, this percentage is 8% [Holborn et al, 2003]. In the Netherlands about one person a year dies by a fire caused by short circuit of the electric installation in the domestic area [VROM, 2003], which is about 2% of all fatal domestic fire victims. Of all domestic fires in the USA, 7% is caused by electrical appliances; 15% of all electrical failure caused fires in domestic surroundings start in the bedroom [http://www.usfa.dhs.gov/statistics/national/residential.shtm]. In general fires caused by the use of electrical appliances most frequently start in the bedroom. The percentage and damage of fires caused by the use of electric appliances varies per country. For example, in the USA, fires caused by electrical failure create about 50% more damage than other fires; the number of deaths per 1.000 domestic fires is about 70% higher than the number of deaths per 1.000 domestic fires originating from other causes [FEMA, 2008]. As in fire statistics of other countries is found, also in the USA, fires cause by use of electrical appliances are caused more often by inappropriate use or incorrect installation than by technical failure [http://www.usfa.dhs.gov/statistics/national/residential.shtm]. The first ignited materials in fires caused by the use of electrical appliances mostly are building structural components, such as insulation, wall coverings and flooring. In 30% of these fires, the first ignited structural component is the insulation around electrical wires and cables. In 38% of the fatalities in all domestic fires, electrical wires and structural member/framing are the first ignited materials. See also figure 5.
US electrical fires, equipment involved in ignition
2003-2005
11%
24%
3%46%
4%
10%2%
Cord, plug Lamp, lighting
Power transfer Electrical wiring
Electrical distribution, power transfer Heating-related
Other equipment
Figure 5 Fires involving electrical equipment in the USA, 2003-2005
[FEMA, 2008]

Consumer fire safety: European statistics and potential fire safety measures
NETHERLANDS INSTITUTE FOR SAFETY NIBRA 19
Some sub-causes have been the focus of several research projects. In the following we give characteristics of fires caused by failure of electrical wiring systems, electric blankets, driers and TV-sets. Electrical wiring systems
In the USA, in fire deaths involving electrical equipment, failure of electrical wire systems is the leading cause. It claims 350 lives each year. These fires are caused by wearing out of older wiring systems; connecting modern appliances such as microwave ovens and electric heaters to old wiring systems; overheating of electrical components and wearing out of insulation, which causes short circuits. Short circuits are the main cause of fires starting in electrical wiring systems11. Electric blankets
From the fires caused by electrical malfunction in the UK between 1996 and 2000 (8% of all fatal domestic fires), half was caused by failure of electric blankets [Holborn et al, 2003]. This corresponds to about 5.000 fires and 20 annual fatalities because of old and damaged electric blankets. In the USA, over the period 1992-2002 more than 35.000 fires were caused by failure of electric blankets, causing more than 40 deaths [Miller, 2005]. Electric blankets mostly cause fire because many old blankets are worn, with technical damage and deterioration of the heating element and wiring as a consequence. Also, the flexible nature of these blankets may cause damage by wrong use of the ties. In that case, the electrical wiring within the blankets suffers high levels of mechanical stress when used over a long period of time. Another reason why electric blankets can cause fire is that consumers don't use the blanket appropriately, for example folding up the blanket when it is not used. Another reason is that blankets produced before 1990 do not have an adequate overheating protection, which can lead to ignition in some cases [DTI, 1999], especially when blankets are left under layers of bedding [Miller, 2005]. In 1999, the Government Consumer Safety Research of the Department of Trade and Industry (UK) investigated fires caused by electric blankets. In time the number of fatalities by fires caused by electric blankets has been decreasing. In 1985 over 2.000 fires (for which the Fire Brigade was called) were caused by failure of electric blankets. In 1996 this number had decreased to 816 fires. From the Crime Survey Statistics, it is clear that about 5.000 fires caused by electric blanket failure occurred for which the Fire Brigade was not called upon; these fires were dealt with within the home. The number of fatal victims of fires caused by electric blanket failure decreased from 32 in 1985 to 19 in 1996: a decrease of 40%. In more than 99% of all fires caused by failure of electric blankets, blankets involved were more than 10 years old [DTI, 1999]. In New Zealand, the majority of the victims of fires originating from electric blanket failure was disabled in some way or other and/or had a bad medical condition [Miller, 2005]. Almost all fires occurred in the bedroom. A majority of these fires were caused by misuse of the electric blanket.
11 http://www.cpsc.gov/CPSCPUB/PREREL/PRHTML96/96129.html
Consumer fire safety: European statistics and potential fire safety measures
NETHERLANDS INSTITUTE FOR SAFETY NIBRA 20
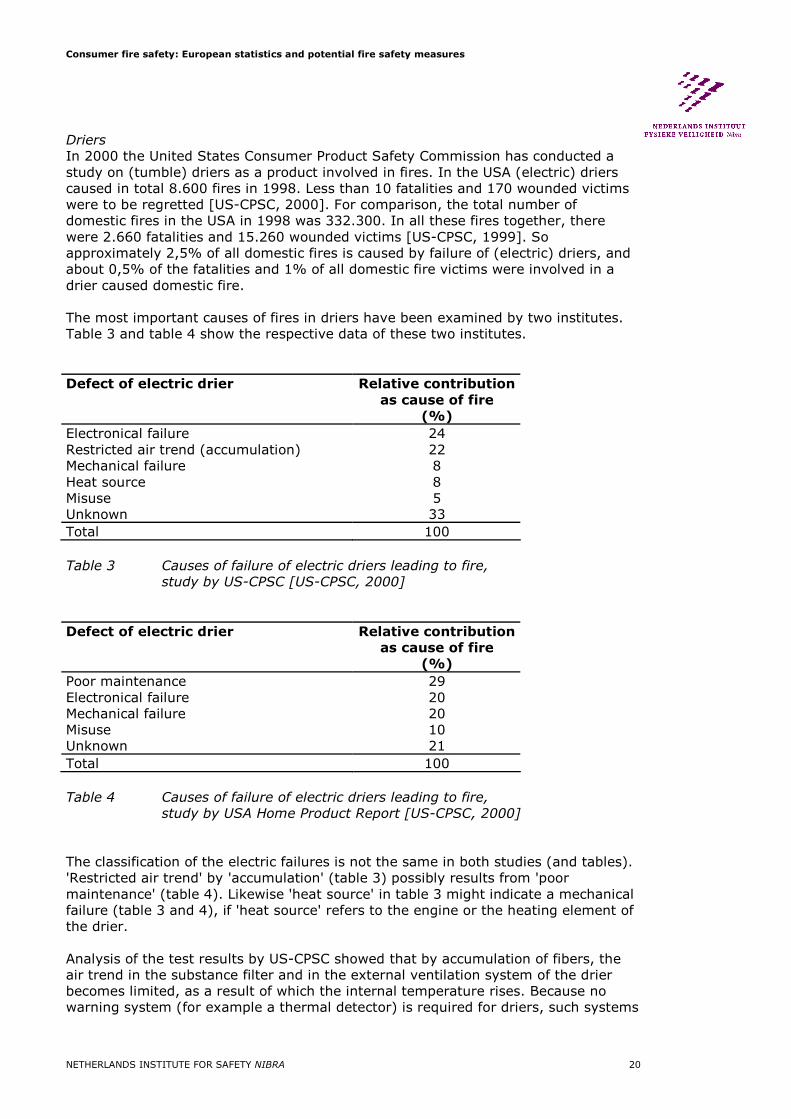
Driers
In 2000 the United States Consumer Product Safety Commission has conducted a study on (tumble) driers as a product involved in fires. In the USA (electric) driers caused in total 8.600 fires in 1998. Less than 10 fatalities and 170 wounded victims were to be regretted [US-CPSC, 2000]. For comparison, the total number of domestic fires in the USA in 1998 was 332.300. In all these fires together, there were 2.660 fatalities and 15.260 wounded victims [US-CPSC, 1999]. So approximately 2,5% of all domestic fires is caused by failure of (electric) driers, and about 0,5% of the fatalities and 1% of all domestic fire victims were involved in a drier caused domestic fire. The most important causes of fires in driers have been examined by two institutes. Table 3 and table 4 show the respective data of these two institutes.
Defect of electric drier Relative contribution
as cause of fire
(%)
Electronical failure 24 Restricted air trend (accumulation) 22 Mechanical failure 8 Heat source 8 Misuse 5 Unknown 33
Total 100
Table 3 Causes of failure of electric driers leading to fire,
study by US-CPSC [US-CPSC, 2000]
Defect of electric drier Relative contribution
as cause of fire
(%)
Poor maintenance 29 Electronical failure 20 Mechanical failure 20 Misuse 10 Unknown 21
Total 100
Table 4 Causes of failure of electric driers leading to fire,
study by USA Home Product Report [US-CPSC, 2000]
The classification of the electric failures is not the same in both studies (and tables). 'Restricted air trend' by 'accumulation' (table 3) possibly results from 'poor maintenance' (table 4). Likewise 'heat source' in table 3 might indicate a mechanical failure (table 3 and 4), if 'heat source' refers to the engine or the heating element of the drier. Analysis of the test results by US-CPSC showed that by accumulation of fibers, the air trend in the substance filter and in the external ventilation system of the drier becomes limited, as a result of which the internal temperature rises. Because no warning system (for example a thermal detector) is required for driers, such systems

Consumer fire safety: European statistics and potential fire safety measures
NETHERLANDS INSTITUTE FOR SAFETY NIBRA 21
are not introduced in most of the driers; therefore, most driers will not stop automatically when the temperature rises too much and affects the electric components, allowing the drier to ignite. A restricted air trend, particularly one caused by accumulation of substance fibers, for this reason is considered to be the most important fire cause in driers. Another possible fire cause in driers is a failure of the operating engine of the drier drum [US-CPSC, 2000]. The findings of the research of US-CPSC mainly agree with the findings from a study into driers in the Netherlands, which has been carried out in 2004 by the Dutch Food and Consumer Product Safety Authority (VWA). This authority conducted the research based on interviews with experience experts and performed experiments with undamaged driers. Amongst other results, the majority of the experts suspected accumulation of substance fibers in combination with electric components and heat advancement, to be the most important cause of fire in electric driers [VWA, 2004]. Televisions
In the EU (in total) about 16 deaths and 197 injuries result from TV fires, according to the report 'TV fires Europe' [Department of Trade and Industry (DTI), UK, 1996] This number is an estimated number, because not all European countries register the number of TV fires. In Denmark, on average 1,25 fatal TV fires per year occur, which corresponds to 0,31 deaths per million televisions per year. In France there are about 330 TV fires per year; 38 of these fires lead to (non-fatal) injuries and about two persons per year die because of a TV fire. In Germany there are also (based on estimation) about two to four fatalities caused by TV fires a year. In the Netherlands about 1,1% of all domestic fires started in televisions. Of all fires in electrical appliances, fires in TV sets are the second cause in the Netherlands, after fires starting in washers and dryers. In Portugal, less than one person per year dies from a TV fire. In Sweden, this number is about one person per year. In Italy, the number of fatal injuries is negligible. (All data from [DTI, 1996]). In the UK, 2% of all domestic fires and 4% of all fatalities in domestic fires with an electrical cause start in televisions. Of all groups of electrical appliances, televisions cause the smallest number of fatalities when on fire. Electric cookers, heaters, blankets and electric wiring cause far more fatalities in the UK. The number of television fires decreased from 1983 (1.300 fires) until 1993 (400 fires). After 1993, the number increased again. The increase since 1993 is explained by the increase of television ownership (more than one television per household) and longer keeping of old televisions. Another part of the increase can be explained by another way of research12 [DTI, 1996]. In the USA, the amount of TV fire incidents per million TV sets is about 280% smaller than in the UK. Explanations of this difference are the materials used for producing televisions (which in the USA are less easily to ignite), the use of fire retardants in the USA and because of the fact that in the USA, televisions are mostly placed in shelving units or cabinets. In the UK, televisions are mostly placed independently in the room, leaving more possibilities to put a candle or night light on top of or in the surroundings of the television. [DTI, 1996]
12 For more information, see 'TV Fires Europe', DTI, 1996

Consumer fire safety: European statistics and potential fire safety measures
NETHERLANDS INSTITUTE FOR SAFETY NIBRA 22
Concluding, it is notable that televisions are the cause of domestic fires in European countries, but in these fires, a relatively small number of people are injured or killed. The majority of the TV fires is caused by faults within the appliance (87%). Overheating (4%) and leaving the power on (3%) are other causes of TV fires. Another cause of TV fires is of a non-electrical nature, being an external heat source, such as a burning candle placed in the vicinity of a television. In Finland, about 40% of all television fires are caused by an external source [DTI, 2001]. Research from the Market Surveillance Board of Danish Electrical Equipment Control Office showed that TV sets after ignition burn quite fiercely, which can lead to much damage in the domestic surroundings. [DTI, 2001] TV fires in the UK occur in televisions of all ages. About 80% of the fires occur within 10 years after purchase, and 50% even within the first five years. Most TV fires occur in December and January, especially in the evening and afternoon. TV fires occur 50% more often in terraced properties and flats than in detached of semi-detached properties. Most TV fires (71%) occur in the living room, 22% in the bedroom [DTI, 2001]. 3.3.3 Cooking
In most countries, cooking is one of the major fire causes. Fires caused by cooking occur by misuse of cooking appliances, poor maintenance and inadequate supervision. Especially in the UK, were cooking food in hot fat or oil is popular, a lot of chip pan fires occur. In 1998 this was the most common source of all domestic fires. Other risks are aluminum pots, which may melt when exposed to a high increase of heat and subsequently spread ignited material. An overheated or neglected oven is a third cause of cooking fires [Miller, 2005]. In Australia, 51% of all domestic fires (fatal and non-fatal) start in the kitchen, mostly (43% of all fires) during cooking. 23% of the Australian parents admit that they allow their children (5-15 years old) to cook without supervision [http://www.aami.com.au/Resources/File.aspx?id=83]. In figure 6 an overview of ignition sources in cooking fires in New Zealand 1997-2003 is given. 93% of the fires is caused by food left cooking on stove tops or ovens. There were 2,5 times as much male victims as female victims; 18,5% of the victims were children (all having parents with a history of alcohol consumption) [Miller, 2005]. In New Zealand, unattended cooking was involved in many if the fatal fires (54,4%), combined with alcohol consumption [Miller, 2005].

Consumer fire safety: European statistics and potential fire safety measures
NETHERLANDS INSTITUTE FOR SAFETY NIBRA 23
Ignition source of cooking fires in New Zealand
93%
7%
Food left cooking on stove tops or ovens Misuse of appliances
Figure 6 Ignition source of cooking fires in New Zealand, 1997-2003 [Miller,
2005]
3.3.4 Candles
Candle fires mostly result from incorrect use of candles, leaving candles to burn unattended and poor manufacture of the candle. In London, 8% of all unintentional domestic fires in 2004 was caused by candles. A similar result was found in Denmark, where 9% of all unintentional domestic fires in the period 1996-2000 was caused by candles. In Victoria (Australia), this number was 7% [Holborn et all, 2003]. Although these three statistics seem to correspond, opposite results are found in other statistics and research data. The research of Geering [cited in Holborn et al, 2003] showed that only 2% of the fatal fires in the UK in 1994 and 1995 were caused by candles. The number of fires caused by candles has been increasing since several years, mainly because of the increase of candle sale. In 1998, about 3% of all domestic fires in the UK was caused by candles. In the Netherlands the number of fires caused by candles, related to the number of inhabitants and the number of candles sold, is much lower than in the UK [DTI, 2000a]. Another difference is found in the numbers of fires caused by placing a candle directly on top of an electrical appliance casing, for example of a television. These fire causes are less common in Japan and the USA, because televisions in these countries contain a halogen additive, which makes it almost impossible to ignite the appliance. In Europe these halogen additives are not used because of environment policies [Holborn et al, 2003]. In the USA the National Fire Protection Association investigated domestic candle fires. In 2002, 130 persons died and 1.350 persons got injured because of domestic fires caused by candles. The number of fatalities decreased from 1980 until 1990, but from 1991 until 2001 the number increased every year with, in total, 300%. While the number of candle fires increased, the total number of domestic fires in general decreased in this period of time. In 2001 and 2002, 5% of all domestic fires was caused by candles; in the period 1980 until 1993, this number was only 1%.

Consumer fire safety: European statistics and potential fire safety measures
NETHERLANDS INSTITUTE FOR SAFETY NIBRA 24
Of the candle fires in the USA in the period 2002-2005, 40% started in the bedroom; 30% of the victims of these fires died. 17% of the candle fires started in the living room and caused 36% of the candle fire fatalities. Most of the fatal victims (27%) died in a fire in which a mattress or bedding was the first item ignited. In December the number of victims was twice as high as in other months. In table 5 the causes of candle fires in the USA in the period 2002-2005 are shown. Cause of candle fire Percentage
Person fell asleep leaving the candle burn 25 Material was left or came too close to the candle 50 Candles were left unattended 18% Playing with candles (usually children) 5% Unknown 2%
Table 5 Cause of candle fires in the USA, 2002-2005 [Home Candle Fires,
NFPA, 2005]. Of all fatal domestic fires in 2008 in the Netherlands, only one fire (2%) was caused by candles [Kobes et al, 2009].
3.3.5 Children playing with fire
About 3% of the fatal domestic fires in London between 1996 and 2000 were caused by children playing with fire. A similar result was found in the Netherlands: 4% of all fatal domestic fires in 2008 [Kobes et al, 2009]. The relatively small number of fires caused by playing children was confirmed by Brennan [cited in Holborn et al, 2003] and Geering [cited in Holborn et al, 2003]. Although only a small amount of the fatal domestic fires is started by children playing with fire, the impact of these particular fires is, in general, much larger because the victims often are very young. For example, in London this type of fire is the major cause of death for children between 0 and 4 years old [Holborn et al, 2003]. In the USA, the number of fires started by playing children is declining. Of all fatalities in fires caused by playing with fire in the USA in 2006, 63% of the victims is younger than five years old [Flynn, 2009]. In New Zealand, 92% of the victims of fires caused by playing with fire are children under the age of 5 [Miller, 2005]. The children who are the victim of these fires are not necessary the children causing the fire (by playing). For example, 12% of the fatal victims of this type of fire in the USA was 2 years old, whereas only 3% of these fires was set by 2 year old children [Flynn, 2009]. See also figure 7.

Consumer fire safety: European statistics and potential fire safety measures
NETHERLANDS INSTITUTE FOR SAFETY NIBRA 25
Figure 7 Deaths by age of the fire setter and the age of the victim, 2003-2006
annual averages in the USA [Source: Flynn 2009]
Of all injured victims in the USA, 38% was between 21 and 39 years old. Non-fatal injuries especially concern parents and caretakers. In the USA, in 80% of all of these fires, the children playing with fire were boys. In the fatal fires, a small majority of the children playing with fire were boys [Flynn, 2009]. Most of the fires caused by children playing with fire start in the bedroom [Miller, 2005]. Most child-playing fires start by playing with lighters or matches. First ignited products mostly were mattresses or bedding (25% of the fires, 44% of the fatalities) and clothing. Papers, upholstered furniture (5% of the fires, 19% of the deaths) and vehicle seats also are regular materials to be ignited first. In the USA, 42% of the child-playing domestic fires begin in the bedroom. Most of the child-playing domestic fires occur in the weekends, most of the fires occur in the afternoon; most of the fires occur in the months of January and July. [Flynn, 2009]
3.3.6 Heating
The domestic heating system can cause fire risks in several ways. Especially open or solid fuel fires can cause fire due to the presence of naked flames [Miller, 2005]. In New Zealand, except for one, all fires caused by heating between 1997 and 2003 started in electrical heaters. In the majority of these fires, furniture of bedding was placed to close to a heater [Miller, 2005]. In the USA, 73% of all fatal heating fires was caused by stationary or portable space heaters (including wood stoves). Space heaters cause a much higher risk than central heating. The most common factor for heating fires are a lack of cleaning (60% of all heating fires) and putting combustibles too close to the heat source (28% of the fires, 36% of the fatalities). Research in the USA showed that there is no significant difference between different fuel types or power options within central heating [Hall, 2009].

Consumer fire safety: European statistics and potential fire safety measures
NETHERLANDS INSTITUTE FOR SAFETY NIBRA 26
3.3.7 Conclusion
Fire causes can be subdivided in several manners. It is possible to subdivide on the basis of a product or activity (candles, cooking), or on the basis of human behavior or technical failure (imprudence, short circuit etc.). Fire caused by human behavior occurs more often than technical failure caused fires. Sometimes it is hard to distinguish whether a fire cause is the consequence of human behavior or of a technical failure. Because of this, and because of the different fire cause classification used in different countries, in this chapter we discerned the five most common fire causes based on behavior or product: smoking, use of candles, electrical appliance, heating appliance, and playing with fire. Smoking is the most common cause of domestic fires. Cooking is the second main cause.
3.4 Accident patterns
Not only knowledge of the causes of fire, but also knowledge of the characteristics of the fire itself and its surroundings is necessary in order to be able to take proper regulatory measures. In this paragraph the object of origin and the materials involved, the room in which the fire ignited, the moment the fire started, the fire expansion, the cause of death of the victims, the main victim characteristics, the self-efficacy of the victims and the presence of fire extinguishers and smoke detectors are analysed.
3.4.1 Object of origin
The object in which a domestic fire starts is, in many cases, furniture, beds and mattresses or electrical appliance. In London, in the period 1996-2000, in 20% of the fatal fires, furniture was the object of origin. In 23% of the fires, this where beds or mattress, 16% were clothing, and 41% were other, not specified objects [Holborn et all., 2003]. In the Netherlands, the object of origin of fatal fires in 2008 is researched. See table 6. Object Percentage
of fatal
domestic
fires13
Furniture 29% Beds/mattress 10% Electrical appliance 30% Extention wire 7% Heating 7% Clothing 0% Other 17% Unknown 0%
Table 6 Object of origin of fatal domestic fires in 2008 in the Netherlands.
13 Kobes et al, 2009

Consumer fire safety: European statistics and potential fire safety measures
NETHERLANDS INSTITUTE FOR SAFETY NIBRA 27
First material involved
16
14
12
654
23
20
Clothing
Unknown
Other
Paper or cardboard
Waste material and
rubbish
Cooking or vegetable oil
Bedclothes
Furniture (upholstered)
Figure 8 First material involved in (start of) domestic fire [Holborn et al, 2003]
As seen in table 5 and figure 8, objects and materials of origin of domestic fires mostly concern furniture/bedclothes and electric appliances. In paragraph 3.3.2 fires caused by electric appliances have been described. In this paragraph we focus on upholstered furniture. Upholstered furniture
From 2002 to 2004, in the USA, 50% of the fatal and 32% of the non-fatal domestic fires in which upholstered furniture and mattresses were the items first ignited, had smoking materials as the ignition source14. In total this involved:
• 5.500 fires; • 460 deaths; • 730 injuries; • $ 146 million property damage.
In the beginning of the sixties in Western countries the old-fashioned furniture, based on moquette lining and fillings of horse hair and coconut fibre, was replaced by furniture containing polyurethane foam and synthetic covers. These 'new' materials ignite more easily, burn much more rapidly and produce more smoke than the old-fashioned material. In the period from 1962 to 1982, the number of fires involving upholstered furniture in the UK increased proportionally with the number of domestic fires. The increase of the number of victims of fires involving upholstered furniture however, increased much more than number of victims of domestic fires in general. In 1962, before the large scale use of polyurethane foams and synthetic covers in furniture, in 7% of all domestic fires upholstered furniture was involved, and these fires caused 6% of all fatal domestic fire victims. In 1982, in 6% of all domestic fires this type of furniture was involved, but now this type of fire caused 21% of all fatal domestic fire victims. In 1987, fire fighters in Europe estimated that the involvement of upholstered furniture in domestic fires played an important role in almost 50% of all fatalities in domestic fires [ACFSE, 2001].
14 http://www.cpsc.gov/LIBRARY/FOIA/foia08/os/ahfa1.pdf

Consumer fire safety: European statistics and potential fire safety measures
NETHERLANDS INSTITUTE FOR SAFETY NIBRA 28
The influence of upholstered furniture on the effect of domestic fires is confirmed by a survey research in which 300 European fire fighter commanders were interviewed. 77% of the respondents confirmed that furniture containing polyurethane foam is a major cause of the increased produce of smoke and toxic gases in domestic fires [ACFSE, 2001]. This is why the Alliance for Consumer Fire Safety in Europe (ACFSE) published a joint statement, which declares that the introduction of controls on the ignitability and fire performance of foam filled furniture throughout Europe would produce major benefits and would complement existing efforts on fire safety. The ACFSE urges the European Commission to take initiatives to achieve this goal. \ The ACFSE also states that between 1.000 and 1.500 lives can be saved and 10.000-15.000 injuries can be prevented per year in Europe, by taking the right initiatives [ACFSE, 2007]. Figure 9 is a result of a Dutch study of fatal domestic fires in 2008 in the Netherlands. Fire fighters involved in a fatal domestic fire were asked to name the factors that accelerated the fire. The most given answer was upholstered furniture [Kobes et al, 2009].
Factor of fire speed
01234567
Uphols
tere
d
furn
iture
Waste
mate
rial
and r
ubbis
h
Fla
mm
able
of
vola
tile
substa
nce
Oxig
en/A
ir
Pla
stics
Wood
Gas
Unknow
n
Factor
Nu
mb
er
of
fata
l fi
res
Figure 9 Factor enhancing fire in fatal domestic fires, according to fire fighters
in the Netherlands [Kobes et al., 2009]
The respondents were asked about the smoke development at the moment when the fire brigade arrived. When the volume of smoke at the moment of arrival was reported to be large, respondents were asked about their opinion of the factor causing this large volume. The factors mentioned the most were plastics and foams/textiles. See also figure 10.

Consumer fire safety: European statistics and potential fire safety measures
NETHERLANDS INSTITUTE FOR SAFETY NIBRA 29
Factor of smoke development
0
2
4
6
8
10
Pla
stics
Uphols
tere
d
furn
iture
/textile
Wood a
nd
paper
Roofing
Liq
uid
s
Car
Factor
Nu
mb
er
of
fire
s
Figure 10 Factor enhancing smoke development in fatal domestic fires, according
to fire fighters in the Netherlands [Kobes et al., 2009]
Holborn et al. (2003) analyzed the relation between the ignition source and the first material involved in domestic fires. By far, most of all fatal domestic fires in London were started by cigarettes, cigars or the like; with bedclothes or (upholstered) furniture as first material involved in the fire. A similar conclusion was drawn by Kobes et al. (2009): in all fatal domestic fires in the Netherlands in 2008 in which cigarettes, cigars or the like were the ignition source, the first material involved in the fire was furniture or bedclothes. In the USA, 51% of all fatalities in domestic fires in which upholstered furniture was ignited, were caused by smoking [Ahrens, 2008a]. In the USA, the number of this kind fires decreases, but upholstered furniture still remains the major item first ignited in domestic fires. Candles, matches or lighters are the second cause of domestic fires starting in upholstered furniture [Ahrens, 2008a]. 3.4.2 Room of origin
In general, most domestic fires begin in the living room and bedroom, but this varies per country. For example in Australia, a lot of domestic fires start in the kitchen. The room of origin of domestic fires in three countries is shown in figure 11.

Consumer fire safety: European statistics and potential fire safety measures
NETHERLANDS INSTITUTE FOR SAFETY NIBRA 30
Room in which fire originated
0%
20%
40%
60%
Living room Bedroom Kitchen Hallway Garage/shed
Room
%
London 1996 & 2000 Australia 2000 New Zealand 1996-2003 Netherlands 2009
Figure 11 Room in which fire originated [Holborn et all, 2003;AAMl, 2007; Miller,
2005; Kobes et all. 2009]
Research in New Zealand [Miller, 2005] showed that 44,6% of the victims were in the room in which the fire started. In 53,8% of the cases, the victim was in another room. In 1,5% of the cases, the victim was outside of the house when the fire stated. 3.4.3 Main victim characteristics
In general, most victims of fatal domestic fires are male. Research in the Netherlands [Kobes et al, 2009] and New Zealand [Miller, 2005] showed that about 60% of the fatalities in domestic fires is male (59% in the Netherlands, 62,6% in New Zealand). In several international studies it was found that especially young persons from 0 to 15 years old (for example 32,1% of all fatalities in domestic fires in New Zealand) and elderly above 60 years (25,9% in New Zealand) are victims of fatal fires [Miller, 2005]. In the Netherlands, single persons represented the vast majority of the victims in the fatal domestic fire statistics of 2008 [Kobes et al, 2009].
3.4.4 Fire expansion
In Australia, 89% of the domestic fires are confined to the room where the fire started. In some cases the fire spread to one or more other rooms. About 6% of the domestic fires cause a destruction of the entire house in 2000 [AAMI, 2007]. 3.4.5 Time of fire
Time
The majority of the fatal domestic fires occurs when people sleep, at night. In Australia most domestic fires in 2006 occurred on Sunday between 4 pm and 8 pm. About 20% started in the early evening [AAMI, 2007]. Statistics of fatal domestic fires in the USA and Canada in 2006 show that more than half of all victims die in fires between 11 pm and 7 am. Of all domestic fires, only 20% occurs at night.

Consumer fire safety: European statistics and potential fire safety measures
NETHERLANDS INSTITUTE FOR SAFETY NIBRA 31
This indicates that the period of the day in which the fire starts is a variable influencing fatality [data of NFPA retrieved from http://ejcross.com/2007/10/08/fire-safety-tips-and-statistics/] The same conclusion was drawn in research in New Zealand [Miller, 2005] and the Netherlands [Kobes et al, 2009].
Time of fatal fires Australia
6%7%
20%
25%
28%
14%
0-4 4-8 am 8-12 am 12-16 am 16-20 20-24
Figure 12 Time of (start of) fatal fires in Australia [AAMI, 2007]
Day of the week
Most fire deaths and domestic fires in general occur on Saturdays and Sundays. This is shown in studies in the USA and Canada15, New Zealand [Miller, 2005], the Netherlands [Kobes et al, 2009] and other countries. See also figure 13.
0%
5%
10%
15%
20%
25%
30%
Mon
day
Tuesd
ay
Wedn
esda
y
Thurs
day
Friday
Sat
urda
y
Sun
day
Australia (AAMI doc.
Fire screen) all home
fires
New Zealand (fire
research report)
NIFV (2008)
Figure 13 Day of the week fatal domestic fires occur [Miller, 2005]
15 NFPA: http://ejcross.com/2007/10/08/fire-safety-tips-and-statistics/

Consumer fire safety: European statistics and potential fire safety measures
NETHERLANDS INSTITUTE FOR SAFETY NIBRA 32
Month
In December and January, the most fatal domestic fires occur in the USA and Canada [http://ejcross.com/2007/10/08/fire-safety-tips-and-statistics/]. In New Zealand, most fatal fires occur in February and May; the month with the lowest number of fatalities is December. In New Zealand, the occurrence of fires is equally spread over the seasons [Miller, 2005]. In the Netherlands, most fires occur in April, December and January [Kobes et al., 2009]. Worldwide there doesn't seem to be a month or season in which most domestic fires occur. 3.4.5 Cause of death
Victims of fires die as the result of burns, the inhalation of smoke or a combination of both. Most victims die because of inhalation of smoke. In fatal fires in London in 1996-2000 , 42% of the fatal victims died because of smoke inhalation. In Scotland, this was 60%. Another 17% died because of burns, and 16% because of a combination of smoke inhalation and burns [www.odmp.gov.uk]. In the fatal domestic fires in 2008 in the Netherlands, the majority of the fatal victims also died as a consequence of smoke inhalation [Kobes et al., 2009]. From research of the Handford Fire Department (USA) [http://www.hanford.gov/fire] similar results were obtained: 25% of the fatal victims died from burns and 70% as the result of poisonousgas inhalation produced by the smoke. In New Zealand and the Netherlands as well, the primary cause of death in domestic fires was smoke inhalation and carbon monoxide poisoning [Miller, 2005; Kobes et al., 2009].
Cause of death (London)
42%
19%
25%
7%
7%
Smoke inhalation
Burns
Smoke inhalation and
burns
Other
Not specified
Figure 14 Cause of death in domestic fires in London , 1996-2000 [Holborn et
al., 2003]
3.4.6 Low alertness
Another important characteristic of fatal domestic fires is the lack of alertness of the victims. Low alertness can, amongst other causes, be caused by illness, infirmity, age, alcohol, drugs and medication. Research in New Zealand showed that a significant number of fatal domestic fire victims (38,8%) had pre-existing health conditions that probably negatively affected the abilities to escape. Also, a high number of victims had a blood alcohol level above the legal driving limit [Miller, 2005].

Consumer fire safety: European statistics and potential fire safety measures
NETHERLANDS INSTITUTE FOR SAFETY NIBRA 33
In the Netherlands, in all fatal domestic fires (in which the smoke detector operated properly) the victim had impaired mobility [Kobes et al, 2009]. The influence of alcohol and drugs or medicines will be further analyzed below. Alcohol
From research into unintentional domestic fire victims in London, it appeared that of the victims tested on alcohol in 1996 and 2000, 40% had blood alcohol concentrations in excess of 80 mg/100 ml16. From the total number of victims 24% were highly intoxicated by alcohol [Holborn et al., 2003]. See figure 15. A study in the Netherlands of fatal domestic fires in 2008 showed that alcohol is one of the factors influencing fatality in domestic fires [Kobes et al., 2009]. Canadian research established that the fatality risk in domestic fires for alcoholics is 9,7 times higher than for non-alcoholusers. Besides from causing impaired cognition and behavioral effects such as an increase of risk taking, the use of alcohol causes physiological effects, such as an inhibition of the choke response. For example: 39,2% of all fatal victims wasn't aware of the fire in time, but of all victims affected by alcohol consumption, 54,1% wasn't aware of the fire in time. Alcohol lowers the possibility to be aware of and estimate a fire situation [Miller, 2005].
Alcohol concentration of blood victims
50%
10%
16%
24% No alcohol
Below limit (<80 mg)
Intoxicated (80-200 mg)
Highly intoxicated (>200
mg)
Figure 15 Blood alcohol concentration of fatal victims London 1996-2000
[Holborn et all., 2003]
Drugs and medication
Use of cannabis, amphetamines, opiates and other drugs have an influence on the physical and cognitive capabilities of human beings. Drugs influence the possibilities to observe, assess and react on the fire [Miller, 2005]. In London, in 1996 and 2000, 6% of the victims of fatal domestic fires were noted to have been under the influence of drugs or medicines at the time of the fire [Holborn et al, 2003].
3.4.7 Smoke detectors
Research has been done into the presence of smoke detectors and their influence on (fatal) domestic fires. In the majority of fatal domestic fires in Scotland since 1994 (until 2003), no or a non-operating smoke detector was present. 33% of all domestic fire fatalities occurred in a house in which a non-operating smoke detector was present. In the
16 The legal limit for driving in the UK

Consumer fire safety: European statistics and potential fire safety measures
NETHERLANDS INSTITUTE FOR SAFETY NIBRA 34
houses of another 33% of all domestic fatal fire victims there was no smoke detector at all [Scottish Executive, 2004]. In New Zealand the presence of a smoke alarm/detector in fatal fire incidents was analyzed; this resulted in table 6. In a majority of the fatal fires (60,6%), no smoke alarm was installed. In only 16,5% of the fires a smoke detector was installed and functioning [Miller, 2005]. In Australia, 93% of the houses is equipped with at least one smoke detector. In a survey, 10% of the inhabitants admitted they do not regularly verify whether the smoke detector works well [AAMI, 2007].
Smoke detector
Presence and performance
Netherlands17 Ontario
(Canada)18
New Zealand19
Alarm installed and operative
4,5% 39% 16,5%
Alarm installed but disabled or inoperative
6,8% 21% 8,3%
No alarm installed
45% 26% 60,6%
No information available about (operative) smoke alarm
43% 14% 14,7%
Table 7 Presence and performance of smoke detectors in fatal domestic fires in
the Netherlands, Ontario (Canada) and New Zealand [Miller, 2005].
In Ontario, the reason why the smoke alarm did not operate has been investigated. In 32% of the fires, no battery (27%) or power (15%) was present. In another 34%, the detector was located too far from the fires. 5% was due to a possible failure of the unit, 2% to improper installation, another 2% of the smoke detectors was tampered with (vandalism) and 10% was caused by another reason. In 14% of the cases the reason why the smoke detector didn't function was undetermined. 3.4.8 Fire extinguishers
Having an operative smoke alarm installed is one thing; without a fire extinguisher it is almost impossible to extinguish small fires. Of the Australian citizens questioned by the AAMI, 21% admitted not to know how to use a fire extinguisher in case of a fire in the house. Research of AAMI showed that, although 26% of the population experienced a domestic fire, 65% of the Australians doesn't have a fire extinguisher in their home. 78% of the Australians does not own a fire blanket and 5-11% does not have any fire safety equipment at home at all [AAMI, 2007]. In the fatal domestic fires in the Netherlands in 2008, in 11% of the cases a fire extinguisher was used [Kobes et al., 2009].
17 Kobes et al, 2009 18 Ontario Smoke Alarm StatUSA in Domestic fires 2003 to 2007. The average of the years 2003-2007 has been taken 19 Miller, 2005

Consumer fire safety: European statistics and potential fire safety measures
NETHERLANDS INSTITUTE FOR SAFETY NIBRA 35
3.5 Conclusions
To prevent injuries and fatalities it is necessary to have information on the causes of fatal fires in European countries. However, these data are not readily available: it was difficult to get an overview of fire causes in general, and, logically, even harder to get insight in the fire causes of fatal domestic fires specifically. Nevertheless, some conclusions can be drawn. Smoking and cooking, in combination with the presence of upholstered furniture and textile are the most common cause and accident pattern in fatal domestic fires. Most fatal domestic fires occur in the weekends and especially at night; which is as expected, as more people will be at home in the weekend and nights as compared to their presence at daytime and working days. Men, children and elderly people are the most common victims of these fatal fires. A low level of self efficacy was found for a significant number of the fatal domestic fire victims. Alcohol use is a another major aspect of fatal domestic fires. Most fires occur in the living room or bedroom, in (upholstered) furniture, textile, technical appliances or clothing.

Consumer fire safety: European statistics and potential fire safety measures
NETHERLANDS INSTITUTE FOR SAFETY NIBRA 36
4 Assessment of fire safety measures
4.1 Introduction
There are varioustypes of fire safety measures that can be used to improve domestic fire safety. Roughly, the safety measures can be grouped into four groups (influence factors) [Runyan, 1998], namely measures that influence20:
• the host / human factors (such as education and safety instructions); • the agent of energy / product factors (such as inflammability of consumer
products); • the physical environment (such as availability of fire extinguishers); • the social environment (such as passage and enforcement of safety laws).
The safety measures can have influence in three event phases of a fire, namely:
• the pre-event phase (prevention measures); • the event (reduction measures); • the post event phase (reduction measures).
The four groups of influencing factors and the event phases can be combined in an assessment matrix, the 'Haddon Matrix' [Runyan, 1998;20]. When the intersections of influence factors and event phases (the cells of the matrix) are filled with a risk factor or a potential intervention strategy, it is possible to make an inventory of promising safety measures. Interventions that address multiple levels are most effective for injury (of fatality) prevention. An example of the use of the Haddon Matrix is given in figure 16.
Figure 16 Example of the use of the Haddon matrix21
20 http://www.ihs.gov/medicalprograms/portlandinjury/Worddocs/Getting%20Started/Haddon%20Matrix/ HaddonMatrixBasics.pdf 21 http://www.ihs.gov/medicalprograms/portlandinjury/Worddocs/Getting%20Started/Haddon%20Matrix/ CompletedHaddonMatrixFire.pdf

Consumer fire safety: European statistics and potential fire safety measures
NETHERLANDS INSTITUTE FOR SAFETY NIBRA 37
Based on the Haddon Matrix the NIFV developed a 'Risk and Measure Assessment Matrix'. The (empty) matrix is presented in figure 17. Risk factors Fire safety measure
Host
(human)
Agent
(consumer product)
Physical environment
(building)
Figure 17 Risk and Measure Assessment Matrix
The most important risk factors of consumer products in domestic fires have been discussed in paragraph 3.3 ('causes of domestic fires') and 3.4 ('accident patterns'). The most important risk factors concerning the host are the use of alcohol, age (young and elderly persons), being asleep and impaired mobility. The most important risk factors concerning the 'agent of energy' are smoking, cooking and ignition of upholstered furniture. Looking at the physical environment, the most important risk (reducing) factors are the presence and functionality of smoke detectors and fire extinguishers. In paragraph 4.2 an overview is given of intervention strategies intended to positively influence fire safety. Intervention strategies have to be effective in order to achieve goals. Effectiveness is defined as the extent to which the desired result is obtained. It is difficult to assess the effectiveness of fire safety measures, because of the complexity of identification of a causal relation(s) between improved fire safety and safety measures. For example, it might be found that after a safety campaign for smoking discouragement the number of smokers has been reduced, but that this reduction was not the result of the safety campaign but of a price increase of cigarettes in that period. Although it is complex to identify the true causal connection between improved fire safety and fire safety measures, it is feasible to assess the potential effectiveness of safety measures. In order to achieve this, several assessment criteria are set. The assessment criteria that are used for the assessment of the fire safety measures, as judged from the documents studied, are given below. Assessment criteria for the potential effectiveness of fire safety measures
1. Does the fire safety measure intervene with the reduction of the occurrence of fire or with the effect of fire? Answer range: O: occurrence, E: effect.
2. Does the fire safety measure intervene with a fire cause that appears in statistics to be one of the top three fire causes? Answer range: Y: yes, N: no.

Consumer fire safety: European statistics and potential fire safety measures
NETHERLANDS INSTITUTE FOR SAFETY NIBRA 38
3. Does the fire safety measure intervene with a fire development that appears in statistics to have a high risk in terms of losses22? Answer range: Y: yes, N: no.
4. What is, based on the studied documents, the effect of the fire safety measure on the reduction of the occurrence / effect? Open answer.
5. What is (to the opinion of the NIFV) the degree of potential effectiveness of the fire safety measure, based on criteria analysis and the analysis by using the Haddon Matrix? Answer range: --: very unpromising, -: unpromising, 0: unclear, +: promising, ++: very promising.
These assessment criteria (questions) are converted to the 'Fire safety measure assesment matrix' that is given in table 8. Fire safety measure Fire safety assessment
Occurrence or effect intervention Answer: O or E Intervention on top 3 fire causes Answer: Y or N High risk effect intervention Answer: Y or N Evaluated effectiveness, based on studied documents
Answer: Risk and effect description
Potential effectiveness (--/-/0/+/++)
Answer: -- / - / 0 / + / ++
Table 8 Fire safety measure assessment matrix
4.2 Overview of fire safety measures
In an internet search on fire safety measures various intervention strategies for the improvement of consumer fire safety were found. In the following paragraphs these measures are given per influence factor group of the Haddon Matrix. 4.2.1 Safety measures that have influence on the host
Product manual safety information
In 2000 the British Home Office, Department of Trade and Industry studied the effectiveness of information concerning the safe use of candles and tea lights. The research showed that producers of candles hardly give recommendations of suitable candleholders. On the contrary, some producers show large ornamental candles without candleholder in their advertisements. It was also found that the (British) public hardly reads safety information if indicated on the packing, nor pay attention to information given by salesmen. Only a few consumers could remember that they saw some of the information in the shop or selling point, but nobody could replicate the contents. The respondents who do read guidelines or labels, generally search for information about the characteristics of the candle and not about safety issues. Moreover, consumers do not consciously use candles safely or unsafely, but, in general, use them the way they always do [DTI, 2000a].
22 Casualties and/or property losses.
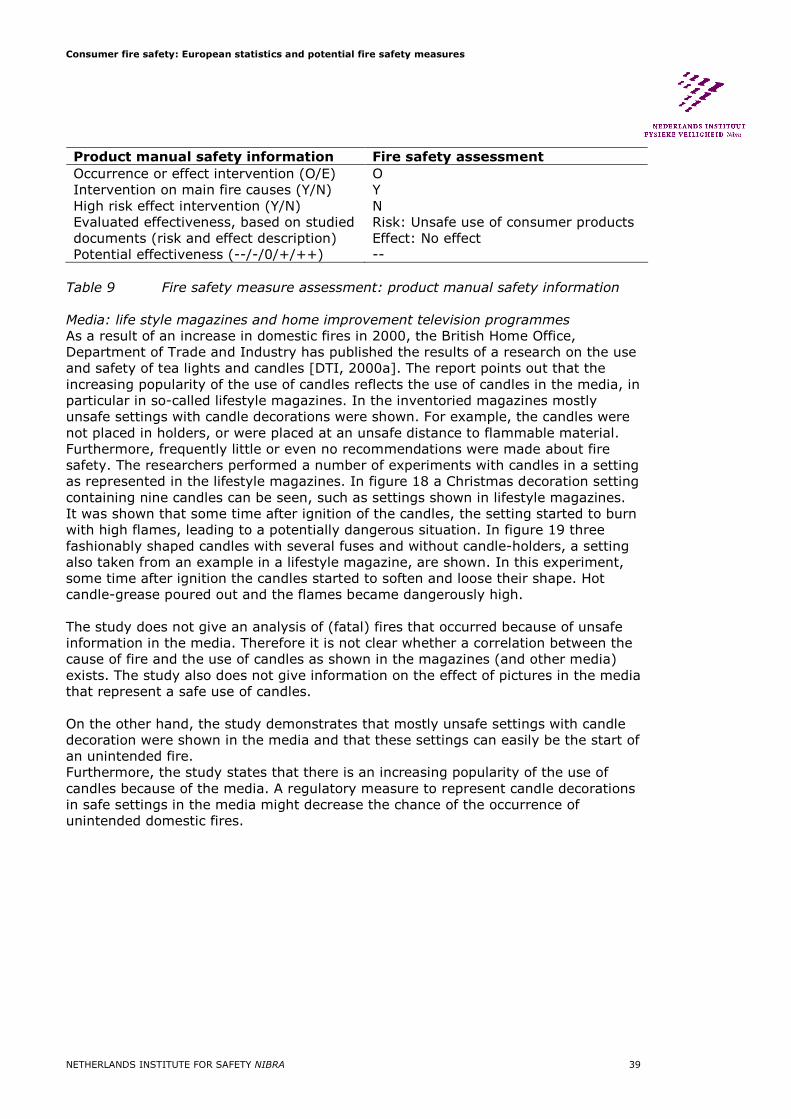
Consumer fire safety: European statistics and potential fire safety measures
NETHERLANDS INSTITUTE FOR SAFETY NIBRA 39
Product manual safety information Fire safety assessment
Occurrence or effect intervention (O/E) O Intervention on main fire causes (Y/N) Y High risk effect intervention (Y/N) N Evaluated effectiveness, based on studied documents (risk and effect description)
Risk: Unsafe use of consumer products Effect: No effect
Potential effectiveness (--/-/0/+/++) -- Table 9 Fire safety measure assessment: product manual safety information
Media: life style magazines and home improvement television programmes As a result of an increase in domestic fires in 2000, the British Home Office, Department of Trade and Industry has published the results of a research on the use and safety of tea lights and candles [DTI, 2000a]. The report points out that the increasing popularity of the use of candles reflects the use of candles in the media, in particular in so-called lifestyle magazines. In the inventoried magazines mostly unsafe settings with candle decorations were shown. For example, the candles were not placed in holders, or were placed at an unsafe distance to flammable material. Furthermore, frequently little or even no recommendations were made about fire safety. The researchers performed a number of experiments with candles in a setting as represented in the lifestyle magazines. In figure 18 a Christmas decoration setting containing nine candles can be seen, such as settings shown in lifestyle magazines. It was shown that some time after ignition of the candles, the setting started to burn with high flames, leading to a potentially dangerous situation. In figure 19 three fashionably shaped candles with several fuses and without candle-holders, a setting also taken from an example in a lifestyle magazine, are shown. In this experiment, some time after ignition the candles started to soften and loose their shape. Hot candle-grease poured out and the flames became dangerously high. The study does not give an analysis of (fatal) fires that occurred because of unsafe information in the media. Therefore it is not clear whether a correlation between the cause of fire and the use of candles as shown in the magazines (and other media) exists. The study also does not give information on the effect of pictures in the media that represent a safe use of candles. On the other hand, the study demonstrates that mostly unsafe settings with candle decoration were shown in the media and that these settings can easily be the start of an unintended fire. Furthermore, the study states that there is an increasing popularity of the use of candles because of the media. A regulatory measure to represent candle decorations in safe settings in the media might decrease the chance of the occurrence of unintended domestic fires.

Consumer fire safety: European statistics and potential fire safety measures
NETHERLANDS INSTITUTE FOR SAFETY NIBRA 40
Figure 18
Test with Christmas decoration as
represented in a life style magazine
[DTI,2000a]
Figure 19
Fire development of a fashionably
shaped candle, containing several fuses
[DTI,2000a]
Media: presentation of candle usage Fire safety assessment
Occurrence or effect intervention (O/E) O Intervention on main fire causes (Y/N) Y High risk effect intervention (Y/N) Y Evaluated effectiveness, based on studied documents (risk and effect description)
Risk: Unsafe use of candles Possible effect: Decreased chance of occurrence of unintended fire
Potential effectiveness (--/-/0/+/++) 0
Table 10 Fire safety measure assessment: media
t = 2 D =
t = 0 D =
t = 1 D =
t = 1 D =
t = 0 D =

Consumer fire safety: European statistics and potential fire safety measures
NETHERLANDS INSTITUTE FOR SAFETY NIBRA 41
4.2.2 Safety measures that have influence on the agent
Noninflammable cigarettes
The American National Institute or Standards and Technology (NIST) carried out tests for the Federal Trade Commission (FTC), on cigarettes containing flame retardant paper [NIST, 2001]. The aim of the experiments was to examine if these cigarettes can confine the start of fire when burning cigarettes fall or are thrown away. The motive for this research was the large number of fatalities in domestic fires caused by smoking. The Consumer Product Safety Commission (CPSC) estimated that in 1997 fires caused by smoking have resulted in 880 fire deaths and 2,20 fire injuries [NIST, 2001]. In 2005-2007 there were 11,000 fires annually across the EU caused by cigarettes, resulting in 520 deaths23. After the general Cigarette Safety Act 1984 the Fire Safe Cigarette Act was introduced in 1990 (USA). Two test methods, by which the lighting capacity of cigarettes can be determined, have been defined. From tests with cigarettes containing flame retardant paper it became clear that these cigarettes have a lower chance of setting fire to other materials, compared to conventional cigarettes [NIST, 2001]. In November 2008 the 27 EU member states gave the go-ahead for self-extinguishing cigarettes and the European Committee for Standardisation started preparing the technical specifications for these safer cigarettes. Such cigarettes, which extinguish within a minute if they are not puffed at, are already on sale in Canada and parts of the USA. In 2000, New York passed the first state law requiring that cigarettes have a lower likelihood of starting a fire. In 2006, four more USA states passed laws modeled after the New York law: Vermont, New Hampshire, California, and Illinois. In 2008, 22 states passed the legislation of reduced ignition propensity (RIP) cigarettes. Fire-safe cigarettes have been mandatory in Canada since 2005. Besides technical research on the safety of RIP cigarettes (see for example NIST, 2001), no information was found about the effectiveness of the RIP cigarette legislation in terms of a decreased number of fires caused by smoking, or a decreased number of casualties in fires caused by smoking. Although RIP cigarettes can possible be effective on reducing the fires started by smoking, the problem still exists for cigars and shag. Noninflammable cigarettes Fire safety assessment
Occurrence or effect intervention (O/E)
O
Intervention on main fire causes (Y/N)
Y
High risk effect intervention (Y/N) Y Evaluated effectiveness, based on studied documents (risk and effect description)
Risk: Ignition by cigarettes Tested effect: Lower probability if ignition Potential effect: Decrease of fire deaths
Potential effectiveness (--/-/0/+/++) ++ Table 11 Fire safety measure assessment: RIP cigarettes
23 http://news.bbc.co.uk/2/hi/europe/7544619.stm

Consumer fire safety: European statistics and potential fire safety measures
NETHERLANDS INSTITUTE FOR SAFETY NIBRA 42
Flame retardants: Noninflammable upholstered furniture
Since 1988 the UK has the furniture and furnishing (fire) (safety) legislation. This legislation has been established as a result of an increasing number of domestic fatal fires, wherein the fatality was caused by ignition of upholstered furniture [DTI, 2000b]. Although only 7.5% of the domestic fires started in furniture, these fires led up to 35% of the total number of fatalities in domestic fires. The evaluation of the above-mentioned British legislation in 1992, four years after the introduction of the safety regulations, shows a decrease of 65 fatalities in domestic fires since 1988. In 1997 there was a decrease of 138 fatalities as compared to 1988. In figure 20 the trends for fatal fires before and after 1988 are given. The figure shows that in particular the smoke-related cause of death has decreased since 1988. The increase before 1988 has developed into a decrease after 1988. This also applies to the number of persons who perished as a result of a fire in upholstered furniture (see figure 20). The application of fire retardants in upholstered furniture, in which foam rubbers have been used, appears to reduce the number of fatalities in domestic fires. Over a period of nine years, according to calculations, the legislation has possibly prevented 710 fire deaths. If, in addition to the presence of fire-safe upholstered furniture, a well-functioning smoke detector is installed, the number of fire deaths could decrease to 4 per 1.000 domestic fires, compared to 9 per 1.000 domestic fires in the case when no smoke detectors are present [DTI, 2000b].
Figure 20 Fire deaths per million persons (pmp) per year, before and after 1988
[DTI, 2000b]
After the enforcement of the legislation not only the number of fire deaths has decreased, but also the number of wounded persons has decreased strongly. Based on the trend line before 1988 (figure 20), the estimation is that in 1992 the number of wounded persons has been decreased with 526 persons. For 1997 a decrease of 1126 wounded persons is estimated. This implies that over a period of nine years at least 5770 wounded persons have been prevented [DTI, 2000b]. Also in the United States legislation concerning the fire behavior of furniture and furnishing has been enforced.
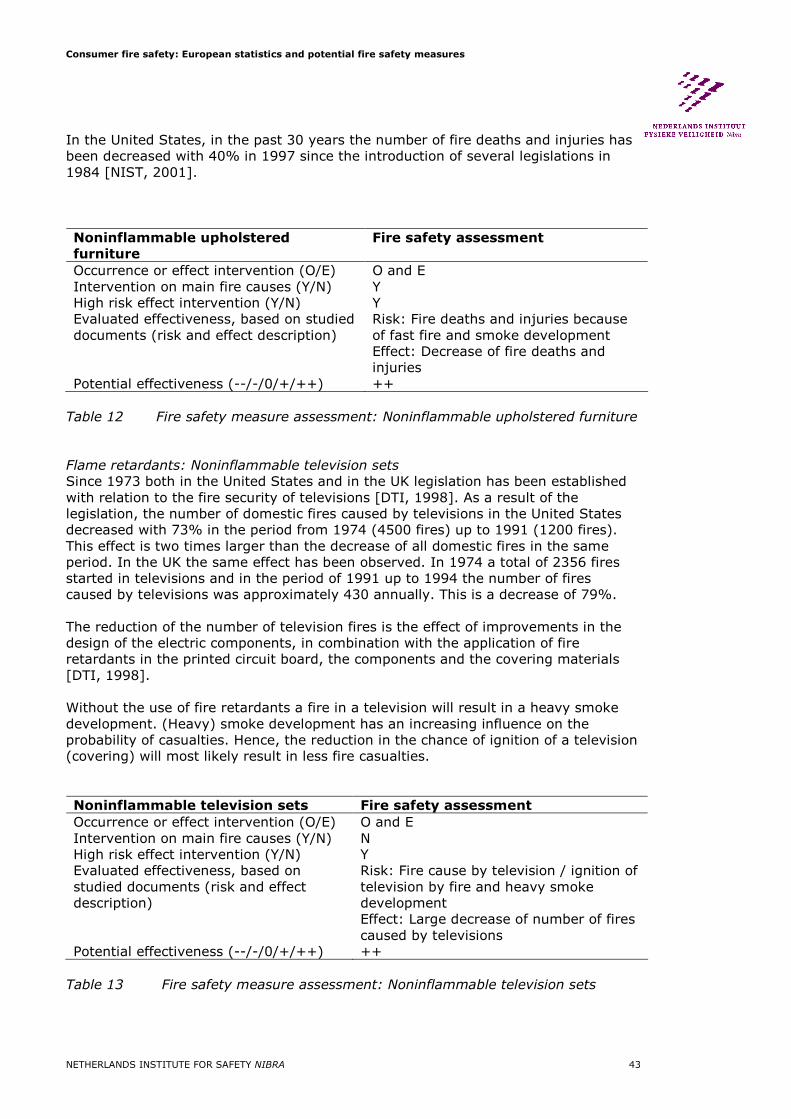
Consumer fire safety: European statistics and potential fire safety measures
NETHERLANDS INSTITUTE FOR SAFETY NIBRA 43
In the United States, in the past 30 years the number of fire deaths and injuries has been decreased with 40% in 1997 since the introduction of several legislations in 1984 [NIST, 2001]. Noninflammable upholstered
furniture
Fire safety assessment
Occurrence or effect intervention (O/E) O and E Intervention on main fire causes (Y/N) Y High risk effect intervention (Y/N) Y Evaluated effectiveness, based on studied documents (risk and effect description)
Risk: Fire deaths and injuries because of fast fire and smoke development Effect: Decrease of fire deaths and injuries
Potential effectiveness (--/-/0/+/++) ++
Table 12 Fire safety measure assessment: Noninflammable upholstered furniture Flame retardants: Noninflammable television sets
Since 1973 both in the United States and in the UK legislation has been established with relation to the fire security of televisions [DTI, 1998]. As a result of the legislation, the number of domestic fires caused by televisions in the United States decreased with 73% in the period from 1974 (4500 fires) up to 1991 (1200 fires). This effect is two times larger than the decrease of all domestic fires in the same period. In the UK the same effect has been observed. In 1974 a total of 2356 fires started in televisions and in the period of 1991 up to 1994 the number of fires caused by televisions was approximately 430 annually. This is a decrease of 79%. The reduction of the number of television fires is the effect of improvements in the design of the electric components, in combination with the application of fire retardants in the printed circuit board, the components and the covering materials [DTI, 1998]. Without the use of fire retardants a fire in a television will result in a heavy smoke development. (Heavy) smoke development has an increasing influence on the probability of casualties. Hence, the reduction in the chance of ignition of a television (covering) will most likely result in less fire casualties. Noninflammable television sets Fire safety assessment
Occurrence or effect intervention (O/E) O and E Intervention on main fire causes (Y/N) N High risk effect intervention (Y/N) Y Evaluated effectiveness, based on studied documents (risk and effect description)
Risk: Fire cause by television / ignition of television by fire and heavy smoke development Effect: Large decrease of number of fires caused by televisions
Potential effectiveness (--/-/0/+/++) ++
Table 13 Fire safety measure assessment: Noninflammable television sets

Consumer fire safety: European statistics and potential fire safety measures
NETHERLANDS INSTITUTE FOR SAFETY NIBRA 44
4.2.3 Safety measures that have influence on the physical environment
Smoke detectors
Installation of smoke alarms on each floor of a home is found in several studies to be an effective strategy for preventing injuries and deaths due to domestic fire, provided that they are properly maintained [Runyan et al, 2005]. Several European countries have legislation regarding the installation of domestic smoke alarms [Schmidt Pedersen and Steen-Hansen, 2005]. In the text box below an overview is given of the requirements of some European countries.
Though smoke detectors are required in several countries, the maintenance of smoke alarms seems to be an overlooked aspect of fire safety. Studies in Ontario (USA), the United States as a whole and Britain have showed that efforts to increase smoke alarm usage have been successful. However, the long-term maintenance of smoke alarms is a matter of extreme importance. In the text boxes below some results of efficacy studies are given.
Requirements regarding installation of domestic smoke alarms (Partially cited from Schmidt Pedersen and Steen-Hansen, 2005) Norway: At least one approved smoke alarm has been required in both new and existing residential buildings since 1991. There are no specific requirements to which type of detector should be installed, or to the type of power supply system. Denmark: Since December 2004 a smoke alarm system is required in single family houses with a maximum of two floors and a basement. The system shall be coupled to the mains and shall be equipped with a battery backup system. Sweden: The Swedish Rescue Services Agency issued a general recommendation on installation of smoke alarms in all residential buildings in 2004. Finland: All residences, both existing and new, must be equipped with fire detectors since 1999. There must be at least one detector on each floor, and it must be kept in working order. Batteries are the required power source. If the detector is wire operated, it must be provided with a battery backup. United Kingdom: According to the Building regulations from 2000, dwellings shall be provided with devices for the early warning of fire. A general recommendation about placing smoke alarms in connection with bedrooms and installing at least one detector in each floor is given. Smoke alarms can be wired or battery operated. The Netherlands: Smoke detectors have been required in new dwellings in the Netherlands since 2003. Detectors shall be of the non-ionic type, and shall be coupled to the electrical mains system. There are no requirements for smoke alarms in dwellings built before 2003.

Consumer fire safety: European statistics and potential fire safety measures
NETHERLANDS INSTITUTE FOR SAFETY NIBRA 45
Efficacy of smoke detectors in the USA In the State of Home Safety in America (SOHS) study, which included a national telephone survey conducted with adults, 97% of the 1003 responders reported having at least one smoke alarm in the household, and 80% had smoke alarms on each floor of their home [Runyan et al, 2005]. In 1991 the Centers for Disease Control and Prevention (CDC) estimated that 91% of households had at least one smoke alarm. This suggests that efforts to increase smoke alarms usage in the United States over the past decade have been successful. This is affirmed by the findings of the Public/Private Fire Safety Council [Park, 2008]: Between 1977 and 2003 residential smoke alarm use increased from 22% to 95% and during the same period, the home fire death ratio, relative to resident population, declined by nearly 60%. Nevertheless, in 2000, there was no smoke alarm present in more than half of all domestic fires in the United States. Furthermore, in many homes, smoke alarms may not be in working condition. This is affirmed by studies in Oklahoma City and Britain, in which it is found that only 45% of installed smoke alarms were still functioning after 4 years (Oklahoma City) and only half of the smoke alarms installed during a randomized controlled trial were functioning 15 months later. Thus, addressing the long-term maintenance of smoke alarms is a critically important, but possibly overlooked, aspect of fire prevention [Runyan et al, 2005]. The NFPA found in 2007 that 96% of USA homes have at least one smoke alarm, only three-quarters of all USA homes have at least on working smoke alarm. A recent study by the NFPA [Ahrens, 2008] showed that from 2000 to 2004, 43% of all home fire deaths resulted from fires in homes with no smoke alarms, while 22% resulted from homes where smoke alarms were present but not working.
Efficacy of smoke detectors in Ontario In 2007, after the adoption of the Ontario law for having a working smoke alarm on every floor and outside all sleeping areas (March 2006) the percentage of domestic fires with a smoke present was 77%. Also the percentage of operated and not operated smoke detectors is not significant different than the percentages of 2003, before the adoption of the law for presence of a working smoke alarm on every floor and outside all sleeping areas. Nevertheless, because the degree of presence of smoke detectors was very high (95% in 1995) before the legislation in 2006, the fact of no significant difference does not give strong information on the effectiveness of smoke detectors. More evidence is given by the strong decrease of the death ratio of domestic fires: in 2005 the death ratio was decreased by 41% compared to the death ratio of 1996. Ontario domestic fires 2003-2007 [OFM 2009a; OFM 2009b] 1975 – Ontario homes required to have smoke alarms outside sleeping areas 1980 – Ontario fire death rate 30.8 per million population. 1990 – Statistics Canada survey reports 85% of homes have smoke alarms. 1990 – Ontario fire death rate 14.4 per million population. 1996 – Canadian Safety Council survey reports 95% of homes in Canada have smoke alarms. 1996 – Ontario fire death rate 11.6 – down 62% from 1980. 1998 – Amendment of Ontario Fire Code, requirement of one smoke alarm installed outside sleeping areas in existing Ontario homes. 2003 – In 79% of the domestic fires a smoke was present and in 48% (of domestic fires) the smoke detector operated, in 20% it did not operate and in 11% the operation is unknown 2005 - Ontario fire death ratio 6.9 – down 41% from 1996. 2006 – Smoke alarms required on all levels of dwellings in Ontario.

Consumer fire safety: European statistics and potential fire safety measures
NETHERLANDS INSTITUTE FOR SAFETY NIBRA 46
Despite the positive gains that smoke alarms have made in contributing to life safety, they have not yet reached their full potential, and improvements in their effectiveness and implementation are still needed [Park, 2008; Schmidt Pedersen and Steen-Hansen, 2005]. There are several aspects that need improvement:
• There is a strong link between missing or flat batteries and inoperability of smoke alarms. Therefore, higher priority should be given to follow-up and inspection of the (maintenance of) fire safety in dwellings.
• False alarms and nuisance activations are the leading cause for deliberately disabling smoke alarms [Ahrens, 2008b in: Park, 2008].
o Two leading problems that result in the removal of smoke alarm batteries are
1) alarming to cooking fumes, and 2) alarming continuously when powered.
o Nuisance alarms were found to be more likely with ionization alarms as compare to photoelectric alarms.
• Young children and older adults are found to have difficulties in wakening by a smoke alarm [Park, 2008; Bruck, 2001]. This is a significant shortcoming that needs improvement since many fatal fires occur during sleeping hours.
• Primarily, smoke alarms will help persons who are able to evacuate without assistance [Schmidt Pedersen and Steen-Hansen, 2005]. Special attention is needed for the fire safety of people who have mobility problems and for whom additional safety measures are needed.
Ionization alarms respond faster to flaming fires and photoelectric alarms often provide considerably faster response times to smoldering fires [Averill et al, 2007]. Since fatal fires are caused mostly by smoking and mostly start in upholstered furniture, many fatal fires start as a smoldering fire. However, Schmidt Pedersen and Steen-Hansen (2005) state that there is no way to establish the number of flaming fires that start as smoldering fires from the fire scene itself, at least not based on the normal fire reports from the police. Therefore they estimated that the number of smoldering fires will be 25% maximum. A recommendation is to have more than one smoke alarm in each dwelling. Smoke alarms need to be placed in bedrooms and they should also be interconnected, since the majority of fatal victims are not in the same room as the point of origin. Another recommendation is to use 'smart' smoke alarms that can distinguish between hostile fires and nuisance sources [Public/Private Fire Safety Council, 2006].
Efficacy of smoke detectors in Norway and Sweden (Partially cited from Schmidt Pedersen and Steen-Hansen, 2005) More than 97% of the Norwegian dwellings have smoke alarms installed. However, only 60-80% of these smoke alarms is likely to function as required in a fire. In a survey of statistical information from 365 Norwegian fatal fires in the period 1997-2003, in which a total of 420 victims died, it was found that
• 25% of the dwellings had a working smoke alarm installed; • 21% had no smoke alarm or a non-functioning smoke alarm installed; • for 38% there was no information available.
In a Swedish survey it was found that a working smoke alarm was absent in 75% of fatal fires in Sweden in 2002.

Consumer fire safety: European statistics and potential fire safety measures
NETHERLANDS INSTITUTE FOR SAFETY NIBRA 47
Smoke detectors Fire safety assessment
Occurrence or effect intervention (O/E)
E
Intervention on main fire causes (Y/N)
N
High risk effect intervention (Y/N)
Y
Evaluated effectiveness, based on studied documents (risk and effect description)
Risk: High number of fire fatality during sleeping hours Effect: Fast detection and waking sound by smoke alarms, has led to strong decrease of the death rate of domestic fires. However, improvements are needed, i.e. regarding the maintenance of smoke alarms
Potential effectiveness (--/-/0/+/++)
++
Table 14 Fire safety measure assessment: Smoke detectors
Residential sprinklers
Melinek (1993) studied the potential value of sprinklers in reducing fire casualties, as part of a research study aimed at developing quantitative fire engineering models for the assessment of fire risk. Assessment of the value of sprinklers is difficult, due to lack of reliable data on the numbers of ‘sprinklered’ and ‘unsprinklered’ buildings. It has been estimated, using simulation methods, that sprinklers in dwellings can reduce the number of fire deaths by 66% and the number of non-fatal casualties by 45%. Results of a scenario-type study also suggest that about half of the number of fire deaths would be prevented by sprinklers. An evaluation of 73 fatal fires has suggested that an idealized suppression system (one that extinguished or controlled all fires while giving an internal alarm) would prevent about 90% of fire deaths and 95% of non-fatal casualties [Melinek, 1993]. Melinek (1993) states that, based on a cost benefit analysis, "notwithstanding the substantial reduction in life risk, sprinklers in dwellings may, at current prices (in
1993), be uneconomic compared with the cost of safety measures in other fields.
(...) Nearly half of fatal fire casualties in dwellings occur in fires started in living of
dining rooms. Hence, it may be more cost effective (...) to install sprinklers only in
those rooms." Application of residential sprinklers is not a regular fire measure. Therefore there is little information on the effectiveness of sprinklers based on fire statistics. Only one study was found, based on data of a small city, namely Scottsdale (about 130,000 inhabitants in 1990) in Arizona, USA. In Scottsdale residential sprinklers have been applied since 1985. Before 1985 the obligation of sprinklers in newly built houses has been fixed in (municipal) legislation. After ten years the number of non-fatal casualties in fires showed to be decreased with 80% and the 40 fires in houses applied with a sprinkler caused no fatalities [Rural/Metro Fire Department, 1997].

Consumer fire safety: European statistics and potential fire safety measures
NETHERLANDS INSTITUTE FOR SAFETY NIBRA 48
Residential sprinklers Fire safety assessment
Occurrence or effect intervention (O/E) E Intervention on main fire causes (Y/N) N High risk effect intervention (Y/N) Y Evaluated effectiveness, based on studied documents (risk and effect description)
Risk: Fast fire and smoke development after fire detection Effect: Automatic extinguishment and (expected) decrease of fatal and non-fatal casualties in fires
Potential effectiveness (--/-/0/+/++) 0 (due to lack of reliable data)
Table 15 Fire safety measure assessment: Residential sprinklers
Extinguishers
In Ontario, Canada, a survey has been carried out during 2005 and 2006 on all stove top fires (N=1244) that had been reported to the fire brigade [OFM, 2009c]. During 1995 and 2004 the contribution of stove top fires to domestic fires was 27%. In 61% of the fires the occupants attempted to extinguish the fire, corresponding to 16.5% of the domestic fires. About 46% of the top stove fires were extinguished by the occupant. This implies that about three-quarter of the attempts was successful and that at least 12.4% of all the domestic fires has been extinguished by the occupant. This indicates that a significant part of the domestic fires is put out by the occupant(s); education in home fire extinguishment and the presence of fire extinguish items in the homes, like fire blankets, water hoses and so on, probably will have a increasing effect on the reduction of the number of domestic fires. Extinguishers Fire safety assessment
Occurrence or effect intervention (O/E)
E
Intervention on main fire causes (Y/N)
N
High risk effect intervention (Y/N) N Evaluated effectiveness, based on studied documents (risk and effect description)
Risk: Fire development Potential effect: Decrease of large and possible fatal domestic fires
Potential effectiveness (--/-/0/+/++)
+
Table 16 Fire safety measure assessment: Fire extinguishers 4.2.4 Safety measures that have influence on the social environment
Some of the above evaluated safety measures have been set in regulations. These regulations have an influence on the social environment. Besides the above mentioned safety measures that are put down in regulations, no other safety measures were identified that have an influence on the social environment.

Consumer fire safety: European statistics and potential fire safety measures
NETHERLANDS INSTITUTE FOR SAFETY NIBRA 49
4.3 Criteria assessment
In this paragraph the results of the criteria assessment, described in paragraph 4.1, on the examined fire safety measures, described in paragraph 4.2, are presented. Firstly, the identified risk factors of consumer products are given in table 17. To improve the domestic fire safety these risk factors have to be covered by fire safety measures. So secondly, the identified safety measures are given in table 18 (18a and 18b). Host Agent Physical
environment
Social
environment
Fire caused by unsafe use of consumer products, such as candles
Fire start in (upholstered) furniture, textile, technical appliances or clothing
Fire start in living room or bedroom
Most fires are caused by smoking or cooking
Fire start by smoking materials / falling asleep while smoking
Men, children and elderly are the most common victims
Risk
factors
Being asleep and/or alcohol use is major aspect in fatal fires
Upholstered furniture and plastics causes large smoke development
Smoking and cooking in combination with upholstered furniture and textile are the most common accident patterns
No regulations for maintenance of smoke detectors
Tabel 17 Identified risk factors of consumer products in domestic fires

Consumer fire safety: European statistics and potential fire safety measures
NETHERLANDS INSTITUTE FOR SAFETY NIBRA 50
Fire safety measure Occurrence or effect intervention (O/E)
Intervention on top 3 fire causes (Y/N)
High risk effect intervention (Y/N)
Evaluated effectiveness,
based on studied documents
(risk and effect description) Potential effectiveness (--/-/0/+/++)
Product manual safety information
O Y N Risk: Unsafe use of consumer products Effect: No effect
--
Media: presentation of candle usage
O Y Y Risk: Unsafe use of candles Possible effect: Decreased chance of occurrence of unintended fire
0
Noninflammable cigarettes O Y Y Risk: Ignition by cigarettes Tested effect: Lower probability if ignition Potential effect: Decrease of fire deaths
++
Noninflammable upholstered furniture
O & E Y Y Risk: Fire deaths and injuries because of fast fire and smoke development Effect: Decrease of fire deaths and injuries
++
Table 18a. Safety measures assessment matrix
O: occurrence, E: effect Y: yes, N: no --: very unpromising, -: unpromising, 0: unclear, +: promising, ++: very promising

Consumer fire safety: European statistics and potential fire safety measures
NETHERLANDS INSTITUTE FOR SAFETY NIBRA 51
Fire safety measure Occurrence or effect intervention (O/E)
Intervention on top 3 fire causes (Y/N)
High risk effect intervention (Y/N)
Evaluated effectiveness,
based on studied documents
(risk and effect description) Potential effectiveness (--/-/0/+/++)
Noninflammable television sets
O & E N Y Risk: Fire cause by television / ignition of television by fire and heavy smoke development Effect: Strongly decrease of fires caused by televisions
++
Smoke detectors E N Y Risk: High number of fire fatality during sleeping hours Effect: Fast detection and waking sound by smoke alarms, has led to strong decrease of the death rate of domestic fires. However, improvements are needed, i.e. regarding the maintenance of smoke alarms
++
Residential sprinklers E N Y Risk: Fast fire and smoke development after fire detection Effect: Automatic extinguishment and (expected) decrease of fatal and non-fatal casualties in fires
0*
Extinguishers E N N Risk: Fire development Potential effect: Decrease of large and possible fatal domestic fires
+
*: due to lack of reliable data
Table 18b Safety measures assessment matrix
O: occurrence, E: effect Y: yes, N: no --: very unpromising, -: unpromising, 0: unclear, +: promising, ++: very promising

Consumer fire safety: European statistics and potential fire safety measures
NETHERLANDS INSTITUTE FOR SAFETY NIBRA 52
4.4 Conclusions
Noninflammable or reduced inflammable consumer products
Very promising fire safety measures are the use of noninflammable or reduced inflammable consumer products in dwellings, particularly cigarettes since most fatal fires are caused by smoking, and upholstered furniture and television sets since foam rubbers and plastics cause heavy and toxic smoke. Therefore it is recommended to put effort in stimulation (and/or legislation) of the use of noninflammable/reduced inflammable consumer products, particularly (self-extinguishing) cigarettes, upholstered furniture / mattresses and electrical appliances with plastic coverings (i.e. televisions, computers and cloths dryers). Smoke detectors
Another very promising fire safety measure is the use of smoke detectors in dwellings, since most fatal fires occur in the night, while people present are asleep and need to be woken up by a sound. Regarding smoke detectors, it was found that in some European countries smoke alarms are required by legislation. It was also found that installation of smoke alarms on each level of a home is an effective strategy for preventing injuries and deaths due to domestic fire, provided that the smoke alarm system is properly maintained. Nevertheless, the maintenance of smoke alarms seems to be an overlooked aspect of fire safety. Therefore it is recommended to invest in measures that have a positive effect on the long-term operability of smoke alarms in dwellings. Other aspects that need improvement are:
• averting the occurrence of false alarm and nuisance activations, for example by using 'smart' smoke alarms;
• young children and older adults have difficulties in wakening by a smoke alarm. Therefore smoke alarms are needed that can also wake up young and elderly people;
• special attention is needed for the fire safety of people that have mobility problems and for whom additional safety measures are needed;
• smoke alarms need to be placed in bedrooms and should also be interconnected.
Residential sprinklers
Residential sprinklers are expected to be very promising; however, at the moment it is labeled as a measure with an unclear effect. Given that sprinklers have not been implemented widely in dwellings, there is lack of reliable statistics that can underpin the potential effect on life safety. Nevertheless, theoretical studies using simulation methods suggest that sprinklers in dwellings can reduce the number of fire deaths by 66% and the number of non-fatal casualties by 45%. Results of a scenario-type study also suggest that about half of the number of fire deaths would be prevented by the application of sprinklers in the home. In a study of the effect of the implementation of residential sprinklers in Scottsdale, USA, it was found that ten years after implementation the number of non-fatal casualties in fires was decreased with 80% and that the 40 fires in houses applied with a sprinkler caused no fatalities.

Consumer fire safety: European statistics and potential fire safety measures
NETHERLANDS INSTITUTE FOR SAFETY NIBRA 53
References
AAMI (2007) Firescreen, Fire safety and awareness index 2006. Australian Associated Motor Insurers, Australia. ACFSE (2001) The Fire Safety of Upholstered furniture, Alliance for Consumer Fire Safety in Europe, Belgium. ACFSE (2007) Fire hazards of Upholstered Furniture: The need for action by the European Commission. Position Paper. The Alliance for Consumer Fire Safety in Europe, Belgium. Ahrens, M. (2007) Home candle fires. NFPA, Quincy, MA. Ahrens, M. (2008a) Home Fires That Began With Upholstered Furniture. NFPA, Quincy, MA. Ahrens, M. (2008b) False alarms and unwanted activations from: USA experience
with smoke alarms and other fire detection / alarm equipment. NFPA, Quincy, MA. Averill, J.D., Bryner, N.P., Bukowski, R.W., Cleary, T.G., Kuligowski, E.D., Peacock, R.D., Reneke, P.A., Walton, W.D. (2007) Performance of home smoke alarms:
analysis of the response of several available technologies in domestic fire settings.
National Institute of Standards and Technology, USA. Barnett, M., Bruck, D., Jago, A. (2007) Mean annual probability of having a domestic
fire experience throughout a lifetime: development and application of a methodology.
7th Asia-Oceania Symposium on Fire Science and Technology, Hong Kong. Blomqvist, P. (2005) Emissions from fire. Consequences for human safety and the
environment, Doctoral thesis. Lund University. Lund, Sweden. Bruck (2001) The who, what, where and why of waking to fire alarms. A review, Fire safety journal 36, p. 623-639. CBS (2003) Brandweerstatistiek 200224, Centraal Bureau voor de Statistiek, Voorburg, the Netherlands Chang, C-H., Huang, H-C. (2005) A water requirements estimation model for fire
suppression: A study based on integrated uncertainty analysis, Fire Technology 41; 5-24. CTIF (2006) World Fire Statistics, Report No. 10, Centre of Fire Statistics of CTIF, Belgium. DTI (1996) TV fires Europe, Home Office, Department of Trade & Industry, London. DTI (1998) Risks and benefits in the use of flame retardants in consumer products, Home Office, Department of Trade and Industry, London. DTI (1999) Electric Blanket Fires and Related Injuries, Home Office, Department of Trade & Industry, London.
24Brandweerstatistiek: fire (service) statistics

Consumer fire safety: European statistics and potential fire safety measures
NETHERLANDS INSTITUTE FOR SAFETY NIBRA 54
DTI (2000a) The safety and use of tea lights and candles, Home Office, Department of Trade and Industry, London. DTI (2000b) Effectiveness of the furniture and furnishing (Fire) (Safety) Regulations 1988, Home Office, Department of Trade and Industry, London. DTI (2001) Causes of fires involving television sets in dwellings, Consumer affairs directorate, Department of trade and industry, London, Fahy, R.F., Proulx, G. (2001) Toward Creating a Database on Delay Times to Start
Evacuation and Walking Speeds for Use in Evacuation Modelling. 2nd International Symposium on Human Behaviour in Fire, Boston, pp. 175-183. FEMA (2008) Residential Building Electrical Fires. Topical Fire Report Series, Volume 8, Issue 2. Flynn (2009) Children playing with fire. NFPA, Quincy, MA. Frantzich, H. (1994) A model for performance-based design of escape routes.
Department of Fire Safety Engineering, Lund Institute of Technology, Lund University, Sweden. Gann, R.G. (2004) Estimating data for incapacitation of people by fire smoke. Fire Technology 40; 2; 201-207. Gwynne, S., Galea, E.R., Lawrence, P.J., Filippidis, L. (2001) Modelling occupant interaction with fire conditions using the building EXODUS evacuation model. Fire Safety Journal 36; 327-357. Hall jr., J.R. (2009) Home fires involving heating equipment. NFPA, Quincy, MA. Holborn, P.G., Nolan, P.F., Golt, J. (2003) An analysis of fatal unintentional dwelling fires investigated by London Fire Brigade between 1996 and 2000. Fire Safety Journal 38: 1-42. Irvine, D.J., McCluskey, J.A., Robinson, I.M. (2000) Fire hazards and some common
polymers: Review paper. Polymer Degradation and Stability 67; 383-396. ISO (2004) Guidelines for assessing the fire threat to people. ISO/TS 19706. Kobes, M. (2008) Zelfredzaamheid bij brand. Kritische factoren voor het veilig
vluchten uit gebouwen, Boom Juridische uitgevers, Den Haag, The Netherlands. Kobes, M., Groenewegen, K. & Winkelhorst, R. (2009, in press) Fatale woningbranden 2008. NIFV, Arnhem, The Netherlands. [Fatal domestic fires 2008] Melinek (1993) Potential value of sprinklers in reducing fire casualties. Fire safety journal 20, p. 275-287. Miller, I. (2005) Human Behaviour Contributing to Unintentional Domestic fire Deaths
1997-2003. New Zealand Fire Service Commission Research Report Number 47. Heimdall Consulting Ltd, New Zealand. NIST (2001) Relative ignition propensity of test market cigarettes, USA.

Consumer fire safety: European statistics and potential fire safety measures
NETHERLANDS INSTITUTE FOR SAFETY NIBRA 55
OFM, 2009a: http://www.ofm.gov.on.ca/english/Publications/Statistics/smokealarm/ OFM, 2009b: http://www.ofm.gov.on.ca/english/Fire%20Safety%20&%20Public%20Education/Working%20Smoke%20Alarms%20Its%20the%20Law/2006/media/backgrounder.asp OFM, 2009c: http://www.ofm.gov.on.ca/english/FireService/announcements/2006/PDF/Stove%20Top%20Fire%20Survey%20Summary%20PRINT.pdf Park, J. (2008) Why smoke alarms fall short of the full potential. University of Cincinnati, Ohio, USA. Proulx, G. (2003) Playing with fire: Understanding human behavior in burning
buildings. ASHRAE journal 45; 33-35. Public/Private Fire Safety Council (2006) Home smoke alarms and other fire
detection and alarm equipment. United States Fire Administration. Runyan, C.W. (1998) Using the Haddon matrix: introducing the third dimension.
Injury prevention 4, pp. 302-307. Runyan, C.W., Johnson, R.M., Yang, J., Waller, A.E., Perkis, D., Marshall, S.W., Coyne-Beasly, T., McGee, K.S. (2005) Risk and protective factors for fires, burns and carbon monoxide poisoning in USA households. American Journal of Preventive Medicine (28) 1, p. 102-108. Rural/Metro Fire Department (1997) Automatic sprinklers, a 10 year study. A
detailed history of the effects of the automatic sprinkler code in Scottsdale, Arizona.
Rural/Metro Fire Department, Scottsdale, AZ. Sandberg, A. (1997) Unannounced evacuation of large retail-stores. An evaluation of human behaviour and the computermodel Simulex. Lund University, Sweden. Schmidt Pedersen, K., Steen-Hansen, A. (2005) Can fatal fires be avoided? The impact of domestic smoke alarms on human safety. HERON (50) 4, p. 341-360. Scottish Executive (2004) Statistical Bulletin. Criminal Justice Series, April 2004. Sime, J.D. (2001) An occupant response shelter escape time (ORSET) model. Safety Science 38; 109-125. Tang, D., Beattie, K. (1997) Integrated prediction of fire, smoke and occupants
evacuation of buildings. Dublin Institute of Technology/IES Limited. Tong, D., Canter, D. (1985) The decision to evacuate: a study of the motivations
which contribute to evacuation in the event of fire. Fire Safety Journal 9; 257-265. US-CPSC (1999) Domestic fire loss estimates. United States Consumer Products Safety Commission, Washington. US-CPSC (2000) Clothes dryer project. Final report on electric and gas clothes dryers. United States Consumer Products Safety Commission, Washington.

Consumer fire safety: European statistics and potential fire safety measures
NETHERLANDS INSTITUTE FOR SAFETY NIBRA 56
Viaene, D. (year unknown) The human consequences of domestic fire. European Burns Casualties Association. Vissers, W. (2004) Een kwart meer buitenbranden in 2003. CBS webmagazine, 6 september 2004. [An additional quarter of outdoor fires in 2003] VWA (2004) Brandveiligheid wasdrogers. Rapportnummer ZW2002 wwh03/ZW2003 R003. Zwijndrecht, The Netherlands. [Fire safety of clothes dryers] Websites
http://ejcross.com/2007/10/08/fire-safety-tips-and-statistics http://news.bbc.co.uk/2/hi/europe/7544619.stm http://www.aami.com.au/Resources/File.aspx?id=83 http://www.cpsc.gov/CPSCPUB/PREREL/PRHTML96/96129.html http://www.cpsc.gov/LIBRARY/FOIA/foia08/os/ahfa1.pdf http://www.hanford.gov/fire http://www.ihs.gov/medicalprograms/portlandinjury/Worddocs/Getting%20Started/Haddon%20Matrix/CompletedHaddonMatrixFire.pdf http://www.ihs.gov/medicalprograms/portlandinjury/Worddocs/Getting%20Started/Haddon%20Matrix/HaddonMatrixBasics.pdf http://www.odpm.gov.uk http://www.usfa.dhs.gov/statistics/national/residential.shtm

Consumer fire safety: European statistics and potential fire safety measures
NETHERLANDS INSTITUTE FOR SAFETY NIBRA 57
Abbreviations AAMI Australian Associated Motor Insurers ACFSE Alliance for Consumer Fire Safety in Europe CBS Centraal Bureau voor de Statistiek (NL) CPSC Consumer Product Safety Commission (USA) CTIF Comité Technique International de prévention et d'extinction du Feu EU European Union FTC Federal Trade Commission (USA) NIFV Netherlands Institute for Safety Nibra NIST American National Institute or Standards and Technology (USA) PU polyurethane RIP reduced ignition propensity UK United Kingdom US United States US-CPSC United States Consumer Product Safety Commission VWA Voedsel en Waren Autoriteit (Dutch Food and Consumer Product Safety
Authority)