Embed Size (px)
DESCRIPTION
ISCRR Report
Citation preview

VOTOR-TAC Linkage Report
Impact of the TAC Recovery Model
School of Public Health and Preventive Medicine
Monash University
Professor Belinda Gabbe
Ms Pam Simpson 14th July 2015
Research report #: 083-0715-R03

Research Report # Page 2 of 35
Table of Contents
1. About this report .................................................................................................................. 3
2. Research Questions ............................................................................................................ 3
3. Methods ................................................................................................................................ 3
3.1 Inclusion criteria ........................................................................................................... 3
3.2 Linkage process ........................................................................................................... 3
3.3 Linkage variables ......................................................................................................... 5
3.4 Data analysis ................................................................................................................ 5
3.4.1 Outcomes of interest ................................................................................................................. 5
3.4.2 Modelling approach ................................................................................................................... 5
4. Results .................................................................................................................................. 8
4.1 Brief profile of VOTOR TAC Recovery cases ............................................................... 8
4.2 Impact of the implementation of the Recovery model on 6-month outcomes ...............10
4.2.1 Summary of 6-month outcomes in the pre-Recovery and post-Recovery periods ................. 10
4.2.2 Summary of the findings from the segmented regression modelling at 6-months .................. 11
4.2.3 Impact of the Recovery model on functional outcomes at 6-months (GOS-E) ....................... 13
4.2.4 Impact of the Recovery model on return to work outcomes at 6-months ............................... 15
4.2.5 Impact of the Recovery model on reporting moderate to severe pain at 6-months ................ 16
4.2.6 Impact of the Recovery model on EQ-5D outcomes at 6-months ........................................... 17
4.2.7 Impact of the Recovery model on SF-12 outcomes at 6-months ............................................ 23
4.2.8 Impact of the Recovery model on total TAC claim costs at 6-months .................................... 25
4.3 Impact of the implementation of the Recovery model on 12-month outcomes .............26
4.3.1 Summary of 12-month outcomes in the pre-Recovery and post-Recovery periods ............... 26
4.3.2 Summary of the findings from the segmented regression modelling at 12-months ................ 26
4.3.3 Impact of the Recovery model on functional outcomes at 12-months (GOS-E) ..................... 28
4.3.4 Impact of the Recovery model on return to work at 12-months .............................................. 30
4.3.5 Impact of the Recovery model on reporting moderate to severe pain at 12-months .............. 31
4.2.6 Impact of the Recovery model on SF-12 outcomes at 12-months .......................................... 32
4.2.7 Impact of the Recovery model on TAC claim costs at 12-months .......................................... 34
5. Summary of findings ..........................................................................................................35
6. Implications for the TAC .....................................................................................................35

Research Report # Page 3 of 35
1. About this report
The ISCRR Victorian Orthopaedic Trauma Outcomes Registry (VOTOR) project plan includes
deliverables related to linkage of VOTOR and TAC claims data at regular intervals. The
VOTOR-TAC Analysis Plan 2015/16 was developed to guide the analysis and reporting from
linked VOTOR, Victorian State Trauma Registry (VSTR) and TAC claims data.
2. Research Questions
The research question addressed in this report was:
What has been the impact of the TAC2015 Recovery model on patient-reported and TAC
scheme outcomes for VOTOR and Victorian State Trauma Registry (VSTR) Recovery clients?
Through discussion with key TAC personnel, it was identified that the initiatives introduced as
part of the Recovery model were not expected to impact on client outcomes. A focus of the
Recovery model was the capacity to segment clients into streams of claim management based
on the complexity of their needs or circumstances, with the segmentation largely focused on the
risk of lodging a common law claim. Recovery Branch processes changed considerably after
the implementation of the model, making it difficult to evaluate as a single intervention. Most
importantly, the introduction of mental health screening and other interventions were not
introduced during the evaluation timeframe, limiting the capacity to impact on client outcomes.
However, this report was completed to establish a baseline to which future evaluations could be
compared.3. Methods
3.1 Inclusion criteria
Cases registered by VOTOR meeting the following criteria were extracted for linkage:
i. Definitive management at The Alfred, RMH, University Hospital Geelong (UHG) or The
Northern Hospital (TNH)
ii. Date of injury from March 2007 to January 2014
iii. Fund source recorded as TAC and a claim number provided by the hospital.
iv. Confirmed as a Recovery Division claimant (or Benefit Delivery for cases before the
Recovery model implementation) client by the TAC flag.
3.2 Linkage process
The Department of Epidemiology and Preventive Medicine (DEPM) first created a unique
linkage ID, accessible to a single individual within the DEPM, for each eligible VOTOR and

Research Report # Page 4 of 35
VSTR case. The DEPM data administrator obtained the TAC claim number from the electronic
systems of each hospital, and then provided the TAC a file of claims that needed to be matched
which included the DEPM Linkage ID, TAC claim number, and patient identifiers (surname,
given name, date of birth and date of injury). No clinical or outcomes information from
VOTOR/VSTR was provided to TAC. These data were contained in a separate file, held at the
DEPM, and not provided to either of the other two organisations involved in this linkage project.
The TAC then matched the claim numbers and identifiers provided by DEPM to those on the
TAC claims database. For matching files, the TAC produced a file containing the DEPM Linkage
ID, and CRD Linkage ID to the ISCRR investigators. ISCRR did not receive the TAC claim
number or clinical/content information from DEPM. Concurrently, the TAC provided the DEPM
with a list of TAC claim numbers that matched to the TAC database to allow quality assurance
analysis.
For the matching cases, ISCRR appended the relevant TAC claims data to the data file and
removed the CRD Linkage ID. The resultant file was provided to the DEPM data administrator
who linked the data provided by ISCRR to the VOTOR data using the DEPM Linkage ID. The
linked dataset was then provided to the Project Leader (Belinda Gabbe) and DEPM
Biostatistician (Pam Simpson) for cleaning and analysis.

Research Report # Page 5 of 35
3.3 Linkage variables
A list of the linked variables, and their source, can be provided on request. In addition to the
variables provided by the CRD, the TAC also provided an additional file with selected data items
which were able to be linked using the DEPM ID.
3.4 Data analysis
3.4.1 Outcomes of interest
The outcomes of interest were:
i. Complete functional recovery defined as a GOS-E score of eight (upper good recovery)
at 6-months and 12-months post-injury (VSTR and VOTOR).
ii. Good functional recovery defined as a GOS-E score of seven (lower good recovery) or
eight (upper good recovery) at 6-months and 12-months post-injury.
iii. Return to work defined using the return to work questions collected by VOTOR at 6-
months and 12-months post-injury.
iv. Physical health defined as the physical component summary score of the SF-12 (PCS-
12) at 6-months and 12-months post-injury.
v. Mental health defined as the physical component summary score of the SF-12 (MCS-12)
at 6-months and 12-months post-injury.
vi. Total claim costs at 6-months and 12-months post-injury.
vii. EQ-5D summary score and indicator variables for each of the five EQ-5D items (no
problems vs. problems) at 6 months only.
3.4.2 Modelling approach
The introduction of the Recovery model represents an interrupted time series design, with the
introduction constituting a natural experiment. A simple linear or logistic regression approach
comparing the association between “pre” and “post” intervention phases and the outcome only
allows a comparison of the association before and after, essentially averaging the results over
both time periods. In contrast, segmented regression analysis enables assessment, in
statistical terms, of how much an intervention changed an outcome of interest, immediately and
over time; instantly or with delay; transiently or long-term; and whether factors other than the
intervention could explain the change.
A segmented regression analysis with bi-monthly intervals was used to determine the difference
between outcomes before and after implementation of the Recovery model. To account for

Research Report # Page 6 of 35
unequal numbers in each segment, the analyses were weighted by the inverse proportion of the
number in each segment. The 6 and 12-month periods before the Recovery phase was
implemented were excluded from the 6 and 12-month analyses, respectively.
All analyses were adjusted for age, gender, road user group, orthopaedic injury group, head
injury, chest or abdominal injury, other non-orthopaedic injury, comorbid status (Charlson
Comorbidity Index), pre-injury work status (for all models except return to work), pre-injury self-
reported disability, geographic remoteness and socioeconomic status. The postcode of
residence was mapped to the Index of Relative Socio-Economic Advantage and Disadvantage
(IRSAD) which summarises information about the economical and social conditions of people
living in a specific area as deciles with one representing the most disadvantaged and 10 the
most advantaged. Similarly, the residential postcode was mapped to the
Accessibility/Remoteness Index of Australia (ARIA) which provides a measure of geographic
remoteness bases on the road distance to service centres in with remoteness classified as one
of five groups; major metropolitan city, inner regional, outer regional, remote or very remote.
The covariates included in the model were those considered a priori to influence the outcomes
and those that have been shown in the past to be associated with each outcome. The
covariates were included in the segmented regression model in the same way as for standard
regression analyses. .
The segmented regression enabled estimation of the following:
i. Baseline trend - the change in outcome per time segment that occurred before the
Recovery model was implemented.
ii. Level of change after the Recovery model was introduced - the change in the outcome
immediately after implementation of the Recovery model.
iii. Trend change after the Recovery model was introduced - the change in outcome per bi-
monthly segment after the Recovery model was introduced compared to the overall
trend before the implementation of the Recovery model.
To provide a visual representation of the findings from the segmented regression models,
graphs showing the Pre-Recovery, at implementation, and Post-Recovery periods were
generated. These graphs show the slope of trend prior to implementation of the Recover
model, the change at the point of implementation, and the slope of trend after introduction of the
Recovery model. For these graphs, the baseline trend coefficient will be consistent with the
Pre-Recovery graph slope. As will the “Level of change” coefficient. However, the “Trend after
the Recovery model was introduced” coefficient takes into account the trend before Recovery
and the difference compared to the trend after Recovery to generate the coefficient. In contrast,

Research Report # Page 7 of 35
the Post-Recovery slope of the graph only shows the trend after the Recovery model was
introduced. Therefore, the direction of the coefficient for trend after the Recovery model was
introduced may not match the slope of the graph as the coefficient takes into account the Pre-
Recovery and the Post-Recovery trends to form a single coefficient of change.

Research Report # Page 8 of 35
4. Results
4.1 Brief profile of VOTOR TAC Recovery cases
Registration of VOTOR cases has been continuous at all four hospitals since March 2007 and
therefore, cases from this date were included. There were 7,210 VOTOR cases with a date of
injury from March 2007 to January 2014, flagged as TAC Recovery clients and successfully
linked. Of these, 7,210 cases, 3,205 (44.5%) met major trauma criteria. Table 1 shows the
demographic profile of VOTOR Recovery clients.
Table 1: Demographic profile of VOTOR Recovery clients (n=7,210)
Population descriptor
Age Mean (SD) years 42.4 (18.7)
Gender N (%)
Male
Female
4,820 (66.9)
2,390 (33.1)
Charlson Comorbidity Index weighting N (%)
None
1
>1
5,562 (77.1)
1,381 (19.2)
267 (3.7)
Index of Relative Socioeconomic Advantage and Disadvantage quintilea
N (%)
1 (Most disadvantaged)
2
3
4
5 (Least disadvantaged)
775 (11.0)
742 (10.5)
1,359 (19.3)
2,027 (28.8)
2,414 (30.4)
Geographic remotenessb N (%)
Major cities
Inner regional
Outer regional, remote and very remote
5,423 (77.0)
1,330 (18.9)
293 (4.1)
Level of educationc N (%)
University degree
Advanced diploma/diploma/certificate
Completed high school
Did not complete high school
1,238 (19.6)
1,880 (29.8)
1,042 (16.5)
2,143 (34.0)
Pre-injury work statusd N (%)
Not working
Working
1,756 (26.4)
4,908 (73.6)
Self-reported pre-injury disabilitye N (%)
None
Mild
Moderate/marked/severe
5,721 (86.4)
559 (8.4)
345 (5.2)
a Data missing for n=166 (2.3%); b Data missing for n=164 (2.3%); c Data missing/not yet collected for n=907 (12.6%); d Data missing/not yet collected for n=546 (7.6%); e Data missing/not yet collected for n=585 (8.1%);

Research Report # Page 9 of 35
Most VOTOR TAC Recovery clients were male, healthy and without disability prior to injury,
living in major cities, and working prior to injury. The proportion of clients living in the most
disadvantaged suburbs was low, despite half of the patient population reporting a high school
level of education or below (Table 1).
The predominant road user types were motor vehicle drivers or passengers, and motorcyclists.
More than 90 per cent were managed at The Alfred and Royal Melbourne Hospital, and isolated
lower extremity injuries and spinal injuries were most common (Table 2). The proportion with
associated chest or abdominal injuries was high, while 40 per cent were discharged to inpatient
rehabilitation (Table 2).
Table 2: Injury and in-hospital outcomes profile of VOTOR Recovery clients (n=7,210)
Population descriptor
Road user group N (%)
Motor vehicle
Motorcycle
Pedestrian
Pedal cyclist
Other
3,537 (49.1)
1,960 (27.2)
1,003 (14.0)
503 (7.0)
207 (2.9)
Hospital of definitive care N (%)
The Alfred
Royal Melbourne Hospital
University Hospital Geelong
The Northern Hospital
3,850 (53.4)
2,970 (41.2)
342 (4.7)
49 (0.7)
Orthopaedic injury group N (%)
Isolated lower extremity injury
Spinal column injuries
Isolated upper extremity injury
Multiple lower extremity injuries
Upper and lower extremity injuries
Spinal column and lower extremity injuries
Spinal column and upper extremity injuries
Spinal column, upper and lower extremity injuries
Multiple upper extremity injuries
Soft tissue injuries only
1,569 (21.8)
1,440 (20.0)
1,019 (14.1)
734 (10.2)
644 (8.9)
580 (8.0)
457 (6.3)
357 (4.9)
251 (3.5)
159 (2.2)
Associated non-orthopaedic injuries N (%) Head injury
N (%) Chest or abdominal injury
N (%) Other non-orthopaedic injur7\y
627 (8.8)
2,749 (38.1)
2,033 (28.2)
Hospital length of stay Median (IQR) days 5.5 (3.0-10.1)
Discharge destination N (%)
Home
Inpatient rehabilitation
Other
4,018 (55.7)
2,883 (40.0)
309 (4.3)

Research Report # Page 10 of 35
4.2 Impact of the implementation of the Recovery model on 6-month
outcomes
4.2.1 Summary of 6-month outcomes in the pre-Recovery and post-Recovery periods
Table 3 shows the 6-month post-injury patient-reported and cost outcomes of TAC VOTOR
clients before and after the implementation of the Recovery model. The EQ-5D models
included fewer cases as the EQ-5D was not added to the registry follow-up until 2009 (Table 3).
The proportion of VOTOR Recovery cases fully recovered, experiencing a good recovery,
returning to work, reporting moderate to severe persistent pain, mobility limitations, and anxiety
or depression problems were largely similar before and after introduction of the Recovery
model, as were the mean SF-12 summary scores and the EQ-5D summary score. The
proportion reporting problems with self-care and usual activities on the EQ-5D appeared to be
higher following the implementation of the Recovery model. The mean costs were similar
between the two phases (Table 3).
Table 3: Comparison of outcomes pre and post Recovery model at 6-months post-injury
N
Pre-Recovery
Outcome*
N (%)
N
Post-Recovery
Outcome
N (%)
Good recovery 2,687 840 (31.3) 3,229 994 (30.8)
Return to work** 1,964 1,209 (61.6) 2,283 1,377 (60.3)
Complete recovery 2,687 440 (16.4) 3,229 478 (14.8)
Moderate/severe persistent pain 2,132 627 (29.4) 2,605 695 (26.7)
EQ-5D mobility problems 1,171 562 (48.0) 3,205 1,501 (46.8)
EQ-5D self-care problems 1,167 227 (19.5) 3,201 780 (24.4)
EQ-5D usual activity problems 1,164 746 (64.1) 3,203 2,208 (68.9)
EQ-5D pain/discomfort 1,162 823 (70.8) 3,189 2,141 (67.1)
EQ-5D anxiety/depression 1,152 516 (44.8) 3,188 1,457 (45.7)
Mean (SD) Mean (SD)
PCS-12 2,084 38.9 (11.8) 2,484 38.3 (11.9)
MCS-12 2,084 49.0 (12.1) 2,484 50.1 (11.8)
EQ-5D summary score 1,136 0.63 (0.30) 3,168 0.65 (0.29)
Cost ($) 3,042 62,833 (58,570) 3,615 62,547 (57,595)
*Patients with a date of injury in the 6 months prior to the introduction of the Recovery model were excluded from the 6 month summary because their care would be a mixture of the old model and the Recovery model; ** If working prior to injury.

Research Report # Page 11 of 35
4.2.2 Summary of the findings from the segmented regression modelling at 6-months
The results of the segmented regression modelling to quantify the impact of the introduction of
the Recovery model on VOTOR client outcomes are summarised in Table 4. The baseline
period refers to before the introduction of Recovery model. For each outcome, the log odds of
the baseline trend was not significant, indicating stability in patient-reported outcomes and claim
costs in the period leading up to introduction of the Recovery model.
The “level change” provides an indication of the immediate impact of the Recovery model.
There was a no change in the log odds of most of the patient-reported outcomes at the
implementation phase of the Recovery model (Table 4). Return to work declined, and the log
odd of reporting problems on most of the EQ-5D items increased, at the point of implementation
of the Recovery model (Table 4).
The “trend change” after Recovery provides a measure of change in outcome per bi-monthly
segment after the Recovery model was introduced compared to the bi-monthly trend before the
implementation of the Recovery model. Put simply, this shows the trend in outcomes since the
model was introduced taking into account the Pre-Recovery trends. There was little evidence of
improvement in patient-reported outcomes after implementation of the Recovery model with
only the probability of reporting problems on the EQ-5D anxiety/depression item tracking
downwards (Table 4).

Research Report # Page 12 of 35
Table 4: Impact of the introduction of the Recovery model on 6-month outcomes – results from the multivariable* segmented regression
Outcome Baseline trend
Log-odds (95% CI)
p-value
Level change after Recovery
Log-odds (95% CI)
p-value Trend change after Recovery
Log-odds (95% CI)
p-value
Good recovery -0.01 (-0.02, 0.01) 0.47 -0.02 (-0.26, 0.22) 0.85 0.01 (-0.01, 0.03) 0.41
Complete recovery 0.001 (-0.02, 0.02) 0.92 0.08 (-0.21, 0.38) 0.59 -0.03 (-0.05, 0.003) 0.08
Return to work** 0.01 (-0.01, 0.03) 0.49 -0.30 (-0.57, -0.04) 0.03 0.01 (-0.02, 0.03) 0.61
Moderate/severe persistent pain -0.004 (-0.02, 0.02) 0.67 -0.02 (-0.30, 0.25) 0.86 -0.003 (-0.03, 0.02) 0.82
EQ-5D mobility limitations -0.04 (-0.10, 0.02) 0.24 0.28 (-0.02, 0.58) 0.07 0.02 (-0.04, 0.08) 0.55
EQ-5D self-care limitations 0.003 (-0.07, 0.07) 0.94 0.40 (0.07, 0.73) 0.02 -0.02 (-0.09, 0.06) 0.67
EQ-5D usual activity limitations 0.01 (-0.05, 0.07) 0.76 0.25 (-0.04, 0.53) 0.09 -0.01 (-0.07, 0.05) 0.68
EQ-5D pain/discomfort -0.05 (-0.11, 0.01) 0.08 0.30 (0.01, 0.60) 0.04 0.02 (-0.04, 0.09) 0.47
EQ-5D anxiety/depression 0.04 (-0.01, 0.10) 0.13 0.02 (-0.25, 0.29) 0.88 -0.05 (-0.11, 0.01) 0.07
Baseline trend
(95% CI)
Level change after Recovery
(95% CI)
Trend change after Recovery
(95% CI)
PCS-12 -0.02 (-0.11, 0.08) 0.75 -0.99 (-2.34, 0.35) 0.15 0.06 (-0.07, 0.18) 0.37
MCS-12 0.04 (-0.06, 0.14) 0.47 0.40 (-0.97, 1.77) 0.57 -0.03 (-0.16, 0.10) 0.64
EQ-5D summary score 0.004 (-0.004, 0.01) 0.34 -0.02 (-0.06, 0.02) 0.31 -0.002 (-0.01, 0.01) 0.69
Baseline trend
%a (95% CI)
Level change after Recovery
%b (95% CI)
Trend change after Recovery
%c (95% CI)
Cost ($) -0.02 (-0.6, 0.6) 0.95 -5.0 (-12.4, 3.0) 0.21 0.5 (-0.2, 1.3) 0.17
n.b. Patients with a date of injury 6 months prior to the introduction of the Recovery model were excluded from the analysis because their care would be a mixture of the old model and the Recovery model; *All analyses were adjusted for age, gender, road user group, injury group, head injury, chest or abdominal injury, other injury, comorbid status, pre-injury work status, pre-injury disability, geographic remoteness and socioeconomic status; a Percentage change in 6 month costs per 2 month interval; b Percentage change in 6 month costs immediately after Recovery was introduced; c Percentage change in trend after Recovery compared to percentage change before Recovery was introduced.

Research Report # Page 13 of 35
4.2.3 Impact of the Recovery model on functional outcomes at 6-months (GOS-E)
Figure 1 and Figure 2 represent the GOS-E good recovery and complete recovery outcomes for
VOTOR Reovery clients, respectively. There was a trend for reporting probability of a good
functional recovery prior to implementation of the Recovery model was stable, and little change
was observed at the point of implementation, and a stable rate of good recovery has been
observed since implementation of the new claims model (Figure 1). There was no evidence of a
change in the probability or reporting a good recovery following introduciton of the Recovery
model (Figure 1 and Table 4).
.15
.2.2
5.3
.35
.4.4
5
Oct/N
ov 2
007
Oct/N
ov 2
008
Oct/N
ov 2
009
Oct/N
ov 2
010
Oct/N
ov 2
011
Oct/N
ov 2
012
Oct/N
ov 2
013
Fitted modelBi-monthly proportion whomake good recovery
95% Confidence Interval
Pr(
Go
od
re
cove
ry a
t 6
mth
s)
n.b. graph refers to time post-injury rather than post claim lodgement
Figure 1: Impact of the Recovery model on functional outcomes (GOS-E good recovery)
at 6-months post-injury of VOTOR clients

Research Report # Page 14 of 35
Figure 2 shows stability in the probability of a complete functional recovery prior to the
introduction of the Recovery model, little change at the point of implementation, and a
downward trend since introduction of the Recovery model (Figure 2). The coefficient describing
the change in trend since the Recovery model was introduced is negative (Table 4), reflecting
the change from a largely flat slope to a downward slope when comparing the pre-Recovery and
post-Recovery periods (Figure 2). However, the downward trend since the implementation of
the Recovery model was not significnat (Table 4). Overall, the implementation of the Recovery
model appears to have had little impact on the functional outcomes of VOTOR Recovery clients.
0
.05
.1.1
5.2
.25
.3
Oct/N
ov 2
007
Oct/N
ov 2
008
Oct/N
ov 2
009
Oct/N
ov 2
010
Oct/N
ov 2
011
Oct/N
ov 2
012
Oct/N
ov 2
013
Fitted modelBi-monthly proportion whomake complete recovery
95% Confidence Interval
Pr(
Com
ple
te r
eco
very
at
6 m
ths)
n.b. graph refers to time post-injury rather than post claim lodgement
Figure 2: Impact of the Recovery model on functional outcomes (GOS-E complete
recovery) at 6-months post-injury of VOTOR clients

Research Report # Page 15 of 35
4.2.4 Impact of the Recovery model on return to work outcomes at 6-months
The probability of return to work was stable prior to introduction of the Recovery model, followed
by a significant decline at the point of implementation and a general upward trend in return to
work since the Recovery model was implemented (Table 4 and Figure 3).
.45
.5.5
5.6
.65
.7.7
5
Oct/N
ov 2
007
Oct/N
ov 2
008
Oct/N
ov 2
009
Oct/N
ov 2
010
Oct/N
ov 2
011
Oct/N
ov 2
012
Oct/N
ov 2
013
Fitted modelBi-monthly proportion whoreturn to work
95% Confidence Interval
Pr(
Retu
rn t
o w
ork
at
6 m
ths)
n.b. graph refers to time post-injury rather than post claim lodgement
Figure 3: Impact of the Recovery model on return to work at 6-months post-injury of
VOTOR clients

Research Report # Page 16 of 35
4.2.5 Impact of the Recovery model on reporting moderate to severe pain at 6-months
The probability of VOTOR TAC clients reporting moderate to severe persistent pain at 6-months
was largely stable prior to the implementation of the Recovery model, did not change at the
point of implementation and has been largely stable since the introduction of the Recovery
model (Table 4 and Figure 4).
.15
.2.2
5.3
.35
.4.4
5
Oct/N
ov 2
007
Oct/N
ov 2
008
Oct/N
ov 2
009
Oct/N
ov 2
010
Oct/N
ov 2
011
Oct/N
ov 2
012
Oct/N
ov 2
013
Fitted modelBi-monthly proportion withmoderate/severe pain
95% Confidence Interval
Pr(
Mod
era
te/s
eve
re p
ain
at
6 m
ths)
n.b. graph refers to time post-injury rather than post claim lodgement
Figure 4: Impact of the Recovery model on reporting moderate to severe persistent pain
at 6-months post-injury of VOTOR clients

Research Report # Page 17 of 35
4.2.6 Impact of the Recovery model on EQ-5D outcomes at 6-months
There was a non-significant decline in the probability of reporting mobility problems prior to
introduction of the Recovery model, followed by a small increase at the point of implementation,
and a continuing decline since the introduction of the Recovery model (Figure 5). The decline
since the change in claims model was not significant as this pattern was consistent with the
period prior to implementation (Table 4 and Figure 5).
.3.3
5.4
.45
.5.5
5.6
Oct/N
ov 2
008
Oct/N
ov 2
009
Oct/N
ov 2
010
Oct/N
ov 2
011
Oct/N
ov 2
012
Oct/N
ov 2
013
Fitted modelBi-monthly proportionwith some mobility problems
95% Confidence Interval
Pr(
Som
e m
ob
ility
pro
ble
ms a
t 6 m
ths)
Figure 5: Impact of the Recovery model on reporting problems with mobility on the EQ-
5D at 6-months post-injury of VOTOR clients

Research Report # Page 18 of 35
Similar to the mobility item of the EQ-5D, the probability of reporting problems on the EQ-5D
self-care item at 6-months was stable prior to Recovery model implementation, increased
significantly at the point of implementation and has shown a non-significant decline since
(Figure 6 and Table 4).
.05
.1.1
5.2
.25
.3.3
5
Oct/N
ov 2
008
Oct/N
ov 2
009
Oct/N
ov 2
010
Oct/N
ov 2
011
Oct/N
ov 2
012
Oct/N
ov 2
013
Fitted modelBi-monthly proportionexperiencing problemswith self-care
95% Confidence Interval
Pr(
Pro
ble
ms w
ith s
elf-c
are
at
6 m
ths)
Figure 6: Impact of the Recovery model on reporting problems with self-care on the EQ-
5D at 6-months post-injury of VOTOR clients

Research Report # Page 19 of 35
The probability of reporting problems on the EQ-5D usual activities item at 6-months was stable
to Recovery model implementation, increased marginally at the point of implementation and has
been showing a stable trend since (Figure 7 and Table 4).
.5.5
5.6
.65
.7.7
5.8
Oct/N
ov 2
008
Oct/N
ov 2
009
Oct/N
ov 2
010
Oct/N
ov 2
011
Oct/N
ov 2
012
Oct/N
ov 2
013
Fitted modelBi-monthly proportionexperiencing problemswith usual activities
95% Confidence Interval
Pr(
Pro
ble
ms w
ith u
su
al a
ctivitie
s a
t 6 m
ths)
Figure 7: Impact of the Recovery model on reporting problems with usual activities on
the EQ-5D at 6-months post-injury of VOTOR clients

Research Report # Page 20 of 35
The probability of reporting problems on the EQ-5D pain or discomfort item at 6-months was
declining prior to Recovery model implementation, increased at the point of implementation and
has been showing a strong downward trend since. However, as the slope “before” indicated a
decline in the probability of reporting pain or discomfort and the slope afterwards is showing a
not dissimilar gradient of slope, the post-Recovery model implementation improvement is not
significant (Figure 8 and Table 4). This indicates that the introduction of the Recovery model is
unlikely to explain the improvement observed.
.5.5
5.6
.65
.7.7
5.8
.85
Oct/N
ov 2
008
Oct/N
ov 2
009
Oct/N
ov 2
010
Oct/N
ov 2
011
Oct/N
ov 2
012
Oct/N
ov 2
013
Fitted modelBi-monthly proportionexperiencing problemswith pain/discomfort
95% Confidence Interval
Pr(
Pro
ble
ms w
ith p
ain
/dis
com
fort
at
6 m
ths)
Figure 8: Impact of the Recovery model on reporting problems with pain or discomfort on
the EQ-5D at 6-months post-injury of VOTOR and VSTR clients

Research Report # Page 21 of 35
The probability of reporting problems on the EQ-5D anxiety or depression item at 6-months was
increasing marginally prior to Recovery model implementation, relatively stable at the point of
implementation and has been shown towards improved outcomes on this items since, as
evidenced by the downward slope in the post-Recovery phase and a p-value approaching
significance (Table 4 and Figure 9).
.3.3
5.4
.45
.5.5
5.6
Oct/N
ov 2
008
Oct/N
ov 2
009
Oct/N
ov 2
010
Oct/N
ov 2
011
Oct/N
ov 2
012
Oct/N
ov 2
013
Fitted modelBi-monthly proportionexperiencing problemswith anxiety/depression
95% Confidence Interval
Pr(
Pro
ble
ms w
ith a
nxie
ty a
t 6 m
ths)
Figure 9: Impact of the Recovery model on reporting problems with anxiety or
depression on the EQ-5D at 6-months post-injury of VOTOR and VSTR clients

Research Report # Page 22 of 35
The figure for the EQ-5D summary score at 6-months post-injury is provided as Figure 10, and
shows a stable trend of mild improvement over time prior to the introduction of the Recovery
model, little change at the point of implementation, and continuation of the pre-Recovery pattern
after implementation of the Recovery model. There is no evidence that the Recovery model has
improved EQ-5D utility scores (Table 4 and Figure 10).
.45
.5.5
5.6
.65
.7.7
5
Oct/N
ov 2
008
Oct/N
ov 2
009
Oct/N
ov 2
010
Oct/N
ov 2
011
Oct/N
ov 2
012
Oct/N
ov 2
013
Fitted modelBi-monthly meanEQ-5D summary score
95% Confidence Interval
EQ
-5D
Su
mm
ary
sco
re a
t 6
mth
s
n.b. graph refers to time post-injury rather than post claim lodgement
Figure 10: Impact of the Recovery model on the EQ-5D summary score at 6-months post-
injury of VOTOR clients

Research Report # Page 23 of 35
4.2.7 Impact of the Recovery model on SF-12 outcomes at 6-months
Figure 11 shows the trend in mean PCS-12 scores at 6-months post-injury before and after
implementation of the Recovery model. Mean PCS-12 scores were stable prior to
implementation, unchanged at implementation and stable since the implementation of the
Recovery model (Figure 11 and Table 4).
30
35
40
45
50
Oct/N
ov 2
007
Oct/N
ov 2
008
Oct/N
ov 2
009
Oct/N
ov 2
010
Oct/N
ov 2
011
Oct/N
ov 2
012
Oct/N
ov 2
013
Fitted modelBi-monthly meanPCS-12
95% Confidence Interval
PC
S-1
2 a
t 6
mth
s
n.b. graph refers to time post-injury rather than post claim lodgement
Figure 11: Impact of the Recovery model on physical health at 6-months post-injury of
VOTOR clients

Research Report # Page 24 of 35
Consistent with the PCS-12 findings, there was no evidence that the Recovery model has
impacted on MCS-12 scores in the VOTOR population (Table 4 and Figure 12). 40
45
50
55
60
Oct/N
ov 2
007
Oct/N
ov 2
008
Oct/N
ov 2
009
Oct/N
ov 2
010
Oct/N
ov 2
011
Oct/N
ov 2
012
Oct/N
ov 2
013
Fitted modelBi-monthly meanMCS-12
95% Confidence Interval
MC
S-1
2 a
t 6
mth
s
n.b. graph refers to time post-injury rather than post claim lodgement
Figure 12: Impact of the Recovery model on mental health at 6-months post-injury of
VOTOR clients

Research Report # Page 25 of 35
4.2.8 Impact of the Recovery model on total TAC claim costs at 6-months
The result of the segmented regression modelling for modelling 6-month claim costs is shown in
Figure 13. Before implementation of the Recovery model, claim costs were stable. At the point
of implementation of the Recovery model, there was evidence of a marginal drop in claim costs
(Table 4). Since introduction of the Recovery model, claim costs appear to be increasing
though the increase is not significant (Figure 13 and Table 4).
30
00
040
00
050
00
0
Oct/N
ov 2
007
Oct/N
ov 2
008
Oct/N
ov 2
009
Oct/N
ov 2
010
Oct/N
ov 2
011
Oct/N
ov 2
012
Oct/N
ov 2
013
Fitted modelBi-monthly geometric meanCosts($)
95% Confidence Interval
Co
sts
($)
at
6 m
ths
n.b. graph refers to time post-injury rather than post claim lodgement
Figure 13: Impact of the Recovery model on 6-month post-injury claim costs for VOTOR
clients

Research Report # Page 26 of 35
4.3 Impact of the implementation of the Recovery model on 12-month
outcomes
4.3.1 Summary of 12-month outcomes in the pre-Recovery and post-Recovery periods
Table 4 shows the outcomes at 12-months post-injury the Pre-Recovery and Post-Recovery
groups. Again, there was consistency in patient-reported and 12-month claim cost outcomes
when simply comparing the cases before the Recovery model was implemented with the cases
since the Recovery model was implemented (Table 5). The EQ-5D was excluded from the 12-
month outcomes assessment due to low numbers of patients in the pre-Recovery timeframe
related to the late inclusion of this outcome measure in the VOTOR follow-up protocol.
Table 5: Comparison of outcomes pre and post Recovery model at 12-months
N
Pre-Recovery Outcome*
N (%)
N
Post-Recovery Outcome
N (%)
Good recovery 2,194 821 (37.4) 3,158 1,153 (36.5)
Return to work** 1,630 1,110 (68.1) 2,245 1,548 (69.0)
Complete recovery 2,194 429 (19.6) 3,158 610 (19.3)
Moderate/severe persistent pain 1,701 450 (26.5) 2,457 643 (26.2)
Mean (SD) Mean (SD)
PCS-12 1,671 40.8 (11.9) 2,390 40.4 (12.3)
MCS-12 1,671 48.8 (11.7) 2,390 49.7 (11.9)
Cost ($) 2,511 72,993 (69,472) 3,097 73,622 (68,824)
* Similarly patients with a date of injury in the 12 months prior to the introduction of the Recovery model are excluded from the 12 month summary; ** If working prior to injury.
4.3.2 Summary of the findings from the segmented regression modelling at 12-months
The results of the multivariable segmented regression modelling to quantify the impact of the
introduction of the Recovery model on 12-month outcomes of VOTOR clients are summarised in
Table 6. The baseline period refers to before the introduction of Recovery model. The log odds
of the baseline trend showed stability in all studied outcomes (Table 6). At the point of
implementation, there was a significant increase in the log-odds of reporting a complete
recovery on the GOS-E, and a near significant 8 per cent reduction in claims costs. Compared
to the pre-Recovery phase, the post-Recovery probability of reporting moderate to severe
persistent pain declined, while the total claim costs showed a significant increase (Table 6).

Research Report # Page 27 of 35
Table 6: Impact of the introduction of the Recovery model on 12-month outcomes – results from the multivariable* segmented regression
Outcome Baseline trend
Log-odds (95% CI)
p-value Level change after Recovery
Log-odds (95% CI)
p-value Trend change after Recovery
Log-odds (95% CI)
p-value
Good recovery -0.02 (-0.04, -0.003) 0.12 0.02 (-0.22, 0.26) 0.88 0.02 (-0.01, 0.05) 0.15
Complete recovery -0.01 (-0.04, 0.01) 0.33 0.32 (0.03, 0.61) 0.03 -0.01 (-0.04, 0.02) 0.59
Return to work** 0.01 (-0.02, 0.04) 0.53 -0.13 (-0.42, 0.16) 0.61 0.001 (-0.03, 0.03) 0.94
Moderate/severe persistent pain 0.02 (-0.01, 0.05) 0.13 0.03 (-0.26, 0.33) 0.83 -0.04 (-0.07, -0.01) 0.02
Baseline trend
(95% CI)
Level change after Recovery
(95% CI)
Trend change after Recovery
(95% CI)
PCS-12 -0.08 (-0.22, 0.05) 0.21 -0.77 (-2.20, 0.67) 0.29 0.16 (0.01, 0.32) 0.04
MCS-12 -0.001 (-0.13, 0.13) 0.99 0.55 (-0.89, 1.98) 0.46 -0.01 (-0.16, 0.15) 0.93
Baseline trenda
(95% CI)
Level change after Recoveryb
(95% CI)
Trend change after Recoveryc
(95% CI)
Cost ($) -0.1 [-0.9, 0.7] 0.89 -8.0 [-16.3, 1.1] 0.08 1.1 [0.1, 2.2] 0.04
n.b. Patients with a date of injury 12 months prior to the introduction of the Recovery model were excluded from the analysis because their care would be a mixture of the old model and the Recovery model; *All analyses were adjusted for age, gender, road user group, injury group, head injury, chest or abdominal injury, other injury, comorbid status, pre-injury work status, geographic remoteness and socioeconomic status; a Percentage change in 12 month costs per 2 month interval; b
Percentage change in 12 month costs immediately after Recovery was introduced; c Percentage change in trend after Recovery compared to percentage change before Recovery was introduced.

Research Report # Page 28 of 35
4.3.3 Impact of the Recovery model on functional outcomes at 12-months (GOS-E)
Figure 14 and Figure 15 represent the GOS-E good recovery and complete recovery outcomes at
12-months, respectively. There was a trend for declining probability of a good functional recovery
prior to implementation of the Recovery model, slight improvment at the point of implementation
and then a stablisation of the probability of reporting a good recovery after the Recovery model
introduction (Figure 14 and Table 6).
.2.2
5.3
.35
.4.4
5.5
Oct/N
ov 2
007
Oct/N
ov 2
008
Oct/N
ov 2
009
Oct/N
ov 2
010
Oct/N
ov 2
011
Oct/N
ov 2
012
Oct/N
ov 2
013
Fitted modelBi-monthly proportion whomake good recovery
95% Confidence Interval
Pr(
Go
od
re
cove
ry a
t 1
2 m
ths)
n.b. graph refers to time post-injury rather than post claim lodgement
Figure 14: Impact of the Recovery model on functional outcomes (GOS-E good recovery) at
12-months post-injury of VOTOR clients

Research Report # Page 29 of 35
Figure 15 shows a slight improvement in the probability of a complete functional recovery at 12-
months prior to the introduction of the Recovery model, a small improvement at the point of
implementation, and a generalised downward trend since introduction of the Recovery model
(Figure 15). However, there was no evidence of significant impact of the Recovery model on
reporting a complete functional recovery at 12-months (Table 6).
.05
.1.1
5.2
.25
.3.3
5
Oct/N
ov 2
007
Oct/N
ov 2
008
Oct/N
ov 2
009
Oct/N
ov 2
010
Oct/N
ov 2
011
Oct/N
ov 2
012
Oct/N
ov 2
013
Fitted modelBi-monthly proportion whomake complete recovery
95% Confidence Interval
Pr(
Com
ple
te r
eco
very
at
12
mth
s)
n.b. graph refers to time post-injury rather than post claim lodgement
Figure 15: Impact of the Recovery model on functional outcomes (GOS-E complete
recovery) at 12-months post-injury of VOTOR clients

Research Report # Page 30 of 35
4.3.4 Impact of the Recovery model on return to work at 12-months
There appears to be little evidence of an impact on 12-month return to work rates for VOTOR
clients following implementation of the Recovery model (Table 6 and Figure 16). The rate of return
to work appeared to be improving prior to Recovery model implementation, decreased marginally
at the point of implementation and then has shown a slight upward trajectory since implementation
of the Recovery model (Figure 16). However, these trends were not significant (Table 6).
.55
.6.6
5.7
.75
.8.8
5
Oct/N
ov 2
007
Oct/N
ov 2
008
Oct/N
ov 2
009
Oct/N
ov 2
010
Oct/N
ov 2
011
Oct/N
ov 2
012
Oct/N
ov 2
013
Fitted modelBi-monthly proportion whoreturn to work
95% Confidence Interval
Pr(
Retu
rn t
o w
ork
at
12
mth
s)
n.b. graph refers to time post-injury rather than post claim lodgement
Figure 16: Impact of the Recovery model on return to work at 12-months post-injury of
VOTOR clients

Research Report # Page 31 of 35
4.3.5 Impact of the Recovery model on reporting moderate to severe pain at 12-months
The probability of reporting moderate to severe persistent pain at 12-months was stable prior to the
implementation of the Recovery model, changed little at the point of implementation, and has
shown a significant decline (i.e. less pain) since implementation of the Recovery model (Figure 17
and Table 6).
.1.1
5.2
.25
.3.3
5.4
Oct/N
ov 2
007
Oct/N
ov 2
008
Oct/N
ov 2
009
Oct/N
ov 2
010
Oct/N
ov 2
011
Oct/N
ov 2
012
Oct/N
ov 2
013
Fitted modelBi-monthly proportion withmoderate/severe pain
95% Confidence Interval
Pr(
Mod
era
te/s
eve
re p
ain
at
12 m
ths)
n.b. graph refers to time post-injury rather than post claim lodgement
Figure 17: Impact of the Recovery model on reporting moderate to severe persistent pain at
12-months post-injury of VOTOR and VSTR clients

Research Report # Page 32 of 35
4.2.6 Impact of the Recovery model on SF-12 outcomes at 12-months
The figure for the PCS-12 scores at 12-months post-injury is provided as Figure 18. Physical
health scores were declining marginally prior to the Recovery model implementation, did not
change at the point of implementation and have shown a significant upward trend (i.e. improved
physical health) since the introduction of the Recovery model (Table 6 and Figure 18).
30
35
40
45
50
Oct/N
ov 2
007
Oct/N
ov 2
008
Oct/N
ov 2
009
Oct/N
ov 2
010
Oct/N
ov 2
011
Oct/N
ov 2
012
Oct/N
ov 2
013
Fitted modelBi-monthly meanPCS-12
95% Confidence Interval
PC
S-1
2 a
t 1
2 m
ths
n.b. graph refers to time post-injury rather than post claim lodgement
Figure 18: Impact of the Recovery model on physical health at 12-months post-injury of
VOTOR clients

Research Report # Page 33 of 35
The figure for the MCS-12 scores at 12-months post-injury is provided as Figure 19. There is no
evidence of a change in mental health scores at 12-months following implementation of the
Recovery model (Figure 19 and Table 6). 40
45
50
55
60
Oct/N
ov 2
007
Oct/N
ov 2
008
Oct/N
ov 2
009
Oct/N
ov 2
010
Oct/N
ov 2
011
Oct/N
ov 2
012
Oct/N
ov 2
013
Fitted modelBi-monthly meanMCS-12
95% Confidence Interval
MC
S-1
2 a
t 1
2 m
ths
n.b. graph refers to time post-injury rather than post claim lodgement
Figure 19: Impact of the Recovery model on mental health at 12-months post-injury of
VOTOR clients
Research Report # Page 34 of 35
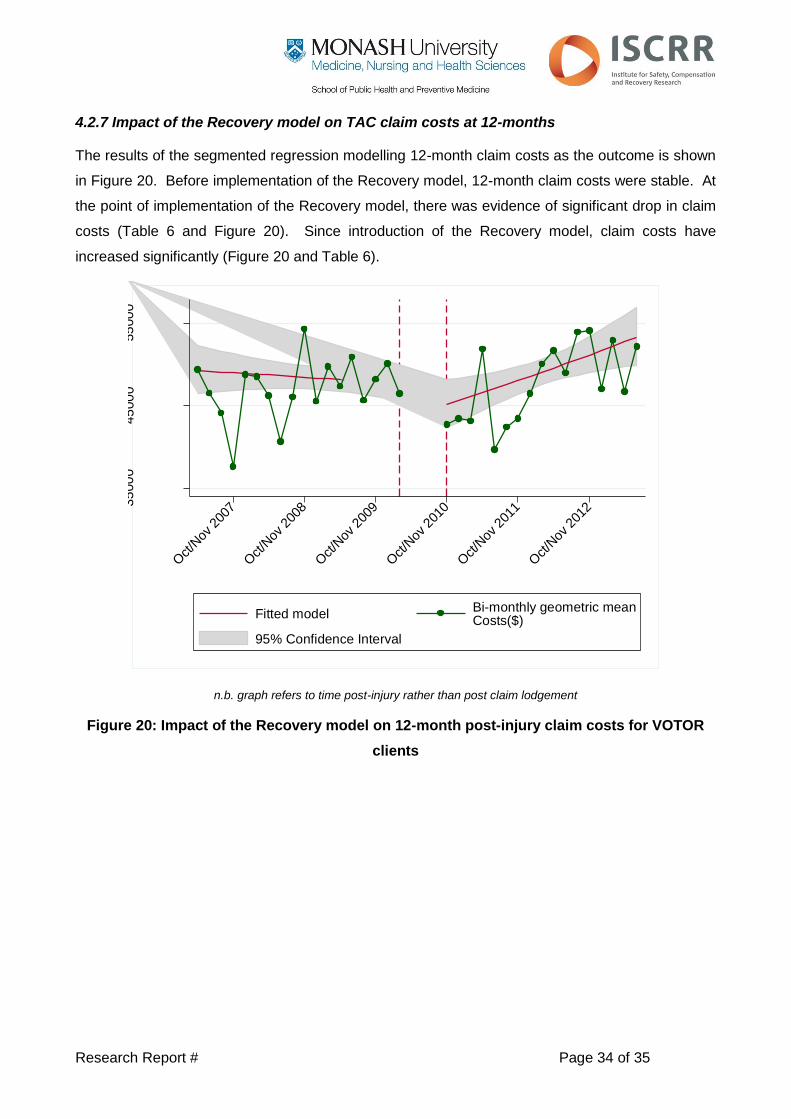
4.2.7 Impact of the Recovery model on TAC claim costs at 12-months
The results of the segmented regression modelling 12-month claim costs as the outcome is shown
in Figure 20. Before implementation of the Recovery model, 12-month claim costs were stable. At
the point of implementation of the Recovery model, there was evidence of significant drop in claim
costs (Table 6 and Figure 20). Since introduction of the Recovery model, claim costs have
increased significantly (Figure 20 and Table 6).
35
00
045
00
055
00
0
Oct/N
ov 2
007
Oct/N
ov 2
008
Oct/N
ov 2
009
Oct/N
ov 2
010
Oct/N
ov 2
011
Oct/N
ov 2
012
Fitted modelBi-monthly geometric meanCosts($)
95% Confidence Interval
Co
sts
($)
at
12
mth
s
n.b. graph refers to time post-injury rather than post claim lodgement
Figure 20: Impact of the Recovery model on 12-month post-injury claim costs for VOTOR
clients

Research Report # Page 35 of 35
5. Summary of findings
The analyses presented in this report provide an updated, and extended, analysis of the impact of
the Recovery model presented in Research Report # 0213-007-R4C and Research Report # 0214-
007-R6. The updated linkage allowed a final analysis of the impact of the initial implementation of
the Recovery model. Overall, there is little consistent evidence that the Recovery model has
improved patient-reported outcomes for hospitalised orthopaedic trauma patients, particularly at 6-
months post-injury. At 12-months post-injury, there was evidence that the probability of reporting
moderate to severe pain has decreased since the model was introduced, and physical health
scores have improved. However, the introduction of the Recovery model was associated with
increased claim costs at 12-months.
Through discussion with key TAC personnel, the largely null findings are consistent with internal
assessments and the conclusion was that initiatives introduced as part of the Recovery model
were not expected to impact on client outcomes. A focus of the Recovery model was the capacity
to segment clients into streams of claim management based on the complexity of their needs or
circumstances, with the segmentation largely focused on the risk of lodging a common law claim.
Recovery Branch processes changed considerably since the implementation of the model, making
it difficult to evaluate as a single intervention. Most importantly, the introduction of mental health
screening and other interventions were not introduced during the evaluation timeframe, limiting the
capacity to impact on client outcomes.
6. Implications for the TAC
The analyses presented in this report support internal TAC assessments of the impact of the
Recovery model on client outcomes. There has been no clear or consistent improvement in client
outcomes following implementation of the Recovery model. The initiatives that should be expected
to impact demonstrably on client outcomes were implemented in late 2013 and early 2014 (e.g.
First Service and Mental Health screening should provide demonstrable improvements in client
outcomes and can be assessed in future analyses.